one year report - new york city · vision zero year one report header 1 one year report ... and the...
TRANSCRIPT

HEADERVISION ZERO YEAR ONE REPORT 1
ONE YEAR REPORTApril 2015

HEADERVISION ZERO YEAR ONE REPORT 2
Report developed by the New York City Mayor’s Office of Operations

VISION ZERO YEAR ONE REPORT 3
Table of Contents5 Letter from the Mayor7 Executive Summary 11 By the Numbers13 Traffic Fatalities in 201418 Vision Zero Year One Timeline20 Vision Zero Legislation
23 Year One: Safer Street Design26 Year One: Before and After29 Safer Street Design: The Road Ahead32 Vision Zero Great Streets34 Biking Spotlight
36 Year One: Enforcement42 Enforcement: The Road Ahead44 Large Vehicle Safety46 25 MPH Outreach
48 Year One: Safer Taxi and For-Hire Vehicles52 Safer Taxi and For-Hire Vehicles: The Road Ahead53 Vision Zero and Increasing Accessibility 54 Embracing Data-Driven Solutions
56 Year One: Public Engagement, Education, and Outreach 64 Public Engagement, Education, and Outreach: The Road Ahead65 Vision Zero Nationwide
66 Year One: City Fleet 69 City Fleet: The Road Ahead
71 Vision Zero Year Two Initiatives
Appendix
76 Year One Scorecard80 Year Two Scorecard83 Glossary 86 Helpful Links 87 Task Force Members

HEADERVISION ZERO YEAR ONE REPORT 4
Mayor Bill de Blasio signs new Vision Zero legislation into law.

VISION ZERO YEAR ONE REPORT 5
Letter from the MayorDear Friends,
Since the earliest days of this administration, we have embraced “Vision Zero” – the belief that any loss of life on our city streets is unacceptable. New Yorkers deserve streets and sidewalks that are safe.
Communities across New York have come together to address this challenge. Along with elected officials, community leaders, the New York City Department of Transportation and the New York City Police Department, New Yorkers have shared concerns, recommended changes and learned together how to be more conscious – and conscientious – street users.
The City has lowered the speed limit, improved street designs across the five boroughs, cracked down on dangerous driving, engaged for-hire drivers and the City fleet, and sparked a citywide dialogue around street safety. Pedestrian fatalities on City streets are at their lowest levels since 1910, but this is only the beginning.
In 2015, the City is redoubling its efforts. We will pursue new initiatives to transform dangerous corridors that divide neighborhoods into “Vision Zero Great Streets,” implement new policies to reduce fatalities from trucks, buses, and other large vehicles, continue to improve the safety of the City fleet, and accelerate our efforts to make bicycling safer and more convenient.
Together, we can save lives.
Bill de BlasioMayor
Crashes are
preventable and
together we can
save lives.

HEADERVISION ZERO YEAR ONE REPORT 6
A local resident identifies safety issues at a Vision Zero public workshop.

VISION ZERO YEAR ONE REPORT 7EXECUTIVE SUMMARY
Executive Summary
To that end, the City has improved street design, lowered the speed limit, cracked down on dangerous driving, engaged for-hire drivers and the City fleet, and sparked a citywide dialogue around street safety.
Pedestrian fatalities on City streets are at their lowest levels since 1910, but there is still work left to be done.
In 2015, the City will redouble its efforts. They will include new initiatives to make the dangerous wide roads that cut through neighborhoods safer, reduce fatalities from trucks, buses, and other large vehicles, improve the safety of the City fleet, and make navigating New York City on a bicycle safer and more convenient.
The year 2014 marked the beginning of a new chapter for New York City. Motivated by a series of tragic fatalities, the City committed to Vision Zero: the simple premise that death and serious injury on its streets is not inevitable, and that deadly traffic crashes can, and must, be prevented.
25 MPH: A Lower Speed Limit for a Safer City
In 2014, the City, after working with State legislators to pass authorizing legislation, took a major step to improve safety on City streets. In October, Mayor de Blasio signed local legislation reducing the default speed limit in New York City streets from 30 to 25 miles per hour. People hit by a car going 25 MPH are half as likely to die as those hit by a car going 30 MPH.
A New Dialogue Around Street Safety
Together with elected officials, community activists, and grieving families, the City worked to create a new dialogue about safety, raising public expectations about safe behavior on City streets. The 28 Vision Zero town halls and public workshops attracted standing-room-only crowds, where thousands of New
In 2014, the City committed to the simple idea: that no level of death or serious injuries on its streets is acceptable.

VISION ZERO YEAR ONE REPORT 8EXECUTIVE SUMMARY
Yorkers participated in a dialogue about safety. Using an interactive Vision Zero Input Map, the public submitted more than 10,000 comments concerning traffic safety. This community input, along with a detailed analysis of fatality and serious injury data, helped inform the new Borough Pedestrian Safety Action Plans, which will provide the basis for the Department of Transportation (DOT) street safety design improvements and assist the New York Police Department (NYPD) with enforcement priorities for years to come.
Safer Streets by Design
The City accelerated its efforts to improve the design of dangerous corridors and intersections. Across City neighborhoods, New Yorkers can see these safety improvements taking shape. In 2014, DOT improved the design of more than 50 intersections and corridors by including more pedestrian space, clarifying lane markings, reducing crossing distances, and installing new protected bicycle paths. DOT also retimed signals and reduced speeds along large roads as part of the “Arterial Slow Zone” program, and installed more than 400 speed bump in residential neighborhoods across the City.
Cracking Down on Dangerous Driving
In 2014, the City increased accountability for people driving dangerously on New York streets. NYPD increased its vigilance against the most dangerous driving violations, in particular speeding and failing to yield. Summonses for speeding increased more than 42%, and failure-to-yield summonses increased more than 125% since 2013. In partnership with the City Council and the State Legislature, the administration increased penalties for dangerous driving and increased the number of speed cameras authorized for use in school zones across the City to 140. The Taxi and Limousine Commission (TLC) launched a new Safety Squad, focusing on enforcing traffic infractions by TLC-licensed vehicles, including taxis, livery cabs, black cars, and commuter vans. The City has expanded its technological enforcement capabilities, with both the NYPD and the TLC Safety Squad using top-of-the-line speed detection LIDAR guns.
Educating for Safer Street Use and Celebrating Safer Driving
The City created new public campaigns highlighting the danger that reckless driving poses to all New Yorkers. The City greatly expanded the number of schools and senior centers receiving street safety education. TLC outreach to professional taxi and for-hire vehicle drivers enhanced the traffic safety training

VISION ZERO YEAR ONE REPORT 9EXECUTIVE SUMMARY
provided to drivers. Vision Zero street teams worked in all five boroughs to educate people on street safety changes in their neighborhoods. This year TLC announced its first honor roll of safe drivers. This program commends 295 drivers who have outstanding records of safe driving over many years and millions of miles behind the wheel, demonstrating the City’s emphasis on safety and encouraging all drivers to keep safety in mind while on the road.
Leading by Example with a Safer City Fleet
The City is ensuring its own drivers are models for safety. The Department of Citywide Administrative Services (DCAS) is installing CANceiver devices—which monitor speed and braking patterns—on City vehicles in order to inform new safety policies across agencies and encourage safer driving by City employees. DCAS also initiated a pilot of rear wheel side guards.
Tracking Vision Zero Progress
The City is devoted to tracking its progress towards Vision Zero with transparency and care. In 2014, the City increased the availability of traffic fatality data and launched Vision Zero View. This map helps the Vision Zero team apply a data-driven approach to enforcement and focus on improving areas that are vulnerable to injuries and crashes. It aggregates years of fatality and injury data and overlays the locations of various City interventions and initiatives, including street design changes, speed bumps, slow zones, town hall meetings and schools with safety outreach programming. Vision Zero View also summarizes the data by precinct, community board, and City Council district.
The Department of Health and Mental Hygiene (DOHMH) has incorporated additional traffic fatality and injury hospitalization data into its Environmental and Health data portal and partnered with local researchers to expand research into improving street safety.
The following pages detail the progress that the City has made across all Vision Zero initiatives and lay out the critical work that remains to reduce death and serious injury on City streets.

HEADERVISION ZERO YEAR ONE REPORT 10
These streets are now safer by design. We are putting every tool we have—engineering, enforcement and education—to use in reaching Vision Zero.

VISION ZERO YEAR ONE REPORT 11
620Schools Received Street Safety Education
50Citywide Public Events
226LIDAR Guns Purchased
400Speed Bumps Installed
113Speed Boards Deployed
120Additional Speed Cameras Authorized
57Safety Projects at Intersections and Corridors
15,306CANceivers Installed
27Arterial Slow Zones Created
25New Default Speed Limit
BY THE NUMBERS

HEADERVISION ZERO YEAR ONE REPORT 12

VISION ZERO YEAR ONE REPORT 13TRAFFIC FATALITIES IN 2014
YEAR ONE
Traffic Fatalities in 2014: Statistics and Metrics
The Mayor set an ambitious goal of eliminating all traffic fatalities.
At each Vision Zero Task Force meeting, the task force reviews the most recent crash data in order to gauge the City’s progress towards its goal. Each fatal crash averted means that there are families that will not have to feel the pain and grief that comes with a sudden loss. Each life lost on City streets is an occasion to reflect on the urgency of the goal.
Trends reveal themselves slowly in a field as challenging as traffic safety, especially in an environment as complex as New York City. Therefore the City must be cautious not to draw conclusions too hastily.
The first year of the Vision Zero initiative is off to a promising start. The charts below summarize Year One, when Vision Zero was getting started, and provide comparisons to prior years. The City will continue to refine its strategies and develop new tactics in order to accelerate its progress towards its goal of eliminating fatalities and serious injuries on City streets.
Pedestrian Fatalities
2014 was the safest year for pedestrians in New York City’s history and one of the safest years for all New Yorkers since record keeping began in 1910.
Total Fatalities
Pedestrian Fatalities
YEAR
NU
MB
ER
OF
FATA
LITI
ES
Source: NYC DOT & NYPD

VISION ZERO YEAR ONE REPORT 14TRAFFIC FATALITIES IN 2014
Pedestrians
In 2013, 180 pedestrians lost their lives in traffic crashes. In 2014, 138 pedestrians lost their lives. The total number of pedestrian fatalities in 2014 is below the average of 155 in the three previous years. In fact, the first year of Vision Zero was the safest for pedestrians in the City’s history. The challenge ahead is to maintain and accelerate this progress in the coming years, as recent history indicates that these safety gains cannot be taken for granted. The City is focused on reducing failure to yield and speeding crashes in order to keep pedestrians safe.
Bicyclists
In 2013, 12 bicyclists lost their lives in traffic crashes. In 2014, 20 bicyclists lost their lives, in line with the average of previous years. In order to make cycling safer, the City will add 50 miles of bike facilities in 2015, including 5 miles of protected bike paths. High quality bike paths also encourage new bicyclists, which is important because City history indicates that New Yorkers who bike are safer when more New Yorkers bike. Since 2000, the period shown in this graph, those biking quadrupled in New York City, meaning that the hundreds of thousands of New Yorkers who bike regularly are much safer.
YEAR
YEAR
NU
MB
ER
OF
PE
DE
STR
IAN
FAT
ALI
TIE
SN
UM
BE
R O
F B
ICY
CLI
ST
FATA
LITI
ES
Source: NYC DOT & NYPD
Source: NYC DOT & NYPD

VISION ZERO YEAR ONE REPORT 15TRAFFIC FATALITIES IN 2014
Motorcyclists
In 2013, 42 motorcyclists lost their lives in traffic crashes. In 2014, 37 motorcyclists lost their lives, which is also the average of the three previous years. In 2015, DOT and NYPD will release a study analyzing motorcyclist crashes in the City and identifying strategies to prevent these deaths.
Motorists and Passengers
In 2013, 59 motorists and passengers lost their lives in traffic crashes. In 2014, 60 motorists and passengers lost their lives, a slight decline from the three year average of 61. In order to keep motorists safe, the City is focused on reducing excessive speeding and, in particular, drunk driving as nearly 40% of motor vehicle drivers killed in recent years have a blood alcohol content (BAC) of .08 or higher.
YEAR
YEAR
NU
MB
ER
OF
MO
TOR
CY
CLI
ST
FATA
LITI
ES
NU
MB
ER
OF
MO
TOR
IST
A
ND
PA
SS
EN
GE
R F
ATA
LITI
ES
Source: NYC DOT & NYPD
Source: NYC DOT & NYPD

VISION ZERO YEAR ONE REPORT 16TRAFFIC FATALITIES IN 2014
Pedestrian Fatalities by Vehicle Type
In Vision Zero’s first year, pedestrian deaths involving trucks and buses actually increased by 28% over recent years (from 25 killed, on average, in 2011-2013, to 32 killed in 2014) while crashes involving all other vehicles declined by 15% (from nearly 118 killed, on average, in 2011-2013 to 100 killed in 2014). Accordingly, the safe operation of large vehicles will be a primary focus for the Task Force in 2015.
Pedestrian Fatalities by Vehicle Type
Large Vehicles
Other Vehicles
2532
118 100
2014
The safe operation
of large vehicles
will be a primary
focus for the
Vision Zero Task
Force in 2015.
Source: NYCDOT & NYPD
2011-20133 year average

VISION ZERO YEAR ONE REPORT 17TRAFFIC FATALITIES IN 2014
Severe Injury Crashes
Tracking New York City’s progress towards Vision Zero will require monitoring crashes that result in severe injuries in addition to fatalities. A pedestrian who has been severely injured typically departs the crash scene in an ambulance and often experiences life-changing injuries (e.g. loss of mobility, brain function, limbs). Tracking the larger number of crashes resulting in fatalities or severe injuries (“killed or seriously injured” aka “KSI”) expands the data points available for identifying safety challenges and developing solutions. This is because KSIs are more numerous and less prone to randomness.
Unfortunately, it currently takes well over a year to obtain reliable severe injury data. NYPD’s paper crash reports are processed by state agencies resulting in more than a one year delay. This delay can be avoided through the use of electronic crash reporting. NYPD is currently working to implement live tracking of serious injury crashes and summons locations. Real-time fatal and serious injury analysis will accelerate the pursuit of the Vision Zero goals as the City becomes more nimble in identifying and responding to safety trends.
Severe Injury Crashes from 2001-2013
YEAR
NU
MB
ER
OF
SE
VE
RE
INJU
RY
CR
AS
HE
S
Source: NYS DMV

FEBRUARY 18
Mayor de Blasio launches the Vision Zero Action Plan.
JUNE 23
Mayor de Blasio signs into law 11 new life-saving traffic safety bills.
APRIL 8
The first of many Vision Zero Pedestrian Safety Workshops across the five boroughs.
JANUARY 15
Mayor de Blasio Launches Interagency Working Group to develop comprehensive roadmap for safer streets.
Vision Zero Year One Timeline2014

SEPTEMBER 18
TLC honors 295 drivers with Safety Honor Roll.
NOVEMBER 7
Vision Zero View Data Map goes live on the Vision Zero website.
OCTOBER 27
Mayor de Blasio signs new law lowering New York City’s default speed limit to 25 MPH.
SEPTEMBER 2
Mayor de Blasio and Senate Co-Leader Klein announce expansion of speed enforcement cameras near schools.
2015

VISION ZERO YEAR ONE REPORT 20VISION ZERO LEGISLATION
Vision Zero Legislation
On June 23, 2014 Mayor Bill de Blasio signed a package of vital legislation that will make streets safer across the five boroughs.
The Mayor signed 11 bills supporting the City’s Vision Zero initiative by enhancing traffic data collection and enforcement efforts, codifying safety engineering commitments, and updating the City’s legal code to enhance penalties for dangerous driving.
Partnering with State legislative leaders during the 2014 legislative session, Mayor de Blasio advanced and secured the passage of significant legislation. By working closely with the Governor and legislative leaders in Albany, the Legislature passed, and the Governor signed, legislation to authorize the new 25 miles per hour (MPH) speed limit – a measure that will help reduce chronic speeding, a leading factor in fatal traffic crashes in New York. The Legislature also passed a bill to increase the number of school speed zones where speed cameras can operate by 120, bringing the total citywide number to 140 school speed zones. In addition, the Mayor secured the enactment of a five-year extension of the City’s red light camera enforcement program, an enormously effective program in existence since 1988 that helps prevent severe traffic injuries.

VISION ZERO YEAR ONE REPORT 21VISION ZERO LEGISLATION
The package of traffic safety bills signed by the Mayor includes:
Intro 43A Requires DOT to study left turns and produce a report every five years
Intro 46A Requires DOT to respond to address major traffic signal issues within 24 hours
Intro 80A Requires DOT to produce a report on work zone safety guidelines on bridges
Intro 140A Requires DOT to install seven Neighborhood Slow Zones in 2014 and 2015 and lower speeds to 15-20 MPH near 50 schools annually
Intro 167A Prohibits stunt behaviors on motorcycles
Intro 168A Requires DOT to study arterial roadways and produce a report every five years
Intro 171A “Cooper’s Law”
Requires TLC to suspend a driver involved in a crash in which a person is critically injured or dies, and where the driver receives a summons for any related traffic violation
Intro 174A Requires TLC to review crashes where critical injury or death resulted
Intro 238A Establishes penalties for drivers that fail to yield to pedestrians and bicyclists
Intro 272A Amends the TLC Critical Driver and Persistent Violator programs
Intro 277A Requires TLC to report quarterly crash data involving TLC-licensed vehicles

HEADERVISION ZERO YEAR ONE REPORT 22

VISION ZERO YEAR ONE REPORT 23SAFER STREET DESIGN
YEAR ONE
Safer Street Design
Under Vision Zero, the Department of Transportation (DOT) is making streets safer through design—making it feel natural to drive safely and expanding dedicated safe spaces for people on foot and on bikes.
In 2014, the City made streets safer by simplifying complex intersections, narrowing lanes and adding speed bumps to discourage excessive vehicle speeds, adding bicycle paths, making pedestrians and cyclists more visible, and shortening pedestrian crossing distances.
Accelerated Transformation of New York Streets
DOT is redesigning intersections and corridors at an unprecedented rate, using a toolbox of safety improvements proven to prevent serious crashes across the City.
In 2014, the Department improved the design of more than 50 corridors and intersections. This included a reconfiguration of 35 high crash intersections—nearly triple the number improved in 2013.
The Department also installed more than five miles of protected bike paths on streets such as Lafayette Avenue and Hudson Street in Manhattan and Kent Avenue in Brooklyn. Protected bike paths create safe space for people on bikes, but also increase safety for all road users: they reduce pedestrian injuries by more than 22% on the roads where they are installed.
In addition, DOT installed more than 400 new speed bumps in neighborhoods across the City, a 37% increase over the previous year. In order to give New Yorkers crossing the street a “head start” and reduce conflicts between turning vehicles and pedestrians, the Department installed 45 leading pedestrian interval signals, triple the number installed in 2013.

HEADERVISION ZERO YEAR ONE REPORT 24
In 2014, DOT installed more than 400 new speed bumps, 45 leading pedestrian interval signals, and five miles of protected bike paths.
VISION ZERO YEAR ONE REPORT 25SAFER STREET DESIGN
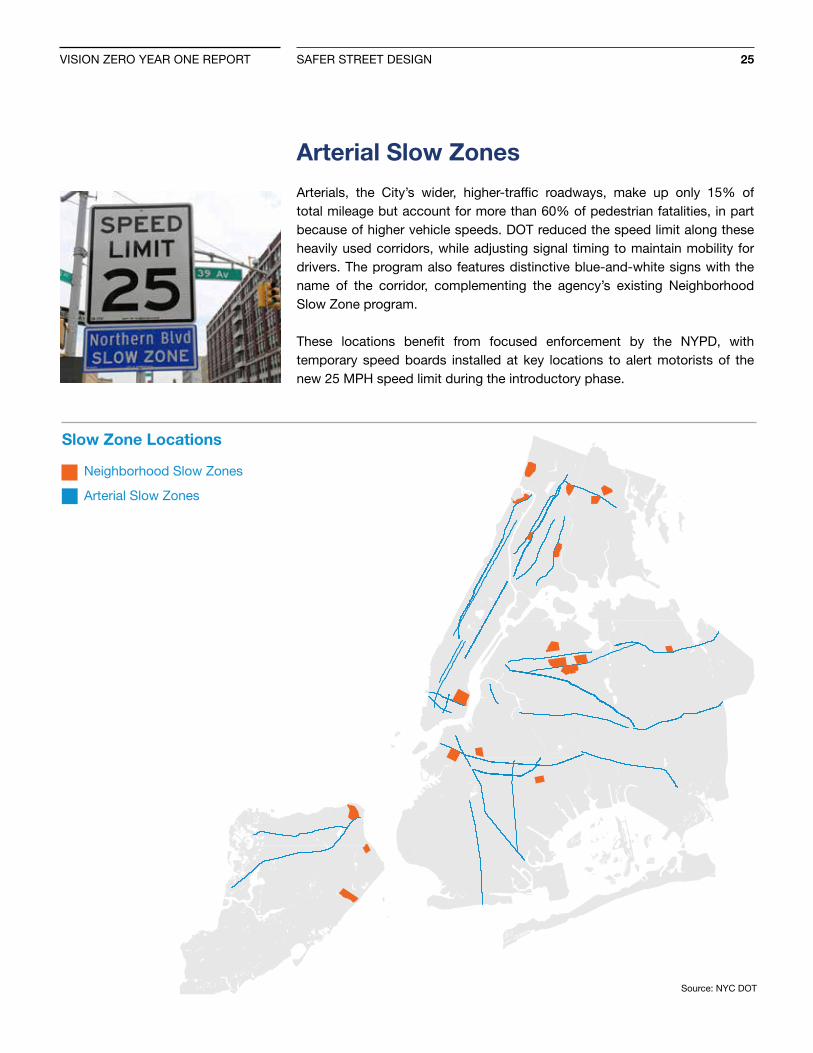
Arterial Slow Zones
Arterials, the City’s wider, higher-traffic roadways, make up only 15% of total mileage but account for more than 60% of pedestrian fatalities, in part because of higher vehicle speeds. DOT reduced the speed limit along these heavily used corridors, while adjusting signal timing to maintain mobility for drivers. The program also features distinctive blue-and-white signs with the name of the corridor, complementing the agency’s existing Neighborhood Slow Zone program.
These locations benefit from focused enforcement by the NYPD, with temporary speed boards installed at key locations to alert motorists of the new 25 MPH speed limit during the introductory phase.
Slow Zone Locations
Neighborhood Slow Zones
Arterial Slow Zones
Source: NYC DOT

VISION ZERO YEAR ONE REPORT 26BEFORE AND AFTER
YEAR ONE BEFORE AND AFTER
Safety Engineering Improvements
DOT’s redesigned intersections and corridors are bringing proven safety features to streets across the City. These are five examples of corridor improvement projects.
East Tremont Avenue ranked in the borough’s top third for KSI. Speeding was a significant factor, as over 85% of observed drivers were driving at illegal speeds. Over the course of half a mile, five pedestrian safety islands were installed, along with curb extensions, new pedestrian ramps, new crosswalks and other improvements, creating safer, shorter pedestrian crossings, simpler turns, and calmer traffic.
Bronx

VISION ZERO YEAR ONE REPORT 27BEFORE AND AFTER
Brooklyn Bushwick Avenue ranked in the borough’s top third of streets on which people were “Killed or Seriously Injured” (KSI), in part because the street space was poorly configured. This 0.7 mile corridor project used new islands and sidewalk extensions (“neckdowns”) to shorten crossing distances. The project also narrowed travel lanes, which improved bicycling conditions, created safer pedestrian crossings, and reduced dangerous weaving by drivers.
Park Avenue (East 96th to East 111th streets)—where the Viaduct prevented drivers and pedestrians from seeing one another—ranked in the borough’s top third for KSI. This 0.8 mile project added concrete pedestrian neckdowns at 30 intersections adjacent to the Park Avenue Viaduct, resulting in safer pedestrian crossings and calmer traffic.
Manhattan

VISION ZERO YEAR ONE REPORT 28BEFORE AND AFTER
Richmond Avenue ranked in the borough’s top 10% for KSI crashes. Speeding was a significant factor, as more than 60% of drivers were speeding on this road. This 1.5 mile project added a raised center median and pedestrian safety islands, while narrowing moving lanes. These improvements produced less speeding, safer pedestrian crossings, and safer vehicle turns.
Staten Island
Queens Northern Boulevard (62nd to 102nd Streets) ranked in the top 10% of KSI for the borough, in part because of fast turning vehicles. This 1.8 mile corridor project added 11 new pedestrian safety islands and 22 leading pedestrian intervals (LPIs), providing more exclusive pedestrian crossing time.

VISION ZERO YEAR ONE REPORT 29SAFER STREET DESIGN: THE ROAD AHEAD
SAFER STREET DESIGN
The Road Ahead
This work is not done: Designing safer and more livable streets is a primary pillar of Vision Zero.
Building on the achievements from Year One, the City has identified several new priority locations for safer streets and will continue its accelerated pace of street design changes in Year Two.
Target Design Improvements at the Most Crash-prone Corridors and Intersections
In 2014, DOT created new Borough Pedestrian Safety Action Plans to guide future engineering projects. These plans identify “priority corridors” and “priority intersections” in each borough—intersections and corridors with the highest rates of severe pedestrian injuries and fatalities. These plans, released in the beginning of 2015, will provide the basis for DOT’s design priorities for years to come. They were developed by pairing a comprehensive community input approach (28 workshops and over 10,000 comments to the Vision Zero Input map) with cutting-edge analysis of crash data. This input helped identify the most pressing traffic safety issues at the most crash-prone locations in the City.
Give Pedestrians More Exclusive Crossing Time With Leading Pedestrian Intervals
A leading pedestrian interval, or “LPI,” is a proven method of reducing pedestrian-vehicle conflicts at high pedestrian crash locations. LPIs use timed signals to provide pedestrian-only walk time before any vehicles, including turning vehicles, receive the green light. As part of Vision Zero, DOT will dramatically expand the use of this treatment. By the end of 2017, DOT will install LPIs, when appropriate, at every school crosswalk on all priority corridors and at each priority intersection.

VISION ZERO YEAR ONE REPORT 30SAFER STREET DESIGN: THE ROAD AHEAD
Re-time Traffic Lights on Major Roads to Reduce Speeding
At off-peak times, such as late night and midday, congestion diminishes and vehicle speeds are higher, increasing the risk and severity of crashes. To reduce speeds, DOT will modify off-peak signal timing on all feasible priority corridors by 2017.
Expand Signage for the New, Safer Speed Limit
Effective November 7, 2014, the speed limit on all unmarked streets in New York City was reduced to 25 MPH. Streets that are signed for 30 MPH (or higher) will be evaluated on a case-by-case basis and switched to 25 MPH when advisable. Signage will be expanded so the speed limit will be posted at a higher frequency along priority corridors. This will help to increase compliance with the speed limit, better educate the public about the new citywide speed limit, and make NYPD enforcement simpler and less ambiguous.
Continue to Expand the Safe Bicycling Network
DOT will continue to build out the City’s bicycling network to make streets safer for all. Bike networks are a fundamental aspect of the Vision Zero strategy to increase safety. Well-designed bike lanes not only improve safety for people on bikes, but protect pedestrians crossing the street by reducing excessive vehicle speeding and organizing traffic flow. DOT will work closely with communities to expand the bicycle network and each year will install at least 5 miles—about 100 City blocks—of protected bicycle paths.
Reduce Pedestrian and Cyclist Conflicts with Delivery Trucks by Expanding Off-Hours Delivery Program
Truck crashes are particularly likely to result in fatal and severe injury crashes. Delivery vehicles also often block bike lanes or sidewalks, creating unnecessary hazards and forcing people on foot or on bikes into traffic. In order to reduce these dangerous conflicts, DOT will introduce new regulations that limit truck deliveries and double-parking during busy daytime hours and incentivize overnight deliveries. These efforts will be particularly important in Manhattan where the rate of pedestrian deaths caused by trucks is twice as high as in other boroughs.
Bike networks are a
fundamental aspect of
the Vision Zero strategy
to increase safety. Well-
designed bike lanes not
only improve safety for
people on bikes, but
protect pedestrians
crossing the street by
reducing excessive
speeding in cars and
organizing traffic flow.

VISION ZERO YEAR ONE REPORT 31SAFER STREET DESIGN: THE ROAD AHEAD
Partner with MTA to Improve Safety on Bus Routes and at Bus Stops
DOT will also coordinate with the Metropolitan Transportation Authority (MTA) to ensure bus operations contribute to a safe pedestrian environment. The MTA operates the largest bus system in the United States, and buses are an extremely important part of the City’s transportation network and vehicle mix. By focusing on routes and stops at and near priority corridors and priority intersections, DOT and MTA will work together to keep New Yorkers safe.
DOT will partner with MTA to create a safe environment for passengers and pedestrians along priority corridors.

VISION ZERO YEAR ONE REPORT 32GREAT STREETS
Vision Zero Great Streets
Many arterial streets across the City with the highest rates of fatal and severe injury pedestrian crashes per mile are also among the City’s most iconic major streets, including Queens Boulevard, Atlantic Avenue, Fourth Avenue in Brooklyn, and the Grand Concourse.
The Vision Zero Great Streets program will rethink and redesign these major corridors in order to prevent serious crashes, enhance New Yorkers’ mobility, increase accessibility, and contribute to each neighborhood’s vitality. The design of intersections and corridors will rely on insights and perspectives provided through engagement with neighborhood residents, small business owners, elected officials and community leaders.
Capital construction provides long-term upgrades to the roadway and the underlying infrastructure. This provides the opportunity to address serious issues related to a street’s condition and design. Reconstruction replaces a foot or more of roadway below the street’s surface and usually includes reconstruction of the curbs and sidewalks as well. This comprehensive
Great Streets capital construction projects will feature expanded pedestrian space and safer intersections as shown in this Eastern Parkway project below.

VISION ZERO YEAR ONE REPORT 33GREAT STREETS
overhaul provides opportunities to improve safety including the realignment of intersections, the shortening of pedestrian crossing distances through curb extensions and medians, the addition of physically separated bike lanes, the relocation of traffic signals and street lights, and the addition of trees as an attractive and environmentally conscious street enhancement.
Great Streets capital projects will be fast-tracked in order to allow a permanent build-out of street improvements made with temporary materials. Capital construction projects are complex and develop over multiple years because of the extensive coordination and collaboration between DOT, the Department of Design and Construction (DDC), and a host of other City agencies, utility companies, and the community. Each of these corridors present special challenges because of the high pedestrian volumes, heavy vehicle traffic, and the presence of subways underneath the road. Under Vision Zero Great Streets, painted medians and temporary bollards will be built out in permanent materials faster and New Yorkers could begin to see construction of expanded pedestrian space, beautified medians with trees, and physically separated bike paths on major streets by 2017.
Queens Boulevard
The Great Streets program will be used to improve segments of Queens Boulevard, a 7.2 mile, 12 lane corridor which cuts across more than half the borough. The long crossing distances, high traffic speeds and highway-like urban design have contributed to historically high crash rates. Though the street is far safer than it was fifteen years ago - annual traffic fatalities are 75% lower after DOT implemented a series of improvements in the early 2000s – there is much more to be done.
In January 2015, DOT, NYPD and 100 residents, merchants and other stakeholders participated in the first Queens Boulevard design workshop. The direction from the community is clear: calmed service roads, better crossings, the addition of a protected bike path, and beautification. Through the Great Streets program, the City will implement fast-track solutions and simultaneously begin the long-term capital-funded changes needed to permanently improve Queens Boulevard.
Great Streets capital
projects will be fast-
tracked in order to
allow a permanent
build-out of street
improvements made
with temporary
materials.

HEADERVISION ZERO YEAR ONE REPORT 34
A Virtuous Cycle: More People Biking Means Safer Streets for All
Bicycling, now a popular and vital part of New York City transportation, keeps people and the environment healthy.
More people on bikes means fewer people in cars and fewer people crowding onto subways and buses.
The City and DOT have set an aggressive goal to double the level of cycling in New York by 2020. In the next few years, Citi Bike, New York City’s bike share program, will double in size–from 6,000 bicycles at 330 stations to 12,000 bicycles at over 700 stations. The program will expand to new neighborhoods in Manhattan, Brooklyn, and Queens and will facilitate millions of bicycle trips within the new service areas.
More cycling means better cyclist safety. Experience has shown that the best way to improve the safety of cycling is to increase the number of cyclists on the streets, and the best way to encourage more cycling is a safe network of bike lanes and other cycling infrastructure. The New York City Cycling Risk Indicator accounts for bicyclist safety by measuring cyclist fatalities and serious injury data against bicycle ridership data. While cycling in New York City has nearly quadrupled since 2000, serious injuries have remained low, representing a 75% decrease in the average risk of a serious injury since 2000. Since well-designed bike lanes not only protect bicyclists, but also reduce excessive speeding, organize traffic flow and protect pedestrians crossing the street, they are a fundamental aspect of Vision Zero’s strategy to increase safety.
To that end, DOT is working to rapidly expand the bicycle network by working with communities in Long Island City, Ditmas Park, Washington Heights, Ridgewood, Brownsville, and Bushwick, among other neighborhoods.

VISION ZERO YEAR ONE REPORT 35A VIRTUOUS CYCLE
In addition, DOHMH continues to promote cycling as a convenient and low-cost way to be physically active. Health benefits from bicycling include cardiac health, bone health, mental health and overall wellness. DOHMH, with DOT, has been identifying strategies to promote bicycling in neighborhoods with historically low ridership rates.
Starting in 2015, DOT will work with DOHMH and NYPD to update the 2006 Bicyclist Fatality and Serious Injury Report, highlighting current issues and trends in cyclist safety in New York City and developing new goals and recommendations to make cycling even safer. The 2006 report informed many of the City’s current priorities, including the build-out of protected bike paths and DOT’s free bicycle helmet distribution program.
19!36!
56!
99! 115! 120!149!
207!
281!
347!
397! 411!
454!
524!
566!
0!
100!
200!
300!
400!
500!
600!
700!
800!
0!
50!
100!
150!
200!
250!
300!
350!
400!
450!
2000! 2001! 2002! 2003! 2004! 2005! 2006! 2007! 2008! 2009! 2010! 2011! 2012! 2013! 2014!
New York City Cycling Risk Indicator
The New York City Cycling Risk Indicator is calculated as the number of bicyclists killed or severely injured in motor vehicle traffic crashes, divided by the NYC In-Season Cycling Indicator, multiplied by 100. The Risk Indicator describes changes in cyclist safety over the past decade while accounting for the increase in bicycle use in New York City. This chart was developed using the most recent available data.
In-season Cycling Indicator
Cycling Risk Indicator
Bike Network Milage
The best way to
improve the safety of
cycling is to increase
the number of cyclists
on the streets.
YEAR
RIS
K IN
DIC
ATO
R
BIC
YC
LE N
ETW
OR
K M
ILEA
GE
Source: NYC DOT

VISION ZERO YEAR ONE REPORT 36ENFORCEMENT
Year One
Enforcement
Drivers of cars and trucks on the streets of New York have a special responsibility to obey traffic laws designed to keep all road users safe.
Seventy percent of all pedestrian fatalities involved dangerous driver behaviors, including speeding, failure to yield to pedestrians, distracted driving, and driving under the influence of drugs or alcohol. NYPD officers, along with DOT speed and red light cameras, have important roles in ensuring these laws are adequately enforced in order to keep New York neighborhoods safe.
As part of Vision Zero, NYPD has targeted its efforts towards reducing traffic fatalities and serious injuries by directing enforcement at the most dangerous driving behaviors, particularly speeding and failure to yield.
The Department has expanded its available resources to improve traffic safety by purchasing 226 speed detection guns (i.e., LIDAR guns) and a Vision Zero sound truck, increasing the staffing of the Highway District, and by hiring additional school crossing guards.
The Police Department has also participated in extensive public outreach campaigns, including the interagency Vision Zero Street Teams in partnership with the Department of Transportation and the Taxi and Limousine Commission. Through pamphlet and leaflet distribution, social media postings, e-mailings, group presentations, and public announcements from the Vision Zero sound truck, NYPD’s traffic safety outreach efforts have covered the new 25 MPH speed limit, bicyclist safety, and student street safety.

VISION ZERO YEAR ONE REPORT 37ENFORCEMENT
A Citywide Commitment to Crack Down on Dangerous Driving
Each week at TrafficStat, NYPD’s Chief of Transportation meets with Department executives to outline, review, and manage the NYPD’s traffic program. In keeping with the Vision Zero mission, the Chief has directed Department personnel to focus on violations which contribute to pedestrian fatalities. The NYPD has responded by issuing 117,767 speeding summonses and 33,577 failure to yield to pedestrian summonses in 2014, respective increases of 42% and 126% from the same period in 2013.
2013
Failure to yield summonses
Speeding summonses
Speeding summonses
2014
42% Increase
126% IncreasePercent Increase in Moving Summons
There was a 42% increase in speeding and 126% increase in failure to yield summonses.
Moving Summons Totals
For precinct level information on moving summonses issued, visit: nyc.gov/html/nypd/html/traffic_reports/traffic_summons_reports.shtml.
Failure to yield summonses
14,888
33,577
83,202
117,768
2013 20132014 2014
YEAR
NU
MB
ER
OF
MO
VIN
G S
UM
MO
NS
Source: NYPD
Source: NYPD

HEADERVISION ZERO YEAR ONE REPORT 38
In 2014, NYPD’s Collision Investigation Squad responded to 430 collision scenes, leading to 96 findings of criminality.

VISION ZERO YEAR ONE REPORT 39ENFORCEMENT
New Speeding Enforcement Cameras
Speeding is a leading cause of fatal traffic crashes and the City is working hard to combat it via engineering and enforcement. Speed cameras are a proven tool to deter illegal speeding because they provide consistent and predictable enforcement of the speed limit. Late in 2013, the City was given authorization to implement a 20 camera speed camera pilot program. In June 2014, the City was granted the authority to use speed cameras in up to 140 school zones. Cameras are deployed according to a careful integration of crash data and speeding data to identify optimal sites. DOT will have 140 cameras in place by January 1, 2016.
The program has proven to be effective at reducing speeding – violations at all fixed locations dropped 59% during a recent four-month period. The decline in violations is an expected and welcome development because less excessive speeding means New Yorkers are much safer. Awareness of the program is quite high, in part because new speed limit signs installed by DOT indicate that the law is photo-enforced.
Better Collision Investigation
In 2014, the NYPD’s Collision Investigation Squad (CIS) and Collision Technician Group conducted enhanced investigations of the most serious traffic crashes. These investigations determine what caused a crash and whether any criminality occurred. In 2014, CIS responded to 430 crash scenes, leading to 96 findings of criminality. In 12 of these cases involving pedestrians between August and December, the NYPD recommended charges for the new misdemeanor offense, Administrative Code 19-190. This law, enacted in 2014, penalizes drivers who, by acting negligently or recklessly, cause injury or death of a pedestrian or cyclist who had the right of way.
Auxiliary officers are also conducting mock speed enforcement zones—where NYPD civilian agents measure speeds but do not issue tickets—throughout the City, using both LIDAR and radar guns. The data gathered alerts the local precincts to speeding conditions, while also serving as a visual reminder to drivers to reduce their speeds.
Speed cameras have
proven to be effective
at reducing speeding.
Violations at all fixed
locations dropped 59%
during a recent four-
month period.

VISION ZERO YEAR ONE REPORT 40ENFORCEMENT
NYPD Chief of Transportation Thomas Chan addresses police officers at roll call to emphasize the importance of traffic safety and the vital role the officers play in the success of Vision Zero.
NYPD Patrol Boro
LIDAR Guns deployed in 2014
Brooklyn 22
Bronx 10
Manhattan 20
Queens 18
Staten Island 10
Reserves 8
Total 88
Highway DistrictLIDAR Guns deployed in 2014
Highway Unit 1 Bronx & Manhattan
39
Highway Unit 2 Brooklyn
33
Highway Unit 3Queens
46
Highway Unit 5Staten Island
20
Total 138

VISION ZERO YEAR ONE REPORT 41ENFORCEMENT
TLC officers supplement the work the New York Police Department does to enforce the rules of the road. Their operations focus on TLC-licensed drivers and individuals who illegally operate for hire.
TLC supported several pieces of City Council legislation which enable TLC to quickly remove unsafe drivers from the road and provide the public with more information about crashes taking place in TLC-licensed vehicles. These bills were signed into law by Mayor de Blasio and are now in place to support TLC enforcement efforts.
More Accountability for Taxis and For-Hire Vehicles
The City has also increased the accountability of for-hire drivers who drive dangerously. TLC currently has nearly 200 officers who issue summonses to licensees and seize vehicles that are illegally posing as taxis or other types of TLC-licensed vehicles. The agency is adding 35 new officers to aid in this effort. TLC has created a new TLC Safety Squad, equipped with speed detection LIDAR guns, dedicated to enforcing against dangerous driving choices, such as speeding and failure to yield infractions.
TLC is also implementing “Cooper’s Law,” a law which ensures that the agency is notified when licensees are involved in serious crashes. The agency then evaluates whether the driver is fit to keep his or her license and, when appropriate, seeks to suspend or revoke the license.

VISION ZERO YEAR ONE REPORT 42ENFORCEMENT: THE ROAD AHEAD
ENFORCEMENT
The Road Ahead
Continue to Target Dangerous Moving Violations
In 2015, NYPD will continue its increased targeted enforcement of the most dangerous moving violations, particularly speeding and failure to yield. The department will continue to raise awareness of and increase the application of Administrative Code Section 19-190 by highway and precinct officers in order to increase accountability for dangerous driving that kills or seriously injures pedestrians or cyclists with the right of way. Enforcement will also be prioritized for those motorists who exceed the new 25 MPH speed limit. TLC will continue to ramp up its enforcement squad to increase its enforcement efforts on all TLC-licensed vehicles.
New Enforcement Techniques and Efficiency Improvements
To improve the efficiency of existing resources, NYPD will explore new models of data-driven enforcement that increase policing of both traffic violations and criminal summonses in areas where both crime rates and traffic fatalities and injuries are high. The Department will also increase enforcement of traffic violations by large vehicles and trucks.
In addition, NYPD will begin allowing Traffic Enforcement Agents to respond to motor vehicle collisions that involve only property damage. With these trained, skilled agents fixed on non-injury collisions, police officers will be freed to investigate collisions that result in injury or death. A second pilot will allow civilian members of the NYPD to work in the Intoxicated Driver Testing Unit to assist officers, reduce processing time, and increase the likelihood that drunk drivers are held accountable.
In 2015, NYPD also plans to launch a major technological upgrade to its traffic analysis capabilities, which will allow a more in-depth review, tracking, and accounting of collisions and enforcement in priority corridors, intersections, and areas.

VISION ZERO YEAR ONE REPORT 43ENFORCEMENT: THE ROAD AHEAD
Expanded Partnership with the District Attorneys’ Offices
The Vision Zero Task Force now includes representation from the City’s District Attorneys’ Offices. Cooperation with the DAs will assist in greater collision prevention and safety enforcement. NYPD will collaborate closely with the District Attorneys’ Offices on initiatives that increase prosecution of reckless drivers, and the District Attorneys will continue to offer their legal insight and experience to other Task Force members.
Expanded Partnership with the Department of Motor Vehicles
The New York State Department of Motor Vehicles (NYS DMV) is responsible for setting the minimum standards that drivers must meet to obtain and maintain their driver licenses and for determining, adjudicating, and distributing penalties against dangerous drivers. The City will work with the DMV to explore ways to improve the NYS Driver’s Manual and test to better reflect changes to City streets, expand interstate cooperation on the tracking of expired or revoked licenses, and potentially adjust the point system to improve incentives for safer driving.
NYPD Inspector Fulton speaks at an Upper West Side townhall meeting.

HEADERVISION ZERO YEAR ONE REPORT 44
Large Vehicle Safety
Trucks and buses were involved in 24% of 2014’s pedestrian fatalities (up from 18% from 2011-2013).
The City can help prevent these tragedies through the use of targeted enforcement to deter dangerous driving behaviors, properly devised incentives to encourage safe behavior, and an engagement program to encourage safer driving.
The Department of Transportation (DOT) will spearhead this effort by developing a study on large vehicle collisions to determine causes and possible countermeasures. For example, approximately 45% of fatal bus and truck crashes involve turns within intersections. By concentrating City street design, education, deterrence and technological approaches to prevent unsafe turns, the City can greatly reduce the probability that these crashes will occur.
DOT and NYPD will use crash data to identify times and locations where greater enforcement or design changes are needed and NYPD will prioritize enforcement of dangerous violations by the drivers of trucks and other large vehicles through the establishment of “truck priority enforcement areas.”
The City is already leading by example by improving the safety of its large vehicles. In 2014, the Department of Citywide Administrative Services (DCAS) assessed and developed preliminary recommendations for technology and specification changes to make the City fleet safer. A focus of this effort was the installation of side guards on trucks. Side guards are protective additions to vehicles that reduce the probability that pedestrians and cyclists will suffer severe injuries when struck by a turning truck. In 2015, DCAS will install truck side guards on more than 200 trucks in the City fleet, including box vans, rack tracks, dump and garbage trucks, salt spreaders, container trucks, tractor trailers, and other specialized equipment.

VISION ZERO YEAR ONE REPORT 45LARGE VEHICLE SAFETY
2011-20133 year average
2014
Vehicle Type2011-2013Average 2014
Passenger Car 110.7 95
Truck 16.3 17
Bus 8.7 15
Taxi/Livery 4.3 5
Motorcycle 2.7 0
Others/Unknown 15.0 6
Total 157.3 137
Pedestrian Fatalities by Vehicle Type
Passenger Car Truck Bus Taxi/Livery Motorcycle Others/Unknown
The City will work closely with the Metropolitan Transit Authority (MTA) to improve the safety of its buses. The MTA is currently exploring the installation of two warning systems that will make buses safer for both operators and pedestrians. The first will alert pedestrians with an external audio warning when the bus is making a right or left turn. The second will alert bus operators about potential collisions, based on input from multiple sensors, such as camera and radar technologies that detect vehicles, pedestrians and cyclists. The Vision Zero Task Force will continue to consult and work with the MTA in the coming year to ensure that MTA drivers have the training, technology, and support needed to operate safely on the streets of New York.
110.7
16.3
8.7
15
5
4.32.7
15 6
17
95
Source: NYC DOT & NYPD
VISION ZERO YEAR ONE REPORT 4625 MPH
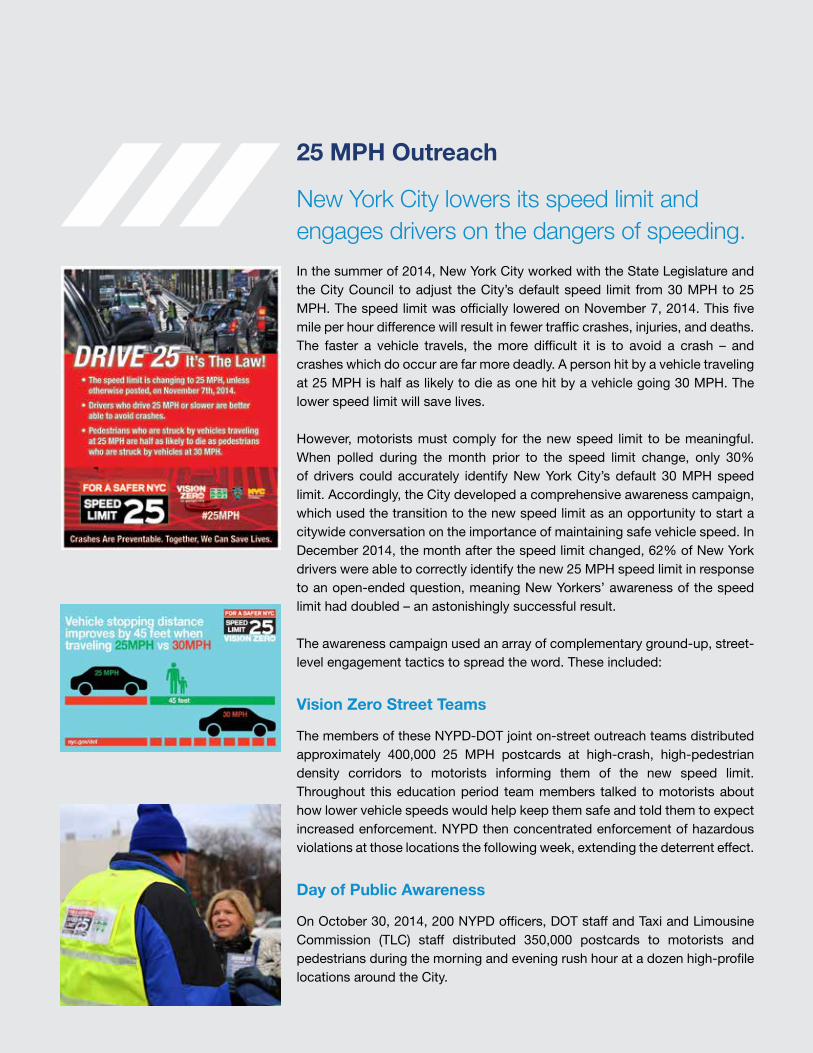
25 MPH Outreach
New York City lowers its speed limit and engages drivers on the dangers of speeding.
In the summer of 2014, New York City worked with the State Legislature and the City Council to adjust the City’s default speed limit from 30 MPH to 25 MPH. The speed limit was officially lowered on November 7, 2014. This five mile per hour difference will result in fewer traffic crashes, injuries, and deaths. The faster a vehicle travels, the more difficult it is to avoid a crash – and crashes which do occur are far more deadly. A person hit by a vehicle traveling at 25 MPH is half as likely to die as one hit by a vehicle going 30 MPH. The lower speed limit will save lives.
However, motorists must comply for the new speed limit to be meaningful. When polled during the month prior to the speed limit change, only 30% of drivers could accurately identify New York City’s default 30 MPH speed limit. Accordingly, the City developed a comprehensive awareness campaign, which used the transition to the new speed limit as an opportunity to start a citywide conversation on the importance of maintaining safe vehicle speed. In December 2014, the month after the speed limit changed, 62% of New York drivers were able to correctly identify the new 25 MPH speed limit in response to an open-ended question, meaning New Yorkers’ awareness of the speed limit had doubled – an astonishingly successful result.
The awareness campaign used an array of complementary ground-up, street-level engagement tactics to spread the word. These included:
Vision Zero Street Teams
The members of these NYPD-DOT joint on-street outreach teams distributed approximately 400,000 25 MPH postcards at high-crash, high-pedestrian density corridors to motorists informing them of the new speed limit. Throughout this education period team members talked to motorists about how lower vehicle speeds would help keep them safe and told them to expect increased enforcement. NYPD then concentrated enforcement of hazardous violations at those locations the following week, extending the deterrent effect.
Day of Public Awareness
On October 30, 2014, 200 NYPD officers, DOT staff and Taxi and Limousine Commission (TLC) staff distributed 350,000 postcards to motorists and pedestrians during the morning and evening rush hour at a dozen high-profile locations around the City.

VISION ZERO YEAR ONE REPORT 4725 MPH
Community Partnerships
DOT worked with an array of groups to distribute printed material and infographics in nine languages. These groups included large professional driver associations; large fleet operators and driver-oriented businesses like parking lot operators and auto insurance companies; advocacy organizations like Transportation Alternatives and AAA; State and local elected officials; Business Improvement Districts (BIDs); community service providers and civic associations.
Other Outreach
• Social Media: DOT created the “People of 25” social media campaign, which showcases dozens of New Yorkers who endorse the benefits of slowing down, including the City’s Safest Taxi Driver, marathon trainers, and trick-or-treating toddlers. The campaign also featured, to powerful effect, family members who have lost loved ones in traffic crashes. DOT’s Facebook account typically draws 2,500 people daily and, during this campaign, that grew to 17,000 people daily – making this social media campaign among the most successful conducted by the City in 2014.
• DOT Assets: DOT is incorporating messages about the new speed limit into every interaction it has with drivers, including through highway variable message boards, on the back of Muni-Meter receipts, and on Alternate Side Parking calendars.
• Paid Media: DOT placed ads on over-the-air and satellite radio. In addition DOT purchased, produced, and placed run-of-site web banner ads and half-page full color ads in ten newspapers including the Daily News, ethnic papers, and other local papers.
• Earned Media: The new speed limit attracted widespread press attention, resulting in over 140 newspaper articles, in addition to scores of TV and radio news features. Much of the attention was devoted to covering the other elements of the campaign. The launch of the social media and community partnerships, dubbed “25 Days to 25,” was well covered.
These efforts all contributed to New York drivers’ improved ability to identify New York City’s speed limit—62%, compared to 30% previously, now know the correct limit. To further increase public awareness of the new speed limit, DOT will install more than 3,000 25 MPH signs by the end of 2015.
62% of New Yorkers
now know the correct
speed limit of 25 MPH.

VISION ZERO YEAR ONE REPORT 48SAFE TAXIS AND FOR-HIRE VEHICLES
Year One
Safer Taxis and For-Hire Vehicles
The Taxi and Limousine Commission (TLC) licenses 120,000 professional drivers, including drivers of taxis, livery and black cars, and commuter vans.
Engaging these drivers and their passengers in promoting Vision Zero presents an excellent opportunity to improve the safety of City streets. In 2014, TLC Vision Zero initiatives ranged from greater education about street safety to incentives for safe driving and enforcement against unsafe driving behaviors.
TLC Commissioner Meera Joshi poses with some of the proud 2014 TLC Safety Honor Roll drivers.

VISION ZERO YEAR ONE REPORT 49SAFE TAXIS AND FOR-HIRE VEHICLES
Facts about 2014 Safety Honor Roll Drivers
DRIVE YELLOW TAXIS
DRIVE BLACK OR LIVERY CARS
DRIVE BORO TAXIS
DRIVE COMMUTER VANS
178
295
110 18 3
TLC Safety Honor Roll drivers have had no crashes involving injury, no traffic violations, and no violations of TLC safety-related rules for five or more years as TLC-licensed drivers.
The average honor roll driver has held a TLC license for 13 years.
TOTAL DRIVERS ON THE 2014 SAFETY HONOR ROLL
Honoring New York’s Safest Drivers: Introducing the TLC Safety Honor Roll
The 2014 TLC Safety Honor Roll is New York City’s first annual award to recognize taxi and for-hire vehicle drivers who have outstanding records of safe driving over many years and millions of miles behind the wheel. TLC has high standards for all of its 120,000 licensed drivers, and on a mile-per-mile basis TLC-licensed drivers are some of the safest drivers on New York City streets. The 295 drivers on the 2014 TLC Safety Honor Roll represent a truly elite group. These remarkable drivers were recognized for their deep commitment to safety and service at a ceremony with their families on September 8, 2014. TLC hopes that these drivers serve as inspiration to their peers and that the honor rolls displays the level of appreciation the City has for excellent drivers.

VISION ZERO YEAR ONE REPORT 50SAFE TAXIS AND FOR-HIRE VEHICLES
Focus on Turns
A large share of severe and fatal pedestrian crashes occur in intersections, when drivers are making turns. All TLC–licensed vehicles now have driver-facing “Turning? People are Crossing” stickers to serve as a constant reminder to exercise particular caution when making turns.
To encourage all drivers to make safe choices behind the wheel, TLC distributed over 10,000 free “Your Choices Matter” bumper stickers to TLC licensees.
Keeping cyclists from being hit with car doors as passengers enter and exit taxis is a priority for TLC. To remind passengers to exercise caution when exiting taxis and for-hire vehicles, TLC has been distributing free “LOOK for Cyclists” stickers at its Woodside Safety and Emissions Facility. These stickers support a broader NYC Department of Transportation initiative to encourage all road users to pay attention to their surroundings when navigating New York City streets.
Through new rules passed in September 2014, the 70,000 vehicles TLC licenses became moving billboards for promoting traffic safety for all drivers, passengers, and those with whom they share the road.

VISION ZERO YEAR ONE REPORT 51SAFE TAXIS AND FOR-HIRE VEHICLES
Outreach to For-Hire Drivers
Engaging the public and TLC-licensed drivers, vehicle owners, and business owners in a dialogue about safe driving is a key component of changing the driving culture in the City. TLC Vision Zero outreach and education programs in Year One included:
• Base, Fleet, and Industry Association Meetings. Taxi fleets, for-hire vehicle bases, and industry associations across the City have welcomed TLC into their establishments to discuss Vision Zero and traffic safety. TLC staff present ideas to the drivers, lead the drivers in a discussion, and ask the drivers to sign the TLC Safe Driver Pledge.
• Taxi School. All taxi drivers must attend taxi school before obtaining a license to drive a taxi. TLC has updated its taxi school curriculum to include new Vision Zero content on topics ranging from the driver behaviors most associated with crashes to tips for safely navigating the City’s new street designs.
• Flyers. TLC has created a flyer it sends to all driver licensees that contains “10 Tips for Safe Drivers,” which reminds them of the importance of obeying the speed limit.
• Seatbelts. TLC created a public service announcement to remind passengers that one of the most important things they can do to keep themselves safe is to buckle up!
Expand New York State’s Seatbelt Law to Cover Taxis and For-Hire Vehicles
In New York State, all front seat passengers and all back seat passengers under age 16 must wear seatbelts. However, taxi and for-hire vehicle occupants are currently exempt from this law. The benefits of seatbelt use are widely documented. National Highway and Traffic Safety Administration (NHTSA) data shows that when lap/shoulder seat belts are used properly, they reduce the risk of fatal injury to front seat passenger car occupants by 45% and the risk of moderate-to-critical injury by 50%. In all crashes, back seat lap/shoulder belts are 44% effective in reducing fatalities when compared to unrestrained back seat occupants. Studies also show that seatbelt laws and seatbelt enforcement increase seatbelt use and save lives.
Working with partners in Albany, the City will work to revise the current law so that the same seatbelt laws for drivers and passengers in private vehicles also apply in taxis and for-hire vehicles. This would broaden seatbelt use and counter a cultural norm towards non-use of seatbelts in taxis and other for-hire vehicles. Under the City’s proposal, TLC drivers will not be liable for the non-compliance of their passengers.

VISION ZERO YEAR ONE REPORT 52SAFE TAXIS AND FOR-HIRE VEHICLES: THE ROAD AHEAD
SAFER TAXI AND FOR-HIRE VEHICLES
The Road Ahead
In Year Two, TLC will continue to engage taxi fleet and car service base managers in promoting Vision Zero.
Engaging taxi fleet and car service base managers will reinforce efforts to engage with individual drivers, by bringing sustained attention from management to their drivers’ knowledge of and adherence to safe practices.
TLC will focus on improving engagement with its licensed drivers by developing a system to communicate safety information directly from TLC to more drivers in the field.
It also will expand required TLC driver education to include car service drivers and will introduce license renewal courses for taxi and car service drivers. These new additions will provide additional continuing education on safe driving for professional drivers.
TLC will also engage taxi fleets and car service bases in promoting safe driving among TLC-licensed drivers. This will be supported with the creation of an educational video aimed to TLC-licensed drivers and other drivers that depicts the impact traffic crashes have on families.

HEADERVISION ZERO YEAR ONE REPORT 53
Vision Zero and Increasing Accessibility
How Vision Zero is helping to create a safe and more accessible city for all New Yorkers.
More than 800,000 New Yorkers—10% of the city population—are people with disabilities, and many more have diminished abilities. New Yorkers with disabilities, particularly the blind and low-vision community and those who use wheelchairs to get around, benefit from Vision Zero. When the City simplifies complex intersections, deters speeding, shortens crossing distances, and encourages safer driving at intersections, the streets become safer and more accessible.
As part of Vision Zero, the Department of Transportation, in close partnership with the City Council, has developed a plan to triple the number of Accessible Pedestrian Signals installed annually to 75 per year, beginning in 2016.
These devices help blind and low-vision pedestrians cross the street safely by alerting them through audible tones, speech messages, and vibrating surfaces, when the “walk” phase is available at a given intersection. DOT works closely with the Mayor’s Office for People with Disabilities (MOPD) and the blind and low-vision community, such as the group Pedestrians for Accessible and Safe Streets (PASS), to identify intersections which present a crossing difficulty for persons with visual impairments.
DOT will engage outside experts to identify best practices and next generation technologies to provide assistance to blind and low-vision pedestrians, and work with MOPD, PASS, and other stakeholders to evaluate their effectiveness in New York City.
TLC has developed a program to make sure that New Yorkers who use wheelchairs are safe and properly secured while riding inside licensed vehicles by providing training and refresher courses to all TLC drivers.
Every New Yorker is entitled to safety. Vision Zero is one aspect of the City’s commitment to ensuring every New Yorker has equal access to City streets.

VISION ZERO YEAR ONE REPORT 54EMBRACING DATA-DRIVEN SOLUTIONS
Embracing Data-Driven Solutions
Data-sharing portals promote collaboration between agencies and with the greater public.
The Vision Zero data working group was created to develop projects that focused on data-driven results.
New Yorkers provided over 10,000 intersection-specific recommendations through the Vision Zero Input map. By clicking and commenting on trouble spots on a map to indicate where they observed dangerous behaviors such as speeding, red light running, and other safety challenges, residents helped author the Borough Pedestrian Safety Action Plans which outline DOT and NYPD’s priorities in the years ahead.
The working group was also responsible for the creation and continued operation of the Vision Zero View map, which is the first time that the City of New York has provided everyone the opportunity to review their neighborhood’s safety record in a clear and comprehensible format. This interactive web app displays safety improvements that the City has completed as part of the Vision Zero initiative and also provides the locations for injury and fatality crashes over a five year timeframe. The map also highlights Vision Zero initiatives, from large engineering projects to speed bumps. Vision Zero View allows New Yorkers to assess the City’s progress in pursuit of Vision Zero—identifying trends in injuries and fatalities, along with safety interventions and outreach projects implemented in their own neighborhoods. This transparency, and the accountability it promotes, will help maintain the City’s momentum in achieving Vision Zero.
The City also underwent a major upgrade in public crash reporting. Before 2014, NYPD crash information was released monthly only in non-machine readable formats on NYPD’s website. Now crash information is publicly available via a daily feed in developer friendly formats so collisions and potential fatalities can be tracked by the public.
The Department of Health and Mental Hygiene (DOHMH) expanded its Environment & Health Data portal to include data on pedestrian and bicyclist injuries. The portal allows users to view hospital-visit data based on the injured person’s neighborhood of residence, to look at trends, to generate maps, and to better understand health disparities. Such features were previously not available for traffic injury data in New York City.

VISION ZERO YEAR ONE REPORT 55EMBRACING DATA-DRIVEN SOLUTIONS
The Health Department continues to develop data reports that describe the burden of traffic injuries in New York City. The 2013 Child Fatality Report, for example, featured traffic injuries as the leading cause of injury death among children 5-14 years old.
In the coming year, DOHMH will launch a project to link traffic crash data with injury-specific information from hospital records, which will provide a better understanding of traffic crashes and their resulting injuries. This is the first time these two data sets have been analyzed together in New York City and will help identify new tactics for making city streets safer. DOHMH will develop a new dataset that links traffic crashes and hospitalization data to describe patterns and risk factors for traffic-related injuries. It will also identify priority topics for research and evaluation of Vision Zero efforts.
To use the portal, visit: nyc.gov/health/tracking and click on “Enter the NYC Environment & Health Data Portal.”
Go to vzv.nyc to view the map.

VISION ZERO YEAR ONE REPORT 56PUBLIC ENGAGEMENT, EDUCATION, AND OUTREACH
YEAR ONE
Public Engagement, Education, and Outreach
Vision Zero cannot be attained through City leadership alone.
In 2014, NYPD and DOT launched Vision Zero street teams, an innovative approach which closely integrates education with enforcement. Teams of NYPD and DOT staff work together to identify corridors with significant crash history, along with the causes of those crashes. NYPD and DOT staff then spend a week distributing tens of thousands of fliers to pedestrians and drivers with safety tips, addressing the most common causes of those serious crashes. The following week, NYPD focuses its enforcement resources on those traffic violations which cause serious crashes along that same corridor. These teams have been deployed in every corner of the City. These teams also conducted extensive public outreach campaigns across the City, publicizing this new law in support of the new 25 MPH speed limit legislation.
Classroom Education
DOT worked with the Department of Education (DOE) to provide educational services at 620 elementary, middle, and high schools in 2014. Two-thirds of these schools participated in the comprehensive eight to ten day safety education program promoting safety on foot, in cars and on bikes. The curriculum integrates safety lessons with core curricular goals. Students in the remaining schools participated in an assembly program, with musical theater and on-stage demonstrations. Children and youth are also given the tools to engage their parents on traffic safety.
DOT and DOE also work with schools in which a student has been killed in a traffic crash, even if the crash occurred far from the school grounds. DOT’s role is to identify and resolve safety issues which are unique to that school. This program provides lasting relationships between the school administration, educators, and parents which contribute to improved safety for years to come.
DOT worked with
the Department of
Education (DOE) to
provide educational
services at 620
elementary, middle, and
high schools in 2014.

VISION ZERO YEAR ONE REPORT 57PUBLIC ENGAGEMENT, EDUCATION, AND OUTREACH
NYPD Chief Chan and DOT Director of Vision Zero Operations Ron Whittaker inform drivers about the new speed limit.
Street Teams engage the public in a conversation about safety and distribute educational materials.

HEADERVISION ZERO YEAR ONE REPORT 58
Vision Zero Pedestrian Safety Workshop in Queens, held on May 21, 2014.
Making Vision Zero a reality will entail much more than just engineering, education, and enforcement.
It’s a collaborative effort that will require every New Yorker to play their part.

VISION ZERO YEAR ONE REPORT 59PUBLIC ENGAGEMENT, EDUCATION, AND OUTREACH
Vision Zero Media Campaigns
The City launched several major media campaigns to support Vision Zero messaging and reduce dangerous driving.
May 2014
The Reckless Driving Kills campaign debuts. This campaign features family members who lost loved ones to crashes caused by dangerous drivers. The campaign has been featured throughout the city on bus shelters, billboards, online, on the radio, on Taxi TV, in movie theaters and at Yankees, Nets, and Mets home games.
Your choices matter.
“A driver’s choice killed my fiancée.”
– David Shephard
Your choices matter.
“A driver’s choice killed my son.”
– Audrey Anderson
“�My�son,�Andre,�was�killed�by�a�reckless�driver�riding�his�bicycle�on�Shorefront�Parkway.�I�keep�his��memory�alive.”– Audrey Anderson
Reckless�driving�kills. Learn more at�on.nyc.gov/recklessdriving

VISION ZERO YEAR ONE REPORT 60PUBLIC ENGAGEMENT, EDUCATION, AND OUTREACH
July 2014
The Health Department releases a hard-hitting campaign on the effects of excessive drinking and incorporates a Vision Zero message. The campaign encourages peers to intervene when friends drink too much alcohol, and one of its visuals is presented from the point of view of a motor vehicle driver or passenger and depicts a possibly intoxicated pedestrian. Campaign ads were placed in subway cars and ferry terminals, on mobile apps and websites, in bars, and in stores.

VISION ZERO YEAR ONE REPORT 61PUBLIC ENGAGEMENT, EDUCATION, AND OUTREACH
November 2014
Your Choices Matter is unveiled. The campaign uses graphic and powerful images to emphasize the serious consequences of hazardous driving choices. The data-driven and focus group–tested approach guided the placement of the ads on bus shelters, newsstands, billboards, and gas station banners. This is the first phase of a long-term marketing strategy to build awareness of Vision Zero and to persuade New Yorkers to make more careful choices.

VISION ZERO YEAR ONE REPORT 62PUBLIC ENGAGEMENT, EDUCATION, AND OUTREACH
Research and Collaboration with Academia and the Private Sector
Agencies also reached out to private and public institutions in order to promote new research and collaboration.
The Health Department’s Center for Health Equity released the Getting to School report, which describes how sixth-grade students travel to school and factors that affect their transportation choices. Researchers surveyed students and principals and held focus groups with parents in neighborhoods with high rates of childhood obesity, including East and Central Harlem, North and Central Brooklyn, and the South Bronx. The Getting to School report provides findings, recommendations, and resources to increase active transportation to school, such as walking, biking, or riding a scooter. One of the report’s findings was that most students live close to school, and 60% usually walk, but only 1% use other forms of active transportation.
With Columbia University’s Center for Injury Epidemiology and Prevention, the Health Department co-hosted a symposium on traffic safety research. The symposium brought together more than 50 people from academic institutions, health care facilities, and City agencies to promote collaboration and to share the latest research on public health approaches to traffic safety.
The Health Department
found that most
students live close
to school, and 60%
usually walk, but only
1% use other forms of
active transportation.
To read the report, visit: http://www.nyc.gov/html/doh/downloads/pdf/dpho/getting-to-scool.pdf

VISION ZERO YEAR ONE REPORT 63PUBLIC ENGAGEMENT, EDUCATION, AND OUTREACH
In May 2014, DCAS and the Department of Parks and Recreation (DPR) co-hosted the 26th Annual Fleet and Equipment Show at the Unisphere in Flushing Meadows Corona Park. Nearly 150 vendors attended to display the latest in vehicle and fleet technology. For the first time, the fleet show featured a Vision Zero “Safe Passage,” an area at the center of the event focused on products and services addressing vehicle safety and risk management. In May 2015, DCAS will host the 27th Annual Show and will be expanding Vision Zero-themed programming.
DCAS, in partnership with DOT, also hosted the first Vision Zero Fleets Safety Forum at the Queens Theatre in Flushing Meadows Corona Park. More than 350 participants from private sector fleets in the New York area (including retail delivery, waste management, rentals, and bus transportation) met and shared best practices and technologies. This forum featured speakers and panelists from MTA, the National Waste Management Association, Con-way Trucking, Verizon, FreshDirect, Dash Labs, Transportation Alternatives, and other organizations. More than 20 vendors displayed vehicle safety technology products and services such as driver alert systems and backup cameras. Leading up to the event, a survey was conducted of private sector fleet managers to understand what current safety initiatives private fleets were working on.
In May 2014, DCAS and DPR co-hosted the 26th Annual Fleet and Equipment Show at the Unisphere in Flushing Meadows Corona Park.

VISION ZERO YEAR ONE REPORT 64PUBLIC ENGAGEMENT, EDUCATION, AND OUTREACH: THE ROAD AHEAD
PUBLIC ENGAGEMENT, EDUCATION, AND OUTREACH
The Road Ahead
New Comprehensive Media Campaign
The City will spearhead an expanded and new advertising campaign to encourage a culture of safety among all New Yorkers. Building on the “Your Choices Matter” campaign, the Vision Zero Task Force will expand the campaign to reach more audiences through more forms of media. This expansion will be guided by the crash data. Placement will prioritize neighborhoods which have higher pedestrian crash rates and the safety messages will be aligned with the crash data. For example, failure to yield will be a main message for Manhattan placements.
Emphasizing the Health Benefits of Safer Streets
To apply the findings of the Getting to School report, DOHMH will partner with 20 schools to pilot strategies to improve safety, walkability and opportunities for active living. In addition to this youth-focused education effort, DOHMH will study optimal traffic safety messaging for older adults.
Research and Collaboration with Academia and the Private Sector
DCAS and DOT will be working on additional events and ways to engage and partner with private fleets in 2015.

HEADERVISION ZERO YEAR ONE REPORT 65
Vision Zero Nationwide
New York City is inspiring other great American cities to take up the Vision Zero challenge.
Vision Zero is truly an idea whose time has come. New York City drew its inspiration for Vision Zero from the Swedish engineering philosophy that no traffic fatality is acceptable or necessary. New York City’s focus on creating safe, livable streets is part of a national movement that is taking hold in other cities across the United States. As of early 2015, cities such as Austin, Portland, Oregon, San Francisco, and Chicago have adopted a Vision Zero program or other comprehensive policies designed to reduce pedestrian fatalities in cities.
As these cities continue to develop and finalize their Vision Zero project plans, every city will be able to rely on the best practices developed nationwide.
New York City will continue to apply innovative tools and thinking toward further reducing traffic fatalities and creating safer streets.

VISION ZERO YEAR ONE REPORT 66CITY FLEET
YEAR ONE
City Fleet
New York City operates the largest municipal fleet in the country.
With over 27,000 vehicles and 80,000 full or part time drivers, the City’s fleet plays a critical role in Vision Zero. Led by the Department of Citywide Administrative Services (DCAS), the New York City Fleet is leading by example with new Citywide initiatives in training, vehicle features, telematics and reporting to improve safety.
Defensive Driving
For the first time, defensive driving training is being provided to all City-authorized drivers through DCAS. In the first year of this initiative, more than 12,000 City employees completed the training. DCAS trains over 1,000 staff monthly at more than 40 agencies including Parks, Sanitation, Health, and Education with training sessions occurring daily. As part of this program, DCAS also established the first Citywide Authorized Driver’s list to help monitor the training initiative. This day-long training focuses on safe driving practices and discusses Vision Zero. DCAS will provide the training to all City employees who operate City fleet vehicles except uniformed Fire and Police officers, who receive separate training tied to emergency response.
Protecting Pedestrians and Cyclists with Sideguards
In 2014, DCAS and the U.S. DOT Volpe Center partnered to conduct detailed technical research on truck side guards, a structural feature found to prevent serious crashes common on trucks in the United Kingdom, Brazil, and other countries, but very rarely used in North America. The report included an analysis of various truck side guard designs, recommended specifications for the installation of side guards on the City-owned fleet vehicles, and discussed the success rate of side guards. Drawing from this research and report, DCAS will run a pilot initiative installing truck side guards into select City fleet vehicles. In 2015, DCAS will continue its relationship with the Volpe Center to study the

VISION ZERO YEAR ONE REPORT 67CITY FLEET
possible application of other safety technologies, including additional backup cameras and driver alert systems in City-owned vehicles. NYC DOT will also be using the DCAS-Volpe agreement to study issues related to private trucking policies in New York City, collectively known as “freight mobility.”
Speed and Safety Tracking in City Vehicles
Working with more than 40 City agencies, DCAS is leading an effort to install tracking units in City vehicles. These units, called CANceivers, will help the City study speeding behavior as well as hard braking, acceleration, and seatbelt use. DCAS will establish safety reporting standards that create a framework for City agencies to use the data compiled by the CANceivers to improve safe driving performance and prevent collisions. Through the end of December 2014, these units have been installed on more than 15,000 City vehicles, with new installations continuing daily.
In 2014, DCAS began installing truck side guards across the City fleet.

VISION ZERO YEAR ONE REPORT 68CITY FLEET
Collision Management (CRASH) System
For the first time, City agencies will track and manage all fleet collisions and incidents using a common Citywide database, allowing for performance reporting and trend analysis. CRASH is now operational for non-uniformed agencies, and the rollout will be completed with the uniformed agencies in 2015.
Safe Fleet Transition Plan
DCAS has established an inter-agency team to prepare the City’s first Safe Fleet Transition Plan (SFTP). This plan will identify short term and long term steps the City can take to ensure that City vehicles are designed for the safest operation possible. The team has met with several vendors and vehicle manufacturers to assess technologies such as driver and pedestrian alert systems, safety cameras, and mirrors, and will be testing these technologies as the plan is further developed.
CANceivers are being installed in all City vehicles and will help the City study speeding behavior as well as hard braking, acceleration, and seatbelt use.

VISION ZERO YEAR ONE REPORT 69CITY FLEET: THE ROAD AHEAD
CITY FLEET
The Road Ahead
In Year One, DCAS assessed and developed preliminary recommendations for technology upgrades to the City fleet that make these vehicles safer.
A focus of the effort to develop technology upgrades was the installation of truck side guards. In Year Two, DCAS will roll out a 200+ unit pilot for truck side guards across the City fleet. DCAS will also continue to collaborate with outside partners to test and pilot other technologies in order to improve safety in City fleet vehicles.
Celebrating Safe Driving by City Employees
DCAS will recognize safe operators among City fleet drivers through its “Good Operator” awards in Year Two to support future safe driving practices. Additionally, as part of the ongoing defensive driving initiative, the Department will survey City fleet drivers on their perceptions of safety and safe driving. Their answers will provide feedback from on-the-ground professionals to the Task Force about successes and areas for improvement.
Chief fleet officer Keith Kerman presents Vision Zero initiatives to citywide field managers.

HEADERVISION ZERO YEAR ONE REPORT 70

VISION ZERO YEAR ONE REPORT 71YEAR TWO INITIATIVES
VISION ZERO YEAR TWO
New Initiatives
Year Two will see a continuation of Year One initiatives as well as the launch of 40 initiatives that will complement and enhance on-going Vision Zero progress.
City Hall/Interagency Efforts
• Promote a new outreach and enforcement campaign of the new 25 MPH limit – Operation Drive 25 (NYPD, DOT, TLC, DCAS)
• Develop and execute a comprehensive Vision Zero media campaign (DOT, NYPD, TLC, DOHMH, DCAS, City Hall)
• Expand collaboration with new partners, including the District Attorneys’ offices, the Metropolitan Transportation Authority (MTA), and the New York State Department of Motor Vehicles (DOT, NYPD, TLC, DOHMH, DCAS, City Hall)
New York Police Department
• Deploy dedicated enforcement on priority intersections and corridors and deploy dedicated resources to NYPD precincts that overlap substantially with priority areas as outlined in borough plans
• Increase training, awareness, and outreach to address Administrative Code 19-190, a law creating a criminal misdemeanor penalty for New York City drivers who injure or kill pedestrians or cyclists with the right of way
• Implement and test a new model of enforcement that increases enforcement in areas both with high traffic fatalities/injuries and with high crime rates
• Pilot a program to allow Traffic Enforcement Agents to respond to motor vehicle collisions involving only property damage
• Examine the feasibility of implementing a program to allow civilian members of the NYPD to work in the Intoxicated Driver Testing Unit
• Increase outreach, education, and enforcement on motorcycle registration and the prohibition of dangerous and stunt behavior of motorcyclists
• Increase large vehicle education and enforcement within police precincts and focus on truck safety education for drivers, pedestrians, and cyclists (with DOT)

VISION ZERO YEAR ONE REPORT 72YEAR TWO INITIATIVES
Department of Transportation
• Identify priority corridors, intersections, and areas (with NYPD)
• Target safety education at priority corridors and priority areas (with NYPD)
• Implement 50 Vision Zero safety engineering improvements annually at priority corridors, intersections, and areas citywide, informed by outreach findings at project locations
• Implement Vision Zero Great Streets
• Significantly expand exclusive pedestrian crossing time through the use of leading pedestrian intervals (LPIs) on all feasible priority corridors and priority intersections by end of 2017
• Modify signal timing to reduce off-peak speeding on all feasible priority corridors by the end of 2017
• Install expanded speed limit signage on all priority corridors in 2015
• Drive community input and engagement at priority corridors, intersections, and areas
• Expand a bicycle network that improves safety for all road users (including at least 5 miles per year of protected bike paths)
• Release motorcyclist crash study and list of proposed action items to aid in preventing future crashes
• Conduct study on severe injury and fatal bicyclist crashes and issue list of proposed action items to aid in preventing future crashes (with DOHMH and NYPD)
• Install 75 Accessible Pedestrian Signals (APS) per year beginning in 2016 and develop additional accessibility measures
• Complete deployment of speed cameras and implement the majority of speed camera locations at priority corridors, intersections, and areas
• Continue to expand off-hours program schedule for trucks and large vehicles to reduce truck conflicts with pedestrians and cyclists
• Partner with NYPD and MTA to develop and complete a study on large vehicles and use truck and large vehicle crash data to identify truck enforcement priority areas (with NYPD, MTA)
• Proactively design for pedestrian safety in high-growth areas, including locations in the Housing New York plan
• Target street team outreach at priority corridors, intersections, and areas (with NYPD)

VISION ZERO YEAR ONE REPORT 73YEAR TWO INITIATIVES
Taxi and Limousine Commission
• Develop a system to communicate safety information to TLC-licensed drivers
• Advocate for a change in the New York State seatbelt law to remove the exemptions for taxis and liveries
• Expand required TLC driver education to car service drivers
• Introduce license renewal course for taxi and car service drivers, providing additional continuing education about safe driving
• Engage taxi fleets and car service bases in promoting safe driving among TLC-licensed drivers
• Create public service announcements (PSAs) to engage passengers in promoting safe driving by TLC licensees and educate partner agencies
Department of Citywide Administrative Services
Department of Health and Mental Hygiene
• Recognize safe operators among City fleet drivers through “Good Operator” awards
• Install the first wave of 240 truck side guards and test their effectiveness
• Survey City fleet drivers regarding their perceptions of safety and safe driving as part of ongoing defensive driving initiative
• Issue guidance on traffic safety messaging for older adults based on formative research
• Create new partnerships with schools and priority neighborhoods that will promote Vision Zero and active living
• Link traffic crash event and hospitalization data to describe patterns and risk factors for traffic-related injuries
• Identify priority topics for research and evaluation of Vision Zero efforts

HEADERVISION ZERO YEAR ONE REPORT 74
Vision Zero means parents can more safely cross the streets with their children, and seniors can walk their neighborhoods more easily. We’re approaching this second year of work with proof these methods work and expanding them to even more neighborhoods.
MAYOR BILL DE BLASIO, JANUARY 14, 2015
DOT Commissioner Polly Trottenberg and Mayor de Blasio discuss the future of New York City streets.

HEADERVISION ZERO YEAR ONE REPORT 75
Appendix

VISION ZERO YEAR ONE REPORT 76INITIATIVE SCORECARD
ID INITIATIVE STATUS
1 Establish a permanent Vision Zero task force in the Mayor’s Office of Operations
Complete
2 Launch a Vision Zero website to gather input from New Yorkers and coordinate information about the City’s Vision Zero plans and upcoming events and provide data
Complete
3 Conduct Vision Zero presentations across the City Complete and Ongoing
4 Publish crash and safety data on a regular basis in user-friendly format(s)
Complete and Ongoing
5 Partner with industry groups and vehicle manufacturers to educate fleet drivers and explore design changes to their automotive fleets
In Progress
6 Lead a state legislative campaign to give the City power over the placement of speed and red-light cameras, power to reduce the citywide speed limit to 25 MPH, and ability to increase the penalties associated with dangerous driver behavior
Complete and Ongoing
ID INITIATIVE STATUS
7 Increase enforcement against dangerous moving violations, including speeding, failing to yield to pedestrians, signal violations, improper turns/disobeying signage, and phoning/texting while driving
Complete
8 Increase speeding enforcement at the precinct level Complete
9 Purchase advanced speed detection equipment (LIDAR guns), upgrade speed detection technology available to precincts and train additional personnel
In Progress
10 Increase the Highway District to 263 personnel In Progress
11 Expand Collision Investigation Squad cases to encompass all crashes with critical injuries.
Complete
12 Modify precinct-level traffic plans to increase focus on pedestrian safety
Complete
13 Update technology for capturing crash data In Progress
14 Enhance training for officers to better record and preserve crash details and site evidence
Complete
15 Broaden recruiting efforts for School Crossing Guards In Progress
City Hall
New York Police Department
YEAR ONE
Initiatives Scorecard

VISION ZERO YEAR ONE REPORT 77INITIATIVE SCORECARD
ID INITIATIVE STATUS
16 Conduct intensive street-level outreach and enforcement on safety problems and traffic laws, focused in areas with known crash histories
Complete and Ongoing
17 Convene monthly meetings of the DOT Traffic Division and the NYPD Transportation Bureau to review traffic safety performance and set strategy for improvement
Complete and Ongoing
18 Develop data-driven citywide enforcement strategy Complete
19 Develop borough-wide safety plans in close coordination with community boards, community organizations, and the Mayor’s Community Affairs Unit
Complete
20 Conduct targeted outreach in 500 schools each year, educating students about protecting themselves as safe pedestrians and working with their families for safer school zones
Complete and Ongoing
21 Complete 50 street improvement projects that enhanced safety by reengineering intersections and corridors
Complete and Ongoing
22 Create 25 new arterial slow zones Complete
23 Implement eight new neighborhood slow zones In Progress
24 Install speed cameras at 20 authorized locations Complete
25 Install 250 speed bumps, including in neighborhood slow zones
Complete and Ongoing
26 Enhance street lighting at 1,000 intersections In Progress
27 Enhance maintenance of street markings In Progress
28 Install traffic signals where needed Complete and Ongoing
29 Implement additional street reconstruction safety projects In Progress
30 Survey national and international best practices to expand potential strategies
Complete and Ongoing
31 Hold workshops for major street design projects Complete and Ongoing
32 Undertake a high-quality ad campaign aimed at reducing speeding, failure-to-yield and other forms of reckless driving
Complete and Ongoing
33 Broaden the message and expand the reach of the “Choices” anti-DWI campaign
Complete and Ongoing
34 Double the number of programmable speed boards for the intensive education/enforcement initiative
Complete and Ongoing
35 Make effective, age-appropriate safety curriculum available to schools throughout the city
In Progress
36 Partner with senior centers to increase communication and get specific feedback from aging New Yorkers about street safety improvements
Complete and Ongoing
37 Increase the number and visibility of hands-on safety demonstrations
Complete and Ongoing
38 Add safety flyers and messaging in DOT mailings such as Alternate Side Parking regulations and construction permits
In Progress
Department of Transportation

VISION ZERO YEAR ONE REPORT 78INITIATIVE SCORECARD
ID INITIATIVE STATUS
39 Issue summonses to TLC drivers identified by red light cameras
Complete and Ongoing
40 Update taxi school to account for new streetscape features and alert drivers to higher-crash street types
Complete
41 Create TLC safety enforcement squad equipped with speed radar equipment to enforce speed and safety regulations
Complete
42 Pilot program to place black box data recorders in TLC-licensed vehicles
In Progress
43 Implement more comprehensive traffic safety curriculum for initial licensees
Complete
44 Create behind-the-wheel driving course for drivers who would benefit from additional instruction
In Progress
45 Pilot technology that alerts passengers and drivers when they are traveling over the speed limit
In Progress
46 Explore in-car technology that limits vehicle speed, warns drivers of impending collisions, or reduces the fare when the driver speeds
Complete
47 Introduce street safety public service annoucements on Taxi TV
Complete and Ongoing
48 Use driver information monitors to send safety reminders to taxi drivers
Complete and Ongoing
49 Add safety flyers and messaging in TLC mailings to drivers Complete and Ongoing
50 Include left turn reminder stickers in TLC licensed vehicles Complete
51 Create publicly accessible “Honor Roll” of safe TLC drivers Complete
52 Enhance enforcement against drivers offering for-hire service without a TLC license
Complete
53 Explore vehicle design requirements to improve safety Complete
54 Pursue City law changes and new TLC rules to increase sanctions on TLC drivers who engage in dangerous behavior
Complete
Taxi and Limousine Commission

VISION ZERO YEAR ONE REPORT 79INITIATIVE SCORECARD
ID INITIATIVE STATUS
55 Ensure all City fleet vehicles are equipped with technology that record speeding and other dangerous driving behaviors by the end of 2014
In Progress
56 Upgrade the collision tracking system for the citywide fleet through the new NYC Fleet Focus system
In Progress
57 Oversee a Citywide expansion of Defensive Driver training courses for all employees driving City vehicles
Complete and Ongoing
58 Recommend safety related devices and designs, such as high visibility vehicles, back-up cameras, and rear wheel side guards, for City vehicles and other vehicles under City regulation
In Progress
ID INITIATIVE STATUS
59 Conduct public health surveillance on traffic-related hospitalizations and fatalities
In Progress
60 Provide Vision Zero Task Force with public health data to help target traffic safety interventions
Complete and Ongoing
61 Include traffic fatalities and injuries and prevention messages in public health reports
Complete and Ongoing
62 Engage community public health partners in promoting Vision Zero goals
In Progress
63 Promote research on walking, driving, motorcycling, and bicycling behaviors and patterns in the city
In Progress
Department of Citywide Administration Services
Department of Health and Mental Hygiene

VISION ZERO YEAR ONE REPORT 80INITIATIVE SCORECARD
ID INITIATIVE Agency
1 Promote a new outreach and enforcement campaign of the new 25 MPH speed limit – Operation Drive 25
NYPD, DOT, TLC, DCAS
2 Develop and execute a comprehensive Vision Zero media campaign
DOT, NYPD, TLC, DOHMH, DCAS, City Hall
3 Expand collaboration with new partners, including the District Attorney’s offices, the Metropolitan Transportation Authority (MTA), and the New York State Department of Motor Vehicles
DOT, NYPD, TLC, DOHMH, DCAS, City Hall
4 Identify priority corridors, intersections, and areas DOT, NYPD
5 Target safety education at priority corridors and priority areas
DOT, NYPD
6 Implement 50 Vision Zero safety engineering improvements annually at priority corridors, intersections, and areas citywide, informed by outreach findings at project locations
DOT
7 Implement Vision Zero Great Streets DOT
8 Significantly expand exclusive pedestrian crossing time through the use of leading pedestrian intervals (LPIs) on all feasible priority corridors and priority intersections by end of 2017
DOT
9 Modify signal timing to reduce off-peak speeding on all feasible priority corridors by the end of 2017
DOT
10 Install expanded speed limit signage on all priority corridors in 2015
DOT
11 Drive community input and engagement at priority corridors, intersections, and areas
DOT
12 Expand a bicycle network that improves safety for all road users (including at least 5 miles per year of protected bike paths)
DOT
13 Release motorcyclist crash study and list of proposed action items to aid in preventing future crashes
DOT
14 Conduct study on severe injury and fatal bicyclist crashes and issue list of proposed action items to aid in preventing future crashes
DOT
15 Install 75 Accessible Pedestrian Signals (APS) per year, beginning in 2016, and develop additional accessibility measures
DOT
YEAR TWO
Initiatives Scorecard

VISION ZERO YEAR ONE REPORT 81INITIATIVE SCORECARD
ID INITIATIVE Agency
16 Complete deployment of speed cameras and implement the majority of speed camera locations at priority corridors, intersections, and areas
DOT
17 Continue to expand off-hours program for commercial deliveries to reduce conflicts with pedestrians
DOT
18 Partner with NYPD and MTA to develop and complete a study on large vehicles and use truck and large vehicle crash data to identify truck enforcement priority areas
DOT, NYPD, MTA
19 Proactively design for pedestrian safety in high-growth areas, including locations in the Housing New York plan
DOT
20 Target street team outreach at priority corridors, intersections, and areas
DOT, NYPD
21 Deploy dedicated enforcement on priority intersections and corridors and deploy dedicated resources to NYPD precincts that overlap substantially with priority areas as outlined in borough plans
NYPD
22 Increase training, awareness, and outreach to address Administrative Code 19-190, a law creating a criminal misdemeanor penalty for New York City drivers who injure or kill pedestrians or cyclists with the right of way
NYPD
23 Implement and test a new model of enforcement that increases enforcement in areas both with high traffic fatalities/injuries and with high crime rates
NYPD
24 Pilot a program to allow Traffic Enforcement Agents to respond to motor vehicle collisions involving only property damage
NYPD
25 Examine the feasibility of implementing a program to allow civilian members of the NYPD to work in the Intoxicated Driver Testing Unit
NYPD
26 Increase outreach, education, and enforcement on motorcycle registration and the prohibition of dangerous and stunt behavior of motorcyclists
NYPD
27 Increase large vehicle education and enforcement within police precincts and focus on truck safety education for drivers, pedestrians, and cyclists
DOT, NYPD
28 Develop a system to communicate safety information to TLC-licensed drivers
TLC
29 Advocate for a change in the New York State seatbelt law to remove the exemptions for taxis and liveries
TLC
30 Expand required TLC driver education to car service drivers
TLC
31 Introduce license renewal course for taxi and car service drivers, providing additional continuing education about safe driving
TLC
32 Engage taxi fleets and car service bases in promoting safe driving among TLC-licensed drivers
TLC

VISION ZERO YEAR ONE REPORT 82INITIATIVE SCORECARD
ID INITIATIVE Agency
33 Create public service announcements (PSAs) to engage passengers in promoting safe driving by TLC licensees and educate partner agencies
TLC
34 Recognize safe operators among City fleet drivers through “Good Operator" awards
DCAS
35 Install the first wave of 240 truck side guards and test their effectiveness
DCAS
36 Survey City fleet drivers regarding their perceptions of safety and safe driving as part of ongoing defensive driving initiative
DCAS
37 Issue guidance on traffic safety messaging for older adults based on formative research
DOHMH
38 Create new partnerships with schools and priority neighborhoods that will promote Vision Zero and active living
DOHMH
39 Link traffic crash event and hospitalization data to describe patterns and risk factors for traffic-related injuries
DOHMH
40 Identify priority topics for research and evaluation of Vision Zero efforts
DOHMH

VISION ZERO YEAR ONE REPORT 83GLOSSARY
GlossaryAccessible Pedestrian Signals Devices which assist pedestrians who are blind or have low vision in crossing
at a signalized intersection. APS provide information in non-visual formats, such as audible tones, speech messages, and vibrating surfaces to alert blind or low vision pedestrians when the “walk” phase is available at a given intersection
Active transportation Any self-propelled mode of transportation (such as walking, jogging, bicycling, or in-line skating) to get from one place to another
APS Accessible Pedestrian Signals
Arterial A wide high-volume roadway
Arterial Slow Zones The Arterial Slow Zone program uses a combination of a lower speed limit, signal timing changes, distinctive signs and increased enforcement to improve safety on some of New York City's highest-crash corridors
Auxiliary police officer Volunteers who are recruited, trained and equipped by the Police Department to assist their local Police Precincts, Housing Police Service Areas, and Transit Districts, by performing uniformed patrol in their communities
BAC Blood Alcohol Content
BIDS Business Improvement Districts
CANceiver A device mounted in a vehicle that measures the vehicle’s speed, acceleration, and hard breaking events
CIS Collision Investigation Squad
CRASH Collision Management System
DCAS Department of Citywide Administrative Services
DDC Department of Design and Construction
DOE Department of Education
DOHMH Department of Health and Mental Hygiene
DoITT Department of Information Technology & Telecommunications
DOT Department of Transportation

VISION ZERO YEAR ONE REPORT 84GLOSSARY
For-hire vehicle (FHV) For-hire vehicles are vehicles other than taxis, commuter vans, and buses that are licensed by TLC to transport the public. They include community car services (also known as liveries), black cars (which include app-based black cars, such as those dispatched by Uber), and certain luxury limousines
Killed or seriously injured calculation A method of analyzing the potential danger of a corridor or intersection by measuring the number of people killed or seriously injured at that location (calculated as a per mile rate for corridors)
KSI Killed or seriously injured
Leading Pedestrian Interval (LPI) A signal timing strategy designed to reduce turning movement/pedestrian conflicts. With an LPI, the “walking man” signal is displayed prior to the parallel movement of traffic getting a green indication. This allows pedestrians to start their crossing and establish a presence in the crosswalk before the traffic is released
LIDAR gun A light device used by the police for speed limit enforcement. LIDAR guns allow a police officer to measure the speed of an individual vehicle within a stream of traffic
MOPD Mayor’s Office for People with Disabilities
MTA Metropolitan Transportation Authority
Neckdowns Also known as a curb extension. An expansion of the curb line into the lane of the roadway adjacent to the curb for a portion of a block either at a corner or mid-block
Neighborhood Slow Zones Neighborhood Slow Zones are a community-based program that reduces the speed limit to 20 MPH in a select neighborhood area with a combination of markings, signage, and speed bumps. Neighborhood Slow Zones are selected through a competitive application process, and are meant to slow speeds and lower the incidence and severity of crashes in New York City’s residential areas
NHTSA National Highway and Traffic Safety Administration
OMB Office of Management and Budget
PASS Pedestrians for Accessible and Safe Streets
Pedestrian safety island A raised area located at crosswalks that serves as pedestrian refuge separating traffic lanes or directions, particularly on wide roadways
Priority corridor Priority corridors were selected from all corridors (streets measuring at least one mile in length) in each borough and were ranked on a pedestrian KSI per-mile basis. Corridors were selected from the top of this list until the cumulative number of pedestrian KSI reached half of the borough’s total

VISION ZERO YEAR ONE REPORT 85GLOSSARY
Priority intersection Priority intersections were selected from the intersections with the highest number of pedestrian KSI that cumulatively account for 15% of the borough’s total pedestrian KSI
Protected bike path Designated on-street bicycle lanes that are protected from motorized traffic by parked vehicles, barriers, or bollards
PSA Public service announcement
Raised center median A raised area located at crosswalks that serves as a pedestrian refuge separating traffic lanes or directions, particularly on wide roadways
SFTP Safe Fleet Transition Plan
TLC Taxi and Limousine Commission
TLC Safety Honor Roll A list created by TLC of taxi and for-hire vehicle drivers who have, over five years or more, not had a single crash involving injury, a single traffic violation, or a single violation of TLC safety-related rules
TrafficStat Weekly traffic meetings held by NYPD at police headquarters to review motor vehicle, bicyclist and pedestrian crash data
Truck Sideguards Protective pieces added to vehicles that prevent pedestrians, cyclists, and smaller motor vehicles from rolling or falling underneath the body of the truck
Vision Zero View A map that helps the Vision Zero team apply a data driven approach to enforcement, focusing on improvement in the areas that are vulnerable to injuries and crashes. The map aggregates years of fatality and injury data, as well as displays a variety of other metrics, including injuries and fatalities, speed bumps, and slow zones, town hall meetings and schools with safety outreach
Volpe A think tank at the U.S. Department of Transportation that DCAS has partnered with to study truck design, including the installation of truck side guards

VISION ZERO YEAR ONE REPORT 86HELPFUL LINKS
Vision Zero Helpful Links
Vision Zero website
nyc.gov/visionzero
Vision Zero View Map
vzv.nyc
DOHMH 2013 Child Fatality Report
http://www.nyc.gov/html/doh/downloads/pdf/ip/ip-nyc-inj-child-fatality-report13.pdf
DOHMH Environment and Health Data Portal
nyc.gov/health/tracking
DOHMH Getting to School Report
http://www.nyc.gov/html/doh/downloads/pdf/dpho/getting-to-scool.pdf
Taxi Honor Roll
nyc.gov/html/tlc/html/industry/tlc_safety_honor_roll.shtml
TLC Buckle-up PSA
youtu.be/a52aLC-H6eg?list=UUnhkXx3nyVrPNJAy5FAG7mw
NYPD Traffic Summonses Report
nyc.gov/html/nypd/html/traffic_reports/traffic_summons_reports.shtml
Vision Zero Borough Pedestrian Safety Action Plans
http://www.nyc.gov/html/dot/html/pedestrians/ped-safety-action-plan.shtml

VISION ZERO YEAR ONE REPORT 87TASK FORCE
Vision Zero Task Force
Task Force Members
Website Working Group
Data Analytics Working Group
Michael Adame, Mayor’s Office of Operations
Shawn Alsop, NYPD
Anna Caffarelli, DOHMH
Marco A. Carrion, Mayor’s Office, Community Affairs Unit
Chief Thomas Chan, NYPD
Nancy Clark, DOHMH
Benjamin Furnas, Office of the Mayor
Inspector Dennis Fulton, NYPD
Toni Gantz, Law Department
Brady Hamed, Mayor’s Office of Operations
Jill Hoexter, New York County District Attorney’s Office
Keith Kerman, DCAS
Steven Levi, Law Department
Stephen Malmberg, OMB
Vanessa Morris, OMB
Juan Martinez, DOT
Joseph McCormack, Bronx District Attorney’s Office
Dawn Miller, TLC
Nancy Savasta, Law
Joshua Sidis, Mayor’s Office of Operations
Sherif Soliman, Office of the Mayor, State Legislative Affairs
Geraldine Sweeney, Mayor’s Office of Operations
Ashley Thompson, Mayor’s Office, City Legislative Affairs
Katherine Unger, Mayor’s Office, Community Affairs Unit
Stephen Vidal, Metropolitan Transit Authority
Kim Wiley-Schwartz, DOT
Shawn Alsop, NYPD
Anna Caffarelli, DOHMH
Neil Freeman, DOT
Inspector Dennis Fulton, NYPD
Lawrence Fung, DOHMH
Brady Hamed, Mayor’s Office of Operations
Mahanth Joishy, DCAS
Chris Long, DoITT
Karen Martin, TLC
Joshua Sidis, Mayor’s Office of Operations
Geraldine Sweeney, Mayor’s Office of Operations
Kim Wiley-Schwartz, DOT
Mary Wilson, Mayor’s Office of Operations
Hassan Adekoya, DOT
Ann Marie Doherty, DOT
Parry Drew, DOT
Jason Fitzsimmons, DOT
Lawrence Fung, DOHMH
Seth Hostetter, DOT
Dawn Miller, TLC
Nick O’Brien, Mayor’s Office of Data Analytics
James Perazzo, Mayor’s Office of Operations
Colin Reilly, DoITT
Joshua Sidis, Mayor’s Office of Operations
Geraldine Sweeney, Mayor’s Office of Operations
Rob Viola, DOT
Doug Williamson, DoITT

VISION ZERO YEAR ONE REPORT 88TASK FORCE
Front Row (left to right): Keith Kerman, DCAS; Brady Hamed, Mayor’s Office of
Operations; Katherine Unger, Mayor’s Office, Community Affairs Unit; Rob Viola, DOT;
Vanessa Morris, OMB; Anna Caffarelli, DOHMH
Back Row (left to right): Stephen Vidal, MTA; Michael Adame, Mayor’s Office of
Operations; Juan Martinez, DOT; Walter Orlowski, MTA; Zafira Lateef, MTA;
Steven Levi, Law Department; Nancy Clark, DOHMH; Geraldine Sweeney, Mayor’s
Office of Operations; Chief Thomas Chan, NYPD; Shawn Alsop, NYPD;
Lawrence Fung, DOHMH; Ann Marie Doherty, DOT; Jill Hoexter, New York County
District Attorney’s Office; Kim Wiley-Schwartz, DOT; Joseph McCormack, Bronx
District Attorney’s Office; Mahanth Joishy, DCAS
Not pictured: Marco A. Carrion, CAU, Inspector Dennis Fulton, NYPD;
Benjamin Furnas, Office of the Mayor, Toni Gantz, Law; Stephen Malmberg, OMB;
Dawn Miller, TLC; Sherif Soliman, Office of the Mayor, State Legislative Affairs;
Ashley Thompson, Office of the Mayor, City Legislative Affairs
Vision Zero Task Force

IMAGES:
NYC DOTPages: Cover, 4, 6, 10, 12, 18, 19, 20, 22, 24, 25, 26, 27, 28, 31, 32, 34, 38, 43, 44, 47, 53, 55, 58, 59, 60, 61 65, 65 70, 74, 87, Back Cover
NYPDPages: 40, 57
TLCPages: 41, 48
DCASPages: 67, 68
DOHMHPage: 62
REPORT DESIGN: Carly Clark

HEADERVISION ZERO YEAR ONE REPORT 90
Crashes are preventable. Together, we can save lives.