online class imbalance learning and its applications in
TRANSCRIPT

ONLINE CLASS IMBALANCE LEARNING
AND ITS APPLICATIONS IN FAULT DETECTION
SHUO WANG*, LEANDRO L. MINKU†
and XIN YAO‡
CERCIA, School of Computer Science
University of Birmingham
Birmingham, B15 2TT, UK*[email protected]
†[email protected]‡[email protected]
Received 21 July 2013
Revised 30 August 2013
Published 16 December 2013
Although class imbalance learning and online learning have been extensively studied in theliterature separately, online class imbalance learning that considers the challenges of both ¯eldshas not drawn much attention. It deals with data streams having very skewed class distribu-tions, such as fault diagnosis of real-time control monitoring systems and intrusion detection incomputer networks. To ¯ll in this research gap and contribute to a wide range of real-worldapplications, this paper ¯rst formulates online class imbalance learning problems. Based on theproblem formulation, a new online learning algorithm, sampling-based online bagging (SOB),is proposed to tackle class imbalance adaptively. Then, we study how SOB and other state-of-the-art methods can bene¯t a class of fault detection data under various scenarios and analyzetheir performance in depth. Through extensive experiments, we ¯nd that SOB can balance theperformance between classes very well across di®erent data domains and produce stableG-meanwhen learning constantly imbalanced data streams, but it is sensitive to sudden changes in classimbalance, in which case SOB's predecessor undersampling-based online bagging (UOB) is morerobust.
Keywords: Online class imbalance; resampling; fault detection.
1. Introduction
Online learning has been extensively studied and applied in recent years. It refers to
learning from data streams where data arrive continuously and a timely response is
required. Strictly speaking, online learning algorithms process each training example
once \on arrival" without the need for storage and reprocessing, and maintain a
current model that re°ects the current concept to make a prediction at each time
step.1 The online learner is not given any process statistics for the observation se-
quence, and thus no statistical assumptions can be made in advance.2 Online learning
has contributed to various real-world applications, such as sponsored search from
web click data,3 credit card transactions4 and spam ¯ltering.5,6
International Journal of Computational Intelligence and ApplicationsVol. 12, No. 4 (2013) 1340001 (19 pages)
#.c Imperial College Press
DOI: 10.1142/S1469026813400014
1340001-1

In many of such data stream applications, skewed class distributions exist and
cause great learning di±culties, such as fault diagnosis of control monitoring systems
and fault detection in software engineering. In these cases, some classes of data are
much more di±cult or expensive to be collected than the other classes, referred to
as class imbalance. Given such imbalanced data streams, existing online learning
algorithms can su®er severe performance degradation, since the large number of
majority-class examples overwhelms the incremental update of the model and
minority-class examples are likely to be ignored.7 Unfortunately, most existing
solutions for class imbalance are restricted to the o®line mode.
Very little work has been devoted to learning from skewed data streams online.
New challenges arise in online class imbalance learning, such as imbalance rate
estimation,8 concept drift detection in imbalanced data streams9 and online leaning
techniques to overcome class imbalance.8,10 Although a few learning algorithms have
been proposed for imbalanced data streams very recently, some essential questions
are still open. Focusing on the fundamental concepts of online learning and class
imbalance learning, this paper will answer the following research questions: what is
the formal de¯nition of online class imbalance learning? Based on the formal de¯-
nition, how should we tackle class imbalance e®ectively during the online processing?
How would online class imbalance algorithms contribute to real-world applications?
What are their advantages and disadvantages?
For the ¯rst two questions, we formulate online class imbalance problems with the
objective of maximizing G-mean, based on which we develop a learning algorithm
called sampling-based online bagging (SOB) to deal with class imbalance and make
real-time predictions. SOB introduces sampling techniques into online bagging-
algorithm (OB),1 in which the sampling rate is determined adaptively based on
the current imbalance status and classi¯cation performance. With the theoretical
underpinning, it is expected to outperform its earlier versions oversampling-based
online bagging (OOB) and undersampling-based online bagging (UOB).8 For the last
two questions, we examine the performance of SOB, OOB, UOB and two other
recently proposed algorithms on a set of fault detection problems from real-world
projects. Fault detection has drawn growing interest from both academia and in-
dustry. A good fault detection method can automate engineering procedures, reduce
unnecessary costs and prevent fault events that may cause severe system failure. A
typical fault detection task is inherently imbalanced between classes, which aims to
distinguish faulty examples (minority) from nonfaulty examples (majority) accu-
rately. Since class imbalance methods have shown bene¯ts to o®line fault detection
applications,11 this paper studies their role in online scenarios. Through compre-
hensive experimental discussions, we ¯nd that SOB can balance the performance
between classes very well across di®erent data domains and produce stable G-mean
under static scenarios. However, it is sensitive to data sequences, especially when
there is a sudden change in class imbalance. UOB, by contrast, is more robust against
this situation. An in-depth analysis is given.
S. Wang, L. L. Minku & X. Yao
1340001-2

The rest of this paper is organized as follows. Section 2 gives the background
knowledge about class imbalance learning and research progress in learning from
imbalanced data streams, and describes fault detection problems. Section 3 gives the
problem formulation of online class imbalance learning. Section 4 proposes the new
online learning algorithm SOB. Section 5 discusses its performance in fault detection
data sets in comparison with other existing algorithms. Section 6 draws the con-
clusions and points out our future work.
2. Background
In this section, we ¯rst introduce class imbalance learning and the state-of-the-art
methods in this area. Then, we brie°y review the current research progress in lear-
ning from imbalanced data streams. Finally, we describe the classi¯cation problem of
fault detection and explain how class imbalance learning can contribute to this type
of tasks.
2.1. Class imbalance learning
Class imbalance learning refers to learning from data sets that exhibit signi¯cant
imbalance among or within classes. The common understanding about \imbalance"
in the literature is concerned with the situation, in which some classes of data are
highly under-represented compared to other classes.7 By convention, we call the clas-
ses having more examples the majority classes, and the ones having fewer examples
the minority classes. The recognition of minority class is more important, because
misclassifying an example from the minority class is usually more costly.11
The challenge of learning from imbalanced data is that the relatively or absolu-
tely underrepresented class cannot draw equal attention to the learning algorithm
compared to the majority class, which often leads to very speci¯c classi¯cation rules
or missing rules for the minority class without much generalization ability for future
prediction.12 How to better recognize data from the minority class is a major research
question in class imbalance learning. Its learning objective can be generally described
as \obtaining a classi¯er that will provide high accuracy for the minority class
without severely jeopardizing the accuracy of the majority class".13
Numerous methods have been proposed to tackle class imbalance problems o®line
at data and algorithm levels. Data-level methods include a variety of resampling
techniques, manipulating training data to rectify the skewed class distributions, such
as random over/under-sampling, SMOTE14 and some dynamic sampling approa-
ches.15 Algorithm-level methods address class imbalance by modifying their training
mechanism directly with the goal of better accuracy on the minority class, including
one-class learning16 and cost-sensitive learning algorithms.7,17 In addition, ensemble
learning18 has become another major category of approaches to handling imbalanced
data by combining multiple classi¯ers, such as SMOTEBoost,19 AdaBoost.NC20,21
Online Class Imbalance Learning
1340001-3

and the multi-objective genetic programming ensemble.22 Although class imbalance
learning has been extensively studied, none of the proposed methods can process
imbalanced data online.
In class imbalance learning, the traditional accuracy metric measuring the per-
centage of correctly classi¯ed examples is not appropriate for performance evaluation
anymore, because it can be overwhelmed by the high accuracy on the majority class
and hide the poor performance on the minority class. Instead, recall and G-mean are
more frequently used. Recall measures the accuracy of recognizing a speci¯c class of
data. Minority-class recall tells us how many minority-class examples can be cor-
rectly identi¯ed. However, it does not provide any performance information of other
classes. To measure the overall accuracy, G-mean calculates the geometric mean of
recalls over all classes.23 More details will be given in Sec. 3.
2.2. Learning from imbalanced data streams
Most existing algorithms dealing with imbalanced data streams require processing
data in batches (incremental learning). The ¯rst attempt was made by Gao et al.24,25
They proposed an uncorrelated bagging strategy, based on the subset of majority-
class data in the current data chunk and the union of all minority-class data collected
thus far. Wang et al. proposed an ensemble algorithm based on clustering and
sampling,26 in which K-means clustering algorithm is used to undersample the
majority class in the current data chunk. Chen et al. proposed SERA27 and its
improved versions MuSeRA28 and REA,29 which selectively add minority examples
from previous chunks into current training chunk to balance data. Because these
methods require access to previous data, they are more suitable to the problem where
the minority data concept is stationary or historical data can be retained. Lichten-
walter and Chawla proposed a new metric to measure the distance between data
chunks, which is used to weigh the ensemble members learnt from imbalanced data
stream.30 It is shown to be more suitable to extremely complicated data streams with
complex concept drifts and high degrees of imbalance. Ditzler and Polikar proposed
two ensemble approaches, Learnþþ.CDS and Learnþþ.NIE.31 The former applies
the well-established oversampling technique SMOTE14 and the latter uses a Bagging
based sub-ensemble method to rebalance data. They were shown to outperform
earlier methods in general but at the cost of higher computational complexity due to
the oversampling and sub-ensemble strategies.
All the aforementioned methods need to collect full data chunks for training.
Therefore, they cannot be applied to online problems directly. Nguyen et al. pro-
posed an online algorithm to deal with imbalanced data streams based on random
undersampling.10 The majority class examples have lower probability to be selected
for training. It assumes that the information of which class belongs to the minority/
majority is known and the imbalance rate does not change over time. Besides, it
requires a training set to initialize the classi¯cation model before learning. Minku
et al.32 proposed to use undersampling and oversampling to deal with class imbalance
S. Wang, L. L. Minku & X. Yao
1340001-4

in online learning by changing the parameter corresponding to online bagging's
sampling rate. However, the sampling parameters need to be set prior to learning and
cannot be adjusted to changing imbalance rates. Very recently, two perceptron-
based methods RLSACP33 and WOS-ELM34 were proposed to tackle imbalanced
data streams online. They adjust the weights between perceptrons depending on the
class label. A higher weight is assigned to the minority class. They were tested in
static scenarios with ¯xed imbalanced degree. In addition, WOS-ELM requires a
validation set to adjust class weights, which may not be available in many real-world
applications.
2.3. Fault detection problems
Fault detection is an emerging and challenging practical task, aiming to ¯nd faulty
data produced in any engineering systems in either real time or o®line mode, such as
sensor faults in smart buildings35 and robotic systems,36 or identify programming
faults in software engineering in a wider sense.37 For the example of smart buildings
with sensors installed to monitor hazardous events, any sensor fault can cause cat-
astrophic failures. Detecting faults accurately and timely is crucial to the operation
and stability of the overall system. Fault predictors for software engineering also
become popular since 2005 after the PROMISE repository was created.38 PROMISE
includes a collection of fault prediction data sets from real-world applications for
public use, among which the percentage of defective modules varies from 6.94% to
32.29%. An accurate software fault predictor can help to improve software quality
and reduce the cost of delivering software systems.
Fault detection data are inherently imbalanced. In other words, a faulty example
is much less likely to be observed than an example produced from the system in a
normal condition. Obtaining a fault in such systems can be very expensive. Recent
studies have employed cognition and machine learning methods to enhance fault
diagnosis performance o®line, but very few considered the highly imbalanced na-
ture between faulty and nonfaulty classes. The obtained classi¯er tends to perform
poorly in predicting faulty examples due to the rarity of this class. Therefore, it is
worthwhile exploring class imbalance methods to alleviate this learning di±culty.
Although some researchers have noticed the class imbalance issue in fault detection
and attempted to apply class imbalance techniques to improve the prediction ac-
curacy,11,16,39 they are limited to o®line data. Encouraged by their promising results,
this paper explores how class imbalance learning can facilitate fault detection pro-
blems during online processing.
3. Problem Formulation of Online Class Imbalance Learning
Consider an online binary classi¯cation problem. We build an online classi¯er F that
receives a new example xt at each time step t and predicts its class label as yt. After
making the prediction, the classi¯er receives the expected label yt of xt, evaluates its
Online Class Imbalance Learning
1340001-5

loss and gets updated. Both predicted label yt and expected label yt belong to label
set Y ¼ fþ1;�1g. If yt ¼ yt, the prediction is correct. Without loss of generality, we
assume the positive class to be the minority, which is much less likely to occur than
the negative class, such as spam in email ¯lter applications and faults in engineering
systems. The imbalance rate (IR) is de¯ned as the occurrence probability of the
minority class. It is not easy to estimate IR in online scenarios, as we cannot obtain a
whole picture of data and IR can change over time. The IR estimation and perfor-
mance evaluation are usually based on received examples so far.
Given a sequence of training examples with T time steps ðx1; y1Þ; . . . ; ðxT ; yT Þ,we can classify the prediction results from classi¯er F into four categories ��� true
positives (TP) if yt ¼ yt ¼ þ1, true negatives (TN) if yt ¼ yt ¼ �1, false positives
(FP) if yt ¼ þ1 and yt ¼ �1, and false negatives (FN) if yt ¼ �1 and yt ¼ þ1. Basedon these four metrics, recall and G-mean can be calculated, which have been fre-
quently used as performance criteria in class imbalance learning. We use P to denote
the number of positive examples and N to denote the number of negative examples.
Minority-class recall (Rp), majority-class recall (Rn) and G-mean (G) are de¯ned as:
Rp ¼TP
TPþ FN¼ P � FN
P; Rn ¼
TN
TNþ FP¼ N � FP
N;
G ¼ ffiffiffiffiffiffiffiffiffiffiffiffiffiffiffiRp �Rn
p ¼ffiffiffiffiffiffiffiffiffiffiffiffiffiffiffiffiffiffiffiffiffiffiffiffiffiffiffiffiffiffiffiffiffiffiffiffiffiffiffiffiffiffiffiffiffiffiffiffiP � FN
P
� �N � FP
N
� �s:
Minority-class recall is the ratio of the number of correctly classi¯ed minority-
class examples to the number of all minority-class examples, re°ecting the classi¯-
cation accuracy on the minority class. G-mean is the geometric mean of recall of
both classes, an overall performance measure for imbalanced data. Due to di®erent
misclassi¯cation costs, recall and G-mean are more appropriate metrics than the
traditional accuracy. Particularly, G-mean equally considers both classes with easy
calculation.
With the goal of maximizing G-mean, we prove next that maximizing G-mean is
equivalent to minimizing the objective
Xyt¼þ1
N
PIðyt 6¼ ytÞ þ
Xyt¼�1
RpIðyt 6¼ ytÞ; ð1Þ
where I is the indicator function. Then, we propose online learning algorithm ���SOB to achieve this goal.
By expanding the G-mean expression, to maximize G-mean, we need to
minimizeFN
Pþ FP
N� FN �FP
P �N () minimizeN
PFNþ P � FN
PFP:
Thus, we obtain Eq. (1). We can see from the equation that there is a performance
trade-o® between two classes to achieve the best G-mean. It suggests that we need
to consider the current performance of the classi¯er when it is dealing with class
S. Wang, L. L. Minku & X. Yao
1340001-6
imbalance online, in addition to the imbalance rate. Inspired by Eq. (1), we can
handle class imbalance by setting di®erent misclassi¯cation costs – N=P (equivalent
to ð1=IR� 1Þ) for the minority class and Rp for the majority class. In this way, the
minority class will receive a higher cost (� 1) than the majority class. The cost
of majority class will depend on minority-class recall. If Rp is quite high, then the
majority-class cost will not be lowered down that much. It is reasonable, because we
only need to deemphasize the majority class when necessary.
4. Sampling-Based Online Bagging
As one of the most popular methods applying di®erent misclassi¯cation costs in the
learning algorithm, resampling (aka rebalancing) has been theoretically and empi-
rically proved to be an e®ective and simple technique40,41 for making the optimal
decision, which manipulates the number of training examples without any extra
requirements to the applied learning algorithm.
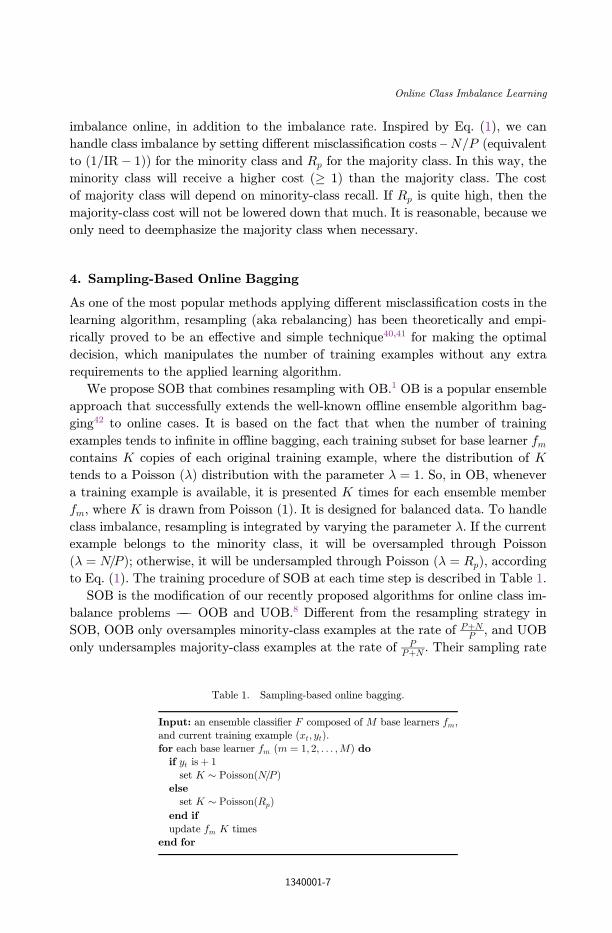
We propose SOB that combines resampling with OB.1 OB is a popular ensemble
approach that successfully extends the well-known o®line ensemble algorithm bag-
ging42 to online cases. It is based on the fact that when the number of training
examples tends to in¯nite in o®line bagging, each training subset for base learner fmcontains K copies of each original training example, where the distribution of K
tends to a Poisson ð�Þ distribution with the parameter � ¼ 1. So, in OB, whenever
a training example is available, it is presented K times for each ensemble member
fm, where K is drawn from Poisson (1). It is designed for balanced data. To handle
class imbalance, resampling is integrated by varying the parameter �. If the current
example belongs to the minority class, it will be oversampled through Poisson
ð� ¼ N=PÞ; otherwise, it will be undersampled through Poisson ð� ¼ RpÞ, accordingto Eq. (1). The training procedure of SOB at each time step is described in Table 1.
SOB is the modi¯cation of our recently proposed algorithms for online class im-
balance problems ��� OOB and UOB.8 Di®erent from the resampling strategy in
SOB, OOB only oversamples minority-class examples at the rate of PþNP , and UOB
only undersamples majority-class examples at the rate of PPþN . Their sampling rate
Table 1. Sampling-based online bagging.
Input: an ensemble classi¯er F composed of M base learners fm,
and current training example ðxt; ytÞ.for each base learner fm (m ¼ 1; 2; . . . ;M) do
if yt isþ 1
set K � PoissonðN=P Þelseset K � PoissonðRpÞ
end if
update fm K times
end for
Online Class Imbalance Learning
1340001-7
only relies on the class size. For a more imbalanced data stream, the resampling
degree will be encouraged more accordingly.
The next key issue is how to determine real-time IR and Rp in SOB. This work
adopts the equations used in OOB and UOB8
wðtÞk ¼ �w
ðt�1Þk þ ð1� �Þ½ðxt; ckÞ�ðk ¼ 1; 2; . . . ; jY jÞ; ð2Þ
RðtÞk ¼ �0R ðt�1Þk þ ð1� �0Þ½xt ck�ðk ¼ 1; 2; . . . ; jY jÞ: ð3Þ
Here wðtÞk denotes the size percentage of class ck 2 Y at time step t (w
ð0Þk ¼ 0). ½ðxt;
ckÞ� ¼ 1 if the true class label yt of xt is ck, otherwise 0. Similarly, Rk stands for the
current recall on class ck. ½xt ck� is equal to 1 if xt is correctly classi¯ed and 0
otherwise. At each time step, wðtÞk and R
ðtÞk are incrementally updated. Coe±cients
� and �0 ð0 < �; �0 < 1Þ are time decay factors that balance the contribution between
newly received examples and historical examples. Smaller time decay factors mean
more focus on current data. The learning system will therefore have higher sensitivity
to dynamic data streams, but less performance stability. If the class distribution of
data streams is roughly known in advance, then it is better to use larger � and � 0 thatcan provide better estimation of w
ðtÞk and R
ðtÞk . Our preliminary experiments suggest
that the reasonable range for � and �0 is ½0:9; 1Þ.8 These equations are applicable
to data streams with arbitrary number of classes. In binary cases, N=P is estimated
by wðtÞ�1=w
ðtÞþ1, and R
ðtÞþ1 is used as Rp.
5. Applications in Fault Detection
Due to the rarity and importance of faults, fault detection in engineering systems is
a typical problem of learning from imbalanced data. This section examines the
performance of proposed algorithm SOB and explores the ability of existing online
class imbalance methods on fault detection applications from real-world projects.
The chosen data sets are highly imbalanced. We design and look into a series of
practical scenarios, including not only data streams that are constantly imbalanced,
but also data streams su®ering short-term °uctuations of class imbalance status.
SOB is compare with its earlier versions OOB and UOB and two most recent state-
of-the-art methods RLSACP33 and WOS-ELM.34
5.1. Data description
Six real-world data sets are used in the experiments. Three of them, i.e., Gearbox,
Smart building and iNemo, are collected in real time from complex engineering
systems. The remaining three, i.e., JM1, KC1 and PC1, come from software engi-
neering tasks, available in PROMISE.38
Gearbox is the fault detection competition data from PHM society 2009.43 The
task is to detect faults in a running gearbox using accelerometer data and infor-
mation about bearing geometry. Data were sampled synchronously from accel-
erometers mounted on both the input and output shaft retaining plates. The original
S. Wang, L. L. Minku & X. Yao
1340001-8
data contain more than one type of faults that can happen to gears and bearings
inside the gearbox. To simplify the problem, we select one type of gear faults ��� the
gear with a chipped tooth, which exists in the helical (spiral cut) gear with 24 teeth.
The data set is thus a 2-class fault detection problem ��� the gear either in good
condition (nonfaulty class) or having a chipped tooth (faulty class).
Smart building is a 2-class fault detection data set, aiming to identify sensor faults
in smart buildings.35 The sensors monitor the concentration of the contaminant
of interest (such as CO2) in di®erent zones in a building environment, in case any
safety-critical events happen. In this data set, the sensor placed in the kitchen can be
faulty. A wrong signal can lead to improper ventilation and unfavorable working
conditions.
iNemo is a multi-sensing platform developed by STMicroelectronics for robotic
applications, human machine interfaces and so on. It combines accelerometers,
gyroscopes and magnetometers with pressure and temperature sensors to provide
3-axis sensing of linear, angular and magnetic motion in real-time, complemented
with temperature and barometer/altitude readings.44 To avoid any functional dis-
ruption caused by signaling faults in iNemo, a fault emulator is developed for pro-
ducing and analyzing di®erent types of faults. A fault is de¯ned as an unpermitted
deviation of at least one characteristic property or parameter of the system from
the acceptable/usual/standard condition. It can be introduced into any sensor of
iNemo by using the emulator given the real data sequence coming from the sensors.
For this study, we generate o®set faults for the feature of gyroscope x-axis, by adding
an o®set to its normal signal.
Examples in JM1, KC1 and PC1 describe attributes of software modules (i.e., the
unit of functionality of source code) in programs, including the static code metrics
de¯ned by McCabe45 and Halstead46 and other complexity related attributes.
McCabe metrics collect information about the complexity of pathways contained in
the module through a °ow graph. Halstead metrics estimate the reading complexity
based on the number of operators and operands in the module. The learning ob-
jective is to ¯nd as many defective software modules as possible without hurting the
overall performance of the constructed predictor (i.e., without increasing the false
alarm rate).
The common features of the above data sets are: (i) the basic task is to dis-
criminate between two classes ��� faulty and nonfaulty; (ii) the faulty examples
present to be the minority in the long run, but may arrive in high frequency within a
short period of time depending on the property of faults; (iii) they aim to ¯nd faults
accurately without degrading the performance on the other class; thus, high G-mean
(i.e., a good performance balance between classes) is desired for the obtained online
predictor.
Based on the features of this type of problems, we produce highly imbalanced
data streams for our experiment. For each of the three mechanical data sets, due to
the large amount of collected data, we choose 5000 examples to form the data stream
for training, in which only 50 examples are faulty. Besides, a data set containing 1000
Online Class Imbalance Learning
1340001-9

examples is generated as a separate testing data. Both training and testing data have
imbalance rate of 1% (i.e., the percentage of being faulty). For each of the three
software engineering data sets, 90% examples are used for online training and the
remaining 10% are used for testing. The original imbalance rate is kept for both.
The data information is summarized in Table 2.
We design four scenarios for each of the above data sets ��� one has a ¯xed
imbalance rate, and the other three have class imbalance °uctuations.
. In the ¯rst scenario, the minority examples are uniformly distributed in the data
stream, in which case the imbalance rate is constant. It simulates stable systems
with hidden faults that are hard to be captured.
. In the second scenario, all the faults occur at the beginning of the training data. It
is possible when the faulty system is ¯xed at some point. The data stream involves
a sudden decrease of imbalance rate.
. In the third scenario, all the faults occur at the end of the training data. It can
happen when a key part of the system is broken suddenly. The data stream
involves a sudden increase of imbalance rate.
. In the last scenario, the faults become more and more frequent in the training data.
It simulates the case when the damaged condition gets worse gradually. The data
stream has a gradual increase of imbalance rate.
It is worth mentioning that the total number of faults in the training data stream
is the same under all the four scenarios for each data set. Only the order of data
examples is di®erent.
5.2. Experimental analysis
How SOB performs on fault detection data in comparison with OOB, UOB,
RLSACP33 and WOS-ELM34 is studied here. The SOB, OOB and UOB ensembles
are composed of 50 Hoe®ding trees.47 To obtain accurate real-time class sizes and
performance, the time decay factors � and �0 for updating size percentage wðtÞk and
single-class recall RðtÞk are set to 0.99. Based on our preliminary experiments,8 low
values of � and �0 can lead to unstable performance and lose the bigger picture of
data. For fault detection data, since it is commonly known that the faulty class is the
Table 2. Fault detection data information.
Data Training No. Testing No. Attributes No. IR
Gearbox 5000 1000 5 1%
Smart building 5000 1000 14 1%
iNemo 5000 1000 11 1%
JM1 9792 1088 21 19.35%
KC1 1898 211 21 15.45%
PC1 998 111 21 6.94%
S. Wang, L. L. Minku & X. Yao
1340001-10
real minority and the imbalance rate is generally very small, we choose to set large
values to balance learning adaptivity and stability.
RLSACP33 andWOS-ELM34 are perceptron-based approaches, adjusting weights
between perceptrons and treating minority and majority classes di®erently to tackle
class imbalance. The weights are determined by the number of examples observed in
each class from the beginning or within a ¯x-sized window. Following the choice in
the original papers, we set the forgetting factor to 0.9 and the learning rate to 0.1
in RLSACP. RLSACP has two error weighting strategies. The second strategy
RLSACPII is applied here, which has fewer pre-de¯ned parameters and was shown to
produce similar results to the ¯rst error weighting strategy RLSACPI.33 For WOS-
ELM, the minority-class weight is set to the ratio of the number of majority-class
examples to the number of minority-class examples observed so far, and the weight
for the majority class is always equal to 1. The number of perceptrons in both
RLSACP and WOS-ELM are equal to the number of attributes of the processing
data stream. Their implementations are provided by the authors.
With the above settings, these algorithms are applied to the described data sets.
For a clear understanding, the ¯rst scenario with a constant imbalance rate and the
other three scenarios with class imbalance changes will be discussed separately.
5.2.1. Data with constant imbalance rates
To examine the online prediction ability, we perform prequential test, a popular
performance evaluation strategy in online learning, in which each individual example
is used to test the model before it is used for training, and from this the performance
measures can be incrementally updated. Meanwhile, for generalization performance,
we let the online model classify a separate testing data set after the online training
¯nishes, as described in Table 2. All the discussed algorithms are run 100 times
independently. Average G-mean is recorded for both prequential and after-training
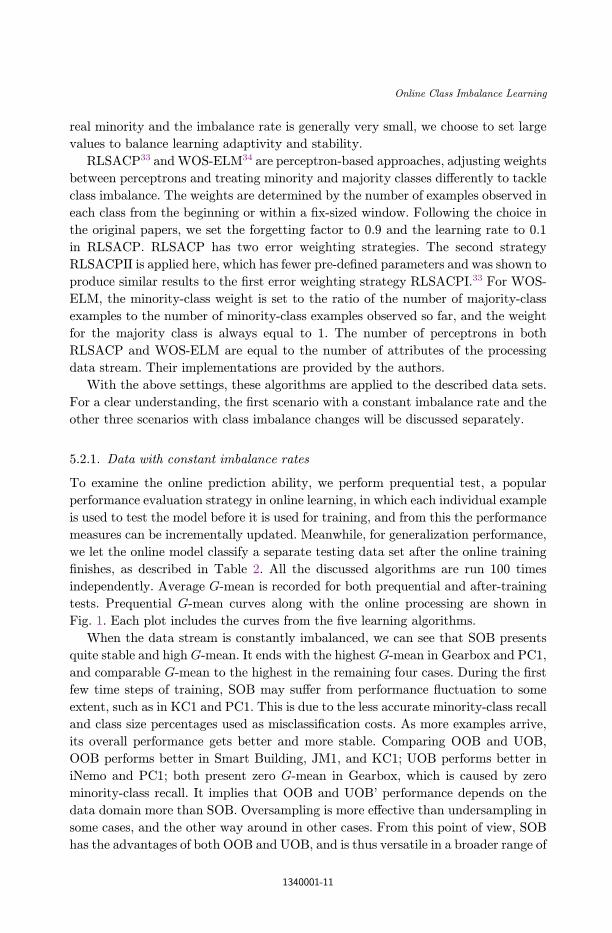
tests. Prequential G-mean curves along with the online processing are shown in
Fig. 1. Each plot includes the curves from the ¯ve learning algorithms.
When the data stream is constantly imbalanced, we can see that SOB presents
quite stable and high G-mean. It ends with the highest G-mean in Gearbox and PC1,
and comparable G-mean to the highest in the remaining four cases. During the ¯rst
few time steps of training, SOB may su®er from performance °uctuation to some
extent, such as in KC1 and PC1. This is due to the less accurate minority-class recall
and class size percentages used as misclassi¯cation costs. As more examples arrive,
its overall performance gets better and more stable. Comparing OOB and UOB,
OOB performs better in Smart Building, JM1, and KC1; UOB performs better in
iNemo and PC1; both present zero G-mean in Gearbox, which is caused by zero
minority-class recall. It implies that OOB and UOB' performance depends on the
data domain more than SOB. Oversampling is more e®ective than undersampling in
some cases, and the other way around in other cases. From this point of view, SOB
has the advantages of both OOB and UOB, and is thus versatile in a broader range of
Online Class Imbalance Learning
1340001-11
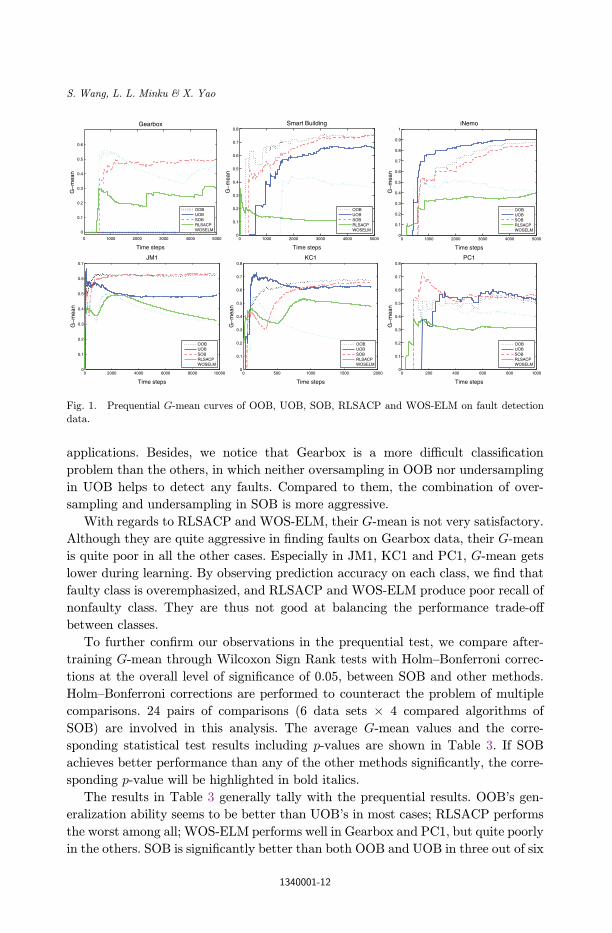
applications. Besides, we notice that Gearbox is a more di±cult classi¯cation
problem than the others, in which neither oversampling in OOB nor undersampling
in UOB helps to detect any faults. Compared to them, the combination of over-
sampling and undersampling in SOB is more aggressive.
With regards to RLSACP and WOS-ELM, their G-mean is not very satisfactory.
Although they are quite aggressive in ¯nding faults on Gearbox data, their G-mean
is quite poor in all the other cases. Especially in JM1, KC1 and PC1, G-mean gets
lower during learning. By observing prediction accuracy on each class, we ¯nd that
faulty class is overemphasized, and RLSACP and WOS-ELM produce poor recall of
nonfaulty class. They are thus not good at balancing the performance trade-o®
between classes.
To further con¯rm our observations in the prequential test, we compare after-
training G-mean through Wilcoxon Sign Rank tests with Holm–Bonferroni correc-
tions at the overall level of signi¯cance of 0.05, between SOB and other methods.
Holm–Bonferroni corrections are performed to counteract the problem of multiple
comparisons. 24 pairs of comparisons (6 data sets � 4 compared algorithms of
SOB) are involved in this analysis. The average G-mean values and the corre-
sponding statistical test results including p-values are shown in Table 3. If SOB
achieves better performance than any of the other methods signi¯cantly, the corre-
sponding p-value will be highlighted in bold italics.
The results in Table 3 generally tally with the prequential results. OOB's gen-
eralization ability seems to be better than UOB's in most cases; RLSACP performs
the worst among all; WOS-ELM performs well in Gearbox and PC1, but quite poorly
in the others. SOB is signi¯cantly better than both OOB and UOB in three out of six
0 200 400 600 800 10000
0.1
0.2
0.3
0.4
0.5
0.6
0.7
0.8
Time stepsG
−m
ean
PC1
OOBUOBSOBRLSACPWOSELM
0 500 1000 1500 20000
0.1
0.2
0.3
0.4
0.5
0.6
0.7
0.8
Time steps
G−
mea
n
KC1
OOBUOBSOBRLSACPWOSELM
0 2000 4000 6000 8000 100000
0.1
0.2
0.3
0.4
0.5
0.6
0.7
Time steps
G−
mea
n
JM1
OOBUOBSOBRLSACPWOSELM
0 1000 2000 3000 4000 50000
0.1
0.2
0.3
0.4
0.5
0.6
0.7
0.8
0.9
1
Time steps
G−
mea
n
iNemo
OOBUOBSOBRLSACPWOSELM
0 1000 2000 3000 4000 5000
0
0.1
0.2
0.3
0.4
0.5
0.6
Time steps
G−
mea
n
Gearbox
OOBUOBSOBRLSACPWOSELM
0 1000 2000 3000 4000 50000
0.1
0.2
0.3
0.4
0.5
0.6
0.7
0.8
Time steps
G−
mea
n
Smart Building
OOBUOBSOBRLSACPWOSELM
Fig. 1. Prequential G-mean curves of OOB, UOB, SOB, RLSACP and WOS-ELM on fault detection
data.
S. Wang, L. L. Minku & X. Yao
1340001-12

cases (Gearbox, JM1, PC1), worse than them in two cases (iNemo and KC1), and
in between them in the remaining one (Smart building). In iNemo and KC1, the
minority-class recall is not improved much by either oversampling or undersampling
in SOB, probably because it overlearns the observed minority-class examples and
lacks of generalization.
5.2.2. Data with class imbalance changes
When minority-class data do not come uniformly, how does the data sequence a®ect
the performance of online class imbalance algorithms? Focusing on this research
question, we adjust the order of faulty examples without changing the total number
in the data stream. As described in Sec. 5.1, to simulate real-world situations, we
generate and discuss three di®erent scenarios here: the scenario with a sudden IR
decrease; the scenario with a sudden IR increase; the scenario with a gradual IR
increase (corresponding to scenarios 2–4 in Sec. 5.1). Due to the poor performance of
RLSACP and WOS-ELM, we only discuss OOB, UOB and SOB in this section.
Table 4 presents their G-mean on the testing data to show their generalization
performance under each scenario. The prequential performance is not included here,
because the intensive arrival of faulty examples within a short period of time can give
over-optimistic prequential results.
For scenario 2, both SOB and OOB su®er a great G-mean reduction compared to
their results in the static scenario. Zero G-mean is obtained in three out of six cases,
which is due to the zero minority-class recall by looking into the accuracy on each
class, but the majority-class recall remains one. It means that all faulty examples
arrive constantly at the beginning of the data stream does not help to recognize faults
Table 3. Means and standard deviations of G-mean from SOB, OOB, UOB, RLSACP and
WOS-ELM on supplied testing data of fault detection data sets under the static scenario.
P -values of the Wilcoxon Sign Rank tests between SOB and every other method are given in
brackets. P -values in bold italics indicate statistically signi¯cant di®erence when using Holm–
Bonferroni corrections at the overall level of signi¯cance of 0.05, considering the 24 comparisons
performed.
SOB OOB UOB RLSACP WOS-ELM
Gearbox 0.481�0.062 0.000�0.000 0.000�0.000 0.000�0.000 0.450�0.121(0.00000) (0.00000) (0.00000) (0.11140)
Smart building 0.953�0.032 0.977�0.000 0.797�0.008 0.000�0.000 0.428�0.228(0.00000) (0.00000) (0.00000) (0.00000)
iNemo 0.816�0.000 0.999�0.000 0.956�0.001 0.000�0.000 0.491�0.075(0.00000) (0.00000) (0.00000) (0.00000)
JM1 0.678�0.006 0.670�0.009 0.644�0.011 0.008�0.063 0.493�0.022(0.00000) (0.00000) (0.00000) (0.00000)
KC1 0.601�0.027 0.648�0.043 0.646�0.001 0.231�0.286 0.493�0.062(0.00000) (0.00000) (0.00000) (0.00000)
PC1 0.472�0.118 0.263�0.037 0.268�0.001 0.080�0.150 0.503�0.086(0.00000) (0.00000) (0.00000) (0.04280)
Online Class Imbalance Learning
1340001-13
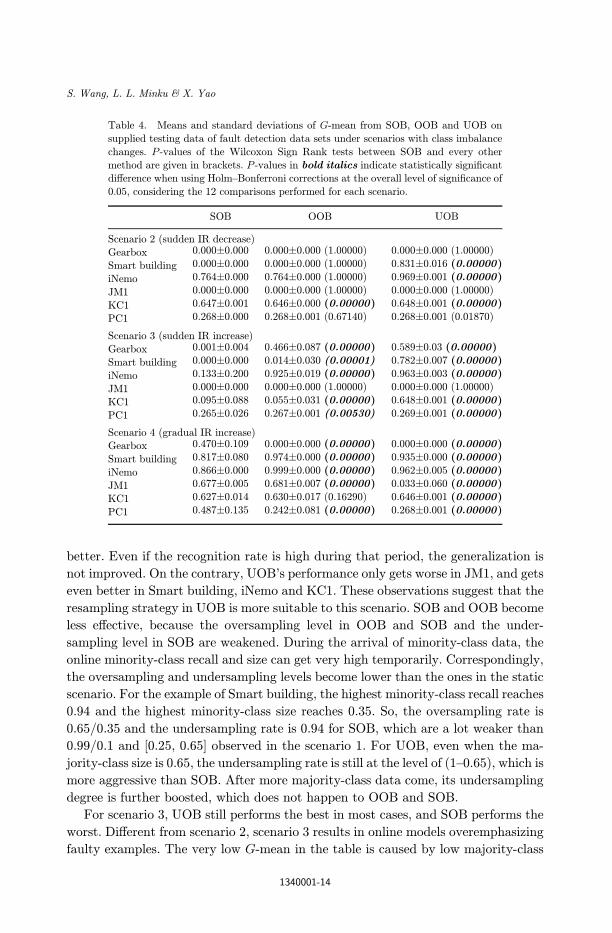
better. Even if the recognition rate is high during that period, the generalization is
not improved. On the contrary, UOB's performance only gets worse in JM1, and gets
even better in Smart building, iNemo and KC1. These observations suggest that the
resampling strategy in UOB is more suitable to this scenario. SOB and OOB become
less e®ective, because the oversampling level in OOB and SOB and the under-
sampling level in SOB are weakened. During the arrival of minority-class data, the
online minority-class recall and size can get very high temporarily. Correspondingly,
the oversampling and undersampling levels become lower than the ones in the static
scenario. For the example of Smart building, the highest minority-class recall reaches
0.94 and the highest minority-class size reaches 0.35. So, the oversampling rate is
0.65/0.35 and the undersampling rate is 0.94 for SOB, which are a lot weaker than
0.99/0.1 and [0.25, 0.65] observed in the scenario 1. For UOB, even when the ma-
jority-class size is 0.65, the undersampling rate is still at the level of (1–0.65), which is
more aggressive than SOB. After more majority-class data come, its undersampling
degree is further boosted, which does not happen to OOB and SOB.
For scenario 3, UOB still performs the best in most cases, and SOB performs the
worst. Di®erent from scenario 2, scenario 3 results in online models overemphasizing
faulty examples. The very low G-mean in the table is caused by low majority-class
Table 4. Means and standard deviations of G-mean from SOB, OOB and UOB on
supplied testing data of fault detection data sets under scenarios with class imbalance
changes. P -values of the Wilcoxon Sign Rank tests between SOB and every other
method are given in brackets. P -values in bold italics indicate statistically signi¯cantdi®erence when using Holm–Bonferroni corrections at the overall level of signi¯cance of
0.05, considering the 12 comparisons performed for each scenario.
SOB OOB UOB
Scenario 2 (sudden IR decrease)
Gearbox 0.000�0.000 0.000�0.000 (1.00000) 0.000�0.000 (1.00000)
Smart building 0.000�0.000 0.000�0.000 (1.00000) 0.831�0.016 (0.00000)
iNemo 0.764�0.000 0.764�0.000 (1.00000) 0.969�0.001 (0.00000)
JM1 0.000�0.000 0.000�0.000 (1.00000) 0.000�0.000 (1.00000)
KC1 0.647�0.001 0.646�0.000 (0.00000) 0.648�0.001 (0.00000)
PC1 0.268�0.000 0.268�0.001 (0.67140) 0.268�0.001 (0.01870)
Scenario 3 (sudden IR increase)
Gearbox 0.001�0.004 0.466�0.087 (0.00000) 0.589�0.03 (0.00000)
Smart building 0.000�0.000 0.014�0.030 (0.00001) 0.782�0.007 (0.00000)
iNemo 0.133�0.200 0.925�0.019 (0.00000) 0.963�0.003 (0.00000)
JM1 0.000�0.000 0.000�0.000 (1.00000) 0.000�0.000 (1.00000)
KC1 0.095�0.088 0.055�0.031 (0.00000) 0.648�0.001 (0.00000)
PC1 0.265�0.026 0.267�0.001 (0.00530) 0.269�0.001 (0.00000)
Scenario 4 (gradual IR increase)Gearbox 0.470�0.109 0.000�0.000 (0.00000) 0.000�0.000 (0.00000)
Smart building 0.817�0.080 0.974�0.000 (0.00000) 0.935�0.000 (0.00000)
iNemo 0.866�0.000 0.999�0.000 (0.00000) 0.962�0.005 (0.00000)
JM1 0.677�0.005 0.681�0.007 (0.00000) 0.033�0.060 (0.00000)
KC1 0.627�0.014 0.630�0.017 (0.16290) 0.646�0.001 (0.00000)
PC1 0.487�0.135 0.242�0.081 (0.00000) 0.268�0.001 (0.00000)
S. Wang, L. L. Minku & X. Yao
1340001-14

recall, but the minority-class recall is nearly 1 in many cases. During the ¯rst stage
of training, nonfaulty data occupy the data stream. The observed imbalance rate
is much lower than the real one. Thus, the undersampling level is more severe than
what it should be. When faulty data start arriving intensively, the oversampling rate
for OOB and SOB is extremely high (e.g., 1/0.001 for OOB and 0.999/0.001 for
SOB) during the ¯rst few time steps, based on their sampling mechanism. Due to the
double resampling procedures, SOB overlooks the majority class too much. Because
OOB and UOB apply only one resampling strategy, their performance is a®ected
less. From Sec. 5.2.1, we know that Gearbox is a di±cult data set, in which most
faulty examples tend to be ignored. In this scenario, both OOB and UOB present
better generalization, because this data sequence enforces more aggressive sampling
degree.
Compared to scenarios 2 and 3, scenario 4 does not a®ect the performance of the
three methods that much, except that UOB still overemphasizes the minority class in
JM1. A gradual IR change does not cause extreme performance and class size values,
so it shouldn't cause as severe problems as the previous two cases.
According to the above analysis, we can see that an abrupt change in short-term
imbalance rate can cause severe performance reduction, especially to SOB. When
minority-class examples arrive frequently during the early stage of training, the
online learner considers this class to be the majority. So, it tends to be overlooked.
When minority-class examples arrive frequently during the later stage of training,
the online learner exaggerates imbalance degree, and the minority class is over-
emphasized. One major reason is that the estimated IR and online performance are
led by the local status of data and learner, which can be quite di®erent from future
status. Besides, SOB is more sensitive to the data sequence, because it uses both
oversampling and undersampling to overcome class imbalance. UOB is shown to be
more robust against short-term changes. The underlying issue here is how to better
recognize class imbalance status and discriminate any short-term and long-term
changes, in order to reduce the impact of data sequences.
6. Conclusions and Future Work
This paper studied a new learning problem, online class imbalance learning, which
considers the challenges of both online learning and class imbalance learning. To
have a clear understanding of the underlying issue, we ¯rst formulated this type of
problems with the aim of maximizing G-mean. The formulation tells us that both
imbalance degree and online performance need to be considered for the best G-mean.
Second, based on the problem formulation, we proposed a new online algorithm SOB,
making use of oversampling and undersampling to overcome class imbalance and
integrating them into OB for online processing. With the theoretical underpinning,
it is expected to outperform its two earlier versions OOB and UOB, and other state-
of-the-art methods. To test its e®ectiveness, SOB was then used to solve a class of
real-world applications ��� fault detection in engineering and software engineering
Online Class Imbalance Learning
1340001-15

systems, in comparison with OOB, UOB, RLSACP and WOS-ELM. These methods
were discussed under four practical scenarios, including a constantly imbalanced
scenario and three scenarios with class imbalance °uctuations. In the ¯rst scenario,
we found that SOB can balance the performance between classes very well across
di®erent data domains and produce stable G-mean. However, it is sensitive to data
sequences in the other scenarios, especially when there is a sudden change in class
imbalance. UOB, by contrast, was shown to be more robust against this °uctuant
situation.
Based on the results so far, there are several points we would like to look into in
the near future. First, a weak point of SOB is its ability in dealing with dynamic data
streams with concept drifts.48 The reason could be that the proposed problem for-
mulation aims to maximize G-mean greedily over all received examples. During the
online processing, however, maximizingG-mean for examples received so far may not
be the best way of maximizing G-mean later on, especially when the data stream
su®ers from some severe concept drifts. Therefore, it is necessary to formulate the
problem that can have adaptive learning objectives to nonstationary situations.
A possible solution is to not only consider past examples, but also ¯nd an objective
that is robust to future environmental changes.49 Besides, some techniques can
be developed to detect changes in the data stream. Once a change happens, the
resampling strategy in SOB will be adapted to it, in order to reduce the impact of
concept drifts. Second, the problem formulation proposed in this paper is only ap-
plicable to two-class problems. How to formulate multi-class problems is important,
as many applications involve more than one minority or majority class, and the
number of classes can even change during the online processing. Third, we would like
to apply our concept drift detection method DDM-OCI9 to the discussed fault de-
tection tasks and examine whether it can help to further improve the prediction,
considering some unknown concept drifts may happen to faulty examples over time.
Acknowledgments
The authors are grateful to Davide Ghezzi and Daniele Caltabiano for providing the
iNemo data and to Michalis Michaelide for providing the smart building data used
in our experiments. This work was supported by the European funded project
(FP7 Grant No. 270428) \iSense: making sense of nonsense". Xin Yao was supported
by a Royal Society Wolfson Research Merit Award.
References
1. N. C. Oza, Online bagging and boosting, IEEE Int. Conf. Systems, Man and Cybernetics(Hawaii, USA, 2005), pp. 2340–2345.
2. C. E. Monteleoni, Online learning of non-stationary sequences, in AI Technical Report2003-011, 2003.
3. M. Ciaramita, V. Murdock and V. Plachouras, Online learning from click data forsponsored search, in Int. World Wide Web Conf. (Beijing, China, 2008), pp. 227–236.
S. Wang, L. L. Minku & X. Yao
1340001-16

4. H. Wang, W. Fan, P. S. Yu and J. Han, Mining concept-drifting data streams usingensemble classi¯ers, in Proc. Ninth ACM SIGKDD Int. Conf. Knowledge Discovery andData Mining (Washington, DC, USA, 2003), pp. 226–235.
5. K. Nishida, S. Shimada, S. Ishikawa and K. Yamauchi, Detecting sudden concept driftwith knowledge of human behavior, in IEEE Int. Conf. Systems, Man and Cybernetics(Singapore, 2008), pp. 3261–3267.
6. S. J. Delany, P. Cunningham, A. Tsymbal and L. Coyle, A case-based technique fortracking concept drift in spam ¯ltering, Knowl.-Based Syst. 18(4–5) (2005) 187–195.
7. H. He and E. A. Garcia, Learning from imbalanced data, IEEE Trans. Knowl. Data Eng.21(9) (2009) 1263–1284.
8. S. Wang, L. L. Minku and X. Yao, A learning framework for online class imbalancelearning, in IEEE Symp. Computational Intelligence and Ensemble Learning (CIEL)(Singapore, 2013), pp. 36–45.
9. S. Wang, L. L. Minku, D. Ghezzi, D. Caltabiano, P. Tino and X. Yao, Conceptdrift detection for online class imbalance learning, in Int. Joint Conf. Neural Networks(IJCNN '13), Dallas, TX, USA, 2013.
10. H. M. Nguyen, E. W. Cooper and K. Kamei, Online learning from imbalanceddata streams, in Int. Conf. Soft Computing and Pattern Recognition (SoCPaR) (Dalian,China, 2011), pp. 347–352.
11. S. Wang and X. Yao, Using class imbalance learning for software defect prediction, IEEETrans. Reliab. 62(2) (2012) 434–443.
12. G. M. Weiss, Mining with rarity: A unifying framework, SIGKDD Explor. Newsl. 6(1)(2004) 7–19.
13. S. Wang, Ensemble Diversity for Class Imbalance Learning, PhD thesis, School ofComputer Science, The University of Birmingham, 2011.
14. N. V Chawla, K. W. Bowyer, L. O. Hall and W. P. Kegelmeyer, SMOTE: Syntheticminority over-sampling technique, J. Artif. Intell. Res. 16 (2002) 341–378.
15. M. Lin, K. Tang and X. Yao, Dynamic sampling approach to training neural networksfor multiclass imbalance classi¯cation, IEEE Trans. Neural Netw. Learn. Syst. 24(4)(2013) 647–660.
16. N. Japkowicz, C. Myers and M. A. Gluck, A novelty detection approach to classi¯cation,in Proc. 14th Int. Joint Conf. Arti¯cial Intelligence (Montreal, Quebec, Canada, 1995),pp. 518–523.
17. Z.-H. Zhou and X.-Y. Liu, Training cost-sensitive neural networks with methodsaddressing the class imbalance problem, IEEE Trans. Knowl. Data Eng. 18(1) (2006)63–77.
18. L. Rokach, Ensemble-based classi¯ers, Artif. Intell. Rev. 33(1–2) (2010) 1–39.19. N. V. Chawla, A. Lazarevic, L. O. Hall and K. W. Bowyer, SMOTEBoost: Improving
prediction of the minority class in boosting, in Knowledge Discovery in Databases: PKDD2003, Vol. 2838, Cavtat-Dubrovnik, Croatia, pp. 107–119.
20. S. Wang, H. Chen and X. Yao, Negative correlation learning for classi¯cation ensembles,in Int. Joint Conf. Neural Networks, WCCI (IEEE Press, Barcelona, Spain, 2010), pp.2893–2900.
21. S. Wang and X. Yao, The e®ectiveness of a new negative correlation learningalgorithm for classi¯cation ensembles, in IEEE Int. Conf. Data Mining Workshops(Sydney, Australia, 2010), pp. 1013–1020.
22. U. Bhowan, M. Johnston, M. Zhang and X. Yao, Evolving diverse ensembles using geneticprogramming for classi¯cation with unbalanced data, IEEE Trans. Evol. Comput. 17(3)(2013) 368–386.
Online Class Imbalance Learning
1340001-17

23. M. Kubat and S. Matwin, Addressing the curse of imbalanced training sets: One-sidedselection, in Proc. 14th Int. Conf. Machine Learning (Nashville, TN, USA, 1997),pp. 179–186.
24. J. Gao, W. Fan, J. Han and P. S. Yu, A general framework for mining concept-driftingdata streams with skewed distributions, in Proc. SIAM ICDM (Omaha, NE, USA, 2007),pp. 3–14.
25. J. Gao, B. Ding, J. Han, W. Fan and P. S. Yu, Classifying data streams with skewed classdistributions and concept drifts, IEEE Internet Comput. 12(6) (2008) 37–49.
26. Y. Wang, Y. Zhang and Y. Wang, Mining data streams with skewed distribution by staticclassi¯er ensemble, Opportunities and challenges for next-generation applied intelligence,Stud. Comput. Intell. 214 (2009) 65–71.
27. S. Chen and H. He, Sera: Selectively recursive approach towards nonstationary im-balanced stream data mining, in Int. Joint Conf. Neural Networks (Atlanta, Georgia,USA, 2009), pp. 522–529.
28. S. Chen, H. He, K. Li and S. Desai, Musera: Multiple selectively recursive approachtowards imbalanced stream data mining, in Int. Joint Conf. Neural Networks (Barcelona,Spain, 2010), pp. 1–8.
29. S. Chen and H. He, Towards incremental learning of nonstationary imbalanced datastream: A multiple selectively recursive approach, Evolving Syst. 2(1) (2010) 35–50.
30. R. N. Lichtenwalter and N. V. Chawla, Adaptive methods for classi¯cation in arbitrarilyimbalanced and drifting data streams, New Frontiers in Applied Data Mining, LectureNotes in Computer Science, Vol. 5669 (Springer-Verlag, Berlin, 2010), pp. 53–75.
31. G. Ditzler and R. Polikar, Incremental learning of concept drift from streamingimbalanced data, IEEE Trans. Knowl. Data Eng. 25(10) (2013) 2283–2301.
32. L. L. Minku and X. Yao, DDD: A new ensemble approach for dealing with concept drift,IEEE Trans. Knowl. Data Eng. 24(4) (2012) 619–633.
33. A. Ghazikhani, R. Monse¯ and H. S. Yazdi, Recursive least square perceptron modelfor non-stationary and imbalanced data stream classi¯cation, Evolving Syst. 4(2) (2013)119–131.
34. B. Mirza, Z. Lin and K.-A. Toh, Weighted online sequential extreme learning machine forclass imbalance learning, Neural Processing Letters 38(3) (2013) 465–486.
35. M. P. Michaelides, V. Reppa, C. Panayiotou and M. Polycarpou, Contaminant eventmonitoring in intelligent buildings using a multi-zone formulation, in 8th IFAC Symp.on Fault Detection, Supervision and Safety of Technical Processes (SAFEPROCESS),Vol. 8 (Mexico City, Mexico, 2012), pp. 492–497.
36. V. Reppa, M. M. Polycarpou and C. G. Panayiotou, Adaptive approximation for multiplesensor fault detection and isolation of nonlinear uncertain systems, IEEE Trans. NeuralNetw. Learn. Syst. 2013, (DOI: 10.1109/TNNLS.2013.2250301). (It is still in print, so nopages provided yet.)
37. C. Catal, Software fault prediction: A literature review and current trends, Expert Syst.Appl. 38(4) (2010) 4626–4636.
38. T. Menzies, B. Caglayan, Z. He, E. Kocaguneli, J. Krall, F. Peters and B. Turhan, Thepromise repository of empirical software engineering data, June 2012, http://promisedata.googlecode.com.
39. J. McBain and M. Timusk, Feature extraction for novelty detection as applied to faultdetection in machinery, Pattern Recognit. Lett. 32(7) (2011) 1054–1061.
40. C. Elkan, The foundations of cost-sensitive learning, in Proc. Seventeenth Int. Joint Conf.Arti¯cial Intelligence (IJCAI'01) (Seattle, Washington, USA, 2001), pp. 973–978.
S. Wang, L. L. Minku & X. Yao
1340001-18

41. C. Sei®ert, T. M. Khoshgoftaar, J. V. Hulse and A. Napolitano, Improving learner per-formance with data sampling and boosting, in 20th IEEE Int. Conf. Tools with Arti¯cialIntelligence (Dayton, Ohio, USA, 2008), pp. 452–459.
42. L. Breiman, Bagging predictors, Mach. Learn. 24(2) (1996) 123–140.43. The Prognostics and Health Management Society (PHM Society), 2009 PHM Challenge
Competition Data Set, http://www.phmsociety.org/references/datasets.44. STMicroelectronics, iNemo: iNErtial MOdule V2 demonstration board, http://www.st.
com/internet/evalboard/product/250367.jsp.45. T. J. McCabe, A complexity measure, IEEE Trans. Softw. Eng. 2(4) (1976) 308–320.46. M. H. Halstead, Elements of Software Science (Elsevier, 1977).47. G. Hulten, L. Spencer and P. Domingos, Mining time-changing data streams, in
Proc. Seventh ACM SIGKDD Int. Conf. Knowledge Discovery and Data Mining (SanFrancisco, CA, USA, 2001), pp. 97–106.
48. L. L. Minku, A. P. White and X. Yao, The impact of diversity on online ensemble learningin the presence of concept drift, IEEE Trans. Knowl. Data Eng. 22(5) (2010) 730–742.
49. H. Fu, B. Sendho®, K. Tang and X. Yao, Finding robust solutions to dynamic optimi-zation problems, in Proc. 16th European Conf. Applications of Evolutionary Computa-tion, Lecture Notes in Computer Science, Vol. 7835 (Springer, Berlin, 2013), pp. 616–625.
Online Class Imbalance Learning
1340001-19