online issn 2345-3745 service quality and student ... · pdf filecorresponding author, email:...
TRANSCRIPT

Service Quality and Student Satisfaction: The
Moderating Role of University Culture, Reputation and
Price in Education Sector of Pakistan
Shahzadi Saima Saleem1, Kamran Moosa2, Abeer Imam3, Rashid Ahmed Khan4
1. COMSATS Institute of Information Technology, Lahore, Pakistan
2. PIQC Institute of Information Technology, Lahore, Pakistan
3. Department of Management Sciences, COMSATS Institute of Information Technology, Lahore, Pakistan
4. COMSATS Institute of Information Technology, Lahore, Pakistan
(Received: November 21, 2016; Revised: January 9, 2017; Accepted: January 11, 2017)
Abstract
Service quality is imperative for higher education institutes in order to remain
competitive and growing. There is a need to ensure students’ satisfaction with
university. This study will help improve service quality of the institutes. Information
and data are collected using a survey questionnaire from the higher education
institutes of Pakistan using convenience sampling technique. Findings revealed that
with the moderating effect of university culture, university reputation and price,
higher education institutes can more significantly achieve the student satisfaction.
University culture positively strengthens service quality to achieve and sustain
student satisfaction, while price and university reputation strengthen the relationship
in a negative direction. These moderators are the significant contributing factors.
Keywords
Service quality, Student satisfaction, University reputation, Price, University culture.
Corresponding Author, Email: [email protected]
Iranian Journal of Management Studies (IJMS) http://ijms.ut.ac.ir/
Vol. 10, No. 1, Winter 2017 Print ISSN: 2008-7055
pp. 237-258 Online ISSN: 2345-3745
DOI: 10.22059/ijms.2017.217335.672304
Online ISSN 2345-3745

238 (IJMS) Vol. 10, No. 1, Winter 2017
Introduction
Addressing quality in Higher Educational Institutions (HEIs) is a
complex phenomenon. There are two important points to focus,
academic quality and service quality. Academic quality emphasizes on
the learning outcome, that is, the acquiring of knowledge and abilities
in subject domains. While, service quality generally emphasizes the
institutional services. The service aspects include both tangible and
non-tangible features. The weaker comprehension of the service
provision notion in HEIs has made them to concentrate more on
measureable features like equipment, physical environment and assets.
As a result, HEC generally funds universities more on these
perceptions and hence evaluates them on the same too. There is a
strong need of Pakistani HEIs to concentrate on the promotion of
minds they employ and spend more on the human resources, in
addition to their infrastructure.
The number of educational institutes in Pakistan has been increased
during 2000-2015. In 2000, 45 universities and degree awarding
institutions were operative which increased to 173, according to the
figure of Higher Education Commission (HEC) of Pakistan in 2015.
This increase in number of universities raised the need for the service
quality in order to attract and retain students. Since, education is
considered to be an important source in any economy and there exists
a significant association between education and growth in economy of
any country (Husain et al., 2009).
Number of researches have been done around the globe pertaining
the impact of service quality and student satisfaction. Very few
investigated price and university reputation as determinants of service
quality or as independent variables. But, scarce literature is available
in the context of Pakistani HEIs about the effect of mediator or
moderator variables. The current research emphasized on three
factors, which are price, university reputation, and university culture,
as moderators and investigates the extent to which service quality
impacts satisfaction of students, particularly in Pakistani context.
The key objective of this research is to identify the effect of service
quality on student satisfaction with moderating effect of university
Service Quality and Student Satisfaction: The Moderating Role of University … 239
culture, price and university reputation. This study investigated the
following two research questions:
1. To what extent does the service quality impact on student
satisfaction?
2. What role do university culture, university reputation and price
have between the association of service quality and student
satisfaction?
Literature Review
Service quality
Service quality (Parasuraman et al., 1985; Zeithaml, 1988; Chang,
2009) is difficult to be measured because of its intangible nature
(Eshghi et al., 2008). It is essential to take all aspects of service
quality in consideration that justifiy the situation in which specific
industry is working (Lagrosen, 2001). Parasuraman et al. (1988)
suggested that ‘SERVQUAL’, which measures service quality, is
based on five aspects, these are tangibles, reliability, responsiveness,
assurance, and empathy (Andam et al., 2015). Researchers are of the
view that the dimensions used by SERVQUAL requires more
generalization (Iwaarden & Van der Wiele, 2002).
Student satisfaction
Student satisfaction is “the extent to which an institutions’ service
performance meets the reckoning of the students” (Weirs-Jenssen et
al., 2002; Salami, 2005; Roberts-Lombard, 2009). Satisfaction of
students is affected by students’ expectations and their perception
about services and quality of services provided (Hu et al., 2009;
Babaei, 2015).
Satisfaction of the students with university has institutional,
individual, and social welfare. According to an institutional argument,
contented students are much more probable to endure their studies and
prosper academically. Student satisfaction can easily be achieved by
outstanding service standards. This will help HEIs to attain a
sustainable competitive edge in today’s higher educational
environment (Huang et al., 2012).

240 (IJMS) Vol. 10, No. 1, Winter 2017
Helgesen and Nesset (2007) strengthened the findings of Mavondo
et al. (2000), by stating that reputation of institutions is also an
important consideration in determining satisfaction level of students.
Those students who are satisfied, generate optimistic views about
institution and endorse the same institute to other students.
University culture
With the passage of time, leadership involved in these institutions is
getting aware of the culture (Ahangaran et al., 2016) and its role in
diversity towards university’s development. Each university has its
own elements which are interconnected with its cultural aspects
(Bartell, 2003; Sporn, 1996). In short, university culture works as a
web, where administration plays its role by keeping everyone
connected (Bartell, 2003).
University culture can be regarded as a strong or weak culture
(Sporn, 1996). Universities with strong cultures have same set of
constant beliefs and ethics shared by both managers and the staff
(Kotter & Heskett, 1992). If the links present between groups are lost
then the culture is said to be weak. Strong university culture is
distinguished by collective standards, strong behavioral values,
compliance and readiness of the faculty to conform to these values.
Weak culture is distinguished by the divergence from collective
standards, lack of values (both written and oral) at the university
(Antic & Ceric, 2008). It is imperative to comprehend university
culture to promote student satisfaction with the university.
University reputation
The combined representation of university’s multiple elements
(internal and external elements), including the media-hold of the
university over the period of time is known as university reputation.
Fombrun and Van Riel (2003), and Van den Bosch et al. (2005)
discussed five aspects of corporate reputation (visibility,
distinctiveness, authenticity, transparency and consistency) by
proposing a closed association between “corporate visual identity” and
“corporate reputation”. Researchers reported that a university’s
reputation can be made by the direct or indirect mediated experiences

Service Quality and Student Satisfaction: The Moderating Role of University … 241
and the information that is obtained through various channels of
communication and symbols (Bromley, 2000; Gotsi & Wilson, 2001;
Grunig & Hung, 2002).
Numerous researches identified and recognized the importance of
university reputation (Nguyen & LeBlanc, 2001; Hoyt & Brown,
2003). According to Sevier (1994), mostly students chose universities
based on the perception they have about the reputation of the
university. He further added that reputation is mostly perceived in two
directions; horizontal and vertical. Horizontal context of reputation
deals with the comparison of institutions on the basis of specific
characteristics and dimension that a student would love to mention it
to anyone. While vertical context of reputation deals with the
student’s perception of positive or negative emotions concerning
institutes.
Price
Price is the purchase of commodities and services by spending money
or commodities (Hanif et al., 2010; Kotler & Amstrong, 2010).
Zeithaml (1988) narrated price in the context of consumer perception
as letting go of something to attain a particular service or commodity.
Price can be defined as a concept of quality and contentment in the
context of service (Zeithaml & Bitner, 2000). Bolton et al. (2003)
defined the concept of fairness as the procedure through which
rational outcomes can be attained. If the price is fair in the view of
consumer, then it can be perceived as fairly charged (Clemes et al.,
2008).
Customer contentment can be determined through the perceived
price (Anderson et al., 1994; Zeithaml & Bitner, 1996). The factors
that are used for identifying the price are reported by many
researchers including Kao (2007). He described that perceived price of
student can be examined with the help of different factors like, tuition
charges, books cost and the coaching material. If customers get
satisfied from the received services or product in return of what they
had paid then they considered the product as quality product and feel
satisfied (Bei & Chiao, 2001). There is dissimilarity between all these

242 (IJMS) Vol. 10, No. 1, Winter 2017
concepts including price, consumer contentment and service quality
(Parasuraman et al., 1994). These interrelationships among the
concepts of satisfaction, quality and price make it interesting to study
all of these three concepts.
Research Methodology
It is a cross-sectional study, using quantitative approach to obtain
primary data from undergraduate students of HEIs in Pakistan.
Convenience sampling technique was used to save expenses and time.
Theoretical framework
Since, service quality showed an enhancing impact on student
satisfaction (Parasuraman et al., 1985; Buttle, 1996), there are rare
studies specifically measuring the effect of service quality on student
satisfaction by using university culture, price and university reputation
as moderators. The theoretical model is shown in Figure 1.
Fig. 1. Theoretical framework
Hypotheses
The research hypotheses for this research are as follows:
H1. Service quality significantly impacts student satisfaction.
H2. University culture has a moderating relation between service
quality and student satisfaction.
H3. University reputation has a moderating relation between
service quality and student satisfaction.

Service Quality and Student Satisfaction: The Moderating Role of University … 243
H4. Price has a moderating relation between service quality and
student satisfaction.
Measures
Data were collected from students of 20 HEIs as a sample through a
questionnaire. Personal visits and responses via email were collected.
Students were mostly from business administration,
telecommunication engineering, computer engineering, electrical
engineering, software engineering and computer sciences programs.
Total questionnaires rotated were 900. A response rate of 83% was
achieved as 747 questionnaires were received.
Questionnaire statements were adopted form different empirical
studies, shown in Table 1.
Table 1. Measure
Sr. No. Construct Author No. of Items
1 Tangibles Owlia & Aspinwall (1998) 7
2 Competence Owlia & Aspinwall (1998) 6
3 Outcome Gronroos (1990) 3
4 Content Owlia & Aspinwall (1998) 4
5 Reliability Owlia & Aspinwall (1998) 5
6 Empathy Parasuraman et al. (1991) 3
7 Assurance Parasuraman et al. (1991) 4
8 Responsiveness Parasuraman et al. (1991) 4
9 University culture
Quinn & Rohrbaugh (1983); Elliott &
Shin (2002); Ijaz et al. (2011); Abdullah
(2006); Zindi (1994); Tinklin et al.
(2004); Presley et al. (1993)
17*
10 Price Sweeney & Soutar (2001) 2
11 University
reputation
Petrick (2002); Sweeney & Soutar
(2001) 5
12 Student satisfaction Athiyaman (1997); Cronin et al. (2000);
McDougall & Levesque (2000) 8
*All of these questions were modified as per Pakistani context.
Data were analyzed using different techniques through SPSS-21
and AMOS-18 including reliability analysis, confirmatory factor
analysis and correlation analysis. The impact of the independent
variable was investigated on the dependent variable in presence of
moderators through Structural Equation Modeling (SEM) to test the
proposed association in order to find the impact of each constructs,
directly or indirectly and through moderator.
244 (IJMS) Vol. 10, No. 1, Winter 2017
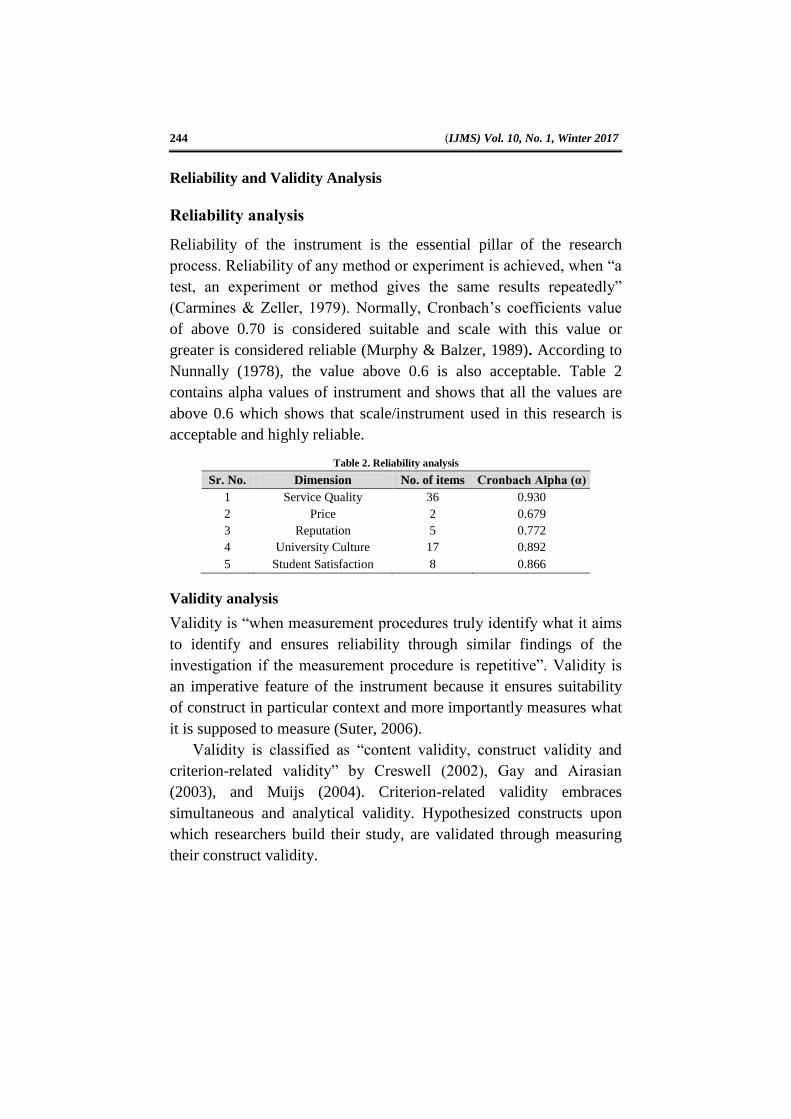
Reliability and Validity Analysis
Reliability analysis
Reliability of the instrument is the essential pillar of the research
process. Reliability of any method or experiment is achieved, when “a
test, an experiment or method gives the same results repeatedly”
(Carmines & Zeller, 1979). Normally, Cronbach’s coefficients value
of above 0.70 is considered suitable and scale with this value or
greater is considered reliable (Murphy & Balzer, 1989). According to
Nunnally (1978), the value above 0.6 is also acceptable. Table 2
contains alpha values of instrument and shows that all the values are
above 0.6 which shows that scale/instrument used in this research is
acceptable and highly reliable.
Table 2. Reliability analysis
Sr. No. Dimension No. of items Cronbach Alpha (α)
1 Service Quality 36 0.930
2 Price 2 0.679
3 Reputation 5 0.772
4 University Culture 17 0.892
5 Student Satisfaction 8 0.866
Validity analysis
Validity is “when measurement procedures truly identify what it aims
to identify and ensures reliability through similar findings of the
investigation if the measurement procedure is repetitive”. Validity is
an imperative feature of the instrument because it ensures suitability
of construct in particular context and more importantly measures what
it is supposed to measure (Suter, 2006).
Validity is classified as “content validity, construct validity and
criterion-related validity” by Creswell (2002), Gay and Airasian
(2003), and Muijs (2004). Criterion-related validity embraces
simultaneous and analytical validity. Hypothesized constructs upon
which researchers build their study, are validated through measuring
their construct validity.
Service Quality and Student Satisfaction: The Moderating Role of University … 245
Construct validity
The degree to which a construct is precisely operational is known as
construct validity (Yin, 2003). This study obtained a greater construct
validity by devising the procedures after detailed study of research
works available regarding variables used. These procedures have high
validity as they are imitated in the number of studies carried out
earlier. The improvement in the questionnaire is completed by
consulting skilled experts in the field of service quality and education.
After pilot survey, language of the questionnaire is reviewed to have
further operational form of the questionnaire and its consideration
amongst the respondents. The questionnaire is confirmed subsequently
incorporating the inputs of the experts and the respondents of the pilot
survey, thus leaving no grounds for the misrepresentation of the
instruments.
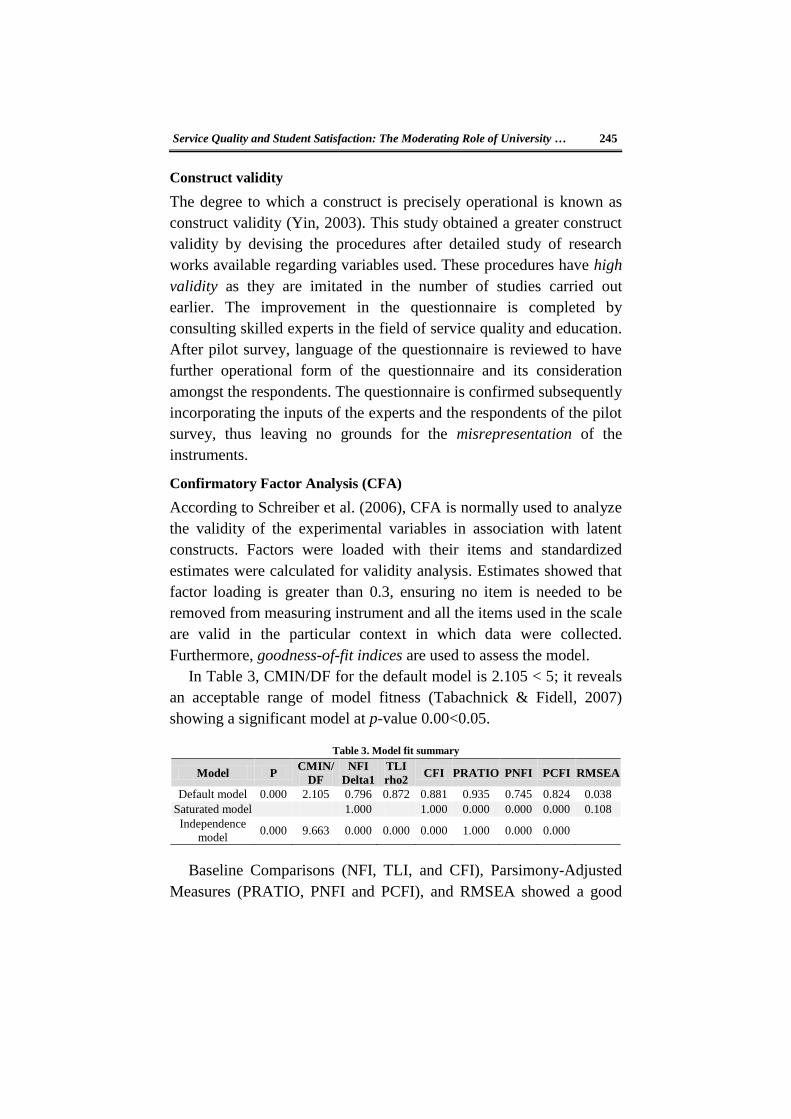
Confirmatory Factor Analysis (CFA)
According to Schreiber et al. (2006), CFA is normally used to analyze
the validity of the experimental variables in association with latent
constructs. Factors were loaded with their items and standardized
estimates were calculated for validity analysis. Estimates showed that
factor loading is greater than 0.3, ensuring no item is needed to be
removed from measuring instrument and all the items used in the scale
are valid in the particular context in which data were collected.
Furthermore, goodness-of-fit indices are used to assess the model.
In Table 3, CMIN/DF for the default model is 2.105 < 5; it reveals
an acceptable range of model fitness (Tabachnick & Fidell, 2007)
showing a significant model at p-value 0.00<0.05.
Table 3. Model fit summary
Model P CMIN/
DF
NFI
Delta1
TLI
rho2 CFI PRATIO PNFI PCFI RMSEA
Default model 0.000 2.105 0.796 0.872 0.881 0.935 0.745 0.824 0.038
Saturated model 1.000 1.000 0.000 0.000 0.000 0.108
Independence
model 0.000 9.663 0.000 0.000 0.000 1.000 0.000 0.000
Baseline Comparisons (NFI, TLI, and CFI), Parsimony-Adjusted
Measures (PRATIO, PNFI and PCFI), and RMSEA showed a good

246 (IJMS) Vol. 10, No. 1, Winter 2017
model fit as per standards set by Byrne (1998), Mulaik et al. (1989)
and Hair et al. (1998), respectively.
Fig. 2. Confirmatory factor analysis

Service Quality and Student Satisfaction: The Moderating Role of University … 247
Results
Demographic profiles and frequencies
The percentage and frequency of each of the demographic variable is
given in Table 4.
Table 4. Demographic characteristics
Category Percentage Frequency
Gender
Male
Female
68.9%
31.1%
515
232
Age Group
Below 20 years
20- 22 years
Above 22 years
19.3%
65.1%
15.7%
144
486
117
Background
Urban area
Rural area
64.8%
35.2%
484
263
Program of study
Business administration
Computer science
Electrical engineering
Software engineering
Telecommunication engineering
Computer engineering
22.8%
21.6%
16.5%
14.6%
14.3%
10.3%
170
161
123
109
107
77
Year of Study
1st year
2nd
year
3rd
year
4th year
11.5%
30.9%
30.8%
21.8%
123
231
230
163
Status of the HEIs
Public sector
Private sector
70%
30%
523
224
Correlation analysis
Normality of data is checked using non-parametric test of One-Sample
Kolmogorov-Smirnov Test. Data are found to be normal. Further, the
strength of interrelationships using Pearson correlation is checked.
Table 5 illustrates p-values of all variable less than 0.05 and 0.01,
which depicts that all the causal relationships are significant. Analysis
revealed that there exists a positive association among service quality,
student satisfaction and three moderating variables, indicating if
service quality improves then the student satisfaction also improves.
248 (IJMS) Vol. 10, No. 1, Winter 2017
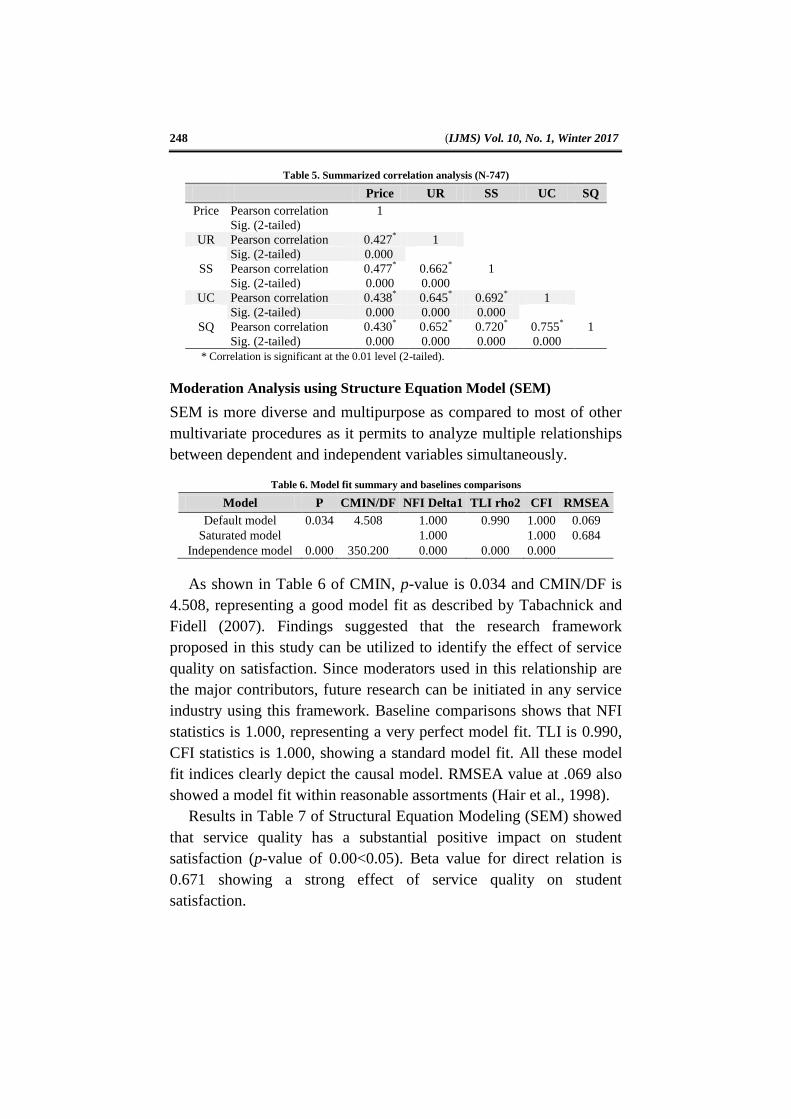
Table 5. Summarized correlation analysis (N-747)
Price UR SS UC SQ
Price Pearson correlation 1
Sig. (2-tailed)
UR Pearson correlation 0.427* 1
Sig. (2-tailed) 0.000
SS Pearson correlation 0.477* 0.662
* 1
Sig. (2-tailed) 0.000 0.000
UC Pearson correlation 0.438* 0.645
* 0.692
* 1
Sig. (2-tailed) 0.000 0.000 0.000
SQ Pearson correlation 0.430* 0.652
* 0.720
* 0.755
* 1
Sig. (2-tailed) 0.000 0.000 0.000 0.000
* Correlation is significant at the 0.01 level (2-tailed).
Moderation Analysis using Structure Equation Model (SEM)
SEM is more diverse and multipurpose as compared to most of other
multivariate procedures as it permits to analyze multiple relationships
between dependent and independent variables simultaneously.
Table 6. Model fit summary and baselines comparisons
Model P CMIN/DF NFI Delta1 TLI rho2 CFI RMSEA
Default model 0.034 4.508 1.000 0.990 1.000 0.069
Saturated model 1.000 1.000 0.684
Independence model 0.000 350.200 0.000 0.000 0.000
As shown in Table 6 of CMIN, p-value is 0.034 and CMIN/DF is
4.508, representing a good model fit as described by Tabachnick and
Fidell (2007). Findings suggested that the research framework
proposed in this study can be utilized to identify the effect of service
quality on satisfaction. Since moderators used in this relationship are
the major contributors, future research can be initiated in any service
industry using this framework. Baseline comparisons shows that NFI
statistics is 1.000, representing a very perfect model fit. TLI is 0.990,
CFI statistics is 1.000, showing a standard model fit. All these model
fit indices clearly depict the causal model. RMSEA value at .069 also
showed a model fit within reasonable assortments (Hair et al., 1998).
Results in Table 7 of Structural Equation Modeling (SEM) showed
that service quality has a substantial positive impact on student
satisfaction (p-value of 0.00<0.05). Beta value for direct relation is
0.671 showing a strong effect of service quality on student
satisfaction.

Service Quality and Student Satisfaction: The Moderating Role of University … 249
Estimates and Findings
Table 7. Model summary and coefficients (with moderator)
Dependent
variable
Independent
variable Estimate SE
Critical
ratio
p-
values Result
Student
satisfaction
Service
quality 0.671 0.143 4.706 0.000 Accept
University reputation as moderator
Student
satisfaction
University
reputation -0.221 0.009 -23.761 0.000 Accept
Price as moderator
Student
satisfaction Price -0.258 0.006 -44.169 0.000 Accept
University culture as moderator
Student
satisfaction
University
culture 0.400 0.041 9.771 0.000 Accept
In the presence of university reputation (as a moderator), there
exists a significant negative moderating association of university
reputation and price between service quality and student satisfaction.
In contrast, university culture plays a substantial positive moderator in
relationship of service quality and student satisfaction.
Fig. 3. Mediation model

250 (IJMS) Vol. 10, No. 1, Winter 2017
Discussion
This research investigated the relationship between service quality and
student satisfaction with the moderating role of university reputation,
price, and university culture. Results identified that service quality
strongly and significantly impacts the students’ satisfaction in
education sector. Findings suggested that currently it is imperative for
the Higher Education Institutes (HEIs) to guarantee quality of service
for students to augment students’ satisfaction. Findings are consistent
with the studies accomplished by Kordshouli et al. (2016),
Ferdousipour (2016), Azizi et al. (2014), Ali and Mohamed (2014),
Shah (2013), Enayati et al. (2013), Rahim (2012), and Dado et al.
(2012).
Along with service quality, strong university culture can bring
student satisfaction into account. Findings of the study suggested that
there is a substantial moderating association of university culture
between service quality and student satisfaction. Findings are in
accordance with the results of Uprety and Chhetri (2014).
Reputation of any university or HEI is important in determining the
worth of that institute. Findings suggested that there is a substantial
moderating association of university reputation between service
quality and student satisfaction. Results are consistent with the studies
conducted by Dib and Alnazer (2013), and Ntabathia (2013).
Outcomes suggested that there is a substantial moderating
association of price between service quality and student satisfaction.
These conclusions supported the study conducted by Tuan (2012).
Conclusion
This study focused on the service quality of Higher Educational
Institutes (HEIs) to attain student satisfaction through the moderating
effect of university reputation, price and university culture.
Conclusively, the association between service quality and student
satisfaction is positively strengthened by the university culture, while
price and university reputation negatively strengthened the
relationship.

Service Quality and Student Satisfaction: The Moderating Role of University … 251
Although it was tried to collect data from all the four provinces of
Pakistan, because of logistics and financial restrictions, the study is
limited to only 20 Universities/HEIs out of 173.
Education sector managers are suggested to extend the quality
enhancement scope to student satisfaction because satisfaction is the
very next predictor influencing student’s future behavioral intentions.
HEIs should improve overall service for a long-term revenue
generation. To meet the international standards of education, special
attention is required to upgrade infrastructure and other allied
facilities, as well as to improve the communication skills of the
students, to establish efficient quality enhancement cells and job
placement cells, and to arrange industrial visits and study tours to
enhance practical skills of the students.
This research has been conducted on much wider scale but it only
measures the perceptions of the students. Further studies can be done
to explore the perception of other stakeholders including the
academic, non-academic staff and parents. This study is a cross-
sectional survey. In future, a longitudinal investigation approach will
offer a foundation for more valuable clarifications and explanations.
Future researchers should advance inspection of the impact of service
quality on student satisfaction in the presence of customer value or on
HEIs performance.

252 (IJMS) Vol. 10, No. 1, Winter 2017
References
Abdullah, F. (2006). The development of HEdPERF: A new measuring
instrument of service quality for the higher education sector.
International Journal of Consumer Studies, 30(6), 569-581.
Ahangaran, M. R., Afshar, A., & Ghaed, M. (2016). Evaluating the cultural
management of Islamic dressing at universities (Case study:
Evaluating the attitude of students (girls and boys) of Islamic Azad
University, Central Tehran Branch). Iranian Journal of Management
Studies, 9(1), 193-215.
Ali, A. Y. S., & Mohamed, A. I. (2014). Service quality provided by higher
education institutions in Somalia and its impact on student
satisfaction. European Journal of Business and Management, 6(11),
143-148.
Andam, R., Montazeri, A., Feizi, S., & Mehdizadeh, R. (2015). Providing a
multidimensional measurement model for assessing quality of sport
tourism services: Empirical evidence from sport conference as sport
event tourism. Iranian Journal of Management Studies, 8(4), 607-629.
Anderson, E. W., Fornell, C., & Lehmann, D. R. (1994). Customer
satisfaction, market share, and profitability: Findings from
Sweden. The Journal of Marketing, 58(3), 53-66.
Antic, M., & Ceric, A. (2008). Proceedings from 8th International
Conference on Organization, Technology, Management in
Construction: Organizational Culture of Faculty of Civil Engineering.
Zegreb, Croatia.
Athiyaman, A. (1997). Linking student satisfaction and service quality
perceptions: The case of university education. European Journal of
Marketing, 31(7), 528-540.
Azizi, S., Kapak, S. J., & Tarhandeh, F. (2014). Physical distribution service
quality through Iranian convenience stores retailers’ perspectives: A
mixed method approach. Iranian Journal of Management Studies,
7(1), 121-150.
Babaei, D., Rahimian, H., Ahmad, A., Omar, Z., & Idris, K. (2015). Ability
mediation effects in the relationships between human resource
practices and service quality. Iranian Journal of Management
Studies, 8(1), 5-25.
Bartell, M. (2003). Internationalization of universities: A university culture-
based framework. Higher Education, 45(1), 43-70.
Bei, L. T., & Chiao, Y. C. (2001). An integrated model for the effects of
perceived product, perceived service quality, and perceived price
Service Quality and Student Satisfaction: The Moderating Role of University … 253
fairness on consumer satisfaction and loyalty. Journal of Consumer
Satisfaction, Dissatisfaction and Complaining Behavior, 14, 125-140.
Bolton, L. E., Warlop, L., & Alba, J. W. (2003). Consumer perceptions of
price (un) fairness. Journal of Consumer Research, 29(4), 474-491.
Bromley, D. B. (2000). Psychological aspects of corporate identity, image
and reputation. Corporate Reputation Review, 3(3), 240-252.
Buttle, F. (1996). SERVQUAL: Review, critique and research agenda.
European Journal of Marketing, 30(1), 8-31
Byrne, B. M. (1998). Structural equation modeling with LIRSEL, PRELIS
and SIMPLIS: Basic concepts, applications and programming.
Mahwah, NJ: Lawrence Erlbaum Associates.
Carmines, E. G., & Zeller, R. A. (1979). In reliability and validity
assessment (Quantitative applications in the social sciences). New
York: SAGE Publications.
Chang, J. C. (2009). Taiwanese tourists' perceptions of service quality on
outbound guided package tours: A qualitative examination of the
SERVQUAL dimensions. Journal of Vacation Marketing, 15(2), 165-
178.
Clemes, M. D., Gan, C., Kao, T. H., & Choong, M. (2008). An empirical
analysis of customer satisfaction in international air travel. Innovative
Marketing, 4(2), 50-62.
Creswell, J. (2002). Educational research: Planning, conducting, and
evaluating quantitative and qualitative research. Upper Saddle River.
NJ: Merrill Prentice Hall.
Cronin, J. J., Brady, M. K., & Hult, G. T. M. (2000). Assessing the effects of
quality, value, and customer satisfaction on consumer behavioral
intentions in service environments. Journal of Retailing, 76(2), 193-
218.
Dado, J., Petrovicova, J. T., Cuzovic, S., & Rajic, T. (2012). An empirical
examination of the relationships between service quality, satisfaction
and behavioral intentions in higher education setting. Serbian Journal
of Management, 7(20), 203-218.
Dib, H., & Alnazer, M. (2013). The impact of service quality on student
satisfaction and behavioral consequences in higher education services.
International Journal of Economy, Management and Social Sciences,
2(6), 285-290.
Elliott, K. M., & Shin, D. (2002). Student satisfaction: An alternative
approach to assessing this important concept. Journal of Higher
Education Policy and Management, 24(2), 197-209.
Enayati, T., Modanloo, Y., Behnamfar, R., & Rezaei, A. (2013). Measuring

254 (IJMS) Vol. 10, No. 1, Winter 2017
service quality of Islamic Azad University of Mazandaran using
SERVQUAL Model. Iranian Journal of Management Studies, 6(1),
99-116.
Eshghi, A., Roy, S. K., & Ganguli, S. (2008). Service quality and customer
satisfaction: An empirical investigation in Indian mobile
telecommunications services. Marketing Management Journal, 18(2),
119-144.
Ferdousipour, L. (2016). The relationship among public service motivation,
Civic-Organizational Behavior (OBC), and service quality. Iranian
Journal of Management Studies, 9(1), 1-20.
Fombrun, C. J., & Van Riel, C. B. M. (2003). Fame & fortune: How the
world's top companies develop winning reputations. Upper Saddle
River, NJ: Pearson Education.
Gay, L. R., & Airasian, P. W. (2003). Educational research: Competencies
for analysis and applications (7th ed.). Upper Saddle River, NJ:
Merrill Prentice Hall.
Gotsi, M., & Wilson, A. M. (2001). Corporate reputation seeking a
defination. Corporate Communications: An International Journal,
6(1), 24-30.
Gronroos, C. (1990). Service management and marketing, managing the
moments of truth in service competition. Lexinton, MA: Lexinton
Books.
Grunig, J. E., & Hung, C. J. (2002). Proceedings from the Public Relations
Society of America Educator's Academy: The Effect of Relationships
on Reputation and Reputation on Relationships: A Cognitive
Behavioural Study. Miami, Florida.
Hair, J. F., Anderson, R. E., Tatham, R. L., & Black, W. C. (1998).
Multivariate data analysis. (5th ed.). Upper Saddle River, NJ:
Printice- Hall Inc.
Hanif, M., Hafeez, S., & Riaz, A. (2010). Factors affecting customer
satisfaction. International Research Journal of Finance and
Economics, 60, 44-52.
Helgesen, O., & Nesset, E. (2007). What accounts for students’ loyalty?
Some field study evidence. International Journal of Educational
Management, 21(2), 126-143.
Hoyt, J. E., Brown, A. B. (2003). Identifying college choice factors to
successfully market your istitution. College and University, 78(4), 3-
10.
Hu, H. H., Kandampully, J., & Juwaheer, T. D. (2009). Relationships and
impact of service quality, perceived value, customer satisfaction and

Service Quality and Student Satisfaction: The Moderating Role of University … 255
image: An emperical Study. The Service Industry Journal, 29(2), 111-
125.
Huang, T. -H., Liu, Y. -C., & Chang, H. -C. (2012). Learning achievement in
solving world-based mathematical questions through a computer
assistance learning system. Journal of Educational Technology &
Society, 15(1), 248-259.
Husain, F., Hanim, S., Fernando, Y., & Nejati, M. (2009). Education service
delivery and student's satisfaction: A study of private colleges in
Malaysia. Global Business and Management Research: An
International Journal, 1, 64-72.
Ijaz, A., Irfan, S. M., Shahbaz, S., Awan, M., & Sabir, M. (2011). An
empirical model of student satisfaction: Case of Pakistani public
sector business schools. Journal of quality and Technology
Management, 7(2), 91-114.
Iwaarden, V., J., & Van der Wiele, T. (2002). A study on the applicability of
SERVQUAL dimensions for websites. Erim Report Series Research
in Management. Available on the ERIM website: www.erim.eur.nl.
Kao, T. H. (2007). University students’ satisfaction: An empirical analysis.
Master of Commerce and Management Thesis, Lincoln University.
Kordshouli, H. R., Jafarpour, Y., & Bouzanjani, A. A. (2016). An analysis of
the pro-social behaviors of customers in response to the firms' service
quality. Iranian Journal of Management Studies, 9(1), 21-41.
Kotler, P., & Armstrong, G. (2010). Principles of marketing (13th ed.).
Upper Saddle River, NJ: Prentice Hall.
Kotter, J. P., & Haskett, J. L. (1992). Corporate culture and performance.
New York: Free Press.
Lagrosen, S. (2001). Strengthening the weakest link of TQM-from customer
focus to customer understanding. The TQM Magazine, 13(5), 348-354.
Mavondo, F., Zaman, M., & Abubakar, B. (2000). Proceedings from
ANZMAC 2000 Australian and New Zealand Marketing Academy
Conference: Student Satisfaction with Tertiary Institution and
Recommending It to Prospective Students. 787-792.
McDougall, G., & Levesque, T. (2000). Customer satisfaction with services:
Putting service value into the equation. Journal of Services Marketing,
14(5), 392-410.
Muijs, D. (2004). Validity, reliability and generalisability. Doing
quantitative research in education with SPSS (Sage, London), 64-84.
Mulaik, S. A., James, L. R., Alstine, J. V., Bennet, N., Lind, S., & Stillwell,
C. D. (1989). Evaluation of goodness-of-fit indices for structural
equation models. Psychological Bulletin, 105(3), 430-45.

256 (IJMS) Vol. 10, No. 1, Winter 2017
Murphy, K., and Balzer, W. (1989). Rate error and rating accuracy. Journal
of Applied Psychology, 71, 619-624.
Nguyen, N., & LeBlanc, G. (2001). Image and reputation of higher
education institutions in students’ retention decisions. International
Journal of Educational Management, 15(6), 303-311.
Ntabathia, M. (2013). Service quality and student satisfaction of students in
private universities in Nairobi County. A Research Project for MBA
Degree, Nairobi, Kenya.
Nunnally, J. C. (1978). Psychometric theory. New Yourk: McGraw Hill.
Owlia, M., & Aspinwall, E. (1998). A framework for measuring quality in
engineering education. Total Quality Managemenet, 9(6), 501-18.
Parasuraman, A., Berry, L., & Zeithaml, V. (1991). Refinement and
Reassessment of the SERVQUAL Scale. Journal of Retailing, 67(4),
420-450.
Parasuraman, A., Zeithaml, V. A., & Berry, L. L. (1985). A conceptual
model of service quality and its implications for future research.
Journal of Marketing, 49(4), 41-50.
Parasuraman, A., Zeithaml, V. A., & Berry, L. L. (1988). SERVQUAL: A
multiple-item scale for measuring customer perceptions of service
quality. Journal of Retailing, 64(1), 12-40.
Parasuraman, A., Zeithaml, V. A., & Berry, L. L. (1994). Reassessment of
expectations as a comparison standard in measuring service quality:
Implications for further research. Journal of Marketing, 58, 111-124.
Petrick, J. (2002). Development of a multi-dimensional scale for measuring
the perceived value of a service. Journal of Leisure Research, 34(2),
119-134.
Presley, C. A. (1993). Alcohal and Drugs on american college campuses.
Use, Consequences, and Perceptions of the Campus Environment, 1,
1989-1991.
Quinn, R. E., & Rohrbaugh, J. (1983). A spatial model of effectiveness
criteria: Towards a competing values approach to organizational
analysis. Management Science, 29(3), 363-377.
Rahim, D. M. -U. (2012). Service quality, student satisfaction and branding
for business schools. AIMA Journal of Management & Research,
6(4/4).
Roberts-Lombard, M. (2009). Customer retention strategies implemented by
fast-food outlets in the Gauteng, Western Cape and KwaZulu-Natal
Provinces of South Africa: A focus on something fishy, nando’s and
steers. African Journal of Marketing Management, 1(2), 70-80.

Service Quality and Student Satisfaction: The Moderating Role of University … 257
Salami, S. O. (2005). Discriminant analysis of academic abilities and work
values of career choice of high school adolescents in Southwestern
Nigeria. Journal of Personality Study and Group Behaviour, 25, 49-
73.
Schreiber, J. B., Stage, F. K., King, J. N., A., & Barlow, E. A. (2006).
Reporting structural equation modeling and confirmatory factor
analysis results: A review. The Journal of Education Research, 99(6),
323-338.
Sevier, R. A. (1994). Image is everything: Strategies for measuring,
changing, and maintaining your institution's image. College and
University, 69(2), 60-75.
Shah, F. T. (2013). Service quality and service satisfaction. Journal of
Quality and Technology Management, 9(2), 73-89.
Sporn, B. (1996). Managing university culture: An analysis of the
relationship between institutional culture and management
approaches. Higher Education, 32(1), 41-61.
Suter, W. N. (2006). Introduction to educational research: A critical
thinking approach. Thousand Oaks, CA: Sage.
Sweeney, J., & Soutar, G. (2001). Consumer perceived value: The
development of a multiple item scale. Journal of Retailing, 77(2),
203-220.
Tabachnick, B. G., & Fidell, L. S. (2007). Using multivariate statistics (5th
ed.). New York: Allyn and Bacon.
Tinklin, T., Riddell, S., & Wilson, A. (2004). Policy and provision for
disabled students in higher education in Scotland and England: The
current state of play. Studies in Higher Education, 29(5), 637-657.
Tuan, N. M. (2012). Effects of service quality and price fairness on student
Satisfaction. International Journal of Business and Social Science,
3(19), 132-150.
Uprety, R., & Chhetri, S. B. (2014). College culture and student satisfaction.
Journal of Education and Research, 4(1), 77-92
Van den Bosch, A. L., De Jong, M. D., & Elving, W. J. (2005). How
corporate visual identity supports reputation. Corporate
Communications: An International Journal, 10(2), 108-116.
Weirs-Jenssen, J., Stensaker, B., & Grogaard, J. (2002). Student satisfaction:
Towards an empirical deconstruction of the concept. Quality in
Higher Education, 8(2), 183-196.
Yin, R. K. (2003). Applied social research methods series. Thousand Oaks,
London, New York: Sage.

258 (IJMS) Vol. 10, No. 1, Winter 2017
Zeithaml, V. A. (1988). Consumer perceptions of price, quality, and value: A
means-end model and synthesis of evidence. Journal of Marketing,
52(3), 2-22.
Zeithaml, V. A., & Bitner, M. J. (1996). Services marketing (1st ed.). New
York: McGraw- Hill.
Zeithaml, V. A., & Bitner, M. J. (2000). Service marketing: Integrating
customer focus across the firm (2nd ed.). New York: McGraw- Hill.
Zindi, F. (1994). Sexual harassment in Zimbabwe’s institutions of higher
education. Zambezia, 21(2), 177-185.