online supplement increased nitric oxide bioavaliability...
TRANSCRIPT

1
ONLINE SUPPLEMENT
INCREASED NITRIC OXIDE BIOAVALIABILITY IN ADULT GRK2- HEMIZYGOUS MICE PROTECTS AGAINST ANGIOTENSIN II-INDUCED HYPERTENSION
María S. Avendaño*,1,2, Elisa Lucas*,3,4, María Jurado-Pueyo3,4, Sonia Martínez-Revelles1,2, Rocío Vila-Bedmar3,4, Federico Mayor Jr.3,4, Mercedes Salaices1,2, Ana M. Briones&,1,2, Cristina Murga&,3,4
*Equal contribution &Corresponding authors
1Departamento de Farmacología, Facultad de Medicina, Universidad Autónoma de Madrid, Spain 2Instituto de Investigación Sanitaria La Paz, Madrid, Spain. 3Departamento de Biología Molecular and Centro de Biología Molecular “Severo Ochoa”, Universidad Autónoma de Madrid and CSIC, Spain 4Instituto de Investigación Sanitaria La Princesa, Madrid, Spain
Short title: GRK2 deficiency prevents hypertension development
Corresponding authors: Dr. Cristina Murga Dpto. Biología Molecular, Centro de Biología Molecular "Severo Ochoa" Facultad de Ciencias. Universidad Autónoma de Madrid Nicolás Cabrera 1, 28049-Madrid, Spain Phone: 34911964641 Fax: 3491196 44 20 [email protected]
Dr. Ana M. Briones Dpto. Farmacología Facultad de Medicina. Universidad Autónoma de Madrid Arzobispo Morcillo 2, 28029-Madrid, Spain Phone: 34914975399 Fax: 3491497 53 80 [email protected]
2
METHODS
Animal models
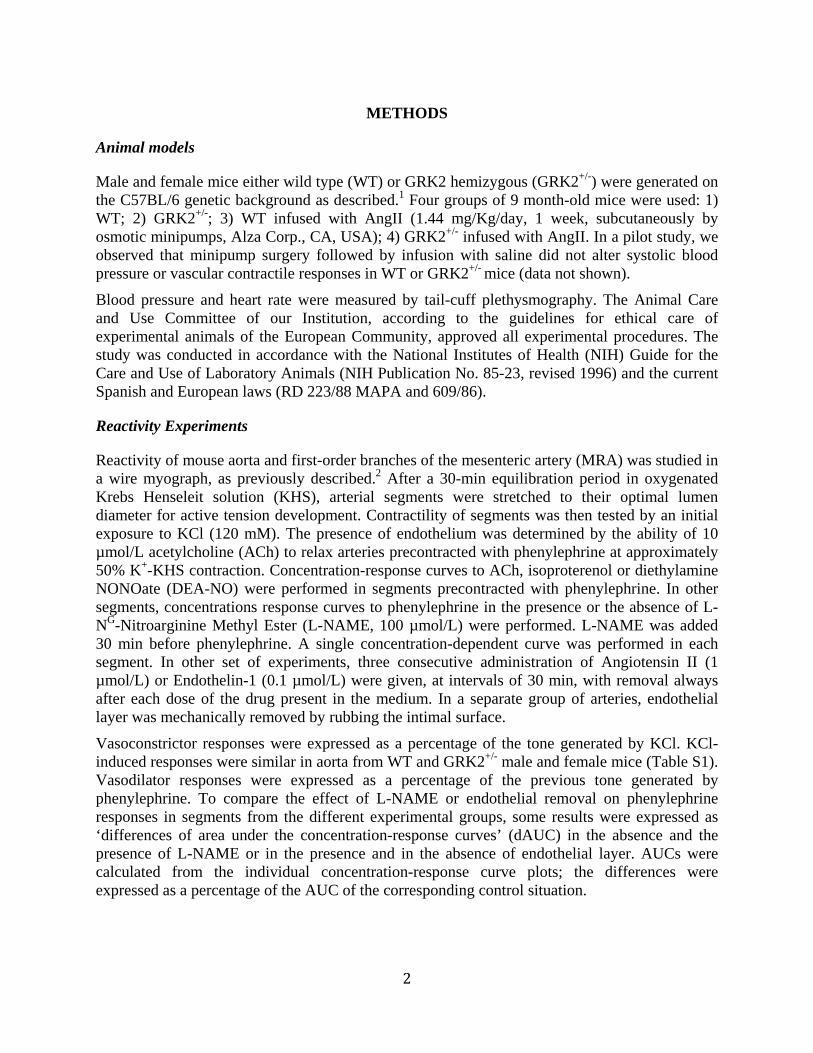
Male and female mice either wild type (WT) or GRK2 hemizygous (GRK2+/-) were generated on the C57BL/6 genetic background as described.1 Four groups of 9 month-old mice were used: 1) WT; 2) GRK2+/-; 3) WT infused with AngII (1.44 mg/Kg/day, 1 week, subcutaneously by osmotic minipumps, Alza Corp., CA, USA); 4) GRK2+/- infused with AngII. In a pilot study, we observed that minipump surgery followed by infusion with saline did not alter systolic blood pressure or vascular contractile responses in WT or GRK2+/- mice (data not shown).
Blood pressure and heart rate were measured by tail-cuff plethysmography. The Animal Care and Use Committee of our Institution, according to the guidelines for ethical care of experimental animals of the European Community, approved all experimental procedures. The study was conducted in accordance with the National Institutes of Health (NIH) Guide for the Care and Use of Laboratory Animals (NIH Publication No. 85-23, revised 1996) and the current Spanish and European laws (RD 223/88 MAPA and 609/86).
Reactivity Experiments
Reactivity of mouse aorta and first-order branches of the mesenteric artery (MRA) was studied in a wire myograph, as previously described.2 After a 30-min equilibration period in oxygenated Krebs Henseleit solution (KHS), arterial segments were stretched to their optimal lumen diameter for active tension development. Contractility of segments was then tested by an initial exposure to KCl (120 mM). The presence of endothelium was determined by the ability of 10 µmol/L acetylcholine (ACh) to relax arteries precontracted with phenylephrine at approximately 50% K+-KHS contraction. Concentration-response curves to ACh, isoproterenol or diethylamine NONOate (DEA-NO) were performed in segments precontracted with phenylephrine. In other segments, concentrations response curves to phenylephrine in the presence or the absence of L-NG-Nitroarginine Methyl Ester (L-NAME, 100 µmol/L) were performed. L-NAME was added 30 min before phenylephrine. A single concentration-dependent curve was performed in each segment. In other set of experiments, three consecutive administration of Angiotensin II (1 µmol/L) or Endothelin-1 (0.1 µmol/L) were given, at intervals of 30 min, with removal always after each dose of the drug present in the medium. In a separate group of arteries, endothelial layer was mechanically removed by rubbing the intimal surface.
Vasoconstrictor responses were expressed as a percentage of the tone generated by KCl. KCl-induced responses were similar in aorta from WT and GRK2+/- male and female mice (Table S1). Vasodilator responses were expressed as a percentage of the previous tone generated by phenylephrine. To compare the effect of L-NAME or endothelial removal on phenylephrine responses in segments from the different experimental groups, some results were expressed as ‘differences of area under the concentration-response curves’ (dAUC) in the absence and the presence of L-NAME or in the presence and in the absence of endothelial layer. AUCs were calculated from the individual concentration-response curve plots; the differences were expressed as a percentage of the AUC of the corresponding control situation.
3
NO Release
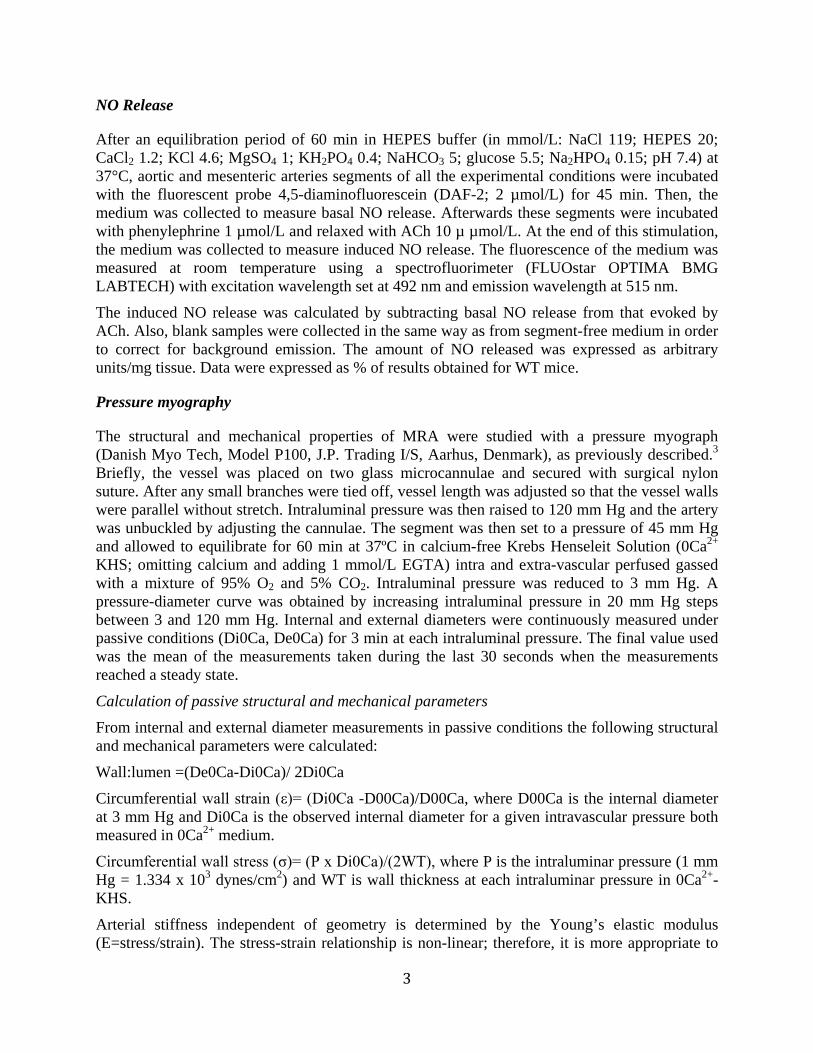
After an equilibration period of 60 min in HEPES buffer (in mmol/L: NaCl 119; HEPES 20; CaCl2 1.2; KCl 4.6; MgSO4 1; KH2PO4 0.4; NaHCO3 5; glucose 5.5; Na2HPO4 0.15; pH 7.4) at 37°C, aortic and mesenteric arteries segments of all the experimental conditions were incubated with the fluorescent probe 4,5-diaminofluorescein (DAF-2; 2 µmol/L) for 45 min. Then, the medium was collected to measure basal NO release. Afterwards these segments were incubated with phenylephrine 1 µmol/L and relaxed with ACh 10 µ µmol/L. At the end of this stimulation, the medium was collected to measure induced NO release. The fluorescence of the medium was measured at room temperature using a spectrofluorimeter (FLUOstar OPTIMA BMG LABTECH) with excitation wavelength set at 492 nm and emission wavelength at 515 nm.
The induced NO release was calculated by subtracting basal NO release from that evoked by ACh. Also, blank samples were collected in the same way as from segment-free medium in order to correct for background emission. The amount of NO released was expressed as arbitrary units/mg tissue. Data were expressed as % of results obtained for WT mice.
Pressure myography
The structural and mechanical properties of MRA were studied with a pressure myograph (Danish Myo Tech, Model P100, J.P. Trading I/S, Aarhus, Denmark), as previously described.3 Briefly, the vessel was placed on two glass microcannulae and secured with surgical nylon suture. After any small branches were tied off, vessel length was adjusted so that the vessel walls were parallel without stretch. Intraluminal pressure was then raised to 120 mm Hg and the artery was unbuckled by adjusting the cannulae. The segment was then set to a pressure of 45 mm Hg and allowed to equilibrate for 60 min at 37ºC in calcium-free Krebs Henseleit Solution (0Ca2+ KHS; omitting calcium and adding 1 mmol/L EGTA) intra and extra-vascular perfused gassed with a mixture of 95% O2 and 5% CO2. Intraluminal pressure was reduced to 3 mm Hg. A pressure-diameter curve was obtained by increasing intraluminal pressure in 20 mm Hg steps between 3 and 120 mm Hg. Internal and external diameters were continuously measured under passive conditions (Di0Ca, De0Ca) for 3 min at each intraluminal pressure. The final value used was the mean of the measurements taken during the last 30 seconds when the measurements reached a steady state.
Calculation of passive structural and mechanical parameters From internal and external diameter measurements in passive conditions the following structural and mechanical parameters were calculated:
Wall:lumen =(De0Ca-Di0Ca)/ 2Di0Ca
Circumferential wall strain (ε)= (Di0Ca -D00Ca)/D00Ca, where D00Ca is the internal diameter at 3 mm Hg and Di0Ca is the observed internal diameter for a given intravascular pressure both measured in 0Ca2+ medium.
Circumferential wall stress (σ)= (P x Di0Ca)/(2WT), where P is the intraluminar pressure (1 mm Hg = 1.334 x 10³ dynes/cm2) and WT is wall thickness at each intraluminar pressure in 0Ca2+-KHS.
Arterial stiffness independent of geometry is determined by the Young’s elastic modulus (E=stress/strain). The stress-strain relationship is non-linear; therefore, it is more appropriate to

4
obtain a tangential or incremental elastic modulus (Einc) by determining the slope of the stress-strain curve (Einc=δσ/δε). Einc was obtained by fitting the stress-strain data from each animal to an exponential curve using the equation:
βεσ=σ eorig where σorig is the stress at the original diameter (diameter at 3 mmHg). Taking derivatives on the above equation we see that Einc=βσ. For a given σ value, Einc is directly proportional to β. An increase in β implies an increase in Einc which means an increase in stiffness.
Histological analysis and vessel morphometry
Aortas were fixed with 4% paraformaldehyde and embedded in Tissue Tek OCT medium. 10-µm cross sections from fixed aortas were stained with hematoxylin-eosin. All images were acquired at room temperature using a microscope (DM2000; Leica) with 10× objective. Morphometric determinations of the lumen and vessel areas were performed by using Metamorph image analysis software (Universal Imaging, Molecular Devices Corp. Downingtown, PA, USA). All microscopic images of the sections were traced for the calculations of the areas. To determine the luminal area, the cross-sectional area enclosed by the internal elastic lamina was corrected to a circle by applying the form factor l2/4π to the measurement of the internal elastic lamina, where l is the length of the lamina. Vessel area was determined by the cross-sectional area enclosed by the external elastic lamina corrected to a circle, applying the same form factor (l2/4π) to the measurement of the external elastic lamina. The media area was calculated as the difference between the corrected vessel and luminal areas. Internal and external diameters were calculated from luminal and vessel areas, respectively. This method avoids miscalculations of areas caused by eventual collapse of the immersion-fixed arteries.4
Western Blot
Frozen aortas and mesenteric arteries were pulverized using liquid nitrogen and a smasher and homogenized in RIPA buffer (100 mmol/L Tris-HCl pH 7.4, 0.6 mol/L NaCl, 2% Triton x-100 (v/v), 0.2% SDS, 1% DOC) completed with protease and phosphatase inhibitors (100 μmol/L PMSF, 1 μmol/L Benzamidine, 10 μg/mL STI, 16 μU Aprotinine, 10 μg/mL Bacitracine and Phosphatase Inhibitor Cocktail (PhosSTOP, Roche) following the manufacturer´s protocol for 1 h. at 4ºC. Next, samples were centrifuged at maximum speed and supernatants were quantified. To determine protein expression, 30-40 μg of protein were resolved on a 7.5% SDS-PAGE gel and transferred to nitrocellulose. The membrane was immunoblotted using primary antibodies against eNOS (BD Transduction Laboratories) (1:1000), phospho-Akt (Ser473) (Cell Signaling) (1:1000), Akt (Cell Signaling) (1:1000), GRK2 (Santa Cruz) (1:1000), AT1 (Santa Cruz) (1:200), AT2 (Santa Cruz) (1:200) and GAPDH (Abcam) (1:5000). Blots were developed using fluorescently labelled secondary antibodies and measured the signal on a LiCOR Odyssey scanner. Data were normalized to GAPDH or total protein values, and expressed as % over results obtained for untreated or WT mice.

5
qRT-PCR
mRNA from frozen aortas were extracted using metal beads (2 min, 30 Hz) in a Tissue Lyser and Fibrous Tissue RNeasy Mini Kit, both from QIAGEN. For quantitative PCR, total RNA was reverse transcribed using SuperScript® III First-Strand Synthesis System (Invitrogen) according manufacturer´s protocol. cDNAs were quantified by real-time PCR on an Applied Biosystems 7900HT Fast Real-Time PCR System, using specific primers for mouse Adra1d: 5′-GTC TTC GTC CTG TGC TGG TT-3′ and 5′-CTT GAA GAC GCC CTC TGA TG-3′, Agtr1a: 5′-TCT GCT GCT CTC CCG GAC T-3′ and 5′-TGC TGT GAG TTA TCC CAG ACA AAA TG-3′, Agtr1b: 5′-GTG ACA TGA TCC CCT GAC AGT-3′ and 5′-AGT GAG TGA ACT GTC TAG CTA AAT GC-3′, Agtr2: 5′-GGG AGC TGA GTA AGC TGA TTT ATG A-3′ and 5′-AGC AAC TCC AAA TTC TTA CAC CTT TTT A-3′, Ednra: 5′-ACC CTC GTT CTC CAG CTC A-3′ and 5′-TTG GTC TCA CGC CTT TCT TT-3′, Ednrb: 5′-AAT GGT CCC AAT ATC TTG ATC G-3′ and 5′-TCC AAA TGG CCA GTC CTC T-3′, Adrbk1: 5′-GCA GTT TGT CCT GCA GTG TG -3′ and 5′-TTC ATC TTG GGT ACT CGC TGT-3′, Hprt: 5′-CCT GGT TCA TCA TCG CTA ATC-3′ and 5′-TCC TCC TCA GAC CGC TTT T-3′, Rps29: 5′-CTG AAC ATG TGC CGC CAG T-3′ and 5′-TCA AGG TCG CTT AGT CCA ACT TAA T-3′, Gapdh: 5′-CTC CCA CTC TTC CAC CTT CG-3′ and 5′-CAT ACC AGG AAA TGA GCT TGA CAA-3′, β-actin: 5′-CTA AGG CCA ACC GTG AAA AG-3′ and 5′-ACC AGA GGC ATA CAG GGA CA-3′ and 18S: 5′-CTC AAC ACG GGA AAC CTC AC-3′ and 5′-CGC TCC ACC AAC TAA GAA CG-3′. PCR amplification was performed in a volume of 10 μl containing 2.5 μmol/L of each primer and 5 μl Power Sybr Green PCR Master Mix (Applied Biosystems). The conditions were 95 °C for 10 min, followed by 40 cycles of 15 s at 95 °C, 60 s at 60 °C, followed by 15 s at 95 ºC, 15 s at 60 ºC and 15 s at 95 ºC. Adra1d, Agtr1a, Agtr1b, Agtr2, Ednra and Ednrb mRNA levels were subsequently normalized to Hprt, Rps29 and Gapdh mRNA which were the better for normalization according NormFinder software because of their stability through the different groups under study. The results obtained were analysed by GenEx 5.3.7 software.
Data Analysis and Statistics
All data are expressed as mean values±SEM and n represents the number of animals. Results were analyzed by two-way ANOVA for repeated measures followed by Bonferroni’s post hoc test for the concentration response curves data, and by unpaired Student’s t-test, Mann-Whitney or one-way ANOVA for the other measurements. Statistical symbols in the concentration response curves indicate differences in the two way ANOVA when placed close to the curve and differences in the post hoc test when placed above or below individual doses. A p<0.05 was considered significant.

6
REFERENCES 1. Jaber M, Koch WJ, Rockman H, Smith B, Bond RA, Sulik KK, Ross J Jr, Lefkowitz RJ,
Caron MG, Giros B. Essential role of beta-adrenergic receptor kinase 1 in cardiac development and function. Proc Natl Acad Sci U S A. 1996; 93: 12974-12979.
2. Martínez-Revelles S, Avendaño MS, García-Redondo AB, Alvarez Y, Aguado A, Pérez-Girón
JV, García-Redondo L, Esteban V, Redondo JM, Alonso MJ, Briones AM, Salaices M. Reciprocal Relationship Between Reactive Oxygen Species and Cyclooxygenase-2 and Vascular Dysfunction in Hypertension. Antioxid Redox Signal. 2013;18:51-65.
3. Briones AM, Rodríguez-Criado N, Hernanz R, García-Redondo AB, Rodrigues-Díez RR,
Alonso MJ, Egido J, Ruiz-Ortega M, Salaices M. Atorvastatin prevents angiotensin II-induced vascular remodeling and oxidative stress. Hypertension. 2009;54:142-149.
4. Bonthu S, Heistad DD, Chappell DA, Lamping KG, Faraci FM. Atherosclerosis, vascular
remodeling, and impairment of endothelium dependent relaxation in genetically altered hyperlipidemic mice. Arterioscler Thromb Vasc Biol. 1997; 17:2333–2340.

Table S1. Effect of partial GRK2 deletion (GRK2+/-) on vasoconstrictor responses in
aortic rings from male and female mice.
Male Female
Vasoconstrictor
drug
WT GRK2+/- WT GRK2+/-
KCl (mN/mm) 2.50±0.31 2.82±0.45 2.59±0.12 2.61±0.19
Phe (Emax)
(mN/mm)
0.69±0.12 1.14±0.17* 1.25±0.18 1.83±0.16*
ET-1 (Emax)
(mN/mm)
0.08±0.05 0.26±0.05* - -
Ang II (Emax)
(mN/mm)
0.07±0.02 0.08±0.06 - -
Data are expressed as mean±SEM. n=4-12. *P<0.05 vs WT.

-10 -8 -6 -4
0
40
80
Phe (Log M)
A
***
-9 -8 -7 -6 -5 -4
0
50
100
-9 -8 -7 -6 -5 -4
0
50
100
B C
ACh (Log M) Isoproterenol (Log M)
0
100
200
300
400
-9 -8 -7 -6 -5 -4
0
50
100
DEA-‐NO (Log M)
E D
*** ***
**
NO
(% o
f WT)
WT GRK2+/-‐
Rela
xa�o
n ( %
)
Rela
xa�o
n ( %
)
Cont
rac�
on (%
KCl
)
WT GRK2+/-‐
Figure S1. Effects of partial GRK2 deficiency on vasoconstrictor and vasodilator responses and in NO production in aorta from female adult mice. Concentration-response curve to phenylephrine (Phe) (A), acetylcholine (ACh) (B), isoproterenol (C), and diethylamine NONOate (DEA-NO) (E) and quantification of ACh-induced NO release (D) in aorta from female wild type (WT) and GRK2+/- mice. n=7-10. *P<0.05, **P<0.01, ***P<0.001.
* * * * *
0
5
10
0
3
5
AngII (1 µM)
WT GRK2+/-‐
** B
ET-‐1 (0.1 µM)
1st 2nd 3rd 1st 2nd 3rd
+
++
+
++ + +
* *
A
Cont
rac�
on (%
KCl
)
C
Adra1d Agtr1a Agtr1b Agtr2 Ednra Ednrb Adrbk1
0.0
0.5
1.0
1.5
2.0
* Gen
e ex
pres
sion
(n
-‐fold
)
WT GRK2+/-‐
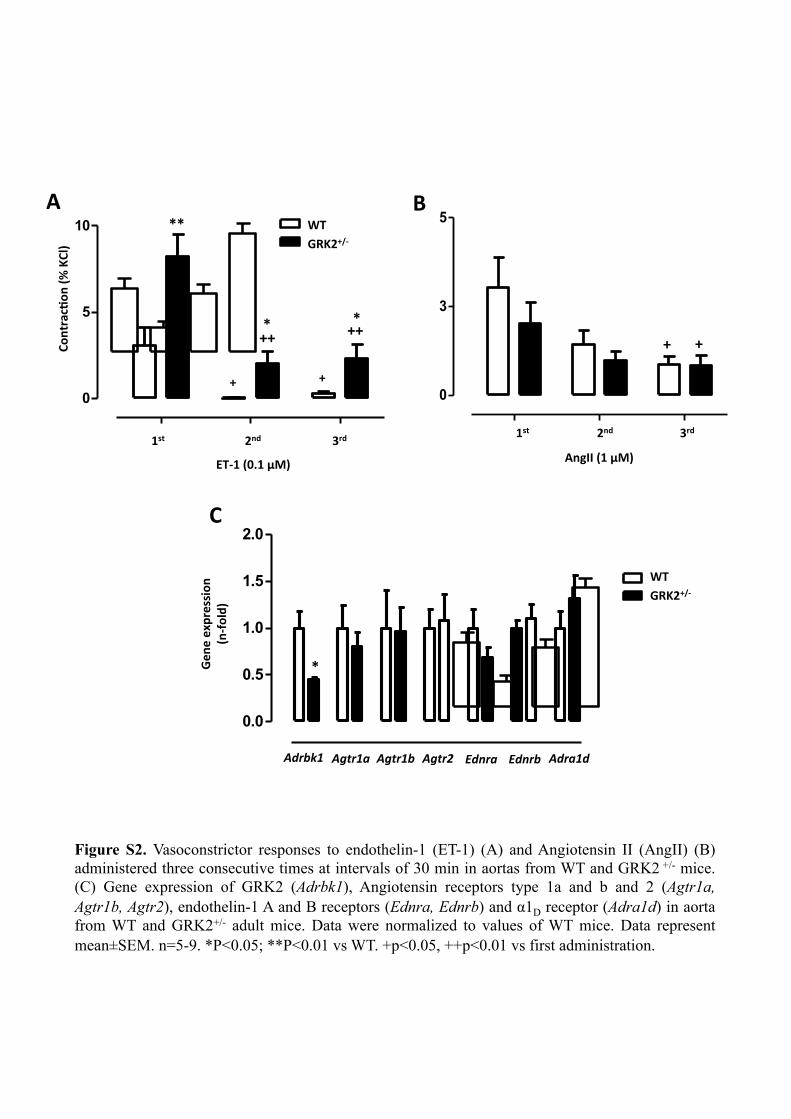
Figure S2. Vasoconstrictor responses to endothelin-1 (ET-1) (A) and Angiotensin II (AngII) (B) administered three consecutive times at intervals of 30 min in aortas from WT and GRK2 +/- mice. (C) Gene expression of GRK2 (Adrbk1), Angiotensin receptors type 1a and b and 2 (Agtr1a, Agtr1b, Agtr2), endothelin-1 A and B receptors (Ednra, Ednrb) and α1D receptor (Adra1d) in aorta from WT and GRK2+/- adult mice. Data were normalized to values of WT mice. Data represent mean±SEM. n=5-9. *P<0.05; **P<0.01 vs WT. +p<0.05, ++p<0.01 vs first administration.

A
B
Figure S3. Effects of partial GRK2 deficiency on protein expression of GRK2 and AT1 and AT2 receptors. Representative Western Blot and quantification of the protein expression of GRK2 and AT1 and AT2 receptors (AT1R, AT2R) in aorta (A) and mesenteric resistance arteries (MRA) (B) from WT and GRK2+/- mice. Data were normalized to GAPDH and to values of WT mice that were considered as 100%. n=4-7. *P<0.05 vs WT.
GRK2 AT1R AT2R GAPDH
WT GRK2+/-‐
0
40
80
120
Prot
ein
leve
ls/G
APDH
(%
of W
T) WT
GRK2+/-‐
GRK2 AT1R AT2R
* *
GRK2 AT1R AT2R GAPDH
WT GRK2+/-‐
0
40
80
120
Prot
ein
leve
ls/G
APDH
(%
of W
T) WT
GRK2+/-‐
GRK2 AT1R AT2R
*
AORTA
MRA

-9 -8 -7 -6 -5 -4
0
50
100
-9 -8 -7 -6 -5 -4
0
50
100
-9 -8 -7 -6 -5 -4
0
50
100 **
A
C
Rela
xa�o
n ( %
)
ACh (Log M)
**
Rela
xa�o
n (%
)
Isoproterenol (Log M)
DEA-‐NO (Log M)
Rela
xa�o
n ( %
)
E
G
0
50
100
150
200
250
*
NO
(% o
f WT)
-9 -8 -7 -6 -5 -4
0
50
100
-9 -8 -7 -6 -5 -4
0
50
100
B
D ACh (Log M)
Isoproterenol (Log M)
-9 -8 -7 -6 -5 -4
0
50
100
DEA-‐NO (Log M)
F
***
***
WT GRK2+/-‐
WT GRK2+/-‐
Figure S4. Partial GRK2 deficiency increases vasodilator responses and nitric oxide (NO) production in mesenteric resistance arteries (MRA). Concentration-response curve to acetylcholine (ACh) (A,B), isoproterenol (C,D) and diethylamine NONOate (DEA-NO) (E,F) in MRA from adult male and female wild type (WT) and GRK2+/- mice. (G) Quantification of ACh-induced NO release in MRA from male WT and GRK2+/- mice. n=5-10. *P<0.05, **P<0.01, ***P<0.001.
Male Female
*

0
100
200
300
400
500*
Hear
t ra
te (B
PM)
WT GRK2+/-‐
*
CONTROL AngII
Figure S5. Partial GRK2 deficiency does not modify the effect of Angiotensin II (AngII) infusion on heart rate. Heart rate is expressed as beats per minute (BPM) and was determined in male wild type (WT) and GRK2+/- mice untreated (CONTROL) or treated with AngII. n=5-7. *P<0.05 vs control.
0 50 100
50
100
150
200
250
300
A B Lu
men
dia
met
er (µ
m)
0 50 100
50
100
150
200
250
300
Vess
el d
iam
eter
(µm
)
0 50 100
20
30
40
WT GRK2+/-‐
C
Wal
l Thi
ckne
ss (µ
m)
Intraluminal pressure (mm Hg) 0 50 100
0.0
0.1
0.2
0.3
0.4
Wal
l/lu
men
Intraluminal pressure (mm Hg)
D
E
0 50 100
0.0
0.5
1.0
1.5
Incr
emen
tal d
iste
nsib
ility
(%
mm
Hg-‐1
)
Intraluminal pressure (mm Hg)
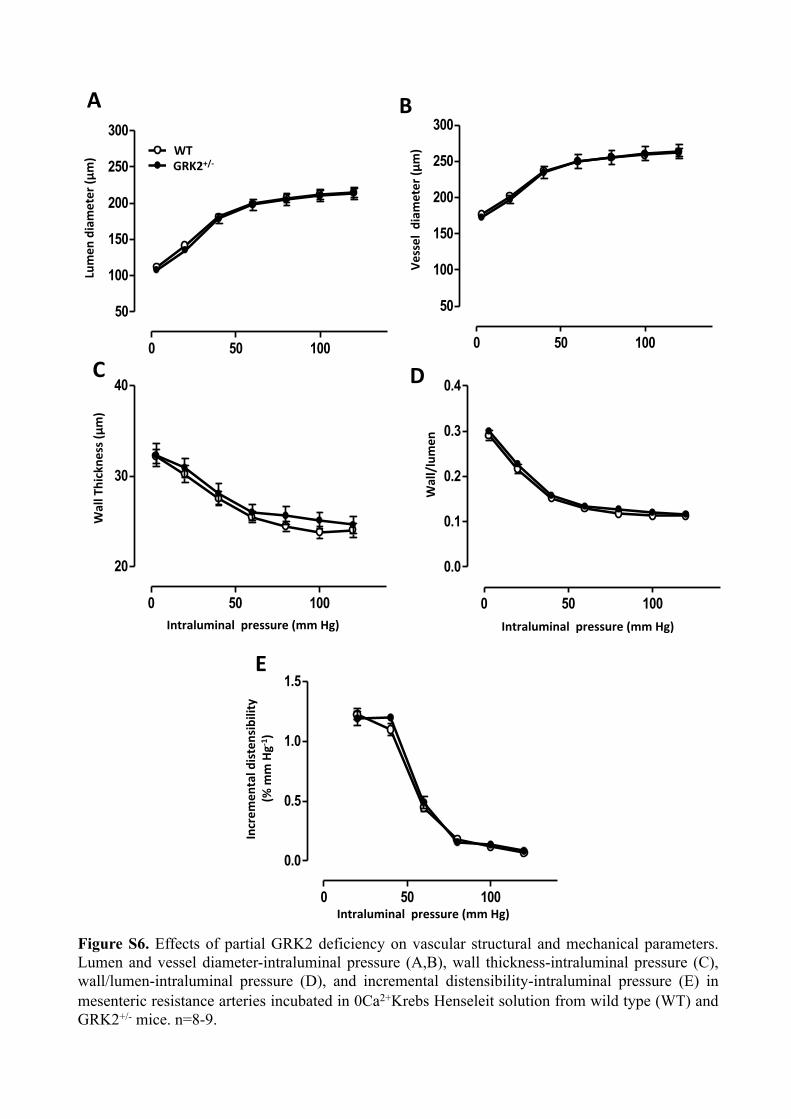
Figure S6. Effects of partial GRK2 deficiency on vascular structural and mechanical parameters. Lumen and vessel diameter-intraluminal pressure (A,B), wall thickness-intraluminal pressure (C), wall/lumen-intraluminal pressure (D), and incremental distensibility-intraluminal pressure (E) in mesenteric resistance arteries incubated in 0Ca2+Krebs Henseleit solution from wild type (WT) and GRK2+/- mice. n=8-9.

0 50 100
0
100
200
300B
D
0 50 100
0
100
200
300
0 50 100
10
20
30
40
GRK2+/-‐
F
Intraluminal pressure (mm Hg)
GRK2+/-‐ AngII
0 50 100
0
100
200
300A
Lum
en d
iam
eter
(µm
) WT WT AngII
C
0 50 100
0
100
200
300
Vess
el d
iam
eter
(µm
)
0 50 100
10
20
30
40E
Wal
l Thi
ckne
ss (µ
m)
Intraluminal pressure (mm Hg)
**
* ***
* ***
Figure S7. Effects of partial GRK2 deficiency on vascular structural parameters in Angiotensin II (AngII) infused mice. Lumen (A,B) and vessel diameter-intraluminal pressure (C,D) and wall thickness-intraluminal pressure (E,F) in mesenteric resistance arteries incubated in 0Ca2+Krebs Henseleit solution from wild type (WT) and GRK2+/- mice untreated and treated with AngII. n=5-7. *P<0.05, **P<0.01 , ***P<0.001 vs untreated.

0 50 100
0.0
0.5
1.0
1.5
0 50 100
0.0
0.5
1.0
1.5
WT
A
WT AngII
Incr
emen
tal d
iste
nsib
ility
(%
mm
Hg-‐1
)
Intraluminal pressure (mm Hg)
GRK2+/-‐
B
GRK2+/-‐ AngII
Intraluminal pressure (mm Hg)
***
Figure S8. Effects of partial GRK2 deficiency on vascular mechanical parameters in Angiotensin II (AngII)-infused mice. Incremental distensibility-intraluminal pressure in mesenteric resistance arteries incubated in 0Ca2+Krebs Henseleit solution from wild type (WT) (A) and GRK2+/- (B) mice untreated and treated with AngII. n=5-7. ***P<0.001 vs untreated.

-10 -8 -6 -4
0
40
80
120
160CONTROL E+ CONTROL E-‐
Cont
rac�
on (%
KCl
)
Phe (Log M)
WT AngII A
***
-10 -8 -6 -4
CONTROL E+ CONTROL E-‐
Phe (Log M)
GRK2 +/-‐ AngII B
***
Figure S9. Partial GRK2 deficiency increases endothelial modulation of vasoconstrictor responses. Effect of endothelium removal (E-) on the concentration-response curve to phenylephrine (Phe) in aortic segments from wild type (WT) (A) and GRK2+/- (B) mice treated with Angiotensin II (AngII). Data represent mean±SEM. n=4. *P<0.05, ***P<0.001.
-9 -8 -7 -6 -5 -4
0
50
100
A B WT WT AngII
Rela
xa�o
n (%
)
ACh (Log M)
**
-9 -8 -7 -6 -5 -4
0
50
100
GRK2+/-‐
GRK2+/-‐ AngII
ACh (Log M)
**
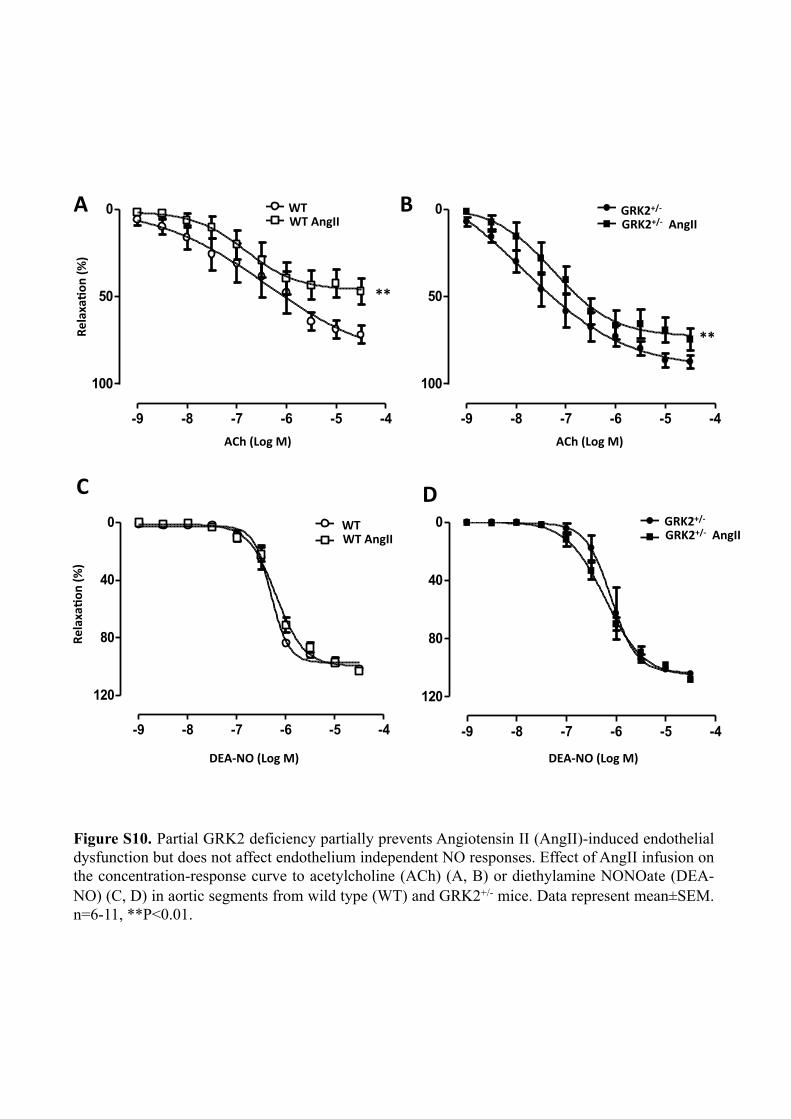
Figure S10. Partial GRK2 deficiency partially prevents Angiotensin II (AngII)-induced endothelial dysfunction but does not affect endothelium independent NO responses. Effect of AngII infusion on the concentration-response curve to acetylcholine (ACh) (A, B) or diethylamine NONOate (DEA-NO) (C, D) in aortic segments from wild type (WT) and GRK2+/- mice. Data represent mean±SEM. n=6-11, **P<0.01.
C D
Rela
xa�o
n (%
)
DEA-‐NO (Log M) DEA-‐NO (Log M)
-9 -8 -7 -6 -5 -4
0
40
80
120
WT WT AngII
-9 -8 -7 -6 -5 -4
0
40
80
120
GRK2+/-‐
GRK2+/-‐ AngII

GRK2 GRK2
WT GRK2+/-
Vasoconstriction
eNOS
AKT
NO
eNOS
AKT
HYPERTENSION HYPERTENSION
Adverse vascular
remodeling Increased stiffness
Adverse vascular remodeling Increased stiffness
Vasodilation
Vasoconstriction
Vasodilation
Differential regulation of vasodilator vs vasoconstrictor GPCR
Differential regulation of vasodilator vs vasoconstrictor GPCR
NO bioavailability
P P
NO bioavailability
NO NO
NO
NO
NO
Figure S11. Role of GRK2 in hypertension and vascular responses. GRK2 participates in the regulation of vasoconstrictor and vasodilator G protein-coupled receptors (GPCR). However, GRK2 is also involved in non GPCR-dependent pathways such as the interaction with Akt that inhibits Akt-dependent activation of nitric oxide synthase (NOS) thus impairing nitric oxide (NO) production. Upon Angiotensin II (AngII) challenge, adult GRK2+/- mice show improved vascular remodeling, decreased vascular stiffness, increased Akt activation, less reduced eNOS expression and increased NO production. This provokes decreased vasoconstrictor and increased vasodilator responses what, together with improved vascular structure and mechanics, leads to resistance to severe AngII-induced hypertension.