only - mekong river commission · pöyry energy ltd. (thailand) vanit ii bldg, 22nd floor,...
TRANSCRIPT

VOLUME 5 TBIA/CIA REPORT
115002924 May 10 , 2019
Rev 0
LUANG PRABANG POWER COMPANY LIMITEDLuang Prabang HPP
Cumulative and Transboundary Impact Assessment
Report – Volume 5
For PNPCA O
nly

For PNPCA O
nly

VOLUME 5 CIA/TBIA REPORT
1150002924 May 10, 2019
Rev 0
LUANG PRABANG POWER COMPANY LIMITED Luang Prabang HPP
Cumulative and Transboundary Impact Assessment
Report – Volume 5
For PNPCA O
nly

For PNPCA O
nly

Contact
Pöyry Energy Ltd. (Thailand)
Vanit II Bldg, 22nd Floor, Room#2202 - 2204
1126/2 New Petchburi Road
Makkasan, Rajchthewi
TH-10400 BANGKOK
Thailand
Tel. +66 2 650 3171-2
Robert Braunshofer, Business Manager
Mobile: +66 92 264 0734
For PNPCA O
nly

For PNPCA O
nly

“This report has been prepared by Pöyry Energy Ltd. (“Consultant”) for Luang
Prabang Power Company Limited (“Client”, “LPCL”) pursuant to the Contract
signed between them (“Agreement”). This report is based in part on information
not within Pöyry’s control. While the information provided in this report is
believed to be accurate and reliable under the conditions and subject to the
qualifications set forth herein Pöyry does not, without prejudice to Pöyry’s
obligations towards the Client under the Agreement, make any representations or
warranties, expressed or implied, as to the accuracy or completeness of such
information.
Use of this report and any of the estimates contained herein by anyone else than
the Client (“Third Party User”) shall therefore be at the Third Party User’s sole
risk. Any use by a Third Party User shall constitute a release and agreement by
the Third Party User to defend and indemnify Pöyry from and against any liability
of Pöyry, whatsoever in type or nature, in connection with such use, whether
liability is asserted to arise in contract, negligence, strict liability or other theory
of law.
All information contained in this report is of confidential nature and may be used
and disclosed by the Client solely in accordance with the terms and conditions
set forth in the Agreement.”
All rights are reserved. This document or any part thereof may not be copied or reproduced
without permission in writing from Pöyry Energy Ltd For PNPCA O
nly

For PNPCA O
nly

STRUCTURE OF THE FEASIBILITY STUDY
VOLUME 1:
VOLUME 2:
VOLUME 3:
VOLUME 4:
VOLUME 5:
VOLUME 6:
EXECUTIVE SUMMARY
MAIN REPORT
DRAWINGS
ENVIRONMENTAL AND SOCIAL IMPACT ASSESSMENT
TRANSBOUNDARY ENVIRONMENTAL IMPACT ASSESSMENT AND CUMULATIVE IMPACT
ASSESSMENT
ANNEXES
For PNPCA O
nly

For PNPCA O
nly
Luang Prabang HPP 115002924 Cumulative and Transboundary Impact Assessment Report
Copyright © Pöyry Energy Ltd.
Table of Contents
EXECUTIVE SUMMARY ................................................................................................................... I
1 INTRODUCTION .................................................................................................................. 1
1.1 Purpose of the CIA and TBIA Report ...................................................................................... 2 1.2 Significance of Cumulative and Transboundary Impacts ........................................................ 2 1.3 Relations to the Projects Specific Impact Studies .................................................................... 2
2 THE PROJECT ...................................................................................................................... 3
3 LEGAL AND ADMINISTRATIVE FRAMEWORK ........................................................ 5
4 CUMULATIVE AND TRANSBOUNDARY IMPACTS ................................................... 6
4.1 Methodology and Approach ..................................................................................................... 6 4.2 Determination of Valued Ecosystem Components (VECs) ..................................................... 6
5 RELEVANT ISSUES ............................................................................................................. 8
5.1 Hydropower Development Plan ............................................................................................... 8 5.1.1 Hydropower Development at the Mekong Mainstream ........................................................... 8 5.1.1.1 Lancang Cascade ...................................................................................................................... 8 5.1.1.2 Hydropower Development in Lao PDR ................................................................................... 9 5.1.2 Project Features ...................................................................................................................... 10 5.1.3 Reservoir Operation ............................................................................................................... 11 5.2 Hydrology .............................................................................................................................. 12
5.2.1 Introduction ............................................................................................................................ 12 5.2.2 Overview of Previous Studies ................................................................................................ 12 5.2.3 Catchment .............................................................................................................................. 12 5.2.3.1 Mekong River Basin .............................................................................................................. 12
5.2.3.2 Physiography .......................................................................................................................... 14 5.2.3.3 Macroclimate ......................................................................................................................... 16 5.2.4 Data Collection and Processing ............................................................................................. 16 5.2.4.1 Discharge Data ....................................................................................................................... 16 5.2.4.2 Precipitation ........................................................................................................................... 18
5.2.5 Evapotranspiration ................................................................................................................. 18 5.2.6 Temperature ........................................................................................................................... 18 5.2.7 Hydro-Meteorological Characteristics ................................................................................... 19
5.2.7.1 Precipitation ........................................................................................................................... 19
5.2.7.2 Temperature & Evapotranspiration ........................................................................................ 19 5.2.8 Inflow Hydrology ................................................................................................................... 20 5.2.8.1 Discharge Time Series ........................................................................................................... 20
5.2.8.2 Water Balance Model ............................................................................................................. 21 5.2.8.3 Simulation Results of Natural Streamflow for the Calibration Period .................................. 23 5.2.8.4 Inflow Time Series LP HPP Site ............................................................................................ 24 5.2.9 Flood Hydrology .................................................................................................................... 25 5.2.9.1 Statistical Analysis ................................................................................................................. 25 5.2.9.2 Probable Maximum Flood ..................................................................................................... 27 5.2.10 Impact of Lancang Cascade ................................................................................................... 31
For PNPCA O
nly

For PNPCA O
nly

Luang Prabang HPP 115002924 Cumulative and Transboundary Impact Assessment Report
Copyright © Pöyry Energy Ltd.
5.2.11 Impacts to the Tonle Sap Great Lake System ........................................................................ 33 5.2.12 Hydrological Impact of the LP HPP - Conclusion ................................................................. 35 5.3 Water Quality ......................................................................................................................... 35 5.4 Sediment Transport ................................................................................................................ 36 5.4.1 General Terms and Definitions .............................................................................................. 36 5.4.2 Findings from Literature Concerning Sediment Transport within the Mekong .................... 37 5.4.3 Trend Analyses ...................................................................................................................... 39 5.4.4 Sediment Concentration ......................................................................................................... 41 5.4.5 Conclusion and Findings Concerning Sediment Transport ................................................... 42 5.5 Fish and Fisheries ................................................................................................................... 45 5.5.1 Importance of Local Fisheries ................................................................................................ 45 5.5.2 Fish Species Identified in the Zone from Chiang Saen to Vientiane ..................................... 45 5.5.3 Fish Migration Pattern in the Upper Mekong Migration System .......................................... 46 5.5.4 Fish Migration Facilities ........................................................................................................ 48
5.5.4.1 General ................................................................................................................................... 48 5.5.4.2 Design Criteria ....................................................................................................................... 48 5.5.4.3 Fish Migration Concept ......................................................................................................... 49 5.5.4.4 Upstream Fish Passing Facilities ........................................................................................... 50 5.5.4.5 Right Bank Fish Passing Facility (Upstream Migration) ....................................................... 53 5.5.4.6 Downstream Fish Passing Facilities ...................................................................................... 53 5.5.4.7 Main downstream migration facilities ................................................................................... 54 5.5.4.8 Fish Friendly Turbines ........................................................................................................... 55 5.5.5 Conclusion and Findings Concerning Fish Migration and Fisheries ..................................... 55 5.6 Food and Nutrition ................................................................................................................. 56 5.6.1 General Aspects ..................................................................................................................... 56 5.6.2 Conclusion and Findings Concerning Nutrition .................................................................... 58 5.7 Impacts Related to Other Development Projects Construction ............................................. 58
5.7.1 China-Lao Railway Project .................................................................................................... 60 5.7.2 Pak Beng HPP ........................................................................................................................ 62 5.7.3 Xayaburi HPP ........................................................................................................................ 63 5.7.4 Hongsa-Chiangman Road and the new Bridge across Mekong River Project ...................... 63 5.7.5 Development around Luang Prabang City and World Heritage status .................................. 63 5.8 Social Issues ........................................................................................................................... 64 5.8.1 Land Use Pattern .................................................................................................................... 65
5.8.2 Socio-Economic Parameters .................................................................................................. 65 5.8.3 Social conflict, risk of STD (sexually transmitted disease), human trafficking and other
behavioural issues. ................................................................................................................. 65 5.8.4 Transport ................................................................................................................................ 66 5.8.5 Conclusion and Findings Concerning Social Issues .............................................................. 66
6 CONCLUSIONS AND RECOMMENDATIONS ............................................................. 67
6.1 Prediction of Cumulative Impacts .......................................................................................... 67
6.2 Prediction of Transboundary Impacts .................................................................................... 68
7 REFERENCES ..................................................................................................................... 70
ANNEX ................................................................................................................................................ 71
A) Used Literature concerning Sediment Transport within the Mekong .................................... 71
For PNPCA O
nly

For PNPCA O
nly

Luang Prabang HPP 115002924 Cumulative and Transboundary Impact Assessment Report
Copyright © Pöyry Energy Ltd.
B) Sediment-related impacts due to upstream reservoir trapping, the Lower Mekong River
(Kummu and Varis, 2006) ..................................................................................................... 72 C) Hydrology & Sediment Baseline Assessment Working Paper - Volume II (ICEM for MRC,
2010) ...................................................................................................................................... 75 D) The MRCS Xayaburi Prior Consultation Project Review Report - Annex 3 Review of
Sediment Transport, Morphology, and Nutrient Balance (SEG for MRCS, 2011) ............... 78 E) Changes in sediment load of the Lancang-Mekong River and its response to the hydro-power
development (Liu et al, 2012) ................................................................................................ 79 F) Assessment of Xayaburi dam impact on solid transportation - Draft Final Report of Step 1
(CNR for Lao PDR, 2013a) ................................................................................................... 80 G) Characterization of grain-size distribution of Mekong River sediments (from Chiang Saen to
Nong Khai) - Final Report (CNR for Lao PDR, 2013b) ........................................................ 80 H) Assessment of Xayaburi dam impact on solid transportation - Draft Final Report of Step 2
(CNR for Lao PDR, 2013c) ................................................................................................... 82
I) Discharge Sediment Monitoring Project (DSMP) 2009 – 2013 Summary & Analysis of
Results - Final Report (Koehnken for MRC, 2014) ............................................................... 83 J) Summary report of decision support for generating sustainable hydropower in the Mekong
Basin - Draft 2 (IKMP & WWF for MRCS, 2014) ............................................................... 87 K) Hydraulic Continuity Equation .............................................................................................. 89
List of Figures
Figure 1-1: Project location......................................................................................................... 1 Figure 2-1: Overview of the LP HPP project sites...................................................................... 4 Figure 5-1: Hydropower along the Mekong Mainstream ........................................................... 8 Figure 5-2: Hydropower project at the Mekong mainstream in Lao PDR................................ 10 Figure 5-3: Mekong River basin and neighbouring countries. ................................................. 13
Figure 5-4: Mekong River Catchment at Luang Prabang Dam Site ......................................... 14 Figure 5-5: Physiographic regions of the Mekong River basin (source: MRC). ...................... 15 Figure 5-6: River gauging stations at the Mekong mainstream. ............................................... 17 Figure 5-7: Precipitation Datasets for the Mekong Catchment................................................. 19 Figure 5-8: Potential Evapotranspiration of Mekong Catchment ............................................. 20 Figure 5-9: Gauges and sub-catchments ................................................................................... 21 Figure 5-10: Conceptual Structure of the Applied Water Balance Model .................................. 22
Figure 5-11: Comparison of Observed and Simulated Discharge (1980 – 1989) ....................... 23 Figure 5-12: Comparison of Mean Monthly Flows at Chiang Saen and Luang Prabang ........... 23 Figure 5-13: Inflow Series 1951 to 2018 for LP HPP Site ......................................................... 24 Figure 5-14: Mean Monthly Discharge LP HPP Site ................................................................. 24 Figure 5-15: Flow Duration Curve for LP HPP Site ................................................................... 24
Figure 5-16: Design Flood Values for LP HPP Site ................................................................... 26 Figure 5-17: 24-hour 5000 km² PMP map by the U.S. Weather Bureau .................................... 28
Figure 5-18: PMP isohyets for Main Mekong River PMF by the U.S. Weather Bureau ........... 29 Figure 5-19: Left: PMP Depth-Area Relation............................................................................. 30 Figure 5-20: Assumed Synthetic Rainfall Development ............................................................ 30 Figure 5-21: PMF Simulation for Luang Prabang HEPP ........................................................... 31 Figure 5-22: Comparison of the Relative Discharge Change at Chiang Saen ............................ 32
Figure 5-23: Impact of the Lancang Cascade ............................................................................. 32 Figure 5-24: Map of lower Mekong River Basin. ....................................................................... 34 Figure 5-25: Trend Analysis of Suspended Sediment Concentration ......................................... 40 Figure 5-26: Trend Analysis ....................................................................................................... 41
For PNPCA O
nly

For PNPCA O
nly

Luang Prabang HPP 115002924 Cumulative and Transboundary Impact Assessment Report
Copyright © Pöyry Energy Ltd.
Figure 5-27: Total Suspended Solid (TSS) ................................................................................. 41 Figure 5-28: Longitudinal Evolution of Mekong River annual sediment load ........................... 42 Figure 5-29: Flow velocities towards the powerhouse for Q=3,000 m3/s .................................. 43 Figure 5-30: Flow velocities towards the powerhouse for Q=5,000 m3/s .................................. 44 Figure 5-31: Fish migration pattern ............................................................................................ 47 Figure 5-32: Overview of the Foreseen Fish Migration Facilities .............................................. 49 Figure 5-33: General Arrangement of the Upstream Fish Migration Facilities .......................... 51 Figure 5-34: Attraction Flow for Upstream Migration ............................................................... 52 Figure 5-35: Downstream Migration System ............................................................................. 54 Figure 5-36: Demographics of Laos ........................................................................................... 56 Figure 5-37: China-Laos Railway map and the major stations ................................................... 61 Figure 5-38: Chinese Railway construction ................................................................................ 62 Figure 5-39: Location of the LP HPP related Development Projects ......................................... 64 Figure 7-1: Mean flows at selected sites in the Mekong mainstream ....................................... 73
Figure 7-2: Suspended sediment fluxes in the Lower Mekong Basin, ..................................... 74 Figure 7-3: Some estimates of sediment load at Chiang Saen: ................................................. 76 Figure 7-4: Average annual mainstream sediment load (Source: ICEM, 2010) ....................... 76 Figure 7-5: Comparison of pre- and post-Manwan dam TSS concentrations .......................... 77 Figure 7-6: Overview of field survey perimeter for the study .................................................. 81 Figure 7-7: Longitudinal distribution ........................................................................................ 82 Figure 7-8: (left) Percentages of medium and fine sand, silt and clay...................................... 84 Figure 7-9: Bedload monitoring results for Chiang Saen. ........................................................ 85 Figure 7-10: Sediment concentrations ........................................................................................ 86 Figure 7-11: Sediment rating curves ........................................................................................... 86
List of Tables
Table 5-1: Hydropower plants in operation of the Lancang cascade ........................................ 9 Table 5-2: Mekong mainstream HPP projects as per GoL optimization study. ...................... 10 Table 5-3: Catchment area and flow of Mekong River basin countries. ................................. 13 Table 5-4: Overview of available flow data of Mekong River and tributaries. ....................... 17
Table 5-5: Flood Discharges for Different Return Periods ..................................................... 26 Table 5-6: Dry Season Flood Discharges for Different Return Periods .................................. 27 Table 5-7: American Geophysical Union classification .......................................................... 37
Table 5-8: Relevant Tailwater Levels for the Fish Migration Facilities ................................. 49 Table 5-9: Potential cumulative impact by other development projects construction............. 58
Table 7-1: Used literature upon sediment transport in Mekong River .................................... 71 Table 7-2: Estimations of mean annual sediment transport rates in Mekong.......................... 73 Table 7-3: Summary of the suspended sediment data ............................................................. 74
Table 7-4: Water discharge, SSC and TSS concentrations and fluxes .................................... 74
Table 7-5: Assumed sediment yield from principal sediment sources .................................... 78
Table 7-6: Estimated indicative times for reservoirs ............................................................... 79 Table 7-7: Plausible evolution of the sediment inputs ............................................................ 83
Table 7-8: Summary of monitoring frequency for discharge, ................................................. 83 Table 7-9: Summary of annual sediment fluxes (Mt/yr) ......................................................... 84 Table 7-10: Sediment budget for sand, silt and clay ................................................................. 85
Table 7-11: Average annual suspended sediment loads (Source: IKMP & WWF, 2014) ........ 87 Table 7-12: Summary of field measurements and grain-size analyses ...................................... 88 Table 7-13: Summary of bedload transport estimates based on field measurements ................ 88
Table 7-14: Summary of sediment transport estimates in the Mekong ..................................... 88
For PNPCA O
nly

For PNPCA O
nly

Luang Prabang HPP 115002924 Cumulative and Transboundary Impact Assessment Report
Copyright © Pöyry Energy Ltd.
LIST OF ACRONYMS AND ABBREVIATIONS
Abbreviation Complete Expression
AMS Annual maximum series
BOD Biochemical Oxygen Demand
CIA Cumulative Impact Assessment
COD Chemical Oxygen Demand
CRU Climate Research Unit of the University of East Anglia
DESIA Department of Environmental and Social Impact Assessment
DO Dissolved Oxygen
DSMP Discharge and Sediment Monitoring Project
EIA Environmental Impact Assessment
ESIA Environmental Social Impact Assessment
FSL Full Supply Level
GoL Government of Lao
GPCC Global Precipitation Climatology Centre
HPP Hydroelectric Power Plant
IFC International Finance Corporation
LPCL Luang Prabang Power Company Limited
LP HPP Luang Prabang Hydroelectric Power Plant
m asl Meters above sea level
MONRE Ministry of Natural Resources and Environment
MRC Mekong River Commission
MW Megawatt
PDR People’s Democratic Republic (Lao PDR, Laos)
Q Discharge
R Mean annual runoff depth
ROR Run-of-river
TBIA Transboundary Impact Assessment
TSS Total Suspended Solids
VECs Valued Environmental and Social Components
For PNPCA O
nly

For PNPCA O
nly

Luang Prabang HPP 127000034 Cumulative and Transboundary Impact Assessment Report I
Copyright © Pöyry Energy Ltd.
EXECUTIVE SUMMARY
Objective
Each hydroelectric power plant (HPP) generates impacts on society and on environment.
Some impacts occur in the immediate surroundings and have no further effect on
up/downstream regions. Others have greater impact radius and can therefore cause cu-
mulative impacts in combination with other HPPs even causing impacts to neighbouring
countries. The Mekong is a large international river, flowing through 6 countries before
entering the South China Sea. Therefore, a dam project on the main Mekong has a high
potential of transboundary impacts.
The CIA/TBIA is particularly important to identify and describe the changes of the envi-
ronmental and social conditions caused by the combined impact of the past, present and
future (already planned) projects in this area, with a focus on transboundary effects, the
Mekong being an international river. It also covers an assessment of these impacts and
discusses possible mitigation measures.
Legal and Administrative Framework
In addition to adhering to Lao PDR laws, decrees, regulations and guidelines, the LP HPP
CIA/TBIA development refers to international policies, guidelines and standards includ-
ing, but not limited to, the following specific documents:
• Draft cumulative impact assessment guidelines for hydropower projects in the
Lao PDR (Department of Environment and Social Impact Assessment (DESIA)
within the Ministry of Natural Resources and Environment (MONRE)) [8].
• Draft/preliminary/tentative guidelines for transboundary environmental impact
assessment in the lower Mekong basin (Mekong River Commission, 2017) [9].
The CIA guidelines provide guidance and direction for both MONRE and proponents on
the undertaking and assessment of cumulative impact assessment (CIA) in the hydro-
power sector consistent with the IFC’s:
• Good practice handbook, cumulative impact assessment and management: Guid-
ance for the private sector in emerging markets (International Finance
Corporation, 2013) [9].
Hydropower Development at the Mekong Mainstream
The estimated hydropower potential of the lower Mekong Mainstream (excluding China)
is about 10,000 MW, while that of the upper Mekong (Lancang Cascade) in China is
about 21,400 MW, the latter largely already developed or under construction.
In the lower Mekong, the construction of 2 hydropower plants on the Mekong Main-
stream has started, the 1,285 MW Xayaburi HPP (just downstream of LP HPP) and the
256 MW Don Sahong HPP.
For PNPCA O
nly

Luang Prabang HPP 127000034 Cumulative and Transboundary Impact Assessment Report II
Copyright © Pöyry Energy Ltd.
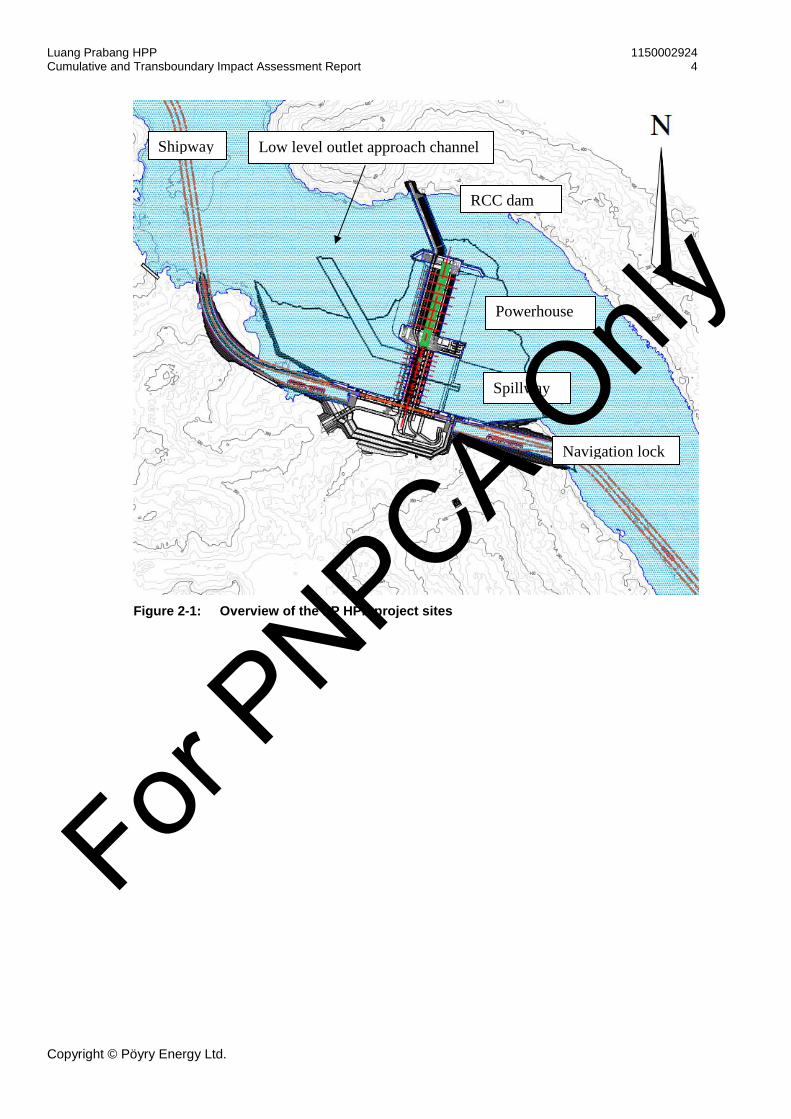
The Project
The LP HPP is planned on the Mekong River approximately 25 km upstream of Luang
Prabang city, and about 4 km upstream of the confluence with Nam Ou River (Figure
1-1). The scheme will be part of a low-head hydropower cascade system along the Me-
kong River, with Pak Beng HPP approximately 170 km upstream, and Xayaburi HPP
approximately 130 km downstream of the proposed site.
The LP HPP is a run-of-river (RoR) plant planned for hydropower generation to export
electricity to Thailand.
The structure across the
river consists of an RCC
dam, a powerhouse and a
spillway section, each of
them approximately one
third of the entire length.
A navigation lock is fore-
seen at the right abut-
ment.
CUMULATIVE IMPACTS
As there are several HPPs upstream and downstream of LP HPP, which are currently
either in operation, under construction or being planned, the cumulative and transbound-
ary impacts of this cascade have to be identified and valued, and the incremental part of
these cumulative impacts attributed to LP HPP have to be pointed out.
Impacts which can occur to be cumulative and/or transboundary are as follows:
• Hydrological and hydraulic impacts such as change in flow pattern, flow velocity,
backwater effects etc.
• Water quality
• Erosion, sedimentation and sediment transport
• Impacts of the HPP under climate change conditions
• Impacts to fish migration and fishery
• Food and nutrition
• Impacts related to construction
• Social issues
Based on project description and baseline environmental and social condition of LP HPP
study area, Valued Ecosystem Components (VECs) for the proposed LP HPP are likely
to include mainly the following:
(a) Hydrology
(b) Water Quality
For PNPCA O
nly

Luang Prabang HPP 127000034 Cumulative and Transboundary Impact Assessment Report III
Copyright © Pöyry Energy Ltd.
(c) Erosion and Sedimentation Transport
(d) Fish, Aquatic Habitats and Fisheries
(e) Food and Nutrition
(f) Social Impacts
Hydrological and Hydraulic Impacts
The LP HPP is a run-of-river hydropower plant (ROR). Its inflow is equal to its outflow
and no storage is used. However, to increase the potential energy the dam increases the
water level of the upstream area, creating a reservoir with a surface area of around 49 km2,
reaching back to the planned Pak Beng HPP. The increase of the water depth increases
the surface of the submerged area, leading to decreased velocities. This causes local im-
pacts (reduced sediment transport and slightly different habitat conditions for aquatic
life), which are discussed in the ESIA.
The backwater will affect the tailwater level at the Pak Beng HPP. Effects of ROR plants
to their upstream and downstream hydrographs are marginal since they do not store water.
Only during the start phase a storage takes place while the reservoir is being impounded
to reach the FSL (15 to 20 days). Afterwards the operation maintains the water level at
FSL with minor changes in elevation of approximately 1 m for minor floods, up to an
increase of 2.2 m for the PMF. An impact to the flow pattern of the river only occurs with
storage plants as they change the flow pattern of the river.
Impacts on Water Quality
Since the residence time of the water is rather short (range of approx. 3 to 9 days), the
whole water volume will be exchanged due to the permanent operation of the turbine and
the frequent operation of the low level outlets. Therefore, no dead zone (zone below min-
imum operation level in a storage power plant) occurs, and this also excludes the for-
mation of a deep water zone with deteriorating water quality.
A proper cleaning of biomass and waste in the reservoir area before impoundment is
mandatory to ensure the water quality can be maintained. Once this is considered there
will be no additional significant impact to water quality during normal HPP operation.
Impacts on Erosion, Sedimentation and Sediment Transport
In the past some sound studies upon sediment transport of Mekong River have been car-
ried out from different organisations and experts. Due to the high trapping efficiency and
a very large storage volume of at least some of the Chinese reservoirs within the Lancang
Cascade it is reasonable that sediment inputs from upstream the Chinese border are ex-
tremely reduced and this situation will last for a very long time (estimations indicate time
spans of several hundred years).
In 1993 the first reservoir, Manwan, of the Lancang Cascade came into operation and
trends for total sediment load can be split into a phase before and after that significant
turning point of the Mekong’s sediment system. In the meanwhile, at least 6 mainstream
dams of the cascade are in operation. It is clearly indicated that for the Post-Manwan era
a significant and likely to be ongoing reduction of the suspended sediment concentration
has been measured.
As a run-of-river plant Luang Prabang has no storage reservoir and no big head. The
velocity near the dam ranges between 0.05 m/s with river flow of 1,000 m3/s to 0.2 m/s
with average river flow (about 4,000 m3/s) to 0.5 m/s with river flow of 10,000 m3/s,
For PNPCA O
nly

Luang Prabang HPP 127000034 Cumulative and Transboundary Impact Assessment Report IV
Copyright © Pöyry Energy Ltd.
being generally higher further upstream along the reservoir. The velocities in the reser-
voir are sufficient to prevent the development of significant turbidity currents. For aver-
age turbine operation flow (about 3,000 m3/s) flow velocities in the main channel area of
the LP HPP are between 0.2 and 0.4 m/s.
However, due to the fact that the barrage will increase the water table upstream and re-
duce the flow velocity some sediment will accumulate in some parts of the reservoir until
a new equilibrium is reached. Once the accumulated sediments have decreased the flowed
area, the velocity will increase again and more sediments will stay in suspension, being
transported downstream eventually.
The results from the sediment modelling (see feasibility study, Poyry 2019), show in
general a potential for sediment deposit along the entire reach, with a higher potential for
deposition between km 2,052 and 2,164. Sediment is deposited in the upper part of the
reach, thus less sediment deposits are shown further downstream near LP HPP. Results
of transported material show for the condition with LP HPP a significant content of fine
silt/clay material, while coarse silt is still transported out of the reach, whereas most of
fine sand material is deposited.
Impacts on Fish, Aquatic Habitats and Fishery
With the possible cascade of run-of-river plants comprising of Pak Beng, Luang Prabang,
Xayaburi, Pak Lay and Sanakham a major part of the area identified as upper Mekong
migration system will have a change in its hydraulic conditions. This will have an effect
on fish migration and habitat availability. Given the high biodiversity and the limited
information on fish migration in the Mekong River, the full extent of this cannot be as-
sessed in detail. However, if spawning areas are lost this will have a major effect to the
fish population. A fish monitoring program will have to be implemented, and mitigative
measures will have to be taken if required. The cascade will provide more deep water
areas, but the rapids will be lost. According to MRC (MRC Tech. paper No. 8 [3]) fishes
mainly migrate into areas further upstream of Pak Beng for spawning.
Only little is known about the spawning habitat requirements for most Mekong fishes.
Generally spawning habitats are believed to be associated with rapids, pools and flood-
plains. In its natural stage this area has not many floodplains, but rapids and some deep
pools. The loss of deep pools might be compensated by creation of the reservoir which
will provide more and larger deep areas.
The flow velocities in the main channel area of the LP HPP are around 0.2 to 0.4 m/s.
This ensures drifting of eggs and larves during normal operation conditions.
With the cascade of ROR plants (Pak Beng to Pak Lay) in place, the variety of flow
conditions and habitats within that part of the Mekong is mostly lost.
Impacts on Food and Nutrition
Considering the fact that LP HPP is a mainstream project with affected communities liv-
ing along the Mekong and huge reliance on rice and fish for their dietary requirement,
the project is expected to cause impact on the nutrient intake of the PAPs and possibly
downstream communities. The actual impact needs to be further assessed with consider-
ation of the fact that the project plans to develop a fish migration system to mitigate the
impact or creating a barrier for fish migration.
For PNPCA O
nly

Luang Prabang HPP 127000034 Cumulative and Transboundary Impact Assessment Report V
Copyright © Pöyry Energy Ltd.
An overarching study of recent upstream and downstream projects such as Pak Beng and
Xayaburi may shed further light on the cumulative projects induced impacts. The type
and quantum of impacts can further clarify appropriate coping and mitigation mechanism
or improvements of the existing mitigation measures. Nevertheless, the project developer
is expected to be responsible to ensure that food and nutrition requirements of PAP are
addressed during the transition period of resettlement and for longer period for the most
vulnerable households.
Social Impacts
Cumulative impacts will be rather short-lived and mostly related to the current ongoing
construction works of the Chinese Lao railway project. As an additional disruption in
river traffic, the travel and transportation along the Mekong River will be further im-
peded.
The installation of navigation locks will serve to reduce these impacts. There will be a
time loss to pass through the navigation lock but on the other hand, the resulting elevation
of the water level and the reduced flow velocities upstream of the dam will simplify pas-
sage for boats transporting passengers and goods.
TRANSBOUNDARY IMPACTS
Hydrology
A transboundary impact from China to all the Mekong- downstream countries is given
by the operation of the storage power plants in the Lancang cascade. The operation causes
a flatter but wider hydrograph since peak flows are cut, but low flows increase. As a
ROR- plant LP HPP is not affecting the hydrograph and has no further hydrological effect
to the downstream countries. Accordingly there is no hydrological impact to the Tonle
Sap great lake system from LP HPP.
However a positive transboundary effect to be mentioned here is given from the Lancang
cascade to the Pak Beng-, Luang Prabang-, Xayaburi- cascade: Since the Lancang cas-
cade changed the flow pattern more water is released during dry month whereas the spill-
way peaks are lower. Therefore more energy can be produce in the latter cascade in an
average year.
Sediment Transport
The Lancang cascade causes a significant transboundary effect to all downstream coun-
tries concerning sediment transport as described in chapter 5.2.10. The Pak Beng, Luang
Prabang, Xayaburi run-of-river cascade will, for some time slightly reduce sediment
transport until new equilibriums in their backwater areas are reached.
As described in chapter 5.2.10 the reduction of sediment transport due to the impound-
ment of the Manwan reservoir has immediately impacted the following approx. 800 km
downstream section. But further downstream (ca. 1,160 km), near Luang Prabang it took
over 3 years to recognize this effect. It is assumed that the buffer volumes from sediments
within the river compensated the impact during this time (CNR, 2013c).
The distance from LP HPP to Hueang confluence, where Mekong reaches the Thai border
is approx. 330 km. It can be assumed that the phase with reduced sediment release from
LP HPP can be recognized in Thailand quite early.
For PNPCA O
nly

Luang Prabang HPP 127000034 Cumulative and Transboundary Impact Assessment Report VI
Copyright © Pöyry Energy Ltd.
For other downstream countries like Cambodia (more than 1,000 km downstream) and
Vietnam (more than 1,500 km downstream) the impact to sediment transport from this
run-of-river cascade is rather low. Main reductions is caused by the Langcang cascade
and the dams on the Mekong tributaries (e.g. Nam Ngiep 1 or Nam Theun 1).
Fish and Fishery
According to Poulsen et al [5] the upper fish migration system seems to be relatively
isolated, with little exchange between it and the other more south located migration sys-
tems. It is therefore being expected that the transboundary impact concerning the fish
migration is mainly affecting the upper migration system with migration towards China
and can hardly be measured in the south towards Cambodia and Vietnam.
For PNPCA O
nly

Luang Prabang HPP 1150002924 Cumulative and Transboundary Impact Assessment Report 1
Copyright © Pöyry Energy Ltd.
1 INTRODUCTION
The Mekong River is one of the largest rivers in the world: it is the 12th by length, the 7th
in Asia, and the 10th by discharge. The river originates from a high mountainous area in
Qinghai province crossing Xi Zang before flowing along the whole length of Yunnan
province in China. Then it flows across Myanmar, Laos, Thailand, Cambodia and Vi-
etnam, where it enters the South China Sea.
There are 18 dam projects proposed for the main Mekong River, among which 8 upstream
projects are located in the territory of China, with 3 among them already under operation
presently. There are 8 projects proposed in Lao territory.
Luang Prabang hydroelectric power project (LP HPP) will be the 10th in the cascade to
be constructed on the main course of Mekong River from the upstream, and to be the 2nd
project constructed in Lao territory.
The LP HPP is planned on the Mekong River approximately 25 km upstream of Luang
Prabang city, and about 4 km upstream of the confluence with Nam Ou River (Figure
1-1). The scheme will be part of a low-head hydropower cascade system along the Me-
kong River, with Pak Beng HPP approximately 170 km upstream, and Xayaburi HPP
approximately 130 km downstream of the proposed site.
The LP HPP is a run-of-river (RoR) plant planned for hydropower generation to export
electricity to Thailand. The structure across the river consists of a RCC dam, a power-
house and a spillway section, each of them approximately one third of the entire length.
A navigation lock is foreseen at the right abutment.
Figure 1-1: Project location
For PNPCA O
nly

Luang Prabang HPP 1150002924 Cumulative and Transboundary Impact Assessment Report 2
Copyright © Pöyry Energy Ltd.
1.1 Purpose of the CIA and TBIA Report
With a focus on sustainability, Lao laws and regulations require environmental and social
studies for large scale hydroelectric power stations and for the construction of transmis-
sion lines. Mitigation measures have to be incorporated for mitigating damages to the
physical and socio-economic environment. In addition, compliance with the laws and
regulations is required in order to receive the environmental compliance certificate.
As part of the environmental and social requirements a cumulative and transboundary
impact assessment (CIA/TBIA) has to be prepared for the LP HPP.
The CIA/TBIA is particularly important to identify and describe the changes of the envi-
ronmental and social conditions caused by the combined impact of the past, present and
future (already planned) projects in this area, with a focus on transboundary effects, the
Mekong being an international river. It also covers an assessment of these impacts and
discusses possible mitigation measures.
1.2 Significance of Cumulative and Transboundary Impacts
Hydropower and dam projects are often placed in wide public attention due to their direct
and visible environmental and social impacts. Whereas some environmental and social
impacts of hydropower projects might not be of significant relevance individually, the
cumulative sum of such impacts may grow to significant and undesired results, which
can have undesirable effects on other countries, the so-called transboundary issues. Such
cumulative and transboundary effects may relate to different levels from small scale im-
pacts to the impacts of several hydropower plants.
1.3 Relations to the Projects Specific Impact Studies
The coverage of an ESIA study is generally limited to the directly impacted area. Whereas
an ESIA concentrates on the impacts of one specific project, the CIA/TBIA tries to ana-
lyse the combined impacts of a series of projects, future developments and plans, either
implemented together or in a sequence. The present cumulative and transboundary as-
sessment concentrates on assessing the impacts of the proposed LP HPP project in the
context of other existing or planned developments. The definition of the potential impact
area will normally extend far beyond the impact area of a project-specific ESIA study. It
should also be noted that the CIA/TBIA for a dam project is not limited to cumulative
impacts of other dam projects, but will have to include effects of other development pro-
jects in the region as long as there is the possibility of interactions.
For PNPCA O
nly

Luang Prabang HPP 1150002924 Cumulative and Transboundary Impact Assessment Report 3
Copyright © Pöyry Energy Ltd.
2 THE PROJECT
The LP HPP project is to be located at km 2,036 in the Mekong lower catchment. It is a
low-head power plant with its full supply level (FSL) at 312 masl, its target is electrical
power generation for export.
The project is fully in line with the GoL’s energy policy considering that: (i) it is a private-
participation project; (ii) it will export the generated electricity; and (iii) the project de-
veloper shall commit to ensure accountability and transparency of environmental and so-
cial impact management.
The LP HPP is located approx. 25 km upstream of Luang Prabang. It is a barrage type
hydroelectric run-of-river scheme which comprises:
Powerhouse equipped with 7 Kaplan turbine/generator sets (200 MW each). The
total installed capacity is 1’400 MW, and the maximum gross head is 36.80 m
Auxiliary units using water from fish attraction flow for the upstream and down-
stream migration facilities (approx. 180 m3/s), totalling to a maximum of 60 MW
capacity
Spillway structure with six (6) radial surface gates (19 m x 25 m, sill level
288.0 m asl). Three (3) low level outlets (12 m x 16 m, sill level 275.0 m asl)
Two-step navigation lock system for 2x500 DWT vessels
Fish pass system for up- and downstream migration
500 kV transmission line to Vietnam with an approximate length of 400 km to the
Vietnamese border and 200 km to the next suitable substation. Alternatively to
Thailand with an approximate 250 to 300 km length.
Major related projects and development that could have interferences with the LP HPP
are the following; Pak Beng HPP, China-Lao Railway Project, Xayaburi HPP, Hongsa-
Chiangman road including possible bridge across the Mekong River and development
around Luang Prabang city which has an UNESCO World Heritage status.
For PNPCA O
nly
Luang Prabang HPP 1150002924 Cumulative and Transboundary Impact Assessment Report 4
Copyright © Pöyry Energy Ltd.
Figure 2-1: Overview of the LP HPP project sites
Powerhouse
RCC dam
Spillway
Navigation lock
Shipway Low level outlet approach channel
For PNPCA O
nly

Luang Prabang HPP 1150002924 Cumulative and Transboundary Impact Assessment Report 5
Copyright © Pöyry Energy Ltd.
3 LEGAL AND ADMINISTRATIVE FRAMEWORK
A large number of environmental and social laws and regulations define the requirement
of environmental and social studies. Specific laws and regulations have been referred to
in the environmental and social studies, particularly in the ESIA (see [7] chapter 2). In
addition to adhering to Lao PDR laws, decrees, regulations and guidelines, the LP HPP
CIA/TBIA development will refer to international policies, guidelines and standards in-
cluding, but not limited to, the following specific documents:
• Draft cumulative impact assessment guidelines for hydropower projects in the
Lao PDR (Department of Environment and Social Impact Assessment (DESIA)
within the Ministry of Natural Resources and Environment (MONRE)) [8].
• Draft/preliminary/tentative guidelines for transboundary environmental impact
assessment in the lower Mekong basin (Mekong River Commission, 2017) [9].
The CIA guidelines provide guidance and direction for both MONRE and proponents on
the undertaking and assessment of cumulative impact assessment (CIA) in the hydro-
power sector consistent with the IFC’s:
• Good practice handbook, cumulative impact assessment and management: Guid-
ance for the private sector in emerging markets (International Finance
Corporation, 2013) [9].
In addition to the Lao PDR statutes and regulations, the GoL is also a signatory of the
agreement on the cooperation for the sustainable development of the Mekong River basin
(Mekong River Commission, 1995). The MRC supports a joint basin-wide planning pro-
cess with the four countries, called the basin development plan, which is the basis of its
integrated water resources development programme. The MRC is also involved in fish-
eries management, promotion of safe navigation, environmental protection, irrigated ag-
riculture, watershed management, environment monitoring, flood management and ex-
ploring hydropower options.
For PNPCA O
nly

Luang Prabang HPP 1150002924 Cumulative and Transboundary Impact Assessment Report 6
Copyright © Pöyry Energy Ltd.
4 CUMULATIVE AND TRANSBOUNDARY IMPACTS
Each hydroelectric power plant (HPP) generates several impacts to the society and the
environment. Some impacts occur in the immediate surroundings and have no further
impact to up/downstream regions. Others have greater impact radius and can therefore
cause cumulative impacts together with other HPPs even causing impacts to neighbour-
ing countries. As described in chapter 1 the Mekong is a large international river, flowing
through 6 countries before entering the South China Sea. Therefore a dam project on the
main Mekong has a high potential for transboundary impacts.
As there are several HPPs upstream and downstream of LP HPP, which are currently
either in operation, under construction or being planned (as shown in Figure 5-1) the
cumulative and transboundary impacts of this cascade have to be identified and valued,
and the incremental part of these cumulative impacts attributed to LP HPP have to be
pointed out.
The cumulative and transboundary impacts associated with the LP HPP, which refer prin-
cipally to the combined effects of the various proposed projects within the Mekong River
Basin, which together with the Project will cause significant changes in the river basin
are described in the following chapters. Relevant conclusions and recommendations are
given in chapter 6.
4.1 Methodology and Approach
Referring to the Draft Cumulative Impact Assessment Guidelines for HPP in Lao PDR,
May 2016 (Ref 7-1), the methods and tools for undertaking CIA and TBIA rely upon the
basics used when undertaking an ESIA and a number of additional methods. Several ap-
proaches/methods are available for assessing cumulative impacts. The following methods
in combination are normally used when assessing cumulative impacts:
Specialist opinion;
Specific consultation and questionnaires with relevant stakeholders;
Using checklists;
Risk matrices as commonly used to assess the consequence and likelihood of
impacts;
Review of available planning documents, investment programs, public permits and
previously prepared ESIA; and
Undertaking an assessment of mitigation for incremental impacts using past
experience, best available techniques, good/best practices, and expert opinion.
4.2 Determination of Valued Ecosystem Components (VECs)
VECs are defined as any part of the environment that is considered important by the
proponent, public, scientists, and government involved in the assessment process. Im-
portance can be determined on the basis of cultural values or scientific concern. The at-
tributes related to a VEC can include biological, cultural, ecological, environmental,
physical and social issues. VECs for hydropower projects within Lao PDR are likely to
include the following
(a) Air and Noise;
For PNPCA O
nly

Luang Prabang HPP 1150002924 Cumulative and Transboundary Impact Assessment Report 7
Copyright © Pöyry Energy Ltd.
(b) Affected Peoples and Resettlement;
(c) Cultural and Ethnic Archaeology and Heritage;
(d) Erosion and Sedimentation Transport;
(e) Fish and Aquatic Habitats;
(f) Natural Resources;
(g) Terrestrial Habitats;
(h) Hydrology; and
(i) Water Quality and Quantity.
However, based on project description and baseline environmental and social condition
of LP HPP study area, VECs for the proposed LP HPP are likely to include mainly the
following:
(a) Hydrology
(b) Water Quality
(c) Erosion and Sedimentation Transport
(d) Fish, Aquatic Habitats and fisheries
(e) Food and Nutrition
(f) Social Impacts
For PNPCA O
nly

Luang Prabang HPP 1150002924 Cumulative and Transboundary Impact Assessment Report 8
Copyright © Pöyry Energy Ltd.
5 RELEVANT ISSUES
5.1 Hydropower Development Plan
5.1.1 Hydropower Development at the Mekong Mainstream
The estimated hydropower potential of the lower Mekong Mainstream (excluding China)
is about 10,000 MW, while that of the upper Mekong (Lancang Cascade) in China is
about 21,400 MW, the latter largely already developed or under construction. In the lower
Mekong, the construction of 2 hydropower plants on the Mekong Mainstream has started,
the 1,285 MW Xayaburi HPP (just downstream of LP HPP) and the 256 MW Don Sa-
hong HPP.
Figure 5-1: Hydropower along the Mekong Mainstream
5.1.1.1 Lancang Cascade
The hydropower developed in the upper Mekong River basin in China (also called
Lancang cascade) consists of run-of-river, but also large storage plants, most of them
For PNPCA O
nly

Luang Prabang HPP 1150002924 Cumulative and Transboundary Impact Assessment Report 9
Copyright © Pöyry Energy Ltd.
already in operation or under construction (see Table 5-1). The total active storage vol-
ume of these plants is about 23,200 million m3, or about 25% of the mean annual flow of
the Mekong River entering the lower Mekong River basin from China.
The regulation effect of these large storage schemes will have a significant effect on the
annual flow pattern in the lower Mekong River basin, mainly a shift of the flow from the
monsoon season to the dry season, resulting in an increase of the dry season flows and a
decrease of the flood hydrographs.
The largest reservoirs of the Lancang cascade are in operation since 2013 (Xiaowan) and
2015 (Nuozhadu), and their impact is already considered in the flow records of the last 4
years. The study “Optimization study of Mekong mainstream hydropower” (2009) esti-
mated the impact of the Lancang cascade as an increase on low dry season flows between
58% (Pak Beng, Luang Prabang) and 46% (Sanakham). For more information see also
chapter 5.2.10, Figure 5-22 and Figure 5-23.
Table 5-1: Hydropower plants in operation of the Lancang cascade
HPP COD
Capacity [MW]
Head [m]
FSL [masl]
Storage [M m3]
Gongguoqiao 2012 (?) 750 77 1,319 120
Xiaowan 2013 4,200 248 1,236 9,900
Manwan 1995 1,500 99 994 257
Dachaoshan 2003 1,350 80 895 367
Nuozhadu 2015 5,500 205 807 12,300
Jinghong 2010 1,500 67 602 249
Total 14,800 776 23,193
5.1.1.2 Hydropower Development in Lao PDR
The Mekong River Commission carried out a study “Mekong mainstream run-of-river
hydropower” in 1995 and identified a total of twelve projects with a total capacity of
13,000 MW, where 9 of them were considered promising, which are Pak Beng, Luang
Prabang, Xayaburi, Pak Lay, Sanakham, Pak Chom, Ban Koum, Phou Ngou and Don
Sahong (see Figure 5-2).
In 2009 a study “Optimization study of Mekong mainstream hydropower” has been car-
ried out by GoL – Ministry of Energy and Mines (see Table 5-2). This study optimized
the upper 5 projects at the Mekong mainstream in Lao PDR, from Pak Beng HPP down
to Sanakhan HPP.
For PNPCA O
nly

Luang Prabang HPP 1150002924 Cumulative and Transboundary Impact Assessment Report 10
Copyright © Pöyry Energy Ltd.
Figure 5-2: Hydropower project at the Mekong mainstream in Lao PDR.
Table 5-2: Mekong mainstream HPP projects as per GoL optimization study.
Kilometrage
Capacity [MW]
FSL [masl]
Pak Beng 2,188 1,230 345
Luang Prabang 2,036 1,410 310
Xayaburi 1,930 1,260 275
Pak Lay 1,818 1,320 240
Sanakhan 1,772 570 215
These are all ROR projects. Don Sahong, while located on the Mekong mainstream, is a
special case: it uses only one of the numerous channels into which the Mekong splits at
the Khone Falls and therefore, unlike the others in the list, does not use all the water in
the river, and does not block it completely.
5.1.2 Project Features
The LP HPP site is located on the Mekong River at kilometre 2,036, approximately 25 km
upstream of Luang Prabang. It is a barrage type hydroelectric Run-of-River scheme
which comprises:
For PNPCA O
nly

Luang Prabang HPP 1150002924 Cumulative and Transboundary Impact Assessment Report 11
Copyright © Pöyry Energy Ltd.
Powerhouse equipped with 7 Kaplan turbine/generator sets (200 MW each). The total
installed capacity is 1’400 MW, and the maximum gross head is about 36.8 m
Auxiliary units using water from fish attraction flow for the upstream and downstream
migration facilities (approx. 180 m3/s), totaling to a maximum of 60 MW capacity
Spillway structure with six (6) radial surface gates (19 m x 25 m, sill level 288.0 masl),
and three (3) low level outlets (12 m x 16 m, sill level 275.0 masl)
Two-step navigation lock system for 2x500 DWT vessels
Fish pass system for up- and downstream migration
500 kV transmission line to Vietnam with an approximate length of 400 km to the Viet-
namese border and 200 km to the next suitable substation. Alternatively to Thailand with
an approximate 250 to 300 km length.
The LP HPP is located at the right river bank (see Figure 1-1), where space is available
for the construction of the main structures. The navigation lock will be located at the right
river bank allowing vessels and ships a safe approach and passage. The powerhouse will
be in the centre of the river, and will have two erection bays on each end of it. The split
erection bay concept provides on the one hand advantages for assembly and installation
of the equipment (lifting devices can operate independently from each other), and on the
other hand provides space (upstream and downstream of the erection bays) to host the
facilities for upstream and downstream fish migration.
The construction of the HPP is planned to be done within one major construction stage,
i.e. all major structures will be erected within a large single construction pit while the
Mekong River is diverted. After completion of the main construction works (concrete
works and installation of the main hydro-mechanical equipment, spillway and navigation
lock operational, intake gates and draft-tube stoplogs at powerhouse in place and set) the
Mekong River will be diverted through the spillway (low level outlets) and the left bank
closing structure (e.g. RCC dam) will be constructed under the protection of up- and
downstream cofferdams while wet testing and commissioning can start.
Construction works will be mainly done from the right river bank, which can be reached
by an existing access road from Luang Prabang (Mekong River in Luang Prabang needs
to be crossed by ferry boat). Transportation of bulk material to site can be done via vessels
or by road.
5.1.3 Reservoir Operation
The LP HPP is a run-of-river type hydropower plant, i.e. the discharge through the pow-
erplant (powerhouse, spillway) equals the inflow, and the full supply level will be main-
tained most of the time during operation (increase or decrease of the FSL might be re-
quired during spillway operation or other exceptional operating cases). For practical pur-
poses (control system) an “operating range” for the FSL of around 0.50 m will be re-
quired, i.e. the FSL will vary between 312.00 and 312.50 masl.
During flood operation the excess water (water not used for generation of electricity
and/or operation of the navigation lock and fish migration facilities) will be spilled
through the spillway. The spillway comprises low level outlets and surface spillway bays.
The operation of the spillway will be as such that the first bays in operation will be the
low level outlets in order to route “turbidity currents” through the spillway and to mini-
mise sedimentation in the reservoir area.
For PNPCA O
nly

Luang Prabang HPP 1150002924 Cumulative and Transboundary Impact Assessment Report 12
Copyright © Pöyry Energy Ltd.
When the capacity of the low level outlets is reached the surface spillway will start oper-
ation. All gates of the surface spillway will be equipped with flap gates to allow spill of
floating debris in front of the spillway into the tailwater area.
5.2 Hydrology
5.2.1 Introduction
This chapter covers the hydrological aspects for the LP HPP, in particular:
Expected inflow at dam site taking into account the impact of the operation of the
Lancang cascade
Design floods for the dam site
Sediments and impact of the LP HPP on the sediment balance of the Mekong River
Impact of climate change
For the inflow analysis rather long time series are available for the Mekong River since
the 1960’s. The upstream Lancang cascade and their large storage schemes have a con-
siderable impact on the inflow characteristics, and only about 4 years of “impacted” flow
series are available. Thus the “natural” time series needs to be transformed to reflect the
large upstream storage schemes of the Lancang Cascade. However, no information on
the operation of these schemes are available, and the transformation needs to be done
based on assumptions, leading to additional hydrological uncertainties.
The design floods are determined based on a statistical approach (runoff- rainfall model)
and the PMP/PMF is accordingly estimated to be 41,400 m3/s.
5.2.2 Overview of Previous Studies
A study on Luang Prabang’s hydrology was carried out by CNR (2009): Department of
Electricity, Department of Energy Promotion and Development, Ministry of Energy and
Mines - Lao PDR: Optimization study of Mekong mainstream hydropower final report.
Another study on the hydrology was done by power engineering consulting JS company
1 (2010): Luang Prabang hydropower project: feasibility study, meteo-hydrological con-
ditions.
5.2.3 Catchment
5.2.3.1 Mekong River Basin
With a length of about 4,900 km the Mekong River is among the longest rivers in the
world. It drains a total area of 795,000 km2 and flows through six countries. The average
discharge at its mouth into the South Chinese Sea is about 15,000 m3/s, or a mean annual
runoff of 470,000 million m3.
For PNPCA O
nly

Luang Prabang HPP 1150002924 Cumulative and Transboundary Impact Assessment Report 13
Copyright © Pöyry Energy Ltd.
Figure 5-3: Mekong River basin and neighbouring countries.
Table 5-3: Catchment area and flow of Mekong River basin countries.
Country Catchment Area [km2]
Catchment % of MRB
Flow % of total flow
China 165,000 21% 16%
Myanmar 24,000 3% 2%
Lao PDR 202,000 25% 35%
Thailand 184,000 23% 18%
Cambodia 155,000 20% 18%
Vietnam 65,000 8% 11%
Total 795,000 100% 100%
For PNPCA O
nly

Luang Prabang HPP 1150002924 Cumulative and Transboundary Impact Assessment Report 14
Copyright © Pöyry Energy Ltd.
The Mekong River basin’s biodiversity is immense, and is fundamental to the viability
of natural resource-based rural livelihoods of about 60 million people living in the lower
Mekong River basin (Gies, E., 2017 [15]).
Figure 5-4: Mekong River Catchment at Luang Prabang Dam Site
5.2.3.2 Physiography
From the eastern watersheds of the Tibetan plateau the Mekong River flows through three
provinces of China, continuing into Myanmar, Lao PDR, Thailand, Cambodia to the Me-
kong delta in Vietnam. The Mekong River basin includes seven broad physiographic re-
gions featuring diverse topography, drainage patterns and geomorphology (see Fig-
ure 5-5).
The source of the Mekong River is at the Tibetan Plateau, the world’s most densely
glaciated region located at more than 5,000 m above sea level. The Three Rivers Area
is aptly named as the Mekong, Salween, and Yangtze all run alongside one another in a
rugged mountainous region. The Mekong flows about 500 km through a deep ravine with
no significant tributaries in this stretch.
The river is called Lancang in China. The Lancang Basin south of the Three Rivers Area
is a highland and plateau about 2,000 to 3,000 m above sea level. The Mekong flows
For PNPCA O
nly

Luang Prabang HPP 1150002924 Cumulative and Transboundary Impact Assessment Report 15
Copyright © Pöyry Energy Ltd.
down a steep gradient and transitions to mid and lowland reaches. Smaller tributary catch-
ments drain into the river from both sides.
The Northern Highlands form the upland region covering northeastern Myanmar, north-
ern Thailand, and the northern areas of the Lao PDR. Large tributaries like the Nam Ta,
Nam Ou, Nam Soung, Nam Khan, Nam Mae Kok and Nam Mae Ing join the Mekong
River.
The Khorat Plateau is a lower terrain in northeastern Thailand, consisting mainly of
sediment and eroded bedrock and surrounded by a rim of sandstone. The main tributaries
in this area are the gently sloping Songkhram and Mun Rivers on the right bank and the
steep Nam Ca Dinh, Se Bang Fai, and Se Bang Hiang Rivers on the left bank.
Figure 5-5: Physiographic regions of the Mekong River basin (source: MRC).
The Mekong River flows into the Tonle Sap Basin through a broad valley just north of
Pakse. The Tonle Sap Basin is a large alluvial plain surrounded by hills. At the southern
end of the basin, the mainstream breaks up into a complex network of branching and
reconnecting channels.
The western and central parts of the Tonle Sap basin make up the Great Lake, also
known as the Tonle Sap great lake, located in the Cambodian floodplain. During the dry
For PNPCA O
nly

Luang Prabang HPP 1150002924 Cumulative and Transboundary Impact Assessment Report 16
Copyright © Pöyry Energy Ltd.
season the great lake drains into the Mekong River, during the wet season, the high flows
in the Mekong River cause the Tonle Sap River to reverse flow and the great lake floods.
The Mekong Delta begins near Phnom Penh and ends up as a huge flat plain in southern
Vietnam. Near the mouth the Bassac River branches away from the mainstream, and both
rivers split up into a number of smaller distributaries, forming the plains of the Mekong
delta.
5.2.3.3 Macroclimate
The climate in Lao PDR can be described as tropical monsoon climate, characterized by
strong Monsoon influence with high rainfalls, high humidity and considerable amount of
sun. There are two distinctive seasons in Laos, the dry season and the rainy and humid
season. Regions in the mountains have a slightly cooler, more temperate climate.
The pronounced rainy season is from May through October with rainfalls between
120 mm and 290 mm, with the rainiest months August and September. The dry season is
relatively cool from November to February, and hot in March and April before the mon-
soon rains start. The monsoon rains are generally irregular in start of the rains, duration
and intensity.
The average annual rainfall in Luang Prabang area is about 1,360 mm; the coldest month
is January with an average temperature of 20.5°C (minimum 1°C), and the hottest month
is April with an average temperature of 28.1°C (maximum 44.8°C). With raising altitude,
the climate gets cooler and rainier, with more frequent pre-monsoon showers and abun-
dant rains in the monsoon period.
5.2.4 Data Collection and Processing
The hydrological data collected and used for this study is summarised in this chapter.
5.2.4.1 Discharge Data
Water level and discharge data were available from gauging stations at the Mekong River
and selected tributaries as shown in Figure 5-6 for the periods and timely resolution as
listed in Table 5-4. At the Mekong mainstream long time discharge data (starting in 1960)
are available for two gauging stations, Chiang Saen upstream of the project site close to
the border triangle between Lao PDR, Thailand and Myanmar, and Luang Prabang down-
stream of the site.
For PNPCA O
nly

Luang Prabang HPP 1150002924 Cumulative and Transboundary Impact Assessment Report 17
Copyright © Pöyry Energy Ltd.
Figure 5-6: River gauging stations at the Mekong mainstream.
Table 5-4: Overview of available flow data of Mekong River and tributaries.
Gauging Station River Daily Data Hourly Data 15 min Data
Luang Prabang Mekong 05/60–10/18
Chiang Saen Mekong 05/60-10/18
Ban Xiengkok Mekong 05/16-10/18
Ban Tonpheung Mekong 04/16-10/18 04/16-11/16
Pakbeng Bridge Mekong 09/16-10/18
Ban Soupanouvong Mekong 07/16-10/18
Xayaburi d/s Mekong 04/16-11/16
Muong Ngoy Nam Ou 01/88-12/17 08/15-11/16
Ban Hat Nga Nam Ou 08/15-11/16
Ban Mixay Nam Khan 01/88-12/17 08/15-11/16
Ban Sibounhom Nam Seuang 01/87-12/14
For PNPCA O
nly

Luang Prabang HPP 1150002924 Cumulative and Transboundary Impact Assessment Report 18
Copyright © Pöyry Energy Ltd.
5.2.4.2 Precipitation
Precipitation data sets have been collected and used from the following sources:
GPCC (Global Precipitation Climatology Centre of the German Meteorological
Service DWD, gridded ground observations (see also
https://www.dwd.de/EN/ourservices/gpcc/gpcc.html)
APHRODITE (Asian Precipitation - Highly-Resolved Observational Data Inte-
gration Towards Evaluation - daily gridded precipitation (see
http://www.chikyu.ac.jp/precip/)
TRMM (Tropical Radar Rainfall Mission, a joint US-Japan remote sensing mis-
sion (see http://trmm.gsfc.nasa.gov/)
GPM (Global Precipitation Measurement see https://www.nasa.gov/mis-
sion_pages/GPM/main/index.html )
GSOD data (Global Surface Summary of the Day – GSOD; station data; https://cat-
alog.data.gov/dataset/global-surface-summary-of-the-day-gsod)
5.2.5 Evapotranspiration
The gridded evapotranspiration dataset of CRU (Climate Research Unit of the University
of East Anglia; http://www.cru.uea.ac.uk/data) was used. It calculates potential evapo-
transpiration based on the Penman-Monteith formula.
5.2.6 Temperature
Two temperature data sets have been used:
CRU (Climate Research Unit of the University of East Anglia; Gridded tempera-
ture dataset of; http://www.cru.uea.ac.uk/data)
GSOD data (Global Surface Summary of the Day – GSOD; station data; https://cat-
alog.data.gov/dataset/global-surface-summary-of-the-day-gsod)
For PNPCA O
nly

Luang Prabang HPP 1150002924 Cumulative and Transboundary Impact Assessment Report 19
Copyright © Pöyry Energy Ltd.
5.2.7 Hydro-Meteorological Characteristics
5.2.7.1 Precipitation
The catchment area of the Mekong River on Chinese territory shows low precipitation
below 1000 mm/y in the North. The precipitation gradually increases towards the South.
In Laos the mean annual precipitation reaches values up to 2000 mm (see Figure 5-7).
Figure 5-7: Precipitation Datasets for the Mekong Catchment
GPCC data (left) and TRMM data (right)
5.2.7.2 Temperature & Evapotranspiration
The CRU dataset shows a potential evapotranspiration of below 800 mm in the northern
part of the catchment in China. The values gradually increase up to 1200 mm towards the
south (Figure 5-8). For PNPCA O
nly

Luang Prabang HPP 1150002924 Cumulative and Transboundary Impact Assessment Report 20
Copyright © Pöyry Energy Ltd.
Figure 5-8: Potential Evapotranspiration of Mekong Catchment
5.2.8 Inflow Hydrology
The following chapters present the most important information on the model structure,
the input data, the calibration and simulated results. Additional information can be found
in Volume 6.1 - Annex Hydrology, Section 1 – Rainfall Runoff Model.
5.2.8.1 Discharge Time Series
Long discharge time series on the Mekong River in the project area are available at
Chiang Saen and Luang Prabang gauge (Figure 5-9). The biggest lateral inflow between
these two gauges is the Nam Ou, which flows into the Mekong directly downstream of
the proposed location of Luang Prabang hydropower plant. Smaller tributaries are the
Nam Khan and Nam Suang.
In order to be able to estimate the share of inflow to LP HPP from the sub-catchment
between the gauges Chiang Saen and Luang Prabang as well as the impact of the Lancang
Cascade a water balance model was set up.
For PNPCA O
nly

Luang Prabang HPP 1150002924 Cumulative and Transboundary Impact Assessment Report 21
Copyright © Pöyry Energy Ltd.
Figure 5-9: Gauges and sub-catchments
5.2.8.2 Water Balance Model
The water balance model is applied to simulate long and consistent time series of runoff
in the Mekong basin and to analyze the impact of upstream hydropower development.
The daily water balance model used in this study has been already applied extensively in
many climatic regions of the world, among others in the Alps, southern Africa and the
Philippines. The conceptual structure of the model is similar to the well-known HBV-
model.
Inputs to the model are daily values of precipitation, temperature and potential evapo-
transpiration. The model determines rainfall from precipitation data, considering inter-
ception storage in the vegetation layer. Actual evapotranspiration is a function of soil
moisture and potential evapotranspiration. Runoff generation is a non-linear function of
soil moisture. The generated runoff is split into fast and slow components to simulate
different response times of surface-flow and base-flow.
Figure 5-10 shows a schematic representation of the model structure. The depicted pro-
cesses are calculated for each spatial element of the model, with all flows in the unit of
millimeters.
For PNPCA O
nly

Luang Prabang HPP 1150002924 Cumulative and Transboundary Impact Assessment Report 22
Copyright © Pöyry Energy Ltd.
The rainfall runoff model covers the whole catchment area of the Lancang/Mekong from
its source to the gauge Luang Prabang. It is divided into 18 sub-basins. For each sub-
basin outlet (e.g. the gauges and LP HPP), runoff is transformed to streamflow in m³/s
and streamflow is accumulated according to the topology of sub-basins.
Figure 5-10: Conceptual Structure of the Applied Water Balance Model
Input Data
Precipitation
Since no available precipitation data set covers the whole period for which discharge data
is available a continuous precipitation time series was constructed from various sources.
This was done by combining TRMM, Aphrodite, GPCC and GPM precipitation data.
From 1951 to 31/10/1998 the daily variation of the Aphrodite dataset was combined with
monthly GPCC precipitation sums. From 01/11/1998 to 30/05/2016 the same procedure
was done with the daily variation of the TRMM data. From 01/06/2016 to 31/10/2018
the GPM data was used with a correction factor.
Temperature
Until 15.12.2017 the temperature input is based on CRU monthly values interpolated on
daily time-steps; since 16.12.2017 it is based on interpolated GSOD station data.
Lancang Cascade
The hydropower plants of the Lancang Cascade are implemented in the model as 6 com-
putation points:
Gongguoqiao
Xiaowan
Manwan
Dachaoshan
Nuozhadu
Jinghong
Each hydropower plant is represented with a volume-area-elevation relation, simplified
operation rules and its operation start date.
Precip
Water Balance ModelLand-surface modelling
Water Allocation ModelRiver-network modelling
Interception
Soil
Base-flow
Surface-flow separation
ETaETp
Runoff
Spatial mapping
River pointWetlandReservoir
QlateralQupstream
Qdownstream
Routing
Discharge
Preciplake Evapo Diversion
For PNPCA O
nly

Luang Prabang HPP 1150002924 Cumulative and Transboundary Impact Assessment Report 23
Copyright © Pöyry Energy Ltd.
5.2.8.3 Simulation Results of Natural Streamflow for the Calibration Period
The most relevant points of calibration are the outlet of the sub-basin of Chiang Saen
Gauge and Luang Prabang gauge for which long time series beginning in 1960 are avail-
able. Additionally the discharge observations from Muang Ngoy, Ban Sibounhom and
Ban Mixay were used. The calibration was done taking into account the operation start
date, the impoundment of the reservoirs and the operation of the hydropower plants at the
Lancang.
Figure 5-11 shows as an example of the results of daily discharge simulations at Chiang
Saen and Luang Prabang Gauge for the period of 1980 to 1989. In Figure 5-12 the com-
parison of the observed and simulated mean monthly flow for the period of 1961 to 1990
is presented.
Figure 5-11: Comparison of Observed and Simulated Discharge (1980 – 1989)
Figure 5-12: Comparison of Mean Monthly Flows at Chiang Saen and Luang Prabang
0
2000
4000
6000
8000
10000
12000
14000
1980 1981 1982 1983 1984 1985 1986 1987 1988 1989
Dis
char
ge [
m³/
s]
Chiang Saen Q_OBS Q_SIM
0
2500
5000
7500
10000
12500
15000
17500
20000
1980 1981 1982 1983 1984 1985 1986 1987 1988 1989
Dis
char
ge [
m³/
s]
Luang Prabang Q_OBS Q_SIM
0
1000
2000
3000
4000
5000
6000
7000
8000
1 2 3 4 5 6 7 8 9 10 11 12
[m³/
s]
month
Q_OBS
Q_SIMChiang Saen
0
2000
4000
6000
8000
10000
12000
1 2 3 4 5 6 7 8 9 10 11 12
[m³/
s]
month
Q_OBS
Q_SIMLuang Prabang gaugeFor
PNPCA Only

Luang Prabang HPP 1150002924 Cumulative and Transboundary Impact Assessment Report 24
Copyright © Pöyry Energy Ltd.
5.2.8.4 Inflow Time Series LP HPP Site
The calculated inflow time series (1951-2018) for LP HPP, considering operation of the
Lancang cascade, leads to a mean annual flow is 3,293 m³/s.
Figure 5-14 shows the mean monthly discharges at LP HPP site, and Figure 5-15 depicts
the resulting flow duration curve for LP HPP.
Figure 5-13: Inflow Series 1951 to 2018 for LP HPP Site
Figure 5-14: Mean Monthly Discharge LP HPP Site
Figure 5-15: Flow Duration Curve for LP HPP Site
0
2,000
4,000
6,000
8,000
10,000
12,000
14,000
16,000
18,000
20,000
1950 1955 1960 1965 1970 1975 1980 1985 1990 1995 2000 2005 2010 2015
Dis
char
ge [
m²/
s]
Inflow Series for Luang Prabang HPP
0
1,000
2,000
3,000
4,000
5,000
6,000
7,000
8,000
1 2 3 4 5 6 7 8 9 10 11 12
Dis
char
ge [
m3/s
]
Months
Monthly Flow at LP HPP
For PNPCA O
nly

Luang Prabang HPP 1150002924 Cumulative and Transboundary Impact Assessment Report 25
Copyright © Pöyry Energy Ltd.
5.2.9 Flood Hydrology
5.2.9.1 Statistical Analysis
This chapter describes the Flood Frequency Analysis carried out for the LP HPP. Addi-
tional information and data can be found in Volume 6.1 - Annex Hydrology, Section 2 –
Flood Frequency Analysis.
The flood frequency analysis for LP HPP was carried out with the Annual Maximum
Series (AMS) from 1960-2009 for Luang Prabang Gauge and 1960-2018 for Chiang Saen
Gauge.
The data of the two gauges was used directly since no impact on the flood peaks from the
Lancang reservoirs is expected. Each peak of the AMS occurred during the months of
July and October when the reservoirs are filled. Additionally the meteorological data
shows that the storm events mainly take place downstream of the Lancang reservoirs.
Since there were doubts about the reliability of some peaks for Luang Prabang gauge only
the peaks until the year 2009 were used (from 2006 to 2009 the peaks were taken from
the Annual Mekong Flood reports by the MRC1). For Chiang Saen the peaks of the years
2006 to 2008 were also taken from these reports.
As the observation records are daily mean values and no instantaneous discharge data is
available in the region, maximum flood peaks were estimated based on a method pro-
posed by Sangal (1983). Sangal’s approach relates the flood peak with daily mean data
of the day of the peak and the previous and the following day:
𝑄max = (4 ∙ 𝑄2 − 𝑄1 − 𝑄3) / 2
with Q1 daily mean Q on day preceding the flood peak
Q2 daily mean Q on day of flood peak
Q3 daily mean Q on day after the flood peak
The FFA was done applying the software tool HQ-Ex by DHI-Wasy. This tool features
several extreme value distributions and methods of parameter fitting. All available distri-
butions are fitted to the observations.The design flood estimates were calculated as the
mean of the results of all applied distributions.
The Creager formula was used to calculate the discharge values for the return intervals
of interest for the LP HPP site from the results for Chiang Saen and Luang Prabang
Gauge.
Design Floods
The resulting design floods for LP HPP site are listed for different return periods in Ta-
ble 5-5, and shown graphically in Figure 5-16.
1 Mekong River Commission (2006-2009): Annual Mekong Flood reports; see: www.mrcmekong.org
For PNPCA O
nly

Luang Prabang HPP 1150002924 Cumulative and Transboundary Impact Assessment Report 26
Copyright © Pöyry Energy Ltd.
Table 5-5: Flood Discharges for Different Return Periods
Return interval Q LP HPP [m³/s]
2 12,800
5 16,200
10 18,200
20 20,000
30 21,000
50 22,200
100 23,800
200 25,300
500 27,300
1,000 28,800
5,000 32,100
10,000 33,500
Figure 5-16: Design Flood Values for LP HPP Site
Dry Seasons Floods
The dry season is defined as the time between January and May. For this period a series
of annual dry season maxima was developed for the gauges of Chiang Saen and Luang
Prabang. Dry season flood estimates for the two gauges were calculated as described
above for the annual maxima. To calculate the discharge values for the investigated return
intervals for LP HPP the Creager formula was used.
Application of the flood estimation procedure with results of the hydrological model (in-
stead of observations) for simulations with and without considering upstream hydro-
power operation shows a tendency of lower dry season peaks under influence of the
Lancang Cascade. Due to uncertainties in the peak simulation, the dry season flood esti-
mates were based on observed historical discharge data, and are therefore estimated
slightly conservatively.
10,000
15,000
20,000
25,000
30,000
35,000
1 10 100 1000 10000
Dis
char
ge [
m³/
s]
Return interval [y]
For PNPCA O
nly
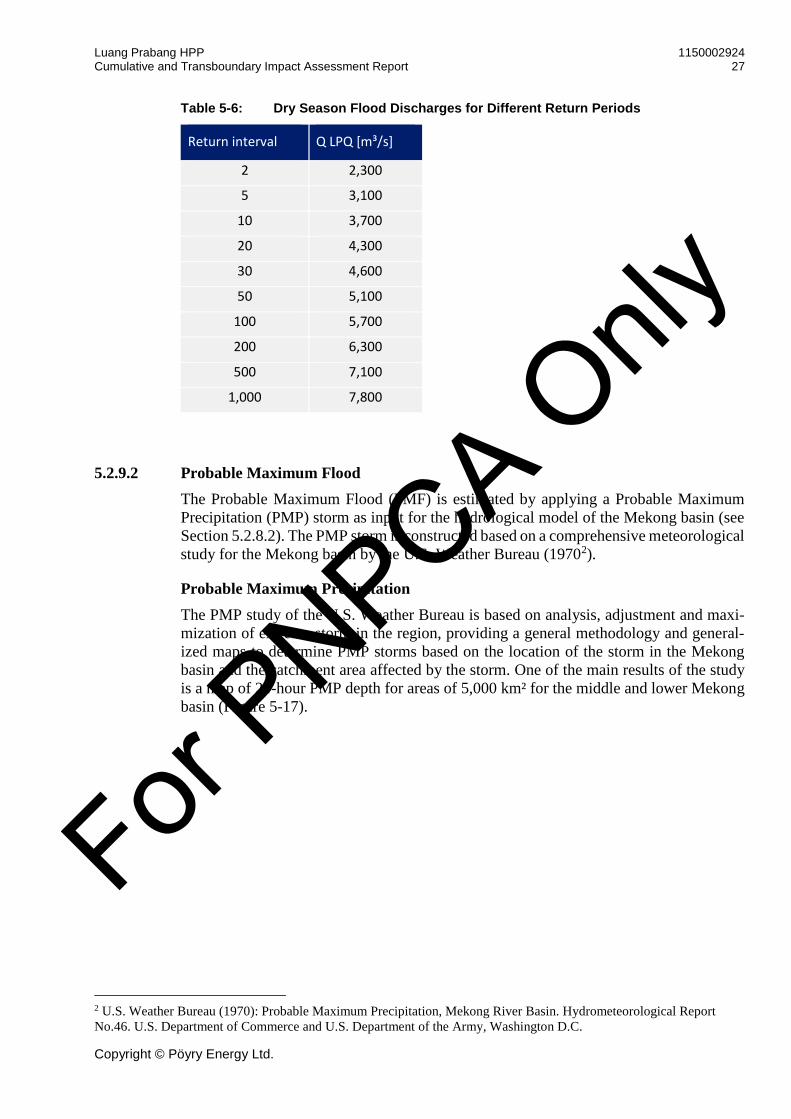
Luang Prabang HPP 1150002924 Cumulative and Transboundary Impact Assessment Report 27
Copyright © Pöyry Energy Ltd.
Table 5-6: Dry Season Flood Discharges for Different Return Periods
Return interval Q LPQ [m³/s]
2 2,300
5 3,100
10 3,700
20 4,300
30 4,600
50 5,100
100 5,700
200 6,300
500 7,100
1,000 7,800
5.2.9.2 Probable Maximum Flood
The Probable Maximum Flood (PMF) is estimated by applying a Probable Maximum
Precipitation (PMP) storm as input for the hydrological model of the Mekong basin (see
Section 5.2.8.2). The PMP storm is constructed based on a comprehensive meteorological
study for the Mekong basin by the U.S. Weather Bureau (19702).
Probable Maximum Precipitation
The PMP study of the U.S. Weather Bureau is based on analysis, adjustment and maxi-
mization of extreme storm in the region, providing a general methodology and general-
ized maps to determine PMP storms based on the location of the storm in the Mekong
basin and the catchment area affected by the storm. One of the main results of the study
is a map of 24-hour PMP depth for areas of 5,000 km² for the middle and lower Mekong
basin (Figure 5-17).
2 U.S. Weather Bureau (1970): Probable Maximum Precipitation, Mekong River Basin. Hydrometeorological Report
No.46. U.S. Department of Commerce and U.S. Department of the Army, Washington D.C.
For PNPCA O
nly

Luang Prabang HPP 1150002924 Cumulative and Transboundary Impact Assessment Report 28
Copyright © Pöyry Energy Ltd.
Figure 5-17: 24-hour 5000 km² PMP map by the U.S. Weather Bureau
For the main Mekong River and its large catchment areas, the U.S. Weather Bureau Re-
port provides specified PMP storms for three different parts of the catchment, and a set
of assumptions concerning previous and surrounding rainfall. The map showing the iso-
hyets of these PMP storms, with a zoomed-in excerpt for the storm north of Luang Pra-
bang, is shown in Figure 5-18.
LUANG PRABANG
For PNPCA O
nly

Luang Prabang HPP 1150002924 Cumulative and Transboundary Impact Assessment Report 29
Copyright © Pöyry Energy Ltd.
Figure 5-18: PMP isohyets for Main Mekong River PMF by the U.S. Weather Bureau
As the center of the northern storm of the map in Figure 5-18 is located almost 200 km
upstream of LP HPP, and as PMP storm depths are lower further north (see map in Figure
5-17), another storm was constructed by shifting the storm pattern of Figure 5-18 100 km
south. Due to the higher precipitation depth and closer location, this shifted storm leads
to higher PMF discharges at LP HPP, and was therefore adopted as design PMP storm.
Both PMP storms are depicted in Volume 6.1 - Annex Hydrology, Section 3 – Probably
Maximum Flood.
The left graph in Figure 5-19 shows the depth-area-relation of the storm in the U.S.
Weather Bureau map (“USWB storm” in the graph), and for the shifted storm. The right
graph shows the temporal distribution of precipitation depths for a prior storm of 3 days
and the PMP storm of 3 days for the center of the storm, with the peak value according
to the shifted map values. The depths of the four days preceding the PMP peak and the
day after are constructed as specified in the U.S. Weather Bureau Report.
According to the procedure described there, precipitation was distributed in space as
shown in the map for the peak days of the prior and the PMP storm. Precipitation for the
days around the peak days was distributed uniformly in space within the PMP storm ex-
tent.
For PNPCA O
nly

Luang Prabang HPP 1150002924 Cumulative and Transboundary Impact Assessment Report 30
Copyright © Pöyry Energy Ltd.
Figure 5-19: Left: PMP Depth-Area Relation
Right: Temporal Development of the PMP for the Center of the Shifted Storm
Due to the large catchment area, and the related travel time of river discharge, precipita-
tion input was also specified for the weeks preceding the double-peak PMP event. The
values were again based on assumptions in the U.S. Weather Bureau Report, by fitting a
smooth curve to monthly mean values described there (see Figure 5-19). As the purpose
of this preceding rainfall is only to reach a certain (high) level of discharge before the
PMP storm, a more realistic temporal distribution was not considered. The spatial distri-
bution of preceding precipitation was based on the spatial pattern of mean monthly pre-
cipitation.
Figure 5-20: Assumed Synthetic Rainfall Development
In the Weeks before the PMP Double-Peak Storm Event for the Catchment Directly Upstream of Luang Prabang
Results
The application of this preceding rainfall and the PMP storm as input data for the hydro-
logical model of the Mekong basin (described in Section 5.2.8.2) yielded the PMF dis-
charge simulation for LP HPP shown in Figure 5-21, with a discharge peak of
41,400 m³/s.
0
100
200
300
400
500
0 1 2 3 4 5 6 7
Dai
ly p
reci
pit
atio
n (
mm
)
days
shifted USWB storm
0
100
200
300
400
500
0 1 2 3 4 5 6 7 8 9 10
Dai
ly p
reci
pit
atio
n (
mm
)
Isohyets in map (1 = center)
shifted USWB storm
USWB storm
0
20
40
60
80
01.05.1970 31.05.1970 01.07.1970 31.07.1970 31.08.1970 30.09.1970
Dai
ly p
reci
pit
atio
n (
mm
)
For PNPCA O
nly

Luang Prabang HPP 1150002924 Cumulative and Transboundary Impact Assessment Report 31
Copyright © Pöyry Energy Ltd.
Due to the temporal development of the preceding rain, as suggested by the U.S. Weather
Bureau, with slightly decreasing precipitation in September, before the double-peak PMP
storm, simulated Mekong discharge also slightly drops in September, from its highest
value in the end of August.
However, the discharge directly before the first extreme storm is considered sufficiently
high: for Chiang Saen, the value on the day before the start of the double-peak storm is
12,560 m³/s. This value is significantly higher than the highest ever recorded discharges
before observed flood events at Chiang Saen, of 9,600 m³/s (in 1971), 8,900 m³/s (in
1970), and 8,200 m³/s (in 1966), and is therefore considered sufficiently conservative for
a PMF estimation.
Figure 5-21: PMF Simulation for Luang Prabang HEPP
5.2.10 Impact of Lancang Cascade
To estimate the future inflow to LP HPP the operation of the Lancang Cascade has to be
taken into account; therefore the model output for the period 1960-2018 cannot be used
directly as the inflow time series. For this reason a model run was done from 1951 to
2018 assuming that the hydropower plants at the Lancang Cascade were operating during
the whole period which leads to the best estimation of the future inflow at LP HPP.
Figure 5-22 shows the coefficients for the relative flow change at Chiang Saen on a
monthly basis due to the impact of the Lancang hydropower plants, and compares the
results of the current simulations with values developed by the MRC (20053). The current
estimates show an increase of inflow for the dry season months of February to May that
is even higher than anticipated by MRC.
3 The MRC Basin Development Plan, BDP Library Volume 7 September 2005, MRC Decision Support Framework (DSF) and BDP
applications; Mekong River Commission
0
10000
20000
30000
40000
50000
01.06.1970 01.07.1970 01.08.1970 31.08.1970
Dis
char
ge (
m³/
s)
For PNPCA O
nly

Luang Prabang HPP 1150002924 Cumulative and Transboundary Impact Assessment Report 32
Copyright © Pöyry Energy Ltd.
Figure 5-22: Comparison of the Relative Discharge Change at Chiang Saen
The impact of the Lancang Cascade on the LP HPP inflow is shown in Figure 5-23. The
blue graph shows the duration curve for the natural inflow of the period 1960 to 1990
(this period has been selected to have undisturbed flow conditions), and the green graph
shows the results of the hydrological model taking into account the Lancang Cascade for
the same time period. The flood peaks are slightly lower, while the dry season flows are
significant higher than the natural inflow and well above 1,100 m3/s.
The orange graph shows the transformation of the inflow series using the MRC Factors.
This graph is somehow between the natural inflow and the simulated inflow series.
Figure 5-23: Impact of the Lancang Cascade
On the Flow Duration Curve at LP HPP site
0.40
0.60
0.80
1.00
1.20
1.40
1.60
1.80
2.00
1 2 3 4 5 6 7 8 9 10 11 12
Re
lati
ve c
han
ge [
-]
Month
PÖYRY Model
MRC factors
0
2500
5000
7500
10000
12500
15000
17500
20000
0% 10% 20% 30% 40% 50% 60% 70% 80% 90% 100%
Dis
char
ge [
m³/
s]
Percentage of Exceedance [%]
LPQ natural flow simulated
LPQ flow MRC
LPQ with Lancang reservoirs simulated
For PNPCA O
nly

Luang Prabang HPP 1150002924 Cumulative and Transboundary Impact Assessment Report 33
Copyright © Pöyry Energy Ltd.
5.2.11 Impacts to the Tonle Sap Great Lake System
The natural Tonle Sap River system has created the great Tonle Sap Lake, which is
mainly fed by the Mekong due to an interesting natural phenomenon. From October to
May water flows from the Tonle Sap into the Mekong. During the wet season however
the Mekong increases that much that its water table is higher than the one from its tribu-
tary coming from the great lake. Therefore, the flow direction changes and the Tonle Sap
Lake is fed by the Mekong during the wet season. This phenomenon creates a floodplain
that extends over 15,000 km2 and stores up to 76.1 km3 of Mekongs annual flood- pulse
[12] (Kummu et al. 2014). Overall 53.3% of the water entering the Tonle Sap Lake comes
from the Mekong. 34% comes from 11 river tributaries and 12.5% directly from rainfall
[12] (Kummu et al. 2014).
The impact of hydropower plants to the Tonle Sap system was investigated in different
studies. The study “Dams on Mekong tributaries as significant contributors of hydrolog-
ical alterations to the Tonle Sap floodplain in Cambodia” [13] (Arias et al. 2014) de-
scribes estimated impacts to this system caused by dams in this area. It identifies the
proposed 42 dams in the Sesan, Srepok and Sekong (3S) rivers (see Figure 5-24) as most
critical projects causing a major impact to the flow pattern of the Tonle Sap system.
For PNPCA O
nly

Luang Prabang HPP 1150002924 Cumulative and Transboundary Impact Assessment Report 34
Copyright © Pöyry Energy Ltd.
Figure 5-24: Map of lower Mekong River Basin.
Floodplains and dams (black dots are HPP in operation and under construction) and 3S devel-opment scenario (purple triangles). The green triangle shows a water level gauge station at the great lake [13] (M.E. Arias et al. 2014).
The 3S system contributes nearly a quarter of the total Mekong discharge in this area.
The paper concludes that the 3S scenario could independently increase the great lakes
30-day minimum water level by 30±5 cm and decrease annual water level fall rates by
0.30±0.05 cm/day [13] (Arias et al. 2014).
All the storage power plants in the Mekong and its tributaries upstream of the Tonle Sap
system will contribute their impact to the great lake. The LP HPP however is not a storage
power plant and will not change the hydrograph, nor the flow pattern of the Mekong.
Therefore it will not cause any additional impact to the Tonle Sap system.
For PNPCA O
nly

Luang Prabang HPP 1150002924 Cumulative and Transboundary Impact Assessment Report 35
Copyright © Pöyry Energy Ltd.
5.2.12 Hydrological Impact of the LP HPP - Conclusion
The LP HPP is a run-of-river hydropower plant (ROR). Its inflow is equal to its outflow
and no storage is used. However, to increase the potential energy the dam increases the
water level of the upstream area, creating a reservoir with a surface area of around 49 km2,
reaching back to the planned Pak Beng HPP. The increase of the water depth increases
the surface of the submerged area, leading to decreased velocities. This causes local im-
pacts (reduced sediment transport and slightly different habitat conditions for aquatic
life), which are discussed in the ESIA.
The lengths of the backwater will affect the downstream water level at the HPP Pak Beng.
Effects of ROR plants to their upstream and downstream hydrographs are marginal since
they do not store water. Only during the start phase a storage takes place while the reser-
voir is being impounded to reach the FSL (15 to 20 days). Afterwards the operation main-
tains the water level at FSL with minor changes in elevation of approximately 1 m for
minor floods, up to an increase of 2.2 m for the PMF. An impact to the flow pattern of
the river such as shown in Figure 5-15 only occurs with storage plants as they change the
flow pattern of the river.
5.3 Water Quality
If a hydropower plant in a cascade causes poor water quality the probability that the res-
ervoir of the downstream HPP is affected is very high. Only in case the river stretch in
between is long and turbulent a proper self- purification might take place. To ensure good
water quality it is mandatory to do a proper biomass- and waste clearing of submerged
areas. However, since the cascade is a cascade of ROR plant the residence time of the
water is rather short (range of approx. 3 to 9 days), the whole water volume will be ex-
changed due to the permanent operation of the turbine and the frequent operation of the
low level outlets. Therefore, no dead zone (zone below minimum operation level in a
storage power plant) occurs, and this also excludes the formation of a deep water zone
with deteriorating water quality.
A proper cleaning of biomass and waste in the reservoir area before impoundment is
mandatory to ensure the water quality can be maintained. Once this is considered there
will be no additional significant impact to water quality during normal HPP operation.
For PNPCA O
nly

Luang Prabang HPP 1150002924 Cumulative and Transboundary Impact Assessment Report 36
Copyright © Pöyry Energy Ltd.
5.4 Sediment Transport
Estimation of sediment transport rates and conditions in large rivers is a complex process.
A wide range of data collection is necessary both in terms of physical/granulometric pa-
rameters and temporal patterns. Erosion and deposition has to be analysed within the river
and at its floodplains. In case of Mekong River all this has to be assessed over a huge
longitudinal extent from the river’s source in China to its delta into the South China Sea
in Vietnam.
It is clear that impacts on Mekong’s sediment regime may be of international importance
as retention of sediments can cause river bed degradation or even incision on further
downstream sections. Besides that, of course the impact of hydropower dams onto their
own backwater section is crucial in terms of ecological and economic sustainability of
such a project and so it is also for LP HPP.
Basic information of sediment transport within the planned Luang Prabang reservoir shall
be mainly extracted from existing studies. A sediment monitoring program will be started
at the beginning of the operation phase.
5.4.1 General Terms and Definitions
In general sediment transport process types are classified as follows:
Washload: very fine particles (typically clay and silt) that never
settle down in a channel
Uniform suspended load: rather fine particles that are uniformly distributed
over the vertical water column due to the flow
turbulence
Graded suspended load: Coarser particles that are transported within the
water column but with a gradation in vertical
direction
Bedload: Coarse material that is transported typically via
rolling, sliding or saltating in continuous or
intermittent contact with the riverbed
Technical names of certain particle sizes according to the classification of the American
Geophysical Union are given in Table 5-7.
For PNPCA O
nly

Luang Prabang HPP 1150002924 Cumulative and Transboundary Impact Assessment Report 37
Copyright © Pöyry Energy Ltd.
Table 5-7: American Geophysical Union classification
regarding sediment size (Source: CNR, 2013c)
5.4.2 Findings from Literature Concerning Sediment Transport within the Mekong
In the past some sound studies upon sediment transport of Mekong River have been car-
ried out from different organisations and experts. For LP HPP the main characteristics
and load estimations regarding Mekong’s sediment transport shall be taken from these
publications. A summary of relevant information and the main conclusions of each study
is presented in the annex A) to J). The most important findings of these studies are pre-
sented as follows:
Due to the high trapping efficiency and a very large storage volume of at least some of
the Chinese reservoirs within the Lancang Cascade can reasonably be assumed that sed-
iment inputs from upstream the Chinese border are extremely reduced and this situation
For PNPCA O
nly

Luang Prabang HPP 1150002924 Cumulative and Transboundary Impact Assessment Report 38
Copyright © Pöyry Energy Ltd.
will last for a very long time (estimations indicate time spans of several hundred years)
(SEG, 2011).
The reduction of sediment load caused by the Lancang Cascade depends on the distance
in downstream direction. For example at Gaiju (China), which is located only 15 km
downstream of Manwan, the first dam who was taken into operation within the cascade,
and also at Chiang Saen, which is approx. 800 km downstream of Manwan, a significant
downward bend in the curve of cumulated annual sediment loads appears more or less
immediately after commissioning of Manwan Reservoir in 1993. At Luang Prabang, ap-
prox. another 360 km further downstream and draining a substantial larger catchment
(approx. +50% against Chiang Saen) this downward bend in the curve of cumulated an-
nual sediment load was recognized not before 1997 (CNR, 2013c).
While in former studies the total sediment load of Mekong River was mostly estimated
to a value of about 160 Mt/y, recent investigations indicate lower values of approx.
72 Mt/y (Koehnken, 2014). However, more conservative estimations in respect to LP
HPP still expect a range of 90-120 Mt/y for the foreseen future (Liu et al, 2012).
A reason for some inconsistency in the estimations of sediment loads may be the high
proportions of sand size materials, leading to over- or underestimation of the total load
through measurements of suspended sediments, because sand is transported via different
mechanisms in different river sections (as bedload or suspended) (IKMP & WWF, 2014).
Another important aspect is that sediment load analysis based on TSS measurements are
reliable only to a limited degree, firstly because of some weaknesses in the sampling
technique and secondly because of the high proportion of sand in the transported sedi-
ment. But also SSC-measurement based analysis are expected to have uncertainties in the
range of 20-30% (ICEM, 2010).
Based on the various literature findings (e.g. SEG, 2011; IKMP & WWF, 2014) the pro-
portions of the total sediment loads according to the main source regions are roughly as
follows:
prior Manwan 45% (up to 55%) originate from China / actual 16%
prior Manwan 5% originate from Chinese border to Laotian-Thai border near Pak
Chom (mainly from Wang Chao Fault Zone)
prior Manwan 50% originate from rest of the catchment (mainly from Central
Highlands and Khorat Plateau)
The estimated sediment loads for project relevant locations are as follows (values based
on Liu et al, 2012; Koehnken, 2014 and ICEM, 2010):
Chiang Saen: prior Manwan 90.8 Mt/y / actual 10.8 Mt/y (suspended)
Luang Prabang: prior Manwan 107.7 Mt/y / actual 22.3 Mt/y (suspended)
The bedload estimate for Chiang Saen based on measurements is 1.6 Mt/y
Mean annual sediment load of Nam Ou: approx. 6.2 Mt/y
From the above values the suspended sediment load for the LP HPP dam site can be
estimated to be in the range of roughly 15 to 100 Mt/y. While the greater value stands for
a historical value, responsible for the period before the construction of the Lancang Cas-
cade, the lower value reflects quite recent but rather short term measurements. In terms
of safe and conservative design and in respect to known uncertainties in field data a range
For PNPCA O
nly

Luang Prabang HPP 1150002924 Cumulative and Transboundary Impact Assessment Report 39
Copyright © Pöyry Energy Ltd.
of 20-24 Mt/y for the total sediment load (washload, suspended and bedload) is proposed
for the dam site.
Based on the findings of Koehnken (2014) a rough estimation on the grain-size distribu-
tion for the dam site is:
approx. 80% sand (mostly fine sand with up to 25% of medium sand)
approx. 20% silt
The reduction of bedload as expected consequence of the Lancang Cascade is probably
delayed, due to compensation through existing in-channel storages (CNR, 2013c).
5.4.3 Trend Analyses
A trend analysis of sediment concentrations at Chiang Saen has been carried out. The
analysis is based on monthly suspended sediment loads from 1962 to 2012 (with major
gaps and inconsistencies) and monthly flow rates from 1962 to 2014, both provided by
the Thai Department of Water Resources (the trend analysis of the sediment data for
Chiang Saen can be found in Volume 6.1 - Annex Hydrology, Section 4 – Trend analyses
sediment concentrations Chiang Saen).
The data has been converted to mean sediment concentrations and plotted against time.
For the period between 1976 and 1992 no sediment data was available. The period is
divided into pre-dam and pro-dam periods, reflecting the development of the Lancang
Cascade starting from 1993 with the Manwan Dam. Figure 5-25 shows the trend analysis
for the 12 months of the year.
For PNPCA O
nly
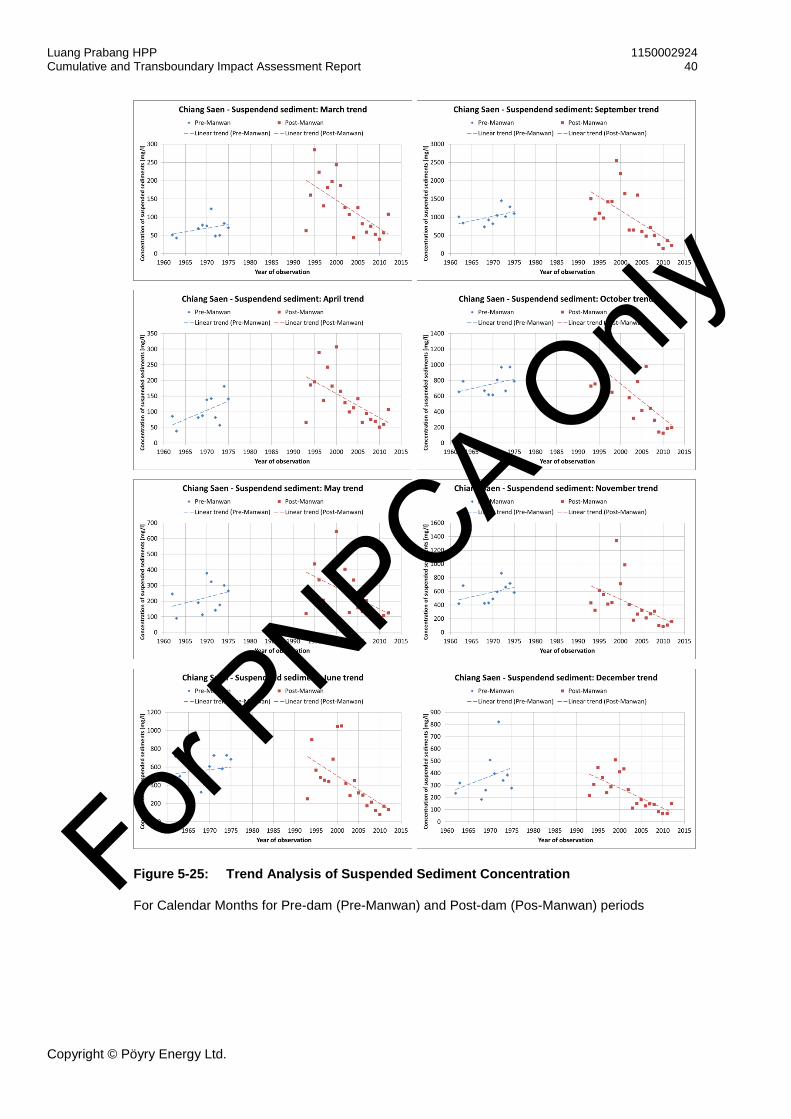
Luang Prabang HPP 1150002924 Cumulative and Transboundary Impact Assessment Report 40
Copyright © Pöyry Energy Ltd.
Figure 5-25: Trend Analysis of Suspended Sediment Concentration
For Calendar Months for Pre-dam (Pre-Manwan) and Post-dam (Pos-Manwan) periods
For PNPCA O
nly

Luang Prabang HPP 1150002924 Cumulative and Transboundary Impact Assessment Report 41
Copyright © Pöyry Energy Ltd.
Figure 5-26: Trend Analysis
Annual Suspended Sediment Concentration for Pre-dam (Pre-Manwan) and Post-dam (Pos-Manwan) periods
5.4.4 Sediment Concentration
According to the report on Discharge and Sediment Monitoring Project (DSMP) (The
Mekong River Commission (MRC), 2011), comparison between the Total Suspended
Solids (TSS) concentrations and the average daily flow at Chiang Saen, Chiang Khan and
Luang Prabang monitoring stations are as shown in Figure 5-27.
Figure 5-27: Total Suspended Solid (TSS)
Concentrations and Average Daily Flow at 3 selected Monitoring Stations
Source: MRC, 2011 (The Mekong River Commission (MRC), 2011)
For PNPCA O
nly

Luang Prabang HPP 1150002924 Cumulative and Transboundary Impact Assessment Report 42
Copyright © Pöyry Energy Ltd.
The TSS concentration shows the same patterns of variation as the flow, the higher con-
centrations being associated with higher flows. Maximum TSS value is related to the first
or second flood peak of the wet season and decreases through the dry season.
Sediment Load at LP HPP
The French consultant Compagnie Nationale du Rhône (CNR) calculated an inflow of
suspended sediment into the LP HPP of 105 Mt/year with possible year to year variations
of 50-135 Mt/year similar to the Xayaburi reservoir (Compagnie Nationale du Rhône
(CNR), 2013). The assessment of Mekong River annual sediment load is presented in
Figure 5-28.
Figure 5-28: Longitudinal Evolution of Mekong River annual sediment load
Adapted from (Compagnie Nationale du Rhône (CNR), 2013).
The Nam Ou in its natural state used to bring large amounts of sediments, it is however
not known to what extent this has been reduced by the implementation of the Nam Ou
and Nam Khan cascade.. Wash load, although being the biggest part of the sediments
load, will barely be deposited in the reservoir since it can be assumed that the flow ve-
locity will be high enough to keep the sediments in suspension.
5.4.5 Conclusion and Findings Concerning Sediment Transport
The backwater section of LP HPP is a quite straight channel, deeply cut in bedrock of a
narrow valley. The river width is between 50-100 m for low flow conditions and 200-
300 m during wet season conditions. The channel slope is between 0.25-0.30 m/km
(CNR, 2013b).
Sediment deposits consist mainly of sand size fractions characterized by d50 in the range
of approx. 0.25-0.45 mm. They are accumulated around emerged rocky outcrops or on
depressions along the banks. Some sediment supply through tributaries is given by the
rivers Nam Tha and Nam Beng. However, larger sediment inputs are not delivered until
For PNPCA O
nly

Luang Prabang HPP 1150002924 Cumulative and Transboundary Impact Assessment Report 43
Copyright © Pöyry Energy Ltd.
tributaries located already downstream of the planned dam site, like especially through
Nam Ou River. Currently deposition of sediments is more likely downstream the project
area, as there follows a section with lowered river slope (CNR, 2013b).
Turbidity (density) currents are defined as currents moving by gravity, because of their
higher specific density in relation to the density of pure water. Turbidity currents are
known to develop in large reservoirs, where the water velocity is extremely low and
forces due to differences in the density of water layers (due to sediments concentration
as well as differences in temperature, etc.) become dominant.
As a run-of-river plant Luang Prabang has no storage reservoir and no big head. The
velocity near the dam ranges between 0.05 m/s with river flow of 1,000 m3/s to 0.2 m/s
with average river flow (about 4,000 m3/s) to 0.5 m/s with river flow of 10,000 m3/s,
being generally higher further upstream along the reservoir. The velocities in the reser-
voir are sufficient to prevent the development of significant turbidity currents. For aver-
age
turbine flow (about 3,000 m3/s) flow velocities are presented in Figure 5-29. For the total
rated discharge through the powerhouse (about 5,000 m3/s) the flow velocities are pre-
sented in Figure 5-30.
Figure 5-29: Flow velocities towards the powerhouse for Q=3,000 m3/s
For PNPCA O
nly
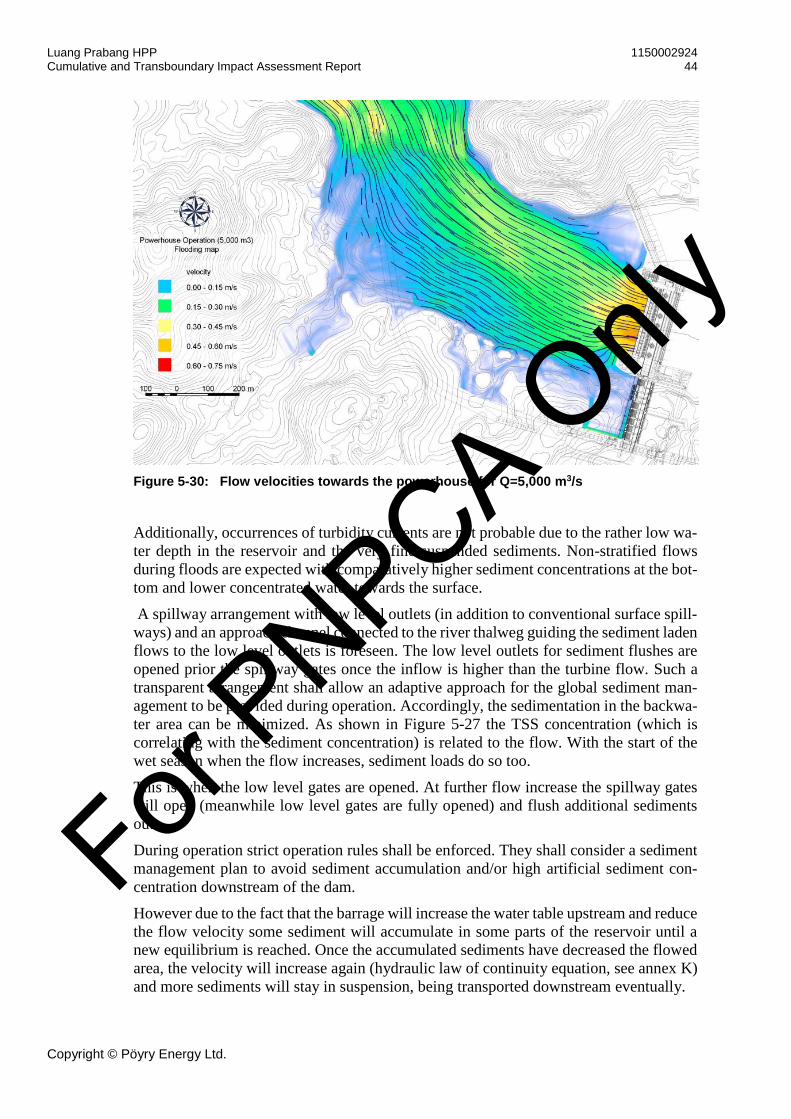
Luang Prabang HPP 1150002924 Cumulative and Transboundary Impact Assessment Report 44
Copyright © Pöyry Energy Ltd.
Figure 5-30: Flow velocities towards the powerhouse for Q=5,000 m3/s
Additionally, occurrences of turbidity currents are not probable due to the rather low wa-
ter depth in the reservoir and the very fine suspended sediments. Non-stratified flows
during floods are expected with comparatively higher sediment concentrations at the bot-
tom and lower concentrated water towards the surface.
A spillway arrangement with low level outlets (in addition to conventional surface spill-
ways) and an approach channel connected to the river thalweg guiding the sediment laden
flows to the low level outlets is foreseen. The low level outlets for sediment flushes are
opened prior the spillway gates once the inflow is higher than the turbine flow. Such a
transparent arrangement shall allow an adaptive approach for the global sediment man-
agement to be provided during operation. Accordingly, the sedimentation in the backwa-
ter area can be minimized. As shown in Figure 5-27 the TSS concentration (which is
correlating with the sediment concentration) is related to the flow. With the start of the
wet season when the flow increases, sediment loads do so too.
This is when the low level gates are opened. At further flow increase the spillway gates
will open (meanwhile low level gates are fully opened) and flush additional sediments
out.
During operation strict operation rules shall be enforced. They shall consider a sediment
management plan to avoid sediment accumulation and/or high artificial sediment con-
centration downstream of the dam.
However due to the fact that the barrage will increase the water table upstream and reduce
the flow velocity some sediment will accumulate in some parts of the reservoir until a
new equilibrium is reached. Once the accumulated sediments have decreased the flowed
area, the velocity will increase again (hydraulic law of continuity equation, see annex K)
and more sediments will stay in suspension, being transported downstream eventually.
For PNPCA O
nly

Luang Prabang HPP 1150002924 Cumulative and Transboundary Impact Assessment Report 45
Copyright © Pöyry Energy Ltd.
5.5 Fish and Fisheries
5.5.1 Importance of Local Fisheries
In 2013 MRC published the study “An introduction to the fisheries of Lao PRD” (Kent
F. Hortle et al, MRC, 2013 [6]). The study provides good information concerning fishery:
In Lao PDR, fisheries are an integral part of the lives of rural people, providing a
major part of their animal protein intakes.
The estimated consumption of inland fish is approximately 168,000 tons per year,
while consumption of other aquatic animals is estimate at 40,600 tons per year.
The estimated yields are conservatively valued at almost USD 150 million per
year.
The estimated fish consumption of inland fish per capita is 24.5 kg/year while the
one for other aquatic animals account for about 4.1 kg/year and capita.
The production of fish in the Mekong River and tributaries is assumed to be
70 kg/ha/year.
More than 481 fish species have been identified in Lao PDR.
Considering the data from MRC one can estimate that with a surface area of 4,900 ha,
the area affected by the backwater of the HPP Luang Prabang produces around 343 tons
of fish per year. With this amount the yearly fish consumption of 14,000 Lao people can
be covered (24.5 kg/capita and year). This is equal to 25% of the population of Luang
Prabang town.
Those few figures show the substantial production of fish in the Mekong and its tributar-
ies and it underlines the strong reliance of Lao people on fishery. The LP HPP acts like a
barrier in the river if no additional facilities are installed to ensure fish migration. This
impact would most probably degrade the population of the fishes rapidly since they would
be trapped between HPP Xayaburi and LP HPP, as well as between the latter and HPP
Pak Beng. Another important point is the fact that constructing LP HPP (or any of the
other dams planned on this part of the Mekong) without fish passing facilities would
make the great effort made in Xayaburi dam for enabling fishes to pass redundant, since
any longer-range migration would then be definitely blocked.
To ensure that the fishes can migrate through the hydropower plant related facilities for
up- and downstream migration have to be installed. These facilities will be designed in
consideration of the experience gained at Xayaburi HPP and following the MRC guide-
lines. Fish migration monitoring is being performed and species, biomass and migration
pattern are being identified (ongoing during operation phase).
5.5.2 Fish Species Identified in the Zone from Chiang Saen to Vientiane
Within the Mekong system it is commonly distinguished between three different types of
fish species groups (Welcomme 1985 [1] and Chanh et al. 2001 [2]). The species are
classified into black-fishes, white-fishes and grey-fishes.
Black-fishes are species that spend most of their life in lakes and swamps on the flood-
plains adjacent to river channels and venture into flooded areas during the flood season.
They are physiologically adapted to withstand adverse environmental conditions, such as
For PNPCA O
nly

Luang Prabang HPP 1150002924 Cumulative and Transboundary Impact Assessment Report 46
Copyright © Pöyry Energy Ltd.
low oxygen levels, which enable them to stay in swamps and small floodplain lakes dur-
ing the dry season. They are normally referred to as non-migratory, although they perform
short seasonal movements between permanent and seasonal water bodies. Examples of
black-fish species in the Mekong are the climbing perch (Anabas testudineus), the clarias
catfishes (e.g. Clarias batrachus) and the striped snakehead (Channa striata), (MRC
tech. paper No.8, 2002 [3]).
White-fishes, on the contrary, are fishes that do long distance migration. They depend on
habitats within river channels for the main part of the year. In the Mekong, most white-
fish species venture into flooded areas during the monsoon season, returning to their river
habitats at the end of the flood season. Important representatives of this group are some
of the cyprinids, such as Cyclocheilichthys enoplos and Cirrhinus microlepis, as well as
the river catfishes of the family Pangasiidae (MRC tech. paper No.8, 2002 [3]).
Grey-fishes are an intermediate between black-fishes and white-fishes. Species of this
group undertake only short migrations between floodplains and adjacent rivers and/or
between permanent and seasonal water bodies within the floodplain (Chanh et al. 2001
[2]; Welcomme 2001 [4]).
The zone of Mekong River from Chiang Saen to Vientiane (ca. 800 km), consists of a
changing pattern of rocky outcrops, rapids, deep pools, shoals, riffles and sandbars cre-
ating a wide variety of aquatic habitats. There is a major area of deep pools around the
confluence with Nam Ou. Four other localities where deep pools are found are near
Chiang Kong/Houay Xai, in Xayaburi and at Chiang Khan (Halls and Kshatriya, 2009).
According to MRC 140 fish species in 30 families are represented in this area (MRC,
2010; SEA of Hydropower on the Mekong mainstream).
In previous studies, 160 species were found in the study area; 56 species caught during
the fish sampling of EIA of Xayaburi HPP, 2010; 43 species caught during the fish sam-
pling of EIA of Pak Beng HPP, 2013; 120 species caught during the fish sampling of the
fish passing study for Xayaburi HPP, 2013; and 59 species caught during the fish sam-
pling of aquatic ecology monitor program for Xayaburi HPP, 2018. For more details, it
is referred to the ESIA for LP HPP (Pöyry, 2019).
5.5.3 Fish Migration Pattern in the Upper Mekong Migration System
MRC reports that the so called upper Mekong migration system (MRC Tech. paper No. 8
[3]) reaches from approximately the mouth of Loei river up the border between Lao PDR
and China. This section of the river (see Figure 5-31) is characterised by its relative lack
of floodplains and major tributaries (although there are some floodplains associated with
tributaries in the far north, i.e. the Nam Ing River, in Thailand). It is dominated by up-
stream migrations at the onset of the flood season, from dry season refuge habitats in the
main river to spawning habitats further upstream.
The upper migration system appears to be relatively isolated, with little exchange to the
further downstream migration systems.
Within rivers, deep areas are particularly important as dry season refuges. These areas
are most often referred to as deep pools. The importance of these deep pools has been
documented by the MRC fisheries programme (Poulsen et al., 2002 [5]) and is presented
in Figure 5-31).
It seems that the stretch from Thakek to the mouth of Loei river is a functional barrier
due to the lack of such deep pools. But the area from the confluence of Loei river up to
For PNPCA O
nly

Luang Prabang HPP 1150002924 Cumulative and Transboundary Impact Assessment Report 47
Copyright © Pöyry Energy Ltd.
the border to China, which is this upper Mekong migration system, is exactly the area in
which 4 additional run- of- river plants are planned beside the existing Xayaburi HPP.
Considering the barrier effect of the LP HPP, the white species (long distance migratory
species) are particularly vulnerable. Their vulnerability increases when it comes to a cas-
cade of hydropower plants because they depend on many different habitats, are widely
distributed and require migration corridors between different habitats. In a cascade of
HPPs where each dam has a backwater effect to the next upstream dam the habitats do
not differ much anymore and the white fishes have to overcome very long distances to
find variety in habitats.
With the possible cascade of run-of-river plants comprising of Pak Beng, Luang Prabang,
Xayaburi, Pak Lay and Sanakham a major part of the area identified as upper Mekong
migration system will have a change in its hydraulic conditions. The cascade will provide
more deep water areas, but the rapids will be lost. According to MRC (MRC Tech. paper
No. 8 [3]) fishes mainly migrate into areas further upstream of Pak Beng for spawning.
Only little is known about the spawning habitat requirements for most Mekong fishes.
Generally spawning habitats are believed to be associated with rapids, pools and flood-
plains. In its natural stage this area has not many floodplains, but rapids and some deep
pools. The loss of deep pools might be compensated by creation of the reservoir which
will provide more and larger deep areas.
Figure 5-31: Fish migration pattern
LEFT: Number of species reported using deep pools in mainstream Mekong RIGHT: Fish migration in
the study area (Poulsen et al, 2002 [5]). The red ovals show approximately the reservoir of Luang Pra-
bang HPP.
For PNPCA O
nly

Luang Prabang HPP 1150002924 Cumulative and Transboundary Impact Assessment Report 48
Copyright © Pöyry Energy Ltd.
Recommended mitigation measures
State of the art fish up- and downstream migration facilities have to be installed
in each of the hydropower plants in the cascade.
Stretches with alternating rapids and deep pools upstream of Pak Beng should be
protected to ensure future existence of spawning areas.
A fish monitoring program will have to be implemented, and mitigative measures
will have to be taken if required. The annual flood pattern triggers fish migrations
and causes inundation of floodplains.
5.5.4 Fish Migration Facilities
5.5.4.1 General
Dams and barrages create a direct barrier for upstream and downstream migration of fish.
Fish moving downstream can either pass over the spillway or will be drawn into the
power intakes and consequently through the turbines; both can cause high mortality.
MRC Guidance (Mekong River Commission, 2009) were in general used where applica-
ble. Pre-project monitoring at relevant locations are required to further assess the baseline
conditions within the project area. For the time being database from MRC and Xayaburi
HEPP were taken.
5.5.4.2 Design Criteria
The most relevant criteria to be used for the design of the fish migration facilities are as
follows:
Fish passage facilities for both, upstream and downstream migration should be in-
corporated.
The Navigation Lock could also be used as additional fish passage during migration
periods.
The fish migration facilities shall operate the whole year, optimally between the
lowest flow and the 1-year flood.
Design of the upstream and downstream fish passage for fish between 5 cm and
300 cm, as well as downstream drifting eggs and larvae during wet season.
Fish migration system shall use a minimum of 10% of low flow (Q95) and 1% of
the 1-year flood; two aspects should be incorporated into the design, attraction (lo-
cating the entrances for fish approaching the entrances) and passage (through the
fishways).
Maximum water velocity for short distances (< 0.2 m) is 1.4 m/s, maximum veloc-
ity in channels is 0.5 m/s.
Minimum depth is 3.0 m under all flows
Use of fish friendly turbines.
To achieve effective attraction, the fish passage design was integrated into the earliest
project concepts, as it influences the dam and powerhouse concept and alignment, abut-
ment and training wall shapes, spillway and gate design, and stilling basin design.
For PNPCA O
nly

Luang Prabang HPP 1150002924 Cumulative and Transboundary Impact Assessment Report 49
Copyright © Pöyry Energy Ltd.
Table 5-8 provides the relevant discharges in the Mekong River and tailwater levels
which are relevant for the design of the fish migration facilities:
Table 5-8: Relevant Tailwater Levels for the Fish Migration Facilities
Description Discharge Tailwater Level
Minimum Flow 1,170 m3/s 276.70 m asl
1-year flood 10,650 m3/s 287.43 m asl
5.5.4.3 Fish Migration Concept
The fish migration concept applied for the LP HPP is widely based on the concept devel-
oped for the Xayaburi HEPP, and provides the following upstream and downstream mi-
gration possibilities as shown in Figure 5-32.
Figure 5-32: Overview of the Foreseen Fish Migration Facilities
During dry season (spillway not in operation), upstream migrating fish will be attracted
by the powerhouse discharge and will enter into the upstream fish passing facilities de-
veloped over the entire length of the powerhouse, with entrances at the right pier (towards
the spillway), multiple entrances along the downstream face of the powerhouse, and at
the left pier. The fish in the collection galleries are guided by attraction currents to two
fish locks, where the fish are lifted up into the headwater of the reservoir.
When both the powerhouse and the spillway are in operation during wet season, fish
migrating upstream will be also attracted into the spillway discharge channel. Spill pat-
terns inside the stilling basin will create a hydraulic barrier forcing the fishes to the side
edges. A supplementary fish entrance on the left side of the spillway at the right pier is
providing a pathway for upstream migratory fishes guiding them to the fish passing fa-
cilities at the downstream side of the powerhouse.
RCC Dam
For PNPCA O
nly

Luang Prabang HPP 1150002924 Cumulative and Transboundary Impact Assessment Report 50
Copyright © Pöyry Energy Ltd.
Fish passing through an additional upstream fish migration system at the right bank shall
be considered as a supportive means for attracting and passing fish at the right bank of
the project during operation of the spillway for upstream migration.
The main downstream fish migration system provides entrances along the entire upstream
face of the powerhouse and a collecting gallery, where the fish are guided to the right pier
and released down to the tailwater through the terminal chute. Downstream migration is
also possible through the spillway (when in operation) and for smaller fish (smaller than
the trash rack clear spacing) through the turbines of the powerhouse. The powerhouse is
equipped with fish friendly turbines in order to reduce fish mortality during turbine pas-
sage.
5.5.4.4 Upstream Fish Passing Facilities
The main upstream fish passage facilities is incorporated in the powerhouse and comprise
the following components:
Entrances above the turbine draft tubes and on the left and right side of the power-
house.
A fish collecting gallery across the downstream side of the powerhouse connecting
all entrances.
Two large fish locks including fish crowder and movable screen floor on the left
bank pier.
A feeding pond at the right pier inclusive feeding system, with feeders along the
collecting gallery and at the back of the fish locks, to create fish attraction currents
throughout the collecting gallery and through the various entrances of the facility.
A fish monitoring station
Entrances and fish collecting galleries
Fish migrating upstream attracted by the flow through the powerhouse can enter the up-
stream fish migration facility via one of the 2 x 7 entrances (2 m wide and 3 m high, sill
at 273.5 m asl and 278.5 m asl), located at different levels above the turbine draft tubes
along the entire length of the powerhouse, and additionally via the two openings of the
right side entrance (b: 2 m x h: 7 m ; sill at 272.5 m asl and 279.5 m asl) or via the three
openings of the left side entrance (b: 6 m x h: 7 m (2x) and b: 6 m x h: 3 m (1x); sill at
272.5 m asl and 279.5 m asl). During the wet season, fish can also use the two openings
of the spillway entrance (b: 2 m x h: 7 m; sill 279.5 m asl), as well as on the spillway
tailrace side.
After entry into this system, fish heading up to the upstream area are successively passing
through the collecting gallery and one of the two fish locks and are released into the
headwater. The general arrangement of the upstream fish passage facilities are shown in
Figure 5-33
For PNPCA O
nly

Luang Prabang HPP 1150002924 Cumulative and Transboundary Impact Assessment Report 51
Copyright © Pöyry Energy Ltd.
Figure 5-33: General Arrangement of the Upstream Fish Migration Facilities
The flow pattern in the collecting gallery and in the tailrace channel (together with the
main turbine outflow) will be checked during the next project stage (Tender Design) with
a 3D-CFD modelling, and the position of the entrances, feeders of feeding galleries and
geometry of flow passing structure be confirmed or modified/optimized, if need be.
The position of the spillway entrance will be adapted/optimized also during the next pro-
ject stage depending on the spill patterns inside the stilling basin (in accordance with
results of physical model test of the spillway), for the flows prevailing during the opera-
tion range of this entrance (wet season).
Fish Locks
Two parallel fish locks connect the fish pass to the headwater. Operation of a fish lock is
very similar to the navigation lock. The operation cycle of the locks includes an attraction
phase and a transfer phase. Both locks will operate alternately to maintain a continuous
fish migration pathway.
During the attraction phase, flow is provided from the auxiliary powerhouse at the back
of one of the fish lock chamber, to attract fish into approach channel and into the lock
chamber itself. Each lock is provided with a fish crowder in its approach channel. The
fish crowder will act as a trap during the fish attraction phase, forming an inscale with its
two leaves. The two leaves of the inscale will close at the end of the attraction period and
the fish crowder will force the fish to enter into the lock chamber. The transfer phase will
continue by closing the fish lock entrance gate and slowly filling the lock. A movable
screen floor in the lock chamber will force the fish to move up with the raising water
level. Once the water level in the lock chamber is equalized with the reservoir level, an
exit gate will be open to release the fish into the headwater of the reservoir.
RCC Dam
For PNPCA O
nly

Luang Prabang HPP 1150002924 Cumulative and Transboundary Impact Assessment Report 52
Copyright © Pöyry Energy Ltd.
Feeding System
The feeding system provides fish attraction currents throughout the collecting gallery and
through the various entrances of the facility, to guide the fish from the river to the fish
locks.
The water for the feeding system operation is provided by the auxiliary units during the
dry season (TWL < 283 m asl). Additional water is supplemented by a gravity water sup-
ply gallery during the wet season (TWL > 283 m asl). This water is collected in the feed-
ing pond, in the right pier, and is sourced from the following:
The water from the downstream migration, provided via two auxiliary units, be-
tween 80 and 120 m3/s,
Water from the third auxiliary unit taken from the headwater, 60 m3/s,
Via the gravity water supply (bypass) system from the headwater, up to 45 m3/s.
From the right pier feeding pond a total of four feeding galleries provide the water for the
attraction flow at the collection galleries and the various entrances:
The feeding galleries 1 and 2 feed the right and the left part of the powerhouse fish
collection galleries.
Feeding gallery 3 feeds the entrances at the left pier.
Feeding gallery 4 supplies the feeders located at the back of the two fish locks.
Hydraulic Design
The flow required for the operation of the upstream fish passage facility (attraction flow)
varies with the tailwater level and ranges approx. from 80 to 180 m3/s. The required flow
depending on the TWL and corresponding water level in the feeding pond (due to the
head losses in the feeding galleries) are given in the following Figure 5-34.
Figure 5-34: Attraction Flow for Upstream Migration
For PNPCA O
nly

Luang Prabang HPP 1150002924 Cumulative and Transboundary Impact Assessment Report 53
Copyright © Pöyry Energy Ltd.
The flow velocities through upstream collection gallery entrances ranges from 1.0 m/s on
the left side of the powerhouse to 0.85 m/s on the right side of the powerhouse. The ve-
locity in the fish collecting gallery ranges from 0.2 m/s to 0.5 m/s, and depend on the
tailwater level and the location in the gallery.
Fish monitoring station
For the upstream fish migration system a fish monitoring station is foreseen at the fish
lock exit. For the time being a hydro-acoustic fish survey system is foreseen. However,
the exact type and technology for the fish survey will be decided at a later stage in order
to install a modern and state-of-the-art technology.
5.5.4.5 Right Bank Fish Passing Facility (Upstream Migration)
Fishes migrating upstream generally are guided by the current, preferentially keeping
near the banks of the river. During the wet season when the spillway is in operation, fish
will get attracted by the spillway discharge. For fishes at the right river bank, a possibility
for upstream migration will provided near the Navigation Lock.
Thus, facilities for upstream migration are foreseen at the Navigation Lock comprising
the following components:
A Fish Lock downstream of the stilling basin next to the Navigation Lock.
A culvert crossing the downstream approach channel, providing sufficient clear-
ance for the moving ships and vessels at the downstream approach channel.
An open channel at the right bank leading to the upstream approach channel.
The fish entering the fish lock will be lifted up to the headwater level, and will be released
into the u/s culvert and channel leading to the upstream approach channel of the Naviga-
tion Lock. The flow in the approach channel of about 5 m3/s will be used as attraction
flow at the entrance of the fish lock.
When only the powerhouse is in operation (no spillway operation), the fishes will be
attracted by the powerhouse discharge at the tailrace channel, and passage at the right
bank will not be required.
An additional entrance inside the approach channel of the Navigation Lock connected to
the Fish Lock which provides an additional upstream migration possibility. This entrance
will be in operation during the main fish migration period (April, May).
The position of the right bank passage facility will be adapted/optimized during the next
project stage (Tender Design).
5.5.4.6 Downstream Fish Passing Facilities
The downstream fish passage facility of the powerhouse comprises a collecting gallery
above the powerhouse intakes and a downstream stepped chute (exit chute) to the tailrace
channel.
Additionally fish-friendly turbine technologies are implemented to mitigate lethal inju-
ries during turbine passage for smaller fish that will pass through the trash rack of the
powerhouse intakes.
Finally, downstream migration through the spillway may occur as well when spillway is
opened for spillage flows.
For PNPCA O
nly

Luang Prabang HPP 1150002924 Cumulative and Transboundary Impact Assessment Report 54
Copyright © Pöyry Energy Ltd.
Figure 5-35 shows the general arrangement of the downstream migration system at the
Powerhouse.
Figure 5-35: Downstream Migration System
5.5.4.7 Main downstream migration facilities
Downstream migrating fishes are to be collected at a fish collecting gallery at the up-
stream side of the powerhouse leading to the right pier. The 14 entrances to this gallery
(2.5 m wide and 3.0 m high, sill at 302.0 m asl) are located above the inlet structures, and
are provided over the entire length of the powerhouse. At the right pier a downstream
chute will guide the fish into the tailwater area.
The total flow through the downstream migration facility ranges from 100 to 140 m3/s
and the corresponding velocity through the entrances of the collecting gallery ranges from
1.0 m/s to 1.4 m/s.
A constant discharge of about 20 m3/s is used for the continuous operation of the down-
stream chute. The exceeding water (80 to 120 m3/s) will be diverted and used for attrac-
tion flow for the upstream migration system (released through two auxiliary units into the
right pier feeding pond). The downstream migration facilities need to operate during the
entire year.
The flow pattern in this collecting gallery and at the flow splitting structure (to the two
auxiliary units) will be checked during the Detailed Design stage with a 3D-CFD model-
ling. If required, the geometry of the intakes of the auxiliary units as well as the geometry
of the fish exclusion screen (angle bar rack) to be installed at the intake are will be
adapted.
The exit chute has been designed to minimize energy levels in the pools (< ~500 W/m3)
while ensuring a sufficient hydraulic profile at each weir between the pools (about
2 m x 2 m), and for maximum head drop of 3 m from pool to pool. The flow in the exit
RCC Dam
For PNPCA O
nly

Luang Prabang HPP 1150002924 Cumulative and Transboundary Impact Assessment Report 55
Copyright © Pöyry Energy Ltd.
chute is controlled by a combination of a flap and a sluice gate. A physical model test
will be carried out to confirm the proposed geometry.
5.5.4.8 Fish Friendly Turbines
The main turbines for the LP HPP will be provided with several fish-friendly features,
which are directly related to mitigate lethal injuries at fishes passing the turbines down-
stream, such as:
Reduction of the runner blades by turbine and reduction of rotational speed of the
turbine in order to mitigate turbine induced mortality by blade strikes, one of the
most relevant causes of mortality during turbine passage.
A fish friendly guide vane design can further minimize turbulence and shear stress
regions, thus improving the fish survival rate.
High precision in manufacturing the periphery turbine components allows to reduce
gaps and thus reduce water flowing through the gaps leading the subsequent turbu-
lences.
Fish friendly Kaplan turbines have oil free hubs compared. The servomotor is lo-
cated inside the runner hub with the surrounding space filled with water and addi-
tives for corrosion protection. Such a design is a major positive impact on the water
quality and thus on the environment compared to the conventional design.
5.5.5 Conclusion and Findings Concerning Fish Migration and Fisheries
The fish migration facilities are state of the art and therefore provide many options for
migration from different start points up- and downstream of the HPP. However, it has to
be expected that even with the best available technology some of the fishes will not use
the migration system. So far, there is only limited information available on the migrating
patterns and abilities of the around 160 species of fish known to live in this part of the
Mekong. A first fish passing system as described here was installed at Xayaburi. There,
monitoring has started, and it will be intensified once the entire migration system is op-
erating. A similar monitoring program will also be carried out at LP HPP. It will be im-
portant to consider the data of this monitoring to quantify the effect of the Mekong ROR
plant. Since the LP HPP will use the same technology as the Xayaburi HPP (except for
the fish ladder) the impact is estimated to be quite similar.
There are two very important facts which have to be considered and mitigated:
(1) Diversity of fish species and size of fish population
(2) Animal protein intake of local people
With the cascade of ROR plants (Pak Beng to Pak Lay in place, the variety of flow con-
ditions and habitats within that part of the Mekong is mostly lost. The effect to the fishes
is not completely clear. However, if spawning areas are lost this will have a major effect
to the fish population. A fish monitoring program will have to be implemented, and mit-
igative measures will have to be taken if required. . Besides, the spawning areas in the
tributaries have to be identified and should be protected. Both measures should ensure
the stock of fish species can be maintained.
The amount of fishes and the diversity of fish species is not only endangered by hydro-
power, but also by the growing population who often relies on fish as their main protein
source. Since 1985 Lao population is increasing on a quite linear growth of approximately
For PNPCA O
nly
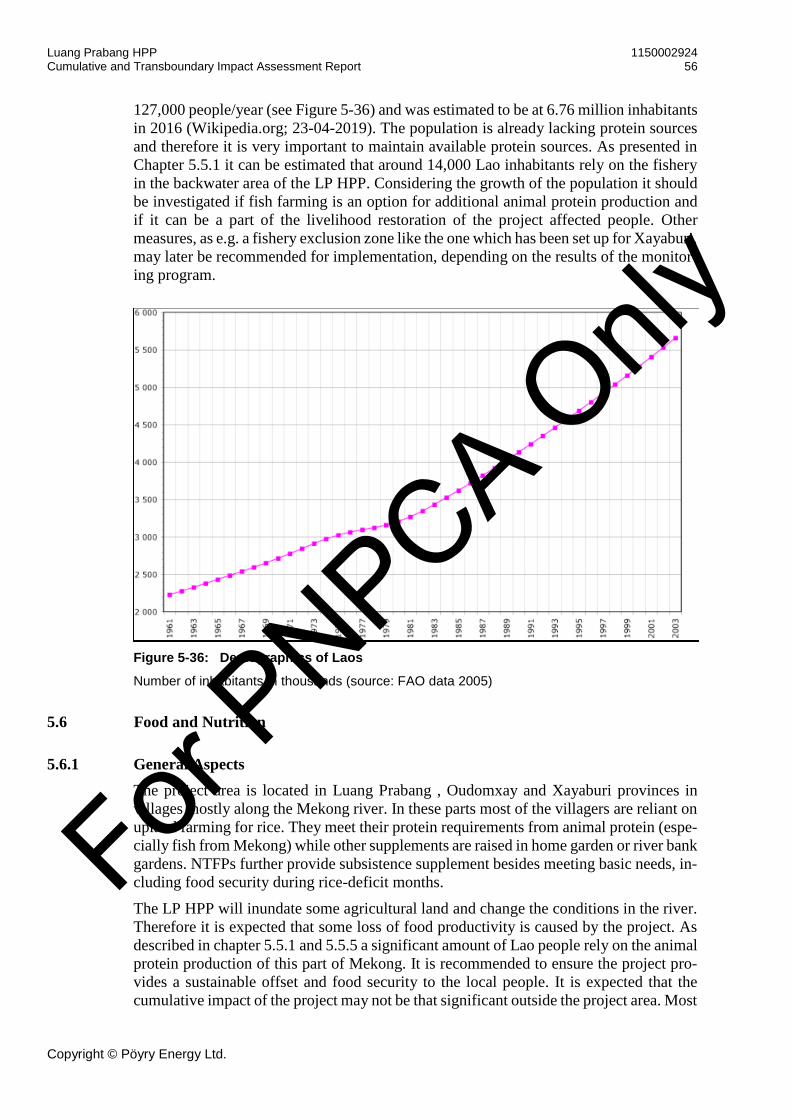
Luang Prabang HPP 1150002924 Cumulative and Transboundary Impact Assessment Report 56
Copyright © Pöyry Energy Ltd.
127,000 people/year (see Figure 5-36) and was estimated to be at 6.76 million inhabitants
in 2016 (Wikipedia.org; 23-04-2019). The population is already lacking protein sources
and therefore it is very important to maintain available protein sources. As presented in
Chapter 5.5.1 it can be estimated that around 14,000 Lao inhabitants rely on the fishery
in the backwater area of the LP HPP. Considering the growth of the population it should
be investigated if fish farming is an option for additional animal protein production and
if it can be a part of the livelihood restoration of the project affected people. Other
measures, as e.g. a fishery exclusion zone like the one which has been set up for Xayaburi,
may later be recommended for implementation, depending on the results of the monitor-
ing program.
Figure 5-36: Demographics of Laos
Number of inhabitants in thousands (source: FAO data 2005)
5.6 Food and Nutrition
5.6.1 General Aspects
The project area is located in Luang Prabang , Oudomxay and Xayaburi provinces in
villages mostly along the Mekong river. In these parts most of the villagers are reliant on
upland farming for rice. They meet their protein requirements from animal protein (espe-
cially fish from Mekong) while other supplements are raised in home garden or river bank
gardens. NTFPs further provide subsistence supplement besides meeting basic needs, in-
cluding food security during rice-deficit months.
The LP HPP will inundate some agricultural land and change the conditions in the river.
Therefore it is expected that some loss of food productivity is caused by the project. As
described in chapter 5.5.1 and 5.5.5 a significant amount of Lao people rely on the animal
protein production of this part of Mekong. It is recommended to ensure the project pro-
vides a sustainable offset and food security to the local people. It is expected that the
cumulative impact of the project may not be that significant outside the project area. Most
For PNPCA O
nly

Luang Prabang HPP 1150002924 Cumulative and Transboundary Impact Assessment Report 57
Copyright © Pöyry Energy Ltd.
of the impacts will be localised within the project area and the resettlement area to be
specific.
A strategic paper by MRC (Mekong River Commission, 2009) highlights that agriculture
provides livelihoods for more than 70 percent of the Mekong Basin’s population, with 45
percent of the population considered to be below the poverty line. The environmental
impacts of land-use change and irrigation development are more likely to be of cumula-
tive nature and occur on a trans-boundary scale, water quality impacts can be local and
cumulative, and can manifest on a trans-boundary scale. The study also identifies that
barriers to fish migration reduce fish stocks, and could perhaps reduce the livelihoods
derived from fishing by 30 percent or more.
As per another study “Food Security and Biodiversity in the upland Lao PDR: A Review
on Recent situation of Causes and Effect” (Douangsavanh & Phouyyavong, 2009) high-
lights that Lao PDR lies within the primary center of origin and domestication of Asian
rice (Oryza sativa L.) and rice cultivation in Lao appears to date back to at least 4000 BC.
In the rice germplasm bank of the world maintained by the (IRRI), Lao is one of two
countries that have contributed almost 90% of the global stock of rice varieties. However,
villagers in Northern province experience a minimum of 3 to 4 months of rice insuffi-
ciency in a year, extending to a maximum of 5 or 6 months in some years. The project
once constructed will either inundate some agricultural land (river gardens) or will reset-
tle villages away from their current production bases.
A study conducted in Cambodia (IFRED, 2012) to analyse the impact of mainstream
hydropower dams on food and nutrition security highlights that mainstream Cambodian
dams are therefore predicted to reduce the supply of inland fish and other aquatic animals
by between 34,000 to 182,000 tonnes from the baseline values. The uncertainty range
depends mainly upon the hypothesized distribution of long-distance migrants’ spawning
habitat, which highlights the importance of new research on spawning areas. The study
concludes that after the construction of the mainstream dams there will be a further re-
duction of the already low number of individuals who have adequate levels (RDA, rec-
ommended daily allowance) of energy, protein and iron.
The study states that a reduction of 34% of the available fish and fish products for con-
sumption would have a considerable impact on the proportion of the population living in
the plains who are able to obtain their daily dietary allowances (RDAs), and who are
already considered as the least nutrient-secure ecological zone. A reduction in the avail-
ability of fish and specifically of long-distance migrants, which is important for the pro-
vision of iron, would have a strong detrimental impact on the rural population driving
iron security even lower and posing a risk to public health. Children, especially in rural
areas, will also be directly affected by the reduction of inland fish availability. School
children could be considered as the most food-insecure age group. The data on pregnant
women’s nutrition shows that they are the most vulnerable group to protein reduction,
with the lowest rate of protein RDA satisfaction. Therefore, the predicted reduction of
per capita supply of inland fish and OAAs is expected to result in:
negative effects on public health that affect strongly some of the most vulnerable
population groups, such as those living in remote rural areas and school children;
aggravation of existing malnutrition and creation of more people who cannot ob-
tain the recommended daily allowance of key nutrients, thus exposing more peo-
ple to health risks.
For PNPCA O
nly

Luang Prabang HPP 1150002924 Cumulative and Transboundary Impact Assessment Report 58
Copyright © Pöyry Energy Ltd.
5.6.2 Conclusion and Findings Concerning Nutrition
Considering the fact that LP HPP is a mainstream project with affected communities liv-
ing along the Mekong and reliance on rice and fish for their dietary requirement, the
project is expected to cause impact on the nutrient intake of the PAPs and possibly down-
stream communities. The actual impact need to be further assessed with consideration of
the fact that the project plans to develop a state of the art fishpassing facilities to mitigate
the impact of creating a barrier for fish migration. An overarching study of recent up-
stream and downstream projects such as Pakbeng and Xayaburi may shed further light
on the cumulative projects induced impacts. The type and quantum of impacts can further
clarify appropriate coping and mitigation mechanism or improvements of the existing
mitigation measures. Nevertheless, the project developer is expected to be responsible to
ensure that food and nutrition requirements of PAP are addressed during the transition
period of resettlement and for longer period for the most vulnerable households.
5.7 Impacts Related to Other Development Projects Construction
Major related development projects that will be impacted by LP HPP or vice versa are as
follows;
China-Lao Railway Project;
Pak Beng HPP;
Xayaburi HPP;
Hongsa-Chiangman and the new Bridge across Mekong River Project; and
Development around Luang Prabang City and World Heritage status
The development of constructions in the vicinity of the LP HPP may result in cumulative
impacts depending on the overlap of the construction timeframes. However, the cumula-
tive impacts generated during the construction are expected to be local to neighbourhood
in extent and either short or medium term. There would be varying potential for adverse
cumulative construction impacts to arise with some of these projects.
The construction of other development project may result in cumulative impacts particu-
larly at the worksites. The majority of cumulative interactions generated by the project
construction and operation from combinations of relevant environmental and social im-
pacts is presented in the Table 5-9.
Table 5-9: Potential cumulative impact by other development projects construction
Topics Description
Power Diversification of energy sources;
Increase demand in the power sector;
Water Increase demand for water availability;
Traffic Increase demand for traffic and transportation;
For PNPCA O
nly

Luang Prabang HPP 1150002924 Cumulative and Transboundary Impact Assessment Report 59
Copyright © Pöyry Energy Ltd.
Topics Description
Economic Increased macro-economic growth;
Increased government revenues and spending;
Increased short term costs in debt service;
Lower the growth of natural resources sectors (i.e. fisheries,
agriculture);
Increased industrial growth (i.e. logistic, mining);
Loss of tourism;
Increased poverty and loss of livelihoods of the poor;
Food prices rising;
Temporary / permanently loss of existing infrastructure (i.e. irri-
gation, roads, agricultural land, river bank gardens and soused of
livelihood);
Hydrology
and Sediment Change of water levels and flow;
Potential of catastrophic flood releases;
Changes in extent and duration of flooding area;
Changes of downstream and upstream sediment transport, nutri-
ent transport, and deposition;
Water Quality Change of surface water quality (i.e. release of wastewater,
waste including hazardous waste and chemical release);
High turbidity of water and impacts on ecosystem health and
water supplies;
Loss of nutrients on fine sediments, reduced the fertility of
river and floodplain;
Terrestrial Habitat loss and degradation of flora and fauna;
Change in Key Biodiversity Areas associated with the Mekong
River
Change in land use (i.e. wetland due to inundation);
Loss of forest cover through construction activities and struc-
tures;
Aquatic Change in productivity of aquatic habitats;
Loss in aquatic production;
Change in the population of rare and endangered species;
Air Quality Increase of dust and particulate matter;
Climate
Change
Increased CO2 from the emission of machinery;
Noise Increased of noise pollution;
Fisheries Loss of fish production due to the degradation and loss of
spawning habitats and migration corridor;
Loss of fish species;
Loss in capture fisheries;
For PNPCA O
nly

Luang Prabang HPP 1150002924 Cumulative and Transboundary Impact Assessment Report 60
Copyright © Pöyry Energy Ltd.
Topics Description
Social Change in health and nutrition;
Reduction of primary protein source (i.e. loss of fisheries)
Increased incidence of vector disease;
Sexually Transmitted Diseases transmission in the labour force
and the camp followers;
Increase the risk of life and injury due to the construction, op-
eration, and traffic;
Social impact on land acquisition, resettlement, loss of access;
Loss of homes, assets, agricultural land, riverbank gardens, ag-
riculture land and, forest;
Loss of community resources including cultural and historical
sites;
Loss of traditional knowledge/practices/cultures;
Loss of Mekong River access and navigation;
Loss of access to subsistence income (i.e. fishery);
Loss of tourism attractions;
Loss of landscape/aesthetic degradation, visual intrusion due to
the construction and operation of the projects.
To prevent or minimize negative impacts on the environmental and social, the implemen-
tation of an effective Environmental and Social Management Plan during construction
and operation associated with the developed projects shall be implemented.
5.7.1 China-Lao Railway Project
As part of its Kunming-Singapore line, China is building a railway connecting Kunming,
in Southern-China, to Singapore, running through Laos, Thailand, and Malaysia.
In Laos, a high-speed train line will stretch around 410 km from Boten, in the Lao-China
border, to Vientiane, Lao capital and also a bordering city with Thailand (RFA, 2018).
There will be a total of four major stations in Lao PDR: 1) Luang Namtha, 2) Luang
Prabang - about 13 kilometers north of the city, 3) Vang Vieng, and 4) Vientiane (see
Figure 5-37).
For PNPCA O
nly

Luang Prabang HPP 1150002924 Cumulative and Transboundary Impact Assessment Report 61
Copyright © Pöyry Energy Ltd.
Figure 5-37: China-Laos Railway map and the major stations
As shown in Figure 5-38, within the vicinity of the LP HPP, the China-Laos Railway has
two crossings across the Mekong River, the first one at Ban Sanok about 20 km down-
stream of LP HPP, and the second one at Ban Lathan, about 7 km upstream of LP HPP.
In addition, there is an existing access road, about 5 m widths for the China-Laos railway
running from Chomphet district passing through forest area to Ban Houaygno, the pro-
posed Luang Prabang dam site with about 40 km length. This existing road might be used
as an alternative access to the LP HPP site at the initial stage.
For PNPCA O
nly

Luang Prabang HPP 1150002924 Cumulative and Transboundary Impact Assessment Report 62
Copyright © Pöyry Energy Ltd.
Figure 5-38: Chinese Railway construction
Camps and workshops area and the means of transport proposed of LP HPP
As shown in Figure 5-38, relevant environmental and social impact by Chinese Railway
construction activities at the train station and rail track construction sites, construction
camps, workshops, tunnels, quarries, borrow and disposal areas, etc. is foreseeable mostly
along the railway track (marked in red areas). Since the available imagery is outdated
(dating from August 2017), it does not show the construction sites and related camps and
workshops presently in place upstream of Luang Prabang, in the vicinity of the dam site
It is expected that the construction will be completed by the end of 2021, therefore, the
impacts of the Chinese Railway construction (short duration is expected) to LP HPP and
vice versa are only occurring for a short time of period.
5.7.2 Pak Beng HPP
The Pak Beng HPP is located in the upper reaches of the Mekong River in Pak Beng
District, Oudomxay Province, and Northern Laos. The Pak Beng HPP is planned to be a
low head Run-of-River project with an installed capacity of 912 MW. The major struc-
tures planned are water retaining structures with 14 sluice gates, powerhouses, a
500 DWT navigation lock, and fish pass. Most of the electricity produced is meant to be
transmitted to the Mae Moh Substation in Thailand through 500 kV transmission lines;
this is 230 km away from the Pak Beng HPP; an outgoing transmission line of 230 kV
will be connected to a local substation of about 110 km in distance.
For PNPCA O
nly
Luang Prabang HPP 1150002924 Cumulative and Transboundary Impact Assessment Report 63
Copyright © Pöyry Energy Ltd.
As it is an ROR plant same as Luang Prabang, Pak Beng HPP will not change the flow
pattern and therefore no hydrological impact is expected to LP HPP. However, Pak Peng
HPP has to use state of the art technology for fish migration and sediment transport, oth-
erwise the measures taken at LP HPP and Xayaburi HPP are meaningless since migration
will be blocked further upstream and sediment will accumulate.
A close cooperation between the operators is highly recommended. Information about
sediment flushes, spillway operation and fish migration shall be shared to minimize en-
vironmental impacts and for a proper monitoring of fish migration behave and develop-
ment of the fish population etc.
5.7.3 Xayaburi HPP
The Xayaburi HPP is the first such project on the Mekong mainstream, downstream of
China and would be capable of generating average of 7,400 GWh/y of electricity, mainly
for export to Thailand.
The dam has an installed capacity of 1,285 MW with a dam 810 m long and 32 m high
with 7 spillway gates, 4 Low-Level Outlets, a reservoir area of 49 km2 and live storage
of 225 Mm3. The normal operation water level is 275 masl.
The Xayaburi HPP is located on the downstream of the proposed LP HPP thus will be
subject to impact from LP HPP in terms of water from flood release and power genera-
tion.
As it is a ROR plant Luang Prabang will not change the flow pattern and therefore no
hydrological impact is expected to HPP Xayaburi.
A close cooperation between the operators is highly recommended. Information about
sediment flushes, spillway operation and fish migration shall be shared to minimize en-
vironmental impacts and for a proper monitoring of fish migration behave and develop-
ment of the fish population etc.
5.7.4 Hongsa-Chiangman Road and the new Bridge across Mekong River Project
The 114-kilometers Hongsa-Chiang Man Road (R4B), will be a shortcut new access from
Thailand to Luang Prabang, Laos. The road begins at Ban Napong, Hongsa District, in
Xayaburi Province, and ends at Ban Chiangman, Chomphet District, Luang Prabang
Province. It will have two 3.5-metre-wide lanes with 1-metre shoulder. The road con-
struction began in early 2016 and is due to be completed in 2019. The road will help
shorten the travel time from the Huai Kon border checkpoint in Nan of Thailand to Luang
Prabang by half from the current five to six hours to less than three. This road can be used
as an alternative route for the transportation of heavy equipment and materials from Thai-
land to LP HPP.
In addition, there is a plan for construction of a new bridge across Mekong River at about
10 km upstream of the ferry port, Luang Prabang Province. This bridge will connect
Hongsa-Chiang Man Road (R4B) to Highway No.13N thus providing a better connection
between the two sides of the river to Luang Prabang City and LP HPP.
5.7.5 Development around Luang Prabang City and World Heritage status
Luang Prabang City was registered and declared as a World Heritage Site in December
1995. Any development within the World Heritage boundary requires concurrences from
World Heritage Office.
For PNPCA O
nly
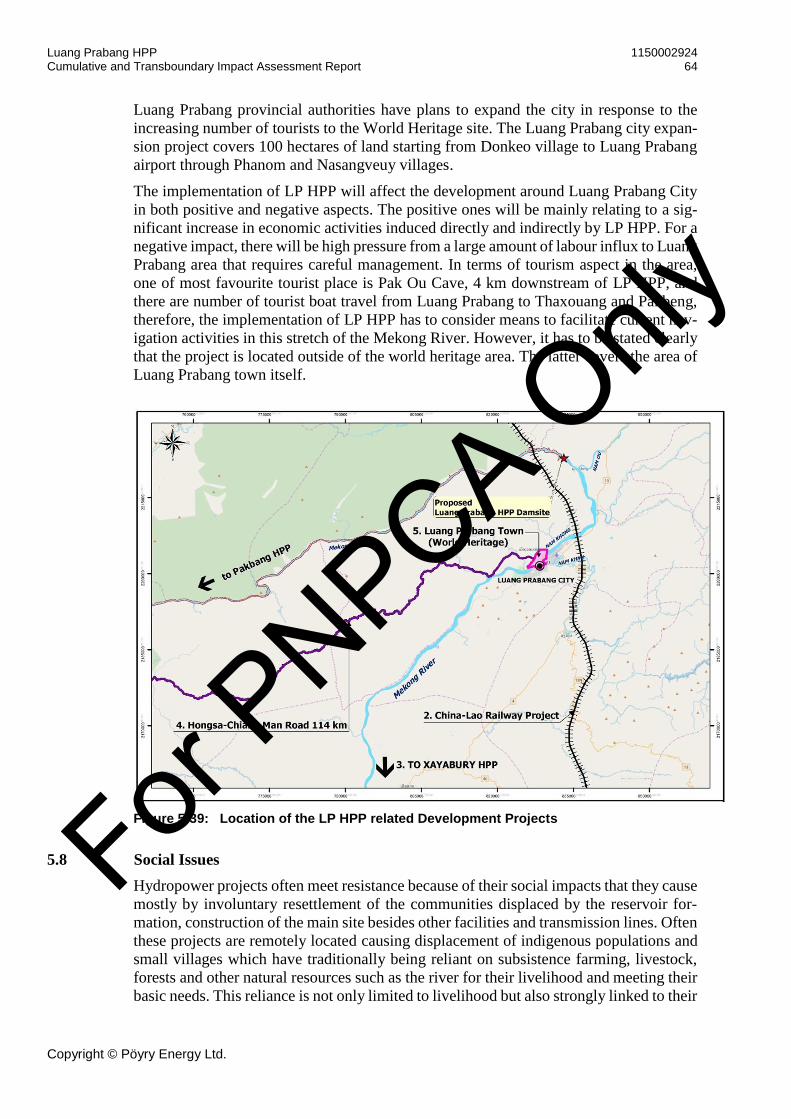
Luang Prabang HPP 1150002924 Cumulative and Transboundary Impact Assessment Report 64
Copyright © Pöyry Energy Ltd.
Luang Prabang provincial authorities have plans to expand the city in response to the
increasing number of tourists to the World Heritage site. The Luang Prabang city expan-
sion project covers 100 hectares of land starting from Donkeo village to Luang Prabang
airport through Phanom and Nasangveuy villages.
The implementation of LP HPP will affect the development around Luang Prabang City
in both positive and negative aspects. The positive ones will be mainly relating to a sig-
nificant increase in economic activities induced directly and indirectly by LP HPP. For a
negative impact, there will be high pressure from a large amount of labour influx to Luang
Prabang area that requires careful management. In terms of tourism aspect in the area,
one of most favourite tourist place is Pak Ou Cave, 4 km downstream of LP HPP, and
there are number of tourist boat travel from Luang Prabang to Thaxouang and Pakbeng,
therefore, the implementation of LP HPP has to consider means to facilitate current nav-
igation activities in this stretch of the Mekong River. However, it has to be stated clearly
that the project is located outside of the world heritage area. The latter covers the area of
Luang Prabang town itself.
Figure 5-39: Location of the LP HPP related Development Projects
5.8 Social Issues
Hydropower projects often meet resistance because of their social impacts that they cause
mostly by involuntary resettlement of the communities displaced by the reservoir for-
mation, construction of the main site besides other facilities and transmission lines. Often
these projects are remotely located causing displacement of indigenous populations and
small villages which have traditionally being reliant on subsistence farming, livestock,
forests and other natural resources such as the river for their livelihood and meeting their
basic needs. This reliance is not only limited to livelihood but also strongly linked to their
For PNPCA O
nly

Luang Prabang HPP 1150002924 Cumulative and Transboundary Impact Assessment Report 65
Copyright © Pöyry Energy Ltd.
ethnicity, local culture, traditional beliefs, traditional knowledge and communal har-
mony.
The LP HPP is a ROR project and hence may not cause significant submersion of villages
and production assets as compared to other projects of similar capacity with a much big-
ger reservoir. However, the project will potentially affect 26 villages along the main Me-
kong causing disruption to their existing lifestyle, means of livelihood, heavy reliance on
Mekong for transport, ethnic identity and cultural beliefs (3 major ethnic groups in the
project). The project may also disturb the current land use pattern causing variation in
land use and the associated market prices.
It should be further noted that the project area also overlaps with the ongoing China-Lao
Railway project. The overlap may magnify or diminish the impacts caused by the LP
HPP, however most of the impacts are likely to be magnified. Below the likely cumula-
tive social impacts are presented.
5.8.1 Land Use Pattern
The villagers currently rely partly on slash and burn cultivation and upland rice. Reloca-
tion to relatively flat area and formalization of village boundaries at resettled sites will
restrict the land availability and thereby increase the land price. Compensation paid for
the lost land in original villages has also been a factor in inflating the land price in Lao
PDR. Experience with other projects such as Nam Ngiep1 and Nam Theun1 project in
central Laos have indicated that the compensation demanded by PAP (resettlers) has been
steadily going up guided by rates of other nearby projects. These impacts will be further
cumulated by the Lao China railway project.
5.8.2 Socio-Economic Parameters
Payment of compensation, subsidies and labour opportunities in the initial few years will
infuse a lot of money in the local economy. This will increase the purchasing power of
the PAP and the local communities benefitting directly from the increased economic ac-
tivity. Though this is a positive impact yet if not managed well may become unsustainable
over the time thereby causing poverty for some households.
Further increase in cash flow and economic activity around the project area may cause
the price of commodities and other consumables to go up, thereby rolling the effect onto
bigger district/province level markets. Further there is a possibility that the local market
may not be able to cater to the increased demand of construction workers and camp fol-
lowers in the years of construction.
This impacts will be further cumulated by the Lao China railway project, which already
has created increased demand of commodities and other consumables.
5.8.3 Social conflict, risk of STD (sexually transmitted disease), human trafficking and
other behavioural issues.
The construction of the dam and associated facilities will cause an increased influx of
workers and camp followers. A fair percentage of these workers in Lao PDR are mostly
from neighbouring countries as has been observed from other projects. This increased
For PNPCA O
nly

Luang Prabang HPP 1150002924 Cumulative and Transboundary Impact Assessment Report 66
Copyright © Pöyry Energy Ltd.
population will further augment the already existing population of workers and camp
followers for the Chinese Lao railway project.
The increased population may cause undesirable impacts such as increased risk of STD,
human trafficking, conflict between outsiders and locals, increased number of entertain-
ment venues, traffic accidents and other related issues. It’s also possible that some of
these population may even percolate to neighbouring provinces and so does the impact.
5.8.4 Transport
The main river channel will not be closed during the construction of the dam; it will be
required to ensure navigable flow velocities. However, during river diversion before com-
missioning, and before the ship lock will be entirely functioning, navigation will be in-
terrupted for a short while. Most of the villages in the project area have no or poor land
connectivity and rely heavily on river transport for their daily routine. Further some of
these villages are also rest/stop-over points for the cargo or tourists boats passing through
the Mekong from Houay Xay in North West Laos to Vientiane and downstream.
However, construction of roads connecting the project site and within new resettlement
areas will be a positive impact on the local and regional economy.
5.8.5 Conclusion and Findings Concerning Social Issues
Cumulative impacts will be rather short-lived and mostly related to the current ongoing
construction works of the Chinese Lao railway project. As an additional disruption in
river traffic, the travel and transportation along the Mekong River will be further im-
peded.
The installation of navigation locks will serve to reduce these impacts. There will be a
time loss to pass through the navigation lock but on the other hand, the resulting elevation
of the water level and the reduced flow velocities upstream of the dam will simplify pas-
sage for boats transporting passengers and goods.
For PNPCA O
nly

Luang Prabang HPP 1150002924 Cumulative and Transboundary Impact Assessment Report 67
Copyright © Pöyry Energy Ltd.
6 CONCLUSIONS AND RECOMMENDATIONS
6.1 Prediction of Cumulative Impacts
Hydrology and Hydraulic
Since the LP HPP is a run- of- river plant it will not affect the hydrograph during opera-
tion. Upstream and downstream of the dam the hydraulic conditions change. The back-
water effect of Xayaburi HPP defines the tailwater level at LP HPP and therefore no river
section remains, that has natural flow conditions. Upstream the backwater effect of LP
HPP reaches the tailwater of Pak Beng. The cascade of the three ROR plants cause lower
flow velocities in the whole section. The river morphology is not much diversified any-
more, since rapids and pools are mostly inundated as the backwater affected area of each
HPP reaches the tailwater area of the upstream HPP.
Sediment Transport
Reduction of suspended sediments due to the Lancang Cascade and other dams at tribu-
taries are evident, both based on findings within the existing literature and based on the
trend analyses carried out by Pöyry.
Luang Prabang and Xayaburi HPP are equipped with low level gates, which are opened
prior to the surface spillway gates and stay open as long as the inflow is larger than the
turbine flow of the HPP. Further increase of flows lead to an additional release over the
spillway. The technology used for sediment flushes from Pak Beng is currently not
known. However since all projects on the Mekong mainstem are obliged to follow the
MRC guidelines it is hereby assumed that suitable facilities will be installed. It can there-
fore be concluded that the cascade from Pak Beng to Xayaburi will reduce sediment
transport somewhat until the backwater areas of each HPP are in a new equilibrium.
Fish and Fishery
Since the LP HPP will use the same or better fish pass technology as used at HPP Xaya-
buri one can assume that the fishes passing one facility are also able to pass the other. If
a similar technology is used for Pang Beng and other Mekong River HPPs it can be as-
sumed that the effect will be quite the same. With a proper monitoring and interaction
with the operator of all HPPs in the cascade this assumption can be proved.
As described in chapter 5.5.5 there are two very important facts which have to be consid-
ered and mitigated:
(1) Diversity of fish species and size of fish population
(2) Animal protein intake of local people
If no measures are implemented the amount of fishes and fish species is strongly endan-
gered since spawning areas will be lost or not be reached anymore and the growing Lao
population will increase fishery.
To ensure the variety of fish species and the population of the fishes can be maintained
related measures should be considered. The operators of the hydropower plants should
be obliged to do continuous fish monitoring, share date and publish them. The Lao gov-
ernment should control fishery, implement fishery exclusion zones in the vicinity of hy-
dropower plants and provide alternatives, so fishery will not increase, although the local
For PNPCA O
nly

Luang Prabang HPP 1150002924 Cumulative and Transboundary Impact Assessment Report 68
Copyright © Pöyry Energy Ltd.
population will. The HPP operators should therefore be obliged to provide according sus-
tainable livelihood restoration for project affected people.
Pak Beng – Luang Prabang – Xayaburi: Cascade Impacts
All three plants are ROR who will not change the flow pattern. However Pak Peng HPP
has to use state of the art technology for fish migration and sediment transport, otherwise
the measures taken at LP HPP and Xayaburi are meaningless since migration will be
blocked further upstream and sediment will accumulate.
A close cooperation between the three operators is highly recommended. Information
about sediment flushes, spillway operation and fish migration shall be shared to minimize
environmental impacts and for a proper monitoring of fish migration behave and devel-
opment of the fish population etc.
6.2 Prediction of Transboundary Impacts
Hydrology
A transboundary impact from China to all the Mekong- downstream countries is given
by the operation of the storage power plants in the Lancang cascade. The operation cause
a flatter but wider hydrograph since peak flows are cut, but low flows increase (see Figure
5-14 and Figure 5-15). As a ROR- plant LP HPP is not affecting the hydrograph and has
no further hydrological effect to the downstream countries. Accordingly there is no hy-
drological impact to the Tonle Sap great lake system from LP HPP.
However a positive transboundary effect to be mentioned here is given from the Lancang
cascade to the Pak Beng-, Luang Prabang-, Xayaburi- cascade: Since the Lancang cas-
cade changed the flow pattern more water is released during dry months whereas the
spillway peaks are lower (see Figure 5-14). Therefore more energy can be produce in the
latter cascade in an average year.
Sediment Transport
The Lancang cascade causes a significant transboundary effect to all downstream coun-
tries concerning sediment transport as described in chapter 5.2.10. The Pak Beng, Luang
Prabang, Xayaburi run-of-river cascade will, for some time, slightly reduce sediment
transport until new equilibriums in their backwater areas are reached.
As described in chapter 5.2.10 the reduction of sediment transport due to the impound-
ment of the Manwan reservoir has immediately impacted the following approx. 800 km
downstream section. But further downstream (ca. 1,160 km), near Luang Prabang it took
over 3 years to recognize this effect. It is assumed that the buffer volumes from sediments
within the river compensated the impact during this time (CNR, 2013c).
The distance from LP HPP to Hueang confluence, where the Mekong reaches the Thai
border is approx. 330 km. It can be assumed that the phase with reduced sediment release
from LP HPP can be recognized in Thailand quite early.
For other downstream countries like Cambodia (more than 1,000 km downstream) and
Vietnam (more than 1,500 km downstream) the impact to sediment transport from this
run-of-river cascade is rather low. Main reductions is caused by the Langcang cascade
and the dams on the Mekong tributaries.
Fish and Fishery
For PNPCA O
nly

Luang Prabang HPP 1150002924 Cumulative and Transboundary Impact Assessment Report 69
Copyright © Pöyry Energy Ltd.
According to Poulsen et al [5] the upper fish migration system (see Figure 5-31) seems
to be relatively isolated, with little exchange between it and the other more south located
migration systems. It is therefore expected that the transboundary impact concerning the
fish migration is mainly affecting the upper migration system with migration towards
China and can hardly be measured in the south towards Thailand, Cambodia and Vi-
etnam.
For PNPCA O
nly

Luang Prabang HPP 1150002924 Cumulative and Transboundary Impact Assessment Report 70
Copyright © Pöyry Energy Ltd.
7 REFERENCES
[1] Welcomme, R., 1985: River Fisheries. FAO Fisheries Technical Paper No. 262.
330pp
[2] Chanh, S., C. K. Chhuon & J. Valbo-Jorgensen, 2001: Lateral migrations be-
tween Tonle Sap River and its flood plain. p. 102-111. In: Matics, K.I. Editor.
Proceedings from the Third Technical Symposium on Mekong Fisheries, 8-9
December 2000. Mekong Conference Series No. 1. Mekong River Commission,
Phnom Penh.
[3] MRC, 2002: Technical Paper No.8, Ann Bishop et al, Oct. 2002, Fish migrations
of the lower Mekong River basin: implications for development, planning and
environmental management.
[4] Welcomme, R., 2001: Inland Fisheries Ecology and Management. Fishing News
Books, Blackwell Science, Oxford. 358 pp.
[5] Poulsen, A.F., O. Poeu, S. Virvong, U. Suntornratana and N.T. Tung, 2002:
Deep pools as dry season fish habitats in the Mekong River Basin, MRC Tech-
nical Paper No. 4, Mekong River Commission, Phanom Penh. 22 pp.
[6] MRC, 2013: An introduction to the fisheries of Lao PRD. (Kent F. Hortle et al.).
[7] Pöyry, 2019: Preliminary ESIA, Luang Prabang HPP (March 2019)
[8] Draft Cumulative Impact Assessment Guidelines for Hydropower Projects in the
Lao PDR (Department of Environment and Social Impact Assessment (DESIA)
within the Ministry of Natural Resources and Environment (MONRE))
[9] MRC, 2017: Draft/Preliminary/Tentative Guidelines for Transboundary Envi-
ronmental Impact Assessment in the Lower Mekong Basin (Mekong River
Commission, 2017)
[10] IFC, 2013: Good Practice Handbook, Cumulative Impact Assessment and Man-
agement: Guidance for the Private Sector in Emerging Markets (International
Finance Corporation, 2013).
[11] Sangal B., 1983: Practical method of estimating peak flow. J Hydraulic Eng.
109:549–563
[12] Kummu, M., Tes, S., Yin, S., Adamson, P., Józsa, J., Koponen, J., Richey, J.,
and Sarkkula, J., 2014: Water balance analysis for the Tonle Sap Lake – flood-
plain system, Hydrol. Process., 28, 1722–1733,doi:10.1002/hyp.9718.
[13] Arias, M. E. et al., 2014: Dams on Mekong tributaries as significant contributors
of hydrological alterations to the Tonle Sap floodplaon in Cambodia, (Hydrol.
Earth Syst. Sci., 18. 5303-5315).
[14] Koehnken, L. 2014: Discharge Sediment Monitoring Project (DSMP), 2009–
2013: Summary & Analysis of Results, Final Report Mekong River Commis-
sion, Vientiane: Lao PDR.
[15] Gies, E., 2017: The real costs of energy. Nature 551(7682):S145-S147
For PNPCA O
nly

Luang Prabang HPP 1150002924 Cumulative and Transboundary Impact Assessment Report 71
Copyright © Pöyry Energy Ltd.
ANNEX
A) Used Literature concerning Sediment Transport within the Mekong
In Table 7-1 a list of the used literature is given (in chronological order of their publica-
tion date). For each of the listed literature the most relevant information is briefly sum-
marized in the subchapters below.
Table 7-1: Used literature upon sediment transport in Mekong River
Item Title Author Commissioner
/ Publisher
Date
1 Sediment-related impacts due to upstream reservoir trapping, the Lower Mekong River
Matti Kummu and Olli Varis
Elsevier Geomor-phology 85
10/2006
2 Hydrology & Sediment Base-line Assessment Working Pa-per - Volume II
ICEM - Internatio-nal Centre for En-vironmental Ma-
nagement
Mekong River Com-mission (MRC)
03/2010
3 The MRCS Xayaburi Prior Consultation Project Review Report
Annex 3 Review of Sediment Transport, Morphology, and Nutrient Balance
Sediment Expert Group
Mekong River Com-mission Secretariat
(MRCS)
03/2011
4 Changes in sediment load of the Lancang-Mekong River and its response to the hy-dro-power development
Liu et al. 4th International Conference on Es-tuaries and Coats,
Vietnam
10/2012
5 Assessment of Xayaburi dam impact on solid transporta-tion - Draft Final Report of Step 1
CNR ingénierie Dep. of Energy Business (EB) - En-
ergy Policy and Planning Dep. (EPP)
Ministry of Energy and Mines - LAO
PDR
02/2013
6 Characterization of grain-size distribution of Mekong River sediments (from Chiang Saen to Nong Khai)
CNR ingénierie Dep. of Energy Business (EB) - En-
ergy Policy and Planning Dep. (EPP)
06/2013
For PNPCA O
nly

Luang Prabang HPP 1150002924 Cumulative and Transboundary Impact Assessment Report 72
Copyright © Pöyry Energy Ltd.
Final Report Ministry of Energy and Mines - LAO
PDR
7 Assessment of Xayaburi dam impact on solid transporta-tion - Draft Final Report of Step 2
CNR ingénierie Dep. of Energy Business (EB) - En-
ergy Policy and Planning Dep. (EPP)
Ministry of Energy and Mines - LAO
PDR
12/2013
8 Discharge Sediment Monitor-ing Project (DSMP) 2009 – 2013 Summary & Analysis of Results
Final Report
L. Koehnken Mekong River Com-mission (MRC)
07/2014
9 Summary report of decision support for generating sus-tainable hydropower in the Mekong Basin - Draft 2
MRC Information & Knowledge In-formation Pro-gram (IKMP) &
Word Wide Fund for Nature (WWF)
Mekong River Com-mission Secretariat
(MRCS)
11/2014
B) Sediment-related impacts due to upstream reservoir trapping, the Lower Mekong River
(Kummu and Varis, 2006)
In this paper a lot of important basics upon the Mekong and its sediment regime are pre-
sented. And overview of hydrologic conditions along the river can be found in Figure 7-1
and a summary of various estimations of Mekong’s sediment transport rates from various
other studies is given in Table 7-2. It is mentioned that according to Gupta and Liew
(2007)4 unlike other large alluvial rivers in the Mekong upstream of Cambodia only little
sediment exchange between channel and floodplains occurs, meaning that most of the
sediment is stored inside the channel. Due to the lack of available bedload data for the
Mekong Basin this very important part of the sediment transport and the impact of dams
onto it could not be analysed within the paper.
From the data used within the study it can be seen, that there are relevant observation
data of suspended sediment concentration (SSC) and total suspended solids (TSS) for the
Chiang Sean and Luang Prabang station which were not available to Pöyry for the prep-
aration of this CIA / TBIA report. A more detailed list is given in Table 7-3. The original
analyses of these data done within the paper are given in Table 7-4 and Figure 7-2. They
show a clear reduction in suspended sediments by more than half at Chiang Saen station,
which is the first station downstream of the Chinese Lancang Cascade.
4 Gupta, A., Liew, S.C., 2007. The Mekong from satellite imagery: a quick look at a large river. Geomorphology 85, 259–
274
For PNPCA O
nly

Luang Prabang HPP 1150002924 Cumulative and Transboundary Impact Assessment Report 73
Copyright © Pöyry Energy Ltd.
Figure 7-1: Mean flows at selected sites in the Mekong mainstream
And an indication of the major tributaries and their contribution in each reach (Source: Kummu and Varis, 2006)
Table 7-2: Estimations of mean annual sediment transport rates in Mekong
(Source of compilation: Kummu and Varis, 2006)
For PNPCA O
nly

Luang Prabang HPP 1150002924 Cumulative and Transboundary Impact Assessment Report 74
Copyright © Pöyry Energy Ltd.
Table 7-3: Summary of the suspended sediment data
Availability in Lower Mekong Basin (Source: Kummu and Varis, 2006), relevant data for feasibility of LP HPP marked in red
Table 7-4: Water discharge, SSC and TSS concentrations and fluxes
In analyzed stations along the Lower Mekong River divided to pre-dam and post-dam periods (Source: Kummu and Varis, 2006
Figure 7-2: Suspended sediment fluxes in the Lower Mekong Basin,
before and after dam closure: averages from HYMOS (SSC) and WQMN (TSS) datasets (Source: Kummu and Varis, 2006)
For PNPCA O
nly

Luang Prabang HPP 1150002924 Cumulative and Transboundary Impact Assessment Report 75
Copyright © Pöyry Energy Ltd.
C) Hydrology & Sediment Baseline Assessment Working Paper - Volume II (ICEM for
MRC, 2010)
This report emphasizes the existing uncertainties on the available sediment data at Me-
kong River. It is explained that according to Walling (2005)5 measurements of suspended
sediment concentration (SSC) are more useful for estimating sediments loads than meas-
urements of total suspended solids (TSS). It is also mentioned that according to USGS
(2000)6 TSS is an inappropriate indicator of sediment load when there is more than 25%
of sand size materials. An error bar of approx. 20-30% is recommended for the interpre-
tation of SSC data.
Based on the time for which sediment measurement data is available, the following dif-
ferentiation according the Lancang catchment is made:
1960-1990 (land clearing): Period of population growth, intensification of land
clearing, deforestation and agricultural expansion (Wang et al, 20097; Walling,
20098; MRC, 20079)
1990-2000 (hydropower development): introduction of mainstream hydropower
on the Lancang River (construction and operation of Manwan dam)
2000-2010 (hydropower escalation & soil conservation): intensification of main-
stream hydropower and introduction of soil conservation strategies under Chinese
governments “Green for Grain” program (Walling, 200910)
The sediment load from the Upper Mekong Basin is estimated with 85 Mt/y which cor-
responds to 50% of total sediment load in the Mekong. When the complete Lancang Cas-
cade is in operation the total annual sediment load that enters Chiang Saen is estimated
to reduce to 15-17 Mt/y. The mean annual sediment load of Nam Ou is stated to be at
approx. 6.2 Mt/y.
For Ang Ngay Pool which is located north of Vientiane a bed load proportion of 1% of
the total sediment load is estimated, which corresponds with 1 Mt/yr. The reduction of
bedload inflow due to the Lancang Cascade is expected to be nearly 100% and this will
lead to erosion of in-channel storage zones. The effects are expected to become noticeable
within just a few water seasons in the sections neighboured downstream to the Lancang
Cascade but it will take several decades to reach sections near Vientiane.
5 Walling, D.E. 2005: Evaluation and analysis of sediment data from the lower Mekong River. Mekong River Commis-
sion, Vientiane. September 2005 6 USGS 2000: Comparability of SSC and TSS Solids Data, available at: https://water.usgs.gov/osw/pubs/WRIR00-
4191.pdf 7 Wang, J.J., Lu, X.X., Kummu, M. 2009: Sediment load estimates and variations in the Lower Mekong River, River and
Research & Applications, 2009 John Wiley & Sons 8 Walling, D.E. 2009: The Mekong River: Ch6 the Sediment Load of the Mekong River. Elsevier Inc 9 MRC 2007: Annual Mekong Flood Report, Mekong River Commission, Vientiane 84pp 10 See footnote 8
For PNPCA O
nly

Luang Prabang HPP 1150002924 Cumulative and Transboundary Impact Assessment Report 76
Copyright © Pöyry Energy Ltd.
Figure 7-3: Some estimates of sediment load at Chiang Saen:
pre and post Manwan (Source: ICEM, 2010)
Figure 7-4: Average annual mainstream sediment load (Source: ICEM, 2010)
For PNPCA O
nly

Luang Prabang HPP 1150002924 Cumulative and Transboundary Impact Assessment Report 77
Copyright © Pöyry Energy Ltd.
Figure 7-5: Comparison of pre- and post-Manwan dam TSS concentrations
at Chiang Saeng (top) and Luang Prabang (bottom), by Adamson, 2009b
For PNPCA O
nly

Luang Prabang HPP 1150002924 Cumulative and Transboundary Impact Assessment Report 78
Copyright © Pöyry Energy Ltd.
D) The MRCS Xayaburi Prior Consultation Project Review Report - Annex 3 Review of
Sediment Transport, Morphology, and Nutrient Balance (SEG for MRCS, 2011)
In this report estimation of the relative sediment contribution from the main source areas
are given:
45% originate from upstream Chinese border
5% originate from the section between Chinese border and Pak Chom (Laotian-
Thai-border, approx. 100 km upstream Vientiane)
50% originate from Pak Chom to Delta
As natural sediment yield of the complete Mekong Basin a value of 160 Mt/yr is assumed
in the study which is based on Walling, 200511 and Kummu and Varis, 200612.
A slightly different distribution and also alternative estimations upon Mekong’s total sed-
iment load are given in the report (Table 7-5).
Table 7-5: Assumed sediment yield from principal sediment sources
in the Mekong River Basin for purposes of assessing transboundary effects (Source: MRCS, 2011)
Based on different hydropower development scenarios (dam projects on main river and
tributaries in China and Lao PDR) the sediment and morphological impacts have been
assessed in the study. For these scenarios the trapped and passed-through sediment
amounts were estimated. The results of the study’s assessment clearly indicate that for
11 Walling, D.E., (2005). Evaluation and analysis of sediment data from the Lower Mekong River, Report prepared for
the Mekong River Commission. 12 Kummu, M. and Varis, O. 2006. Sediment-related impacts due to upstream reservoir trapping, the Lower Mekong
River. Geomorphology, 85: 275-293.
For PNPCA O
nly

Luang Prabang HPP 1150002924 Cumulative and Transboundary Impact Assessment Report 79
Copyright © Pöyry Energy Ltd.
the today’s status of already completed Chinese dams13 no sediment passes through the
Lancang Cascade. If there are no active sediment management measures in place (or pos-
sible) which try to improve the longitudinal sediment continuity this situation will last
for a very long time period because of the enormous storage capacity of the Chinese dams
(Table 7-6). Further considerations within the MRCS study postulate an estimated sedi-
ment input reduction downstream the Chinese dams of about 90-100% which corresponds
to a load reduction of 61.3-69.0 Mt/y.
Table 7-6: Estimated indicative times for reservoirs
in the Chinese cascade to fill with sediment (Source: MRCS, 2011)
E) Changes in sediment load of the Lancang-Mekong River and its response to the hydro-
power development (Liu et al, 2012)
This paper postulates mean annual sediment loads for various stations along the Mekong
River as follows (estimated for time period 1962-2003):
Gajiu (15 km D/S Manwan dam) 38.0 Mt/y
Chiang Saen 90.8 Mt/y
Luang Prabang 107.7 Mt/y
Nong Khai (near Vientiane) 85.4 Mt/y
Mukdahan 111.4 Mt/y
Khong Chiam 144.7 Mt/y
Opposite to other publications the effect of Chinese Lancang Cascade for Chiang Seng
and downstream sections is classified as insignificant and that the sediment reduction
caused by Manwan Dam does not extend beyond Chiang Saen. Reasons therefore are
additional sediment inputs from tributaries and also riverbed erosion in the section down-
stream Manwan Dam as well as increased soil erosion due to artificial economical forest
plantation.
13 Based on information from 2013 given on www.internationalrivers.org the following 6 Chinese dams are completed on
the Lancang Cascade (Mekong): Gongguoqiao, Xiaowan, Manwan, Dachaoshan, Nuozhadu and Jinghong
For PNPCA O
nly

Luang Prabang HPP 1150002924 Cumulative and Transboundary Impact Assessment Report 80
Copyright © Pöyry Energy Ltd.
An average annual sediment load of 145 Mt/y that is reaching the South Chinese Sea is
estimated in the paper but for the foreseen future a reduction of this value to 90-120 Mt/y
is roughly assumed.
F) Assessment of Xayaburi dam impact on solid transportation - Draft Final Report of
Step 1 (CNR for Lao PDR, 2013a)
In this report - based on various other sources - the actual annual sediment load at Xaya-
buri Dam is given with approx. 105 Mt/y and an inter-annual variation range of 50-
135 Mt/y. Furthermore for the next 20-30 years a decrease of the incoming sediment load
at Xayaburi reservoir is estimated to the following values:
30-40 Mt/y considering existing reservoirs in 2010, i.e. Manwan, Dachaoshan and
Jinghong
10-20 Mt/y considering existing reservoirs and planned sub-basin reservoirs as
well as planned mainstream reservoirs at Upper Mekong Basin.
1-5 Mt/y considering existing reservoirs and all planned reservoirs for sub-basins
and Mekong mainstream.
G) Characterization of grain-size distribution of Mekong River sediments (from Chiang
Saen to Nong Khai) - Final Report (CNR for Lao PDR, 2013b)
The report was done for the Xayaburi HPP project and delivers morphological character-
istics of the Mekong River for the section near Chiang Saen (km 2,365) to Ban Mak Nao
(km 1,520).
For PNPCA O
nly

Luang Prabang HPP 1150002924 Cumulative and Transboundary Impact Assessment Report 81
Copyright © Pöyry Energy Ltd.
Figure 7-6: Overview of field survey perimeter for the study
(Source: CNR, 2013b)
The project area of LP HPP is within the so-called “river unit 4” of that study, which goes
from Ban Nam Tin (km 2,291) to Pak Ou (km 2,033), and it is described as follows:
Near-straight channel bounded by sharp bends
Deeply cut in bedrock in a narrow valley with steep highlands
Sediment deposits are mainly composed of sand accumulated around emerged
rocky outcrops and in depressions along the banks
Sediment supply through tributaries Nam Tha and Nam Beng
River width is between 50-100 m for low flow conditions, and 200-300 m at bank
full discharge
Channel slope is between 0.25-0.30 m/km
The information regarding the section downstream of the Pak Ou is that relevant sediment
inputs are present due to the tributaries Nam Ou, Nam Xuang and Nam Khan and that
sediment gets deposited because of a reduced channel slope of approx. 0.10-0.15 m/km.
Because of the rock incised river bed in the Luang-Prabang project area depositions occur
more or less only at emerged banks and natural basins. The results of the granulometric
analyses for the d50 are given in Figure 7-7.
For PNPCA O
nly

Luang Prabang HPP 1150002924 Cumulative and Transboundary Impact Assessment Report 82
Copyright © Pöyry Energy Ltd.
Figure 7-7: Longitudinal distribution
of d50 along survey area (Source of diagram: CNR, 2013b), LP HPP reservoir section marked in blue
H) Assessment of Xayaburi dam impact on solid transportation - Draft Final Report of
Step 2 (CNR for Lao PDR, 2013c)
That report contains some important descriptions on how sediment inputs have been es-
timated:
Washload (uniform suspension) => WQMN data from MRCS, daily sediment
discharges estimated via calibrated sediment-rating curves
Suspended sand (graded suspension) => field survey data at the dam site from
2012-2013, annual load is estimated out of sediment rating curve and flow-dura-
tion curve
Bedload => calculated by 2 different transport formulas (MPM from 1948 and
Camenen and Larson from 2005), annual load is estimated by applying these for-
mulas onto the flow-duration curve
Some of the main findings are that:
Due to the presence of the Lancang reservoirs there is a strong decrease in
washload leading to a large proportional increase of bed materials (suspended
sand and bedload) onto the total sediment load
The impact onto the bed materials is supposed to be even higher but compensated
for the moment, due to tributary supplies and huge in-channel stocks that delay
the visible impact on sediment transportation and river morphology
Luan
g P
rab
ang
pro
ject
are
a
For PNPCA O
nly

Luang Prabang HPP 1150002924 Cumulative and Transboundary Impact Assessment Report 83
Copyright © Pöyry Energy Ltd.
It is quite probable that the sediment load at Xayaburi is strongly decreasing
within the very next years
Table 7-7: Plausible evolution of the sediment inputs
at Xayaburi reservoir inlet considering hypotheses on the sedimentary impact of dams likely to be built further upstream (Source: CNR, 2013c)
I) Discharge Sediment Monitoring Project (DSMP) 2009 – 2013 Summary & Analysis of
Results - Final Report (Koehnken for MRC, 2014)
For the DSMP per year 34 measurements of discharge and suspended sediments were
taken at 15 different locations along the Lower Mekong River. In the monitoring period
from 2009 to 2013 a very wet year (2011) and also dry years (2010 and 2012) occurred.
The frequency of the measurements was seasonally variable and had been intensified
during wet season (Table 7-8).
Table 7-8: Summary of monitoring frequency for discharge,
suspended sediment (SSC), sediment grain-size (SGSA) and bedload sampling (Source: Koehnken, 2014)
For the stations Chiang Saen and Luang Prabang (amongst others) the following data was
collected:
Depth Integrated Suspended Sediment (SSC = suspended sediment concentration)
Sediment Grain Size Analysis (SGSA)
Bedload (for Chiang Saen only)
Discharge
For PNPCA O
nly
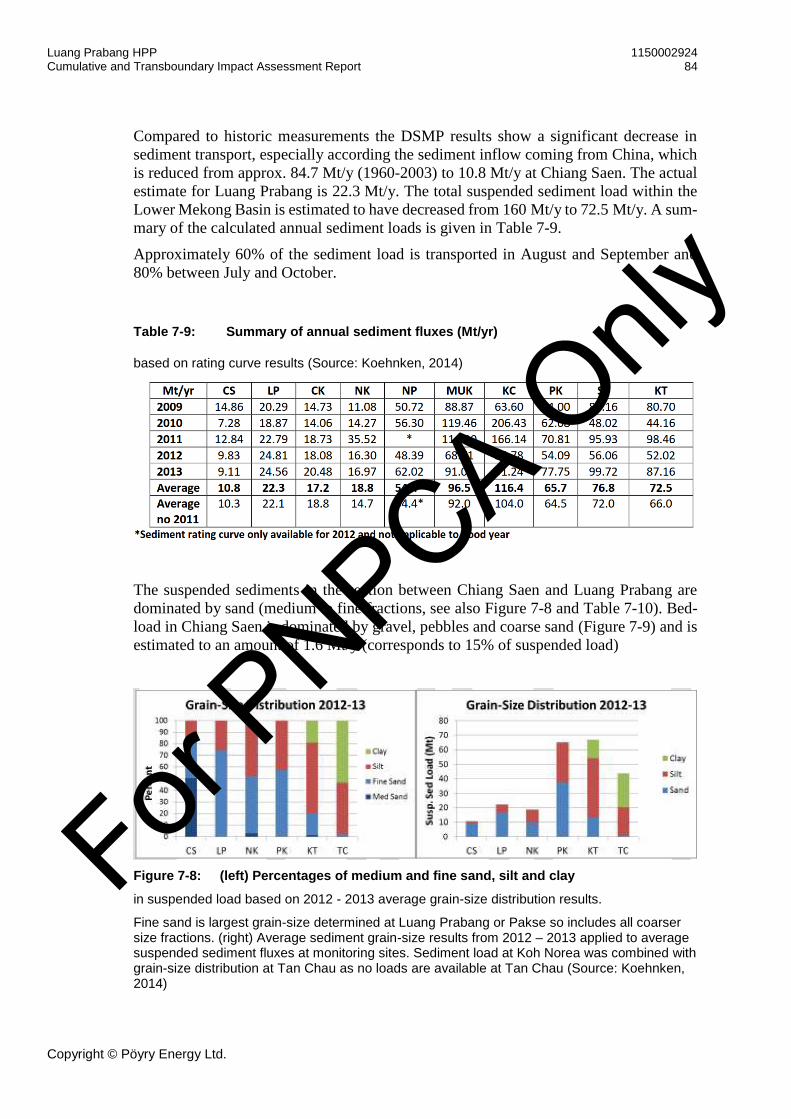
Luang Prabang HPP 1150002924 Cumulative and Transboundary Impact Assessment Report 84
Copyright © Pöyry Energy Ltd.
Compared to historic measurements the DSMP results show a significant decrease in
sediment transport, especially according the sediment inflow coming from China, which
is reduced from approx. 84.7 Mt/y (1960-2003) to 10.8 Mt/y at Chiang Saen. The actual
estimate for Luang Prabang is 22.3 Mt/y. The total suspended sediment load within the
Lower Mekong Basin is estimated to have decreased from 160 Mt/y to 72.5 Mt/y. A sum-
mary of the calculated annual sediment loads is given in Table 7-9.
Approximately 60% of the sediment load is transported in August and September and
80% between July and October.
Table 7-9: Summary of annual sediment fluxes (Mt/yr)
based on rating curve results (Source: Koehnken, 2014)
The suspended sediments in the section between Chiang Saen and Luang Prabang are
dominated by sand (medium to fine fractions, see also Figure 7-8 and Table 7-10). Bed-
load in Chiang Saen is dominated by gravel, pebbles and coarse sand (Figure 7-9) and is
estimated to an amount of 1.6 Mt/y (corresponds to 15% of suspended load)
Figure 7-8: (left) Percentages of medium and fine sand, silt and clay
in suspended load based on 2012 - 2013 average grain-size distribution results.
Fine sand is largest grain-size determined at Luang Prabang or Pakse so includes all coarser size fractions. (right) Average sediment grain-size results from 2012 – 2013 applied to average suspended sediment fluxes at monitoring sites. Sediment load at Koh Norea was combined with grain-size distribution at Tan Chau as no loads are available at Tan Chau (Source: Koehnken, 2014)
For PNPCA O
nly

Luang Prabang HPP 1150002924 Cumulative and Transboundary Impact Assessment Report 85
Copyright © Pöyry Energy Ltd.
Table 7-10: Sediment budget for sand, silt and clay
in the LMB based on the average annual sediment loads (from rating curves) and average grain-size distribution results for the sites (Source: Koehnken, 2014)
Figure 7-9: Bedload monitoring results for Chiang Saen.
Graph on left shows grain-size distribution of bedload on each monitoring date; graph on right
applies grain-size distribution results to calculated bedload loads and shows discharge on sam-
pling days (Source: Koehnken, 2014)
According to the DSMP the sediment rating curves for Chiang Saen and Luang Prabang
are steep compared to further downstream stations. Both curves are quite similar up to
flows of approx. 5,000 m³/s. The derived sediment rating curves are shown in Figure
7-11.
For PNPCA O
nly
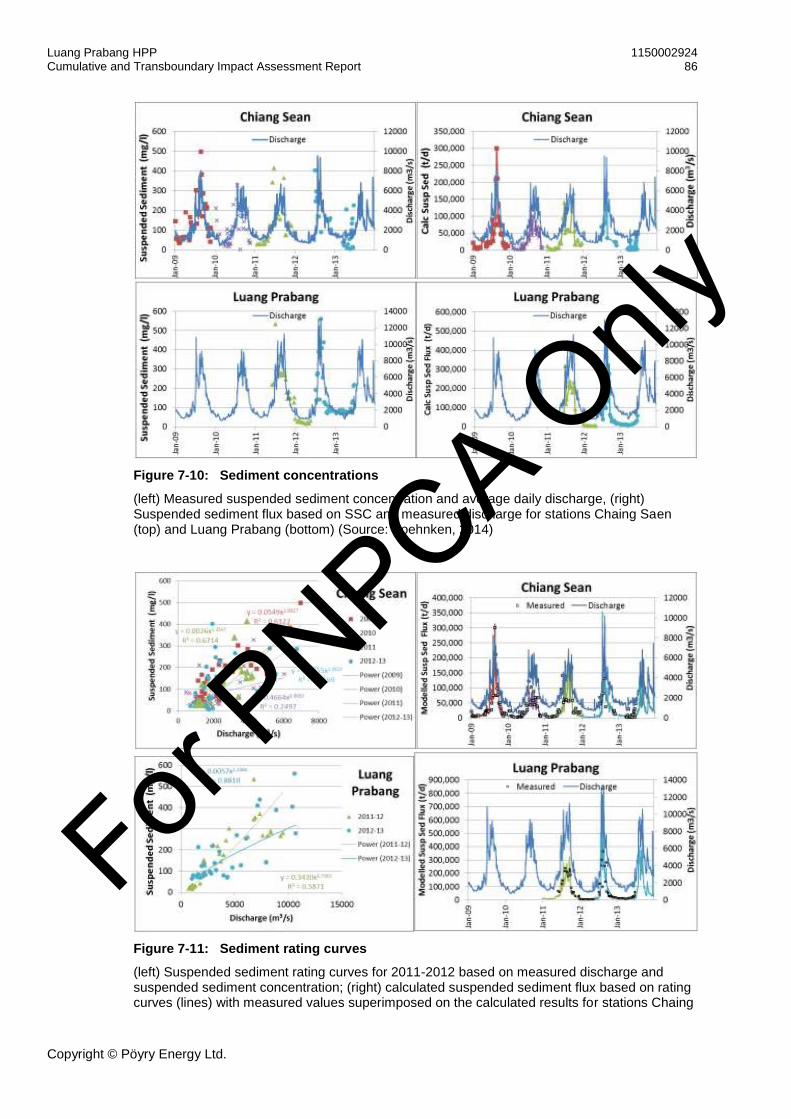
Luang Prabang HPP 1150002924 Cumulative and Transboundary Impact Assessment Report 86
Copyright © Pöyry Energy Ltd.
Figure 7-10: Sediment concentrations
(left) Measured suspended sediment concentration and average daily discharge, (right) Suspended sediment flux based on SSC and measured discharge for stations Chaing Saen (top) and Luang Prabang (bottom) (Source: Koehnken, 2014)
Figure 7-11: Sediment rating curves
(left) Suspended sediment rating curves for 2011-2012 based on measured discharge and suspended sediment concentration; (right) calculated suspended sediment flux based on rating curves (lines) with measured values superimposed on the calculated results for stations Chaing
For PNPCA O
nly

Luang Prabang HPP 1150002924 Cumulative and Transboundary Impact Assessment Report 87
Copyright © Pöyry Energy Ltd.
Saen (top) and Luang Prabang (bottom), discharge shown on right axis (Source: Koehnken, 2014)
J) Summary report of decision support for generating sustainable hydropower in the Me-
kong Basin - Draft 2 (IKMP & WWF for MRCS, 2014)
That report gives an updated estimate on the total suspended sediment load of approx.
72 Mt/y, which is a huge reduction to former estimates of up to 160 Mt/y. Main reason
for this reduction is the capture of sediment in the Lancang Cascade and also in various
tributary dams.
For Chiang Saen a proportion of up to 85% (9.2 Mt/y) of the suspended load is stated as
sand size material, which may be transported as bedload as well as suspended load de-
pending on the size and time phase of a flood. It is assumed that much of the previously
described imbalances in the sediment budget of the Mekong may be addressed to the
phenomena that sand is transported via different mechanisms in different reaches.
In comparison to historic findings a substantial decrease of suspended sediment concen-
trations and suspended sediment loads has been found (Table 7-11). The average annual
sediment load at Chiang Saen has reduced from approx. 85 Mt/yr to approx. 11 Mt/yr.
Chinese inflow of suspended sediment has decreased from 55% to 16%. The sediment
inflow from the reach between Chiang Saen and Luang Prabang is estimated to 12 Mt/yr,
which corresponds to approx. 17% of the actual total sediment load in Mekong River.
The sediment load in this section is characterised by sand (suspended) and also gravels
(bedload) and so there is the potential that this coarser material will be trapped by planned
hydropower dams.
Table 7-11: Average annual suspended sediment loads (Source: IKMP & WWF, 2014)
The main findings of an assessment upon the sediment transport processes done by the
WWF are also summarized within the report. According to them no evidence of uniform
suspension was found in the steep reaches of Mekong. Furthermore sand was also found
in historic levees “which raises questions about the previously suggested theory that sand
is a recent phenomenon in the river associated with land use may not be accurate”.
Changes of transport processes between bedload, graded suspension and uniform suspen-
sion can lead to variability in suspended sediment concentrations and seems to be the
reason for “imbalance” in sediment loads if for example only suspended sediment is con-
sidered. In the relevant section for LP HPP the following results are given:
Silt and clay is transported as wash load (as it is also for the whole Lower Me-
kong), and only very little amounts are deposited
Sand is transported as graded suspension (during flood peaks) and also as bedload
(at rising and receding flood conditions)
For PNPCA O
nly

Luang Prabang HPP 1150002924 Cumulative and Transboundary Impact Assessment Report 88
Copyright © Pöyry Energy Ltd.
Cobbles and gravel is transported as bedload
An overview of the results of sediment measurements carried out from September to Oc-
tober 2012 is also presented in the report (Table 7-12 and Table 7-13).
Table 7-12: Summary of field measurements and grain-size analyses
(Source: IKMP & WWF, 2014)
Table 7-13: Summary of bedload transport estimates based on field measurements
(Source: IKMP & WWF, 2014)
The outcomes of a study on sand and gravel mining in the Lower Mekong are summarized
within the study. The most relevant are:
Upstream of Vientiane only very limited volumes are extracted (87,000 m³ of
sand, no gravel and 7,000 m³ of cobbles)
The highest amounts of sediment extraction is done in Cambodia (~ 60%)
The revised sediment budget for Mekong River based on the findings of the report is
given in Table 7-14.
Table 7-14: Summary of sediment transport estimates in the Mekong
(Source: IKMP & WWF, 2014)
For PNPCA O
nly

Luang Prabang HPP 1150002924 Cumulative and Transboundary Impact Assessment Report 89
Copyright © Pöyry Energy Ltd.
K) Hydraulic Continuity Equation
For a defined part in the river with no tributaries the following law occurs:
𝑄1 = 𝑄2
with means the flow in section 1 is equal to the flow in section 2 when there is no con-
fluence and no outflow in this part of the river. Since the flow is defined as velocity
times flown area the following equation can be postulated:
𝑄1 = 𝑣1 ∙ 𝐴1 = 𝑄2 = 𝑣2 ∙ 𝐴2
If the velocity in section 1 is smaller than the velocity in section 2 that means that the
flown area is accordingly bigger in section 1 than in section 2.
For PNPCA O
nly