onstruction activity still rising but material costs and
TRANSCRIPT

RICS Economics
• Construction output rising in Europe, the Americas and MEA, but growth seems to have stalled in APAC• Energy and ICT remain the fastest growing areas of infrastructure• No real indication that material shortages and cost inflation pressures are easing
Q3 2021: Global Construction Monitor
C onstruction activity still rising but material costs and shortages are hindering expansion
*The Global Construction Activity Index is a weighted composite measure encompassing variables on current and expected market activity as well as margin pressures.
0
10
20
30
40
50
60
70
Americas APAC Europe MEA
Private residential
Private non-residential
Infrastructure
Net balance %
Chart 2: 12-month workload expectations
The Q3 2021 RICS Global Construction Monitor (GCM) results are consistent with a continued expansion across the market, with feedback on workloads positive (to a greater or lesser degree) across all sectors at the aggregate level. That said, momentum does appear to have eased somewhat across infrastructure globally, although expectations remain firmly positive regarding the outlook over the coming twelve months. Meanwhile, pressures around material costs and shortages have shown little sign of moderating during Q3, with 83% and 66% of respondents respectively still highlighting these issues as impediments.
Construction Activity Index moderates slightlyAt a global level, the headline Construction Activity Index (CAI) moderated a touch, to post a reading of +18 compared with +25 in the previous report. Although still comfortably in positive territory and therefore consistent with another uptick in activity, momentum does appear to have softened slightly during Q3. Looking at the regional data (shown in Chart 1), it is clear this moderation was almost entirely driven by Asia Pacific. Indeed, the latest CAI reading in APAC eased noticeably to +3 from a figure of +21 in Q2. As such, this measure is now signalling a flat trend across the region, with a sharp deceleration evident in China amid a broader slowdown in economic growth across the country in Q3.
By way of contrast, the CAI picked up to +18 in MEA (from +8 previously), suggesting the recovery in construction output is gaining further traction across the region. Meanwhile, both the Americas and Europe returned CAI readings that were more or less unchanged from Q2, and still indicative of solid output growth over the quarter.
In terms of the country level results (illustrated on Chart 4 on page 2), Saudi Arabia, the Netherlands, Ireland and Canada all display among the most positive Q3 CAI readings, with growth seemingly accelerating in each instance. At the other end of the spectrum, feedback remains downbeat across Malaysia, Singapore and Sri Lanka, with headline construction workloads still exhibiting rather subdued trends in each instance.
All sectors expected to deliver a rise in output over the next twelve monthsAt the global level, twelve-month workload expectations are firmly positive across all sectors. Still leading the way, a net balance of +49% of respondents foresee a rise in infrastructure output, albeit this is a little less elevated than the reading of +57% back in Q2. Alongside this, the latest net balances stand at +34% for private residential workloads and +32% across the private non-residential sector. Shown
-50
-40
-30
-20
-10
0
10
20
30
40
Q2 2020 Q3 2020 Q4 2020 Q1 2021 Q2 2021 Q3 2021
Americas Asia Pacific Europe Middle East & Africa
Chart 1: Construction Activity Index*
Survey responses were supported by the following organisations:

2
Q3 2021: Global Construction Monitor
© RICS Economics 2021 Q3 2021
rics.org/economics
Chart 4: Construction Activity Index by country
in Chart 2, the private residential sector across Europe returned the strongest expectations (net balance +59%). In fact, respondents across virtually all European nations covered by the Monitor are anticipating a further robust rise in residential workloads in the year to come. Elsewhere, the infrastructure sector is the front runner in terms of expected growth across the Americas, APAC and MEA. That said, expectations have been pared back across APAC regarding the private residential and commercial sectors, with the latest net balances softening to +12% and +15% respectively (from +41% and +34% beforehand). Conversely, across MEA, respondents upgraded their projections during Q3 for output growth in the private non-residential and infrastructure categories.
Employment outlook continues to improveGlobally, a net balance of +31% of survey participants envisage a pick-up in employment levels across the construction industry over the next year. This indicator has consistently improved of late, rising from readings of +27% and +18% in Q2 and Q1 respectively. When disaggregated by country, Chart 6 on the next page demonstrates that headcounts are anticipated to rise across the vast majority of nations covered, with only Malaysia and Singapore displaying outright negative expectations. Looking at the areas with the strongest employment outlook, respondents across Saudi Arabia, the Netherlands and Germany appear most confident that headcounts will increase over the next twelve months, with projections being upgraded over the quarter.
Pressures around material costs remain acute Almost identical to the Q2 results, 83% of respondents worldwide continue to cite material costs as a factor holding back activity (Chart 3). Alongside this, 66% of contributors point to material shortages as an impediment to construction activity (up marginally on 65% last time). Moreover, projections for growth in total construction costs over the next year remain at approximately 7% (more or less unchanged from Q2), with the increase expected to comfortably outstrip growth in tender prices (3.5%). For material cost forecasts, there was at least a marginal easing in the expected rate of inflation, with Q3
-60
-40
-20
0
20
40
60 Index
0
10
20
30
40
50
60
70
80
90
Q2 2021 Q3 2021
% share of respondents
Chart 3: Factors holding back activity
projections coming in at 7.4% compared with 8.2% in Q2.
SustainabilityIn an extra question included in this quarter’s Monitor, respondents were asked for their opinions on whether or not investor focus has shifted towards building designs that are energy efficient and carbon neutral over the past two years. The results show that around 35% of respondents globally believe that such designs are increasingly viewed as an attractive form of investment when compared with 2 years ago. At the regional level, Europe appears to be leading the way, with the share reporting this trend coming in noticeably higher, at 44%.
Less encouragingly however, when asked to what extent the impact on biodiversity is taken into account when designing, planning and managing projects, the majority of respondents say that biodiversity is being measured on less than 50% of construction projects at present.

3
Q3 2021: Global Construction Monitor
© RICS Economics 2021 Q3 2021
rics.org/economics
Chart 5: Current and expected workloads
Australia
Bahrain
Canada
China
France
Germany
Hong Kong
India
Ireland
Italy
Kuwait
Malaysia
Mauritius
Netherlands
New Zealand
Nigeria
Oman
Philippines
Poland
Qatar
Saudi Arabia
Singapore
South Africa
Spain
Sri Lanka
Switzerland
UAE
UK
USA
-20
0
20
40
60
80
100
-80 -60 -40 -20 0 20 40 60
Expe
ccte
d he
adco
unt,
next
12
mon
ths
(Net
bal
ance
, %)
Total headcount, past 3 months (Net balance, %)
Chart 6: Current and expected headcounts
Australia
Bahrain
Canada
ChinaFrance
GermanyHong Kong
India
Ireland
Italy
Kuwait
Malaysia
Mauritius
Netherlands
New Zealand
Nigeria
Oman
Philippines
Poland
Qatar
Saudi Arabia
Singapore
South Africa
SpainSri Lanka
Switzerland
UAE
UK
-20
0
20
40
60
80
100
-60 -40 -20 0 20 40 60 80Expe
ccte
d to
tal w
orkl
oads
, nex
t 12
mon
ths
(Net
ba
lanc
e, %
)
Total workloads, past 3 months (Net balance, %)
4
Q3 2021: Global Construction Monitor
© RICS Economics 2021 Q3 2021
rics.org/economics
0
1
2
3
4
5
6
7
8
9
Tenders Prices Construction Costs Materials Costs Skilled LabourCosts
Unskilled LabourCosts
Canada
US
%
Chart 3: Tender prices and costs - 12-month expectations
North America: Strong growth in infrastructure to drive construction activity
0
10
20
30
40
50
60
70
80
90
100
CanadaUS
% of respondents
Chart 2: Factors holding back activity
0
10
20
30
40
50
60
70
80
Private Resi Private Non-Resi Infrastructure Private Resi Private Non-Resi Infrastructure
CurrentExpected
Canada US
Net balance %
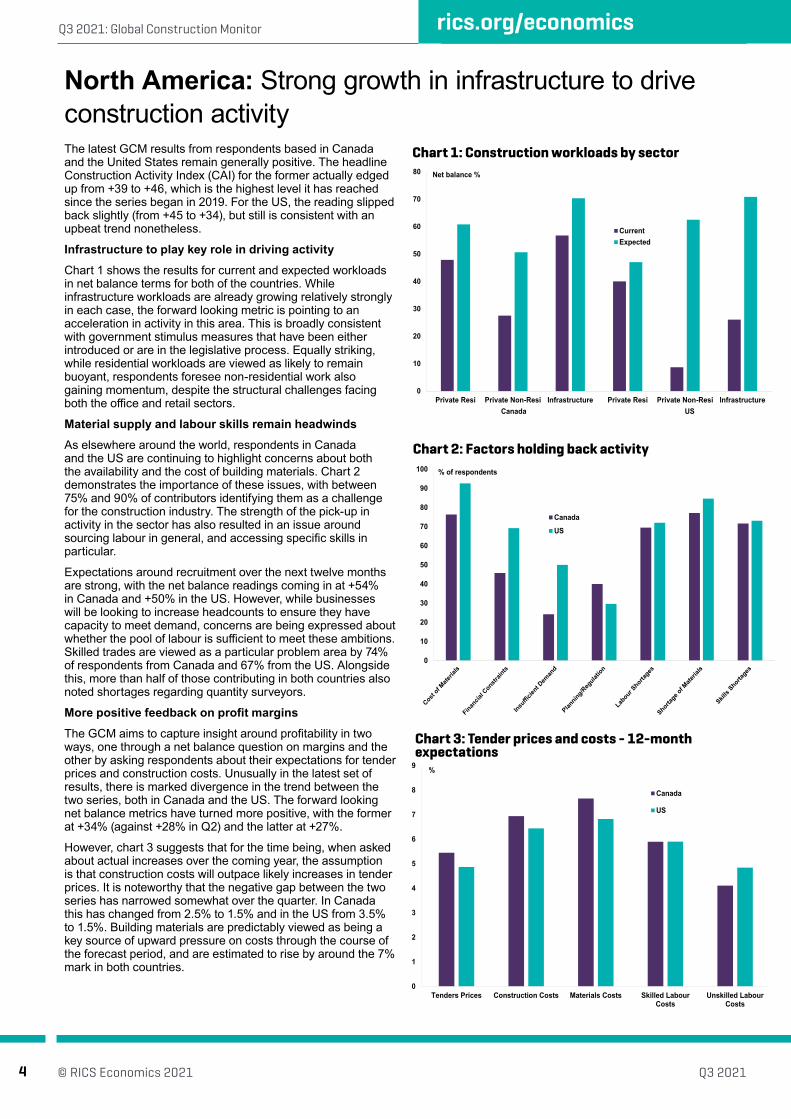
Chart 1: Construction workloads by sectorThe latest GCM results from respondents based in Canada and the United States remain generally positive. The headline Construction Activity Index (CAI) for the former actually edged up from +39 to +46, which is the highest level it has reached since the series began in 2019. For the US, the reading slipped back slightly (from +45 to +34), but still is consistent with an upbeat trend nonetheless.
Infrastructure to play key role in driving activityChart 1 shows the results for current and expected workloads in net balance terms for both of the countries. While infrastructure workloads are already growing relatively strongly in each case, the forward looking metric is pointing to an acceleration in activity in this area. This is broadly consistent with government stimulus measures that have been either introduced or are in the legislative process. Equally striking, while residential workloads are viewed as likely to remain buoyant, respondents foresee non-residential work also gaining momentum, despite the structural challenges facing both the office and retail sectors.
Material supply and labour skills remain headwindsAs elsewhere around the world, respondents in Canada and the US are continuing to highlight concerns about both the availability and the cost of building materials. Chart 2 demonstrates the importance of these issues, with between 75% and 90% of contributors identifying them as a challenge for the construction industry. The strength of the pick-up in activity in the sector has also resulted in an issue around sourcing labour in general, and accessing specific skills in particular.
Expectations around recruitment over the next twelve months are strong, with the net balance readings coming in at +54% in Canada and +50% in the US. However, while businesses will be looking to increase headcounts to ensure they have capacity to meet demand, concerns are being expressed about whether the pool of labour is sufficient to meet these ambitions. Skilled trades are viewed as a particular problem area by 74% of respondents from Canada and 67% from the US. Alongside this, more than half of those contributing in both countries also noted shortages regarding quantity surveyors.
More positive feedback on profit marginsThe GCM aims to capture insight around profitability in two ways, one through a net balance question on margins and the other by asking respondents about their expectations for tender prices and construction costs. Unusually in the latest set of results, there is marked divergence in the trend between the two series, both in Canada and the US. The forward looking net balance metrics have turned more positive, with the former at +34% (against +28% in Q2) and the latter at +27%.
However, chart 3 suggests that for the time being, when asked about actual increases over the coming year, the assumption is that construction costs will outpace likely increases in tender prices. It is noteworthy that the negative gap between the two series has narrowed somewhat over the quarter. In Canada this has changed from 2.5% to 1.5% and in the US from 3.5% to 1.5%. Building materials are predictably viewed as being a key source of upward pressure on costs through the course of the forecast period, and are estimated to rise by around the 7% mark in both countries.

5
Q3 2021: Global Construction Monitor
© RICS Economics 2021 Q3 2021
rics.org/economics
Regional Comments from Survey Participants in North AmericaCanadaSupply of materials and good quality labour - Barrie
It is a SubTrades market right now. Some SubTrades are filled up for next year and are not bidding. - Cambridge
Pandemic. - Edmonton
Climate change policies. - Edmonton
Worldwide delays in manufacturing are impacting lead times with real estate demand. - Halifax
Potential large amount of infrastructure projects may affect contractor capacity. - Hamilton
Price of material, shortage of skilled worker, bad RFP requesting too many RFIs, too many assumption. - Kelowna
Shortage of qualified residential renovation general contractors. - Mississauga
Manque de beton et acier (Lack of concrete and steel). - Montreal
Delays in manufacturing of steel and related supply chain. - Ottowa
The balance of cost, availability of trades and materials are dictating the construction method. - Simcoe County & Muskoka
Logistics, lack of lands, lack of investors. - Toronto
Supply chain, huge demand on trades creating price escalation and volatiliy. - Toronto
Government investment coming out of COVID impact on economy. - Toronto
Significant shortage of skilled and unskilled labour. - Toronto
Lack of sufficient skilled labour is extending schedule durations. - Toronto
Persistent supply chain and labour issues continue to cause pricing instability. - Vancouver
COVID pandemic has impacted material costs, freight costs and schedule delivery. - Vancouver
Covid has significantly affected supply chains causing shortages of materials, 20-50% increase time. - Winnipeg
Covid 19 still is a factor. Contractors are busy however and so am I. Lots of school work here. - Winnipeg
United StatesProposed governemnt spending will create inflation pressures for construction that cannot be managed. - Houston
We are seeing a growth in plants that focus on Electric vehicles and recycling. - Houston
Covid still impacting short and long term planning. - Lancaster
Hiring competition - between those mandating a return to office and those employing a hybrid policy. - Los Angeles
Pandemic impact; changes in workplace - New York
Covid-19 resurgent. - Orlando
No major infrastructure developments - Orlando
Lifting of COVID-19 restrictions. - Portland
Rising materials cost and supply chain disruptions. - San Francisco
Stagflation likely to be out of control. Out of control US Federal debt. - Washington

6
Q3 2021: Global Construction Monitor
© RICS Economics 2021 Q3 2021
rics.org/economics
0
20
40
60
80
100
Q3 Q2
% of respondents
Chart 3: Factors holding back activity
Asia Pacific: Current workload trend moderates but expectations remain more resilient
0
10
20
30
40
50
60
70
Residential Non-Residential Infrastructure Headcount Profit Margins
APACChina
Net balance %
Chart 2: 12-month expectations
-60
-50
-40
-30
-20
-10
0
10
20
30
40
50
NewZealand
Australia Phillipines India Hong Kong China Sri Lanka Singapore Malaysia
Q3 Q2
Chart 1: Construction Activity IndexFeedback from the APAC region paints a mixed picture for the construction sector, with concerns around the ongoing impact of COVID continuing to heavily influence sentiment. The headline Construction Activity Index (CAI), which captures momentum across the industry, actually slipped back from +21 to +3 in Q3. However, chart 1 suggests there is a high degree of variance at the country level. The CAI remains strong in New Zealand (+43), Australia (+34), and Philippines (+34). Improvement has been shown in India and Hong Kong, but much weaker readings were returned elsewhere. For China, momentum appears to have stalled: after four successive strong readings for the headline index, the Q3 result of -4 is consistent with similar insight coming back from the RICS Global Commercial Property Monitor and much macro newsflow. Meanwhile, the CAI for Singapore, Sri Lanka and Malaysia remains stuck in negative territory.
Current workloads slip in latest quarterIn terms of responses around current workloads, the overall picture has turned a little more downbeat at an aggregate level. Infrastructure is the only sector where activity is continuing to grow albeit the net balance eased to +13% compared with +39% previously. Both the residential and non-residential indicators turned negative during Q3, after edging into positive territory in the previous quarter. Within the infrastructure component, the growth in workloads was broadly based with energy and digital leading the way. The relative strength of infrastructure is also clearly visible in the country level results, with the net balance readings outperforming to a greater or lesser extent in all the APAC markets.
Expectations remain a little more resilientThe more sluggish environment for current workload metrics is not wholly translated through into forward looking indicators, as chart 2 demonstrates. While for APAC in aggregate, the projected workload readings are less upbeat than beforehand, they are still consistent with an increasing level of activity. Infrastructure is predictably viewed as the area with the greatest dynamism, but both non-residential and residential sectors are also seen as likely to see rising levels of business. Perhaps unsurprisingly, the downgrading of expectations in China compared with Q2 is a little more marked than elsewhere, as concerns have increased around the financial viability of parts of the development sector in the wake of Evergrande. That said, the private residential net balance remains in positive territory at +4%. Back at the headline level, profit margins are anticipated to remain largely unchanged over the next twelve months with rising construction costs continuing to put pressure on the bottom line.
Broad range of factors hampering activityAs elsewhere around the globe, the cost of building materials is currently perceived to be a key issue for developers in APAC. Chart 3 shows that around four in five respondents from the region cited this issue as a challenge but, interestingly, this was accompanied by a significant level of concern around financial constraints and insufficient demand. The response to the demand issue is strikingly different from Europe, where only around one-third of contributors saw a lack of demand as a problem and the Americas, where less than half did. Sourcing labour was also identified as an obstacle to development in APAC but more so in Singapore, Philippines, New Zealand and Australia than elsewhere.

7
Q3 2021: Global Construction Monitor
© RICS Economics 2021 Q3 2021
rics.org/economics
Regional Comments from Survey Participants in Asia PacificAustraliaImpending legislation change in 2022 relating to the energy efficiency provisions. - Adelaide COVID restrictions. - BrisbaneGovernment Stimulus. - BrisbaneMainland states in lockdown since June 2021 has impacts here and potential for us also to enter lock. - HobartCovid lockdowns and industry shutdown in Melbourne!. - MelbourneSkilled Labour Shortage. - Perth Working in the Natural Resources sector it is evident that the market in WA is extremely buoyant. - Perth Lack of innovative design skills evident. - SydneyThe uncertainty of the pandemic lockdown and restriction easing. - SydneyThe COVID-19 pandemic has clearly impacted supply chains in terms of cost and procurement timing. -SydneyMaterial shortages, significant increase in cost of materials, skilled labour shortages. - Sydney
China The price of materials has risen, the scope of bidding has been expanded at will, and the competition has intensified. - BeijingThe global Covid-19 epidemic has a major impact on the development of the construction market, and has a negative impact on the efficiency of contractors and the profitability of projects. - ShanghaiSmall and medium-sized real estate companies face very daunting challenges, and heavy investment projects will be reduced. - ShanghaiIncrease in prices of major building materials. -ShenzhenThere is a severe shortage of skilled workers, and the epidemic has affected the price of materials and transportation costs, and has affected business operations. - WeiheiEnvironmental factors and policy factors. -Zhengzhou CityThe price of raw materials is rising rapidly. -Zhuhai city
Hong Kong Shortage of skilled labour, competent supervision and resident site staff. Materials costs rising.Brain drain impact will be observed.Covid 19 the main effect to the construction marketLow investment incentive due to covid-19.
Political issues affects speed and amount of investments.Global logistic issue, materials supply.
IndiaWork from home culture, Political intervention - BangaloreThe country and the industry is recovering fast from COVID -19 economically - ChennaiImproper planning and frequent changes in design during construction phase. - Delhi NCRProjects financing and drop in property demands are major factors affecting construction sector - Mumbai Complying with COVID pandemic has resulted in liquidity crunch. - MumbaiShortage of skilled and unskilled manpower at construction sites. - MumbaiImprovemen in use of technology. Improvement in efficient use of machinery and workforce is observed. - Pune
Malaysia Prolonged lockdown due to Covid-19 badly affecting supply chain. - Kuala LumpurThe prices of material have been rising due to global logistic issues and factory shut down. - Kuala Lumpur
Covid-19 - Kuala Lumpur
New Zealand Shortage of materials affecting programming and project completion - Auckland Covid 19 implications. - Auckland Covid lockdowns halting works. - AucklandInternational and regional Covid & logistics driven material shortages and price increases. - ChristchurchNew Zealand has been in a Covid-19 lockdown. Materials manufactured in Auckland are now in short supply. - HamiltonPhillipinesReturn of skilled workers to work are hampered, due to the requirement of being vaccinated first.- Manilla
Singapore Short of labour resourcesCosts significantly increased by Covid-19 factors, much of which passed on in tender pricing
Sri Lanka Covid pandemic and lockdown. Travel restrictions between provinces. - Colombo

8
Q3 2021: Global Construction Monitor
© RICS Economics 2021 Q3 2021
rics.org/economics
0
1
2
3
4
5
6
7
8
9
Tenders Prices Construction Costs Materials Costs Skilled Labour Costs Unskilled Labour Costs
Q2 2021 Q3 2021
Annual % change expected
Chart 3: 12-month projections
Europe: Private residential and infrastructure workload expectations strengthen further across the continent
0
10
20
30
40
50
60
70
Private Residential Private Non-Residential Infrastructure/PublicWorks
Headcount Profit Margins
Q2 2021 Q3 2021
Net balance %
Chart 2: 12-month expectations
54
49
40
3431
27 27 26
18
16
51
34
40
34
15
37
1917
26
17
0
10
20
30
40
50
60Q3 2021Q2 2021
Chart 1: Constuction Activity Index The latest survey feedback on the European construction market points to the recovery retaining plenty of impetus at the aggregate level. Growth continues to be cited across all sectors, with private residential workloads again standing out as the strongest area of expansion. Notwithstanding this, rising material costs are singled out by 82% of respondents across Europe to be a constraint on activity, with this pressure seemingly intensifying even further from an already concerning picture back in Q2.
Construction Activity Index remains unchangedFrom a pan-European perspective, the Construction Activity Index (CAI) came in at +34 in Q3 (identical to last quarter’s reading), suggesting overall momentum remains solid across the market. Drilling into the results by country (depicted in Chart 1) shows the Netherlands and Ireland posting the firmest results, with the CAI improving to a certain degree in each instance. Furthermore, all European nations covered by the Monitor display comfortably positive CAI readings, even if feedback across Germany is not quite as upbeat as back in Q2.
Across Europe as a whole, a net balance of +55% of contributors noted a pick-up in private residential workloads, with the pace of growth (in net balance terms) appearing similar to that seen during the previous quarter. Alongside this, workloads across the private commercial sector seemed to accelerate, evidenced by a net balance of +35% of respondents reporting a rise (up from a figure of +19% in Q2). With regards to the infrastructure sector, although the latest net balance of +21% is still indicative of a quarterly increase in output, this has eased from a reading of +39% returned last time.
Looking ahead, expectations for the next twelve months remain in positive territory across all sectors (Chart 2). Significantly, the outlook for the private non-residential sector was upgraded, with the latest net balance rising to +42% from +27% in Q2. Conversely, growth expectations were trimmed slightly regarding infrastructure. For headcounts, a net balance of +35% of respondents now foresee an improvement in employment levels over the year to come, rising from a figure of +28% beforehand. At the country level, the Netherlands, Germany, Poland and Ireland exhibit the strongest expectations for headcounts, while feedback remains much flatter across France for the time being.
Cost pressures and labour shortages appear to intensifyAn overwhelming majority of respondents (82%) based in Europe highlighted material costs as a factor impeding market activity in Q3, up from an already elevated share of 78% last time. Meanwhile, shortages of materials and labour were cited as a hindrance by 73% and 72% of respondents respectively. In the case of the latter, the share of contributors reporting such issues with labour rose from 65% in the previous quarter.
Chart 3 illustrates that these labour shortages are feeding into respondents’ perceptions on labour costs over the next twelve months, with these projections being raised across both skilled and unskilled labour categories. As a result, total construction costs are now projected to rise by 8% over the same timeframe (up from 7% predicted previously). These cost pressures are subsequently expected to keep a lid on any growth in profit margins. Indeed, the latest net balance for profit margins over the next twelve months slipped to just +4% (from +7% last time), with a reading so close to zero pointing to a broadly flat trend on the horizon.

9
Q3 2021: Global Construction Monitor
© RICS Economics 2021 Q3 2021
rics.org/economics
Regional Comments from Survey Participants in EuropeAustriaBuilding certificates will become more important (residential and commercial). - Vienna
BelgiumA perfect storm. Prices clients are able to pay decline, but demand in quality and climate change go up. - Antwerp
CyprusCyprus is an island, thus heavily reliant on imports. Travel and transport limitations have an impact. - Nicosia
FranceInflation in the cost of wood and metal. - Paris
GermanyConstruction labour and subcontractor shortage due to current high volume of projects. - Hamburg
HungaryCoronavirus & the use of home offices is keeping deveopers away from offices. - Budapest
IrelandContractors fear the volatility in the market. - Cork
Construction costs and supply of skilled labour. - Dublin
Biggest problem is shortage of materials due to the pandemic. - Limerick
ItalyOut-of-control increases in all building costs. - Rome
NetherlandsThe power net in city centres becoming full and shortage of power connection affects the process. - Amsterdam
PolandShortage of workforce. - Warsaw
Spain The cost of material is very high. - Barcelona
Shortage of licensed plots, shortage of sufficient and adequate infrastructure, inadequate planning. - Marbella
There is generally a skills shortage at the trade level. - Madrid
Competition and lower profit margins. - Santander
Switzerland Price of some materials on the rise. Real estate already very high. Watch out for mortgage rates. - Geneva
United KingdomDelays in planning are crippling pipeline of projects coming to market. - London
Labour and material shortages. - London
Brexit and cost of importing key technology and materials. - York

10
Q3 2021: Global Construction Monitor
© RICS Economics 2021 Q3 2021
rics.org/economics
-10
0
10
20
30
40
50
60
Private Residential Private Non-Residential Infrastructure/Public Works
Current workloads
12-month Expectations
Net balance %
Chart 3: 12-month workload expectations
Middle East and Africa: Construction activity gaining momentum across the region
0
5
10
15
20
25
30
35
40
ICT Energy Social Transport Water & Waste Agribusiness
Q2 2021 Q3 2021% of respondents
Chart 2: Infrastructure workloads by sub-sector
54
2418 18 17
10
0-4
-7
46
-3
8
24 31
4
-13
2
-23
-30
-20
-10
0
10
20
30
40
50
60
SaudiArabia
Bahrain MiddleEast &Africa
Global Nigeria UAE SouthAfrica
Qatar Oman
Q3 2021Q2 2021
Chart 1: Construction Activity IndexThe Q3 survey feedback across the Middle East and Africa (MEA) paints a stronger picture than was the case back in Q2, with growth in construction activity seemingly gaining impetus at the headline level. Furthermore, expectations for the coming twelve months are upbeat for both workloads and headcounts, albeit profit margins are not envisaged to see much in the way of expansion on account of the significant cost rises occurring throughout the industry.
Construction Activity Index improves noticeablyAt the aggregate level, the Construction Activity Index (CAI)returned a reading of +18 within MEA during Q3, up from +8 back in Q2. Consequently, this measure points to an acceleration in output growth over the latest survey period and now sits in-line with the global average. In fact, this marks the first occasion since the survey was formed early last year in which MEA has not been below the worldwide figure. That said, the CAI remains mixed when viewed by country, with Saudi Arabia clearly outperforming all other nations covered across the region on this metric. In fact, during Q3, the CAI reading for Saudi Arabia climbed from an already strong figure of +46 in Q2 to +54, which is the most elevated return not just within the region but also globally. Elsewhere, positive CAI figures were posted in Bahrain, Nigeria and the UAE. Alongside this, conditions still appear somewhat subdued in Qatar and Oman, although the CAI did at least turn significantly less negative in the latter during Q3.
When looking at the current trend in workloads by sector, infrastructure displays the strongest momentum, with the net balance rising from +6% previously to +24% in Q3. Chart 2 shows a breakdown of the Q3 feedback across the various sub-sectors of infrastructure. ICT and energy projects recorded the firmest pick-up in output over the quarter, as the net balance of respondents reporting an increase moved further into positive territory in both cases. Likewise, the social, transport and water & waste categories also returned noticeably stronger readings this time out, while the only sub-sector to see a slight dip in momentum was agribusiness.
All sectors display a positive twelve-month outlookLooking at the coming twelve months, respondents anticipate a rise workloads across all sectors, with infrastructure continuing to lead the way (net balance +51%). Significantly, the outlook for private non-residential workloads strengthened noticeably, posting a net balance reading of +37% compared with +13% back in Q2. For the private residential sector, expectations came in more or less in line with the previous quarter’s results, with a net balance of +32% of survey participants anticipating a pick-up over the next twelve months. With regards to the employment outlook for the year ahead, a net balance of +36% of contributors foresee a rise in overall headcounts across the region in aggregate. This is up from a reading of +18% beforehand. Furthermore, Oman is the only nation covered across MEA in which employment is not expected to rise on this basis, with respondents expecting a flat trend instead.
Financial constraints, material costs seen as impedimentsFinancial constraints appear to be a more significant obstacle for the market to grapple with across MEA compared to other parts of the world, as 84% of respondents based in the region highlighted this issue (compared to a global average of 65%). Identical to the global feedback, however, 83% of respondents cite material costs to be impeding activity. Moreover, with forecasts still pointing to significant cost inflation over the next twelve months (running ahead of growth in tender prices), this is expected to restrict any rise in profit margins.

11
Q3 2021: Global Construction Monitor
© RICS Economics 2021 Q3 2021
rics.org/economics
Regional Comments from Survey Participants in MEABahrainRestrictions on movement due to COVID 19 Pandemic resulting tender price increase by 2% to 5% - Manama
The present Pandemic “covid 19” has greatly affected businesses all around the world. - Manama
BotswanaOrganisational inefficiency and lack of planning strongly affects implementation. - Gaborone
EthiopiaIncrease in cost of construction materials. - Addis Ababa
GhanaQuality of materials and availability of mortgage facilities. -Accra
KenyaThe Kenya construction industry has been facing enormous challenges in quality assurance. -Kisumu
KuwaitUnskilled labor shortage. - National
MalawiCovid 19 has led scarcity of imported materials hence sharp increase in prices. - Lilongwe
MauritiusImported labour shortage due to travel restrictions. - Rose Hill
NigeriaIncrease in cost of materials due to the change in Goverment policies such as exchange rate. - Lagos
In Nigeria, a factor that is impacting on construction materials and cost is exchange rate & import duties. - Lagos
OmanCOVID 19 pandemic, introduction of VAT and increased work visa costs. - Muscat
Since VAT was applied, market conditions are not good, availability of vaccinations improved activity. - Muscat
QatarPolitical issues may be having an impact, shortage of materials. - Doha
Rush to finish projects to host the World Cup in 2022. - Doha
Closure of Borders in various countries, the reopening of the borders will impact the current trend. - Doha
Saudi ArabiaConstruction cost are increasing 8-10% due to Covid-19. - Riyadh
Low budgeted projects from government sector are impacting the construction market. - Riyadh
The boom created by Vision 2030 in KSA with limited in-Kingdom supply has made the market buoyant. - Riyadh
South AfricaDevelopments projects are coming in slowly. The pandemic has slowed progress on project roll-out. - East London
Over regulation and an under-performing planning approval sector is halting development. - Durban
Unregulated competition - firms are undercutting one another to the detriment of the profession. - Johannesburg
Industrial strike action directly impacted on our ability to perform in terms of our contracts.- Johannesburg
Slow decision making due to Covid-19. Political instability & corruption. - Johannesburg
TanzaniaLack of cash flow. - Dar es Salaam
UAECoronavirus restrictions affecting travel and shipping. - Abu Dhabi
Material prices are being hiked due to the transportation charges affected by COVID 19, and competition. - Abu Dhabi
Covid is still impacting activities in construction, downstream and upstream. - Abu Dhabi
Changes in spending patterns of the government authorities which drives infrastructure construction. - DubaiCompetition and material price fluctuation is affecting the contractors prices adversely. - DubaiUAE Government keen on promoting mobility in the market as the Dubai Expo 2020 begins.- Dubai

12
Q3 2021: Global Construction Monitor
© RICS Economics 2021 Q2 2021
Global Construction MonitorRICS’ Global Construction Monitor is a quarterly guide to the trends in the construction and infrastructure markets. The report is available from the RICS website www.rics.org/economics along with other surveys covering the housing market, residential lettings, commercial property, construction activity and the rural land market.
MethodologySurvey questionnaires were sent out on 9 September 2021 with responses received until 19 October 2021. Respondents were asked to compare conditions over the latest three months with the previous three months as well as their views as to the outlook. A total of 1749 company responses were received globally.
Net balance = Proportion of respondents reporting a rise in a variable (e.g. occupier demand) minus those reporting a fall (if 30% reported a rise and 5% reported a fall, the net balance will be 25%). Net balance data can range from -100 to +100. A positive net balance reading indicates an overall increase while a negative reading indicates an overall decline.
RICS Construction Activity Index is constructed by taking an unweighted average of current and 12-month expectations of four series: residential workloads, non-residential workloads, infrastructure workloads and profit margins. Global and regional series are weighted using the World Bank’s GDP PPP (2017 constant prices) data series. Current responses were weighted using the prior years GDP (e.g. the 2020 responses were weighted using 2019 GDP data). Where responses are not sufficient to form a national-level sample, they are binned together to fill in any gaps in regional coverage.
DisclaimerThis document is intended as a means for debate and discussion and should not be relied on as legal or professional advice. Whilst every reasonable effort has been made to ensure the accuracy of the contents, no warranty is made with regard to that content. Data, information or any other material may not be accurate and there may be other more recent material elsewhere. RICS will have no responsibility for any errors or omissions. RICS recommends you seek professional, legal or technical advice where necessary. RICS cannot accept any liability for any loss or damage suffered by any person as a result of the editorial content, or by any person acting or refraining to act as a result of the material included.
Contact detailsThis publication has been produced by RICS. For all economic enquiries, including participation in the monitor please contact a member of the RICS Economics Team.
Economics Team
Simon Rubinsohn
Chief Economist
+44(0)20 7334 3774
Tarrant Parsons
Economist
+44(0)20 7695 1585
Information
Responses were gathered in conjunction with the following organisations:
RICS Economics

Delivering confidenceWe are RICS. Everything we do is designed to effect positive change in the built and natural environments. Through our respected global standards, leading professional progression and our trusted data and insight, we promote and enforce the highest professional standards in the development and management of land, real estate, construction and infrastructure. Our work with others provides a foundation for confident markets, pioneers better places to live and work and is a force for positive social impact.
rics.org
Americas, Europe, Middle East & [email protected]
Asia [email protected]
United Kingdom & [email protected]