ontario’s energy dilemma: reducing emissions at an ... · ontario’s energy dilemma: reducing...
TRANSCRIPT

Ontario’s Energy Dilemma:Reducing Emissions at an Affordable Cost
March 2016

Prepared by the Ontario Society of Professional EngineersMarch 2016
RESEARCH REPORTOntario’s Energy Dilemma: Reducing Emissions at an Affordable Cost
ABOUT THE ONTARIO SOCIETY OF PROFESSIONAL ENGINEERSThe Ontario Society of Professional Engineers (OSPE) is the voice of the engineering profession in Ontario. We represent the entire engineering community, including engineers, engineering professionals, graduates, and students who work or will work in several of the most strategic sectors of Ontario’s economy. OSPE elevates the profile of the profession by advocating with governments, offering valued member services and providing opportunities for ongoing learning, networking and community building. OSPE was formed in 2000 after members of Professional Engineers Ontario (PEO) voted to separate regulatory and advocacy functions into two distinct organizations.
ACKNOWLEDGEMENTSOSPE wishes to acknowledge the contributions of the members of OSPE’s Energy Task Force who prepared this report: Michael Monette, P.Eng. (Chair); Paul Acchione, P.Eng.; Antonio Antonopoulos, P.Eng.; Keith Boulton, P.Eng.; Peter DeVita, P.Eng.; Frank Lasowski, P.Eng.; Steven Pepper, P.Eng.; Rob Ramranpoor, P.Eng.; Handan Tenzel, P.Eng.; Marius Vartolomei, P.Eng.; Peter White, P.Eng.; and Rhonda Wright Hilbig, P.Eng.
OSPE appreciates the technical input provided by other OSPE members in the production of this report. OSPE also wishes to thank Market Intelligence and Data Analysis Corporation that provided the data analytics and graphical presentations in this report and Dr. Charles Rhodes, P.Eng., for his advice on how to economically displace fossil fuels in other sectors using surplus electricity.

TABLE OF CONTENTS
Executive Summary
Background
Ontario’s Energy Systems
GHG Reduction Strategies Conservation and Energy Efficiency Switching Among Fossil Fuels Synthetic and Bio-Fuels Atmospheric Carbon Dioxide Sequestration Leveraging the Electrical System
Conclusions
Recommendations
Index of Abbreviations
Appendix A – The History of the Transformation of Ontario’s Power System
Appendix B – The Cost of Producing Electricity
Appendix C – Low Carbon Technologies for Ontario’s Power System Renewable Energy Nuclear Energy Electrical Storage Thermal Storage Natural Gas and Its Special Role in a Low Emission Power System
Appendix D – Lessons from Ontario’s Power System Transformation Hydroelectric Energy Bio-Energy Wind Energy Solar Energy Nuclear Energy Conservation
Minimizing Costs and Emissions
2
5
8
12 1416171718
24
27
28
29
34
393940434446
4747 48 48 52 55 56 57

The Ontario Society of Professional Engineers (OSPE) is the voice of the engineering profession in Ontario. OSPE represents the entire engineering community, including licensed engineers, graduates of engineering programs and engineering students. Engineers work in several of the most strategic sectors of Ontario’s economy.
OSPE has produced this report to help engineers, the public and our political leaders participate in technically informed policy discussions as we embark on the next phase of emission reductions – transforming our non-electrical energy systems to meet our international greenhouse gas (GHG) emission reduction obligations.
This report identifies a number of challenges and opportunities to reduce greenhouse gas emissions across our economy. Ontario has just transitioned out of coal generation and has reduced its electricity sector emissions by 80% below 1990 levels in a span of only 12 years. This report documents some of Ontario’s experiences in that transformation, and offers some insights on how to reduce GHG emissions in the other sectors of the economy at an affordable cost.
Ontario’s choices for its electricity sector transformation while phasing out coal proved costly, as reported in the 2015 Annual Report of the Office of the Auditor General of Ontario (OAGO).1It was the lack of detailed engineering analysis on the impact of variable renewable generation before phasing out coal that contributed to unnecessary costs.
The world is facing difficult decisions about how to address climate change. Choices have to be made about our energy future. It is certainly possible to eliminate GHG emissions from our
1 Office of the Auditor General of Ontario, 2015 Annual Report (2015), 206-242, accessed February 16, 2016, http://www.auditor.on.ca/en/reports_en/en15/3.05en15.pdf.
EXECUTIVE SUMMARY
2 Ontario Society of Professional Engineers

economy by 2100 as the G7 developed countries recently committed to.2 However, some verydifficult and potentially controversial choices have to be made. Engineers are hopeful that our political leaders will make the decisions that result in a future where all people live in a carbon-free3 energy world and are able to afford the comforts we have become accustomed to in developed countries. However, other choices can plunge the world into a spiral of increasing costs for carbon-free energy, leaving the countries and people who are most vulnerable unable to escape a life of energy poverty.
Most importantly, we need to:
• Pay more attention to the math, engineering and economics of energy production.
• Set realistic timelines for the necessary research and development4 and subsequent commercial deployment that typically takes 20 to 40 years depending on the current technology.
• Make trade-offs among the many choices available to combat climate change, which have very different cost and risk profiles.
For jurisdictions with limited hydroelectric storage, until low-cost efficient electrical storage technology becomes commercialized, the most important lessons from Ontario’s electricity system transformation are:
• Variable renewables (wind and solar) achieve their best return on investment when they displace high emitting fossil fuels either in the electrical power system or in non-electrical sectors of the economy (thermal energy loads). They have little or no economic value when they displace other carbon-free sources.
• As the power system becomes lower emitting, it is important to find ways to use variable renewable generation to displace fossil fuels in the non-electrical sectors.
• Incentivizing the use of variable renewable generation to displace fossil fuels in non-electrical sectors will require a re-design of the electricity retail price plans typically used by electric utilities and will require some smart grid functionality.
• Base-load electricity demand (steady demand 24 hours a day) is currently best met using base-load hydroelectric, nuclear and carbon neutral bio-energy sources if the primary objective is to reduce GHG emissions.
2 Group of Seven (G7) is a group consisting of the seven developed countries Canada, France, Germany, Italy, Japan, United Kingdom and the United States.
3 Carbon-free includes energy sources that do not increase the carbon dioxide load in the atmosphere such as sustainable bio-energy sources that recycle atmospheric carbon.
4 Research and development (R&D) includes testing at pilot scale facilities.
Ontario’s Energy Dilemma: Reducing Emissions at an Affordable Cost 3

Ontario is now faced with an interesting dilemma. How can we best achieve success in reducing carbon emissions in other sectors of the economy at an affordable cost? Can Ontario economically leverage its very low emitting electricity system to help reduce emissions in the other sectors? Can Ontario achieve its overall carbon reduction goals without burdening our trade-exposed businesses with higher costs than their competitors in other jurisdictions?
Ontario’s significant and ongoing surplus of carbon-free electricity does present us with a silver lining. It provides us an opportunity to find economic ways to use that energy to displace fossil fuels in the non-electrical sectors of the economy.
This report includes the following recommendations for Ontario’s public policy makers:
• Ensure that detailed economic and environmental analysis is undertaken and informed by engineering studies for any proposed carbon reduction technology before implementation decisions are made.
• Investigate the means by which we can best incentivize the use of surplus carbon-free electricity to displace fossil fuels in other sectors.
• Ensure appropriate technology-neutral, market-based pricing mechanisms are put into place so that the marketplace can independently develop GHG reduction solutions that are the most economically and environmentally efficient.
This report is the second in a series of reports by OSPE’s Energy Task Force relating to climate change and greenhouse gas reduction. The first report, Engineering a Cleaner Economy: Examining Ontario’s Carbon Pricing Program and the Role of Innovation was released in September 2015.5 A third report Smart Electricity Pricing will be issued soon. It will identify how smart electricity pricing in combination with carbon pricing programs can leverage Ontario’s very low emission electrical power system to displace fossil fuels in other sectors.
5 Ontario Society of Professional Engineers, Engineering a Cleaner Economy: Examining Ontario’s Carbon Pricing Program Program and the Role of Innovation (Toronto: Ontario Society of Professional Engineers, 2015), accessed February 16, 2016, https://www.ospe.on.ca/public/documents/advocacy/2015-engineering-cleaner-economy.pdf.
4 Ontario Society of Professional Engineers
BACKGROUND
The Ontario Society of Professional Engineers (OSPE) advocates for energy policy that will ensure a safe, reliable, sustainable and affordable energy supply to industry and residents. OSPE does this on behalf of its members who work in the energy sector, and those who work in companies that are impacted by energy supply. Energy systems are among the largest and most complex engineering systems in society. OSPE believes effective public policy dealing with energy and environmental matters must accommodate fundamental engineering principles that govern energy production, distribution and consumption. OSPE attempts to make those facts known to energy policy decision makers and the public to ensure Ontario residents continue to enjoy a high standard of living with good jobs and a healthy environment.
In spring 2015, the Ontario Ministry of the Environment and Climate Change (MOECC) issued Ontario’s Climate Change Discussion Paper.6 It posed a series of questions soliciting stakeholder input for the creation of an Ontario Climate Change Strategy. The discussion paper provided an overview of guiding principles for achieving a low-carbon economy.
OSPE submitted comments about the discussion paper covering a wide range of topics. In the submission, OSPE stated:
Ontario needs to implement a wide, comprehensive range of carbon emission reduction policies and programs that span across all Ministries and agencies, in cooperation with other levels of government. Moving towards a low-carbon economy will create opportunities, and enhance, rather than diminish, Ontario’s prosperity. The program should be an outcome-focused regulation that establishes clear benchmarks, but that allows for some degree of flexibility as to how they are achieved.
6 Ministry of the Environment and Climate Change, “Ontario’s Climate Change Update 2014,” September 2014, accessed March 1, 2016, http://www.ontario.ca/document/ontarios-climate-change-update-2014.
Ontario’s Energy Dilemma: Reducing Emissions at an Affordable Cost 5

OSPE recognizes that the transportation, industrial and building sectors contribute the largest percentage of GHG emissions in Ontario, totaling just over 80% of all GHG emissions in the province. Reports and submissions about how these sectors can lower GHG emissions from an engineering perspective will be issued during the coming year by OSPE.
Electricity generation also contributes to GHG emissions, albeit slightly less than 9% of the total emissions in 2012 and about 3% in 2015. From a consumer point of view, the more pressing issue is that electricity prices have been rising much faster than inflation since 2007.7 OSPE released a report in 2012, Wind and the Electrical Grid: Mitigating the Rise in Electricity Rates and Greenhouse Gas Emissions,8 outlining how imposing solutions from other jurisdictions into Ontario’s unique electrical grid9 would contribute to higher than necessary costs and emissions. Ontario’s power system contains significant amounts of carbon-free inflexible base-load10 generation that makes some technology choices unsuitable. OSPE offered 19 recommendations from an engineering perspective on how to mitigate potentially unnecessary costs and emissions. The report was widely read and referenced by government ministries and politicians in all parties.
The Ontario government implemented 13 of the recommendations either fully or in part over the subsequent three years. The changes mitigated costs and emissions and the frequent deep negative wholesale market clearing prices that occurred in 2011 and 2012 rarely occur today.
In December 2015, political leaders around the world met in Paris to reach agreements to reduce GHG11 emissions globally to keep global warming below 2°C and preferably 1.5°C. The Intergovernmental Panel on Climate Change (IPCC) goal of an 80% reduction from 1990 levelsby 2050 was established to meet the 2°C limit. The G7 goal of a 100% reduction by 2100 wasmade in June 2015. Ontario’s total carbon dioxide emissions in 1990 totaled 177 million tonnes.12
This report identifies a number of challenges and opportunities that currently exist to reduce GHG emissions across our economy. OSPE is confident that the input of Ontario’s engineers will help our political leaders make effective technically informed decisions as we embark on the next phase of emission reductions – transforming our non-electrical energy systems to meet our international emission reduction obligations.
7 Ontario Energy Board, “Historical Electricity Prices,” accessed February 19, 2016, http://www.ontario energyboard.ca /oeb/Consumers/Electricity/Electricity%20Prices/Historical%20Electricity%20Prices.
8 Ontario Society of Professional Engineers, “Wind and the Electrical Grid: Mitigating the Rise in Electricity Rates and Greenhouse Gas Emissions,” March 14, 2012, accessed March 1, 2016, https://www.ospe.on.ca/public/documents/ advocacy/2012-wind-electrical-grid.pdf.
9 Grid has the same meaning as the electric power system in this report.
10 Base-load refers to energy that is consumed at a steady rate for all 24 hours in each day.
11 Greenhouse Gas (GHGs) consists primarily of carbon dioxide (CO₂) but also other greenhouse gases like methane (CH₄) and oxides of nitrogen (NOx), which are more potent than CO₂.
12 Ministry of the Environment and Climate Change, “Ontario’s Climate Change Update 2014.”
6 Ontario Society of Professional Engineers

For the reader’s convenience, much of the supporting information for this report has been located in four appendices:
• Appendix A describes the history of Ontario’s electricity system transformation including the coal phase-out.
• Appendix B describes the cost of converting primary sources of energy into electricity for delivery to consumers.
• Appendix C describes the low carbon technologies in the electricity sector and the challenges with using them.
• Appendix D describes the lessons Ontario has learned from the transformation of its electricity sector including the coal phase out.
Ontario’s Energy Dilemma: Reducing Emissions at an Affordable Cost 7
Most jurisdictions have several energy systems. Ontario is no exception. The electric powersystem (grid) is the one most people think about when we talk about energy. However, electricity is only a small part of the total energy supply. The electricity sector was responsible for only about 14% of the carbon dioxide emissions or 25.5 million tonnes in 1990, 9% in 2012 and 3% in 2015.
The natural gas production and distribution system provides energy for space and water heating, plastics, cooking, fertilizer, industrial process heat and about 10% of Ontario’s electricity production in 2014 and 2015.
The liquid fuel production and distribution system provides energy for transportation, off-road equipment, some space and water heating, some cooking, plastics, industrial process heat and lubricants. Ontario did not use oil to any significant extent to produce electricity in 2014 or 2015.
Solid fuels like wood, bio-wastes, coal, coke and metallurgical coal provide energy for space and process heat, steel making, cement making and some electricity. Since the end of 2014 coal is no longer used to make electricity in Ontario. Ontario did use a small amount of bio-energy fuels to produce much less than 1% of its electricity in 2014 and 2015.
Solar, wind, hydroelectric and nuclear energy are primarily used for electricity generation. Solar energy is also used for some space and water heating. About 90% of Ontario’s electricity in 2014 and 2015 was produced from these carbon-free sources. Comparative data among jurisdictions is not yet available for more recent years. However, 2012 comparative data is available and is shown in Table 1.
ONTARIO’S ENERGY SYSTEMS
8 Ontario Society of Professional Engineers
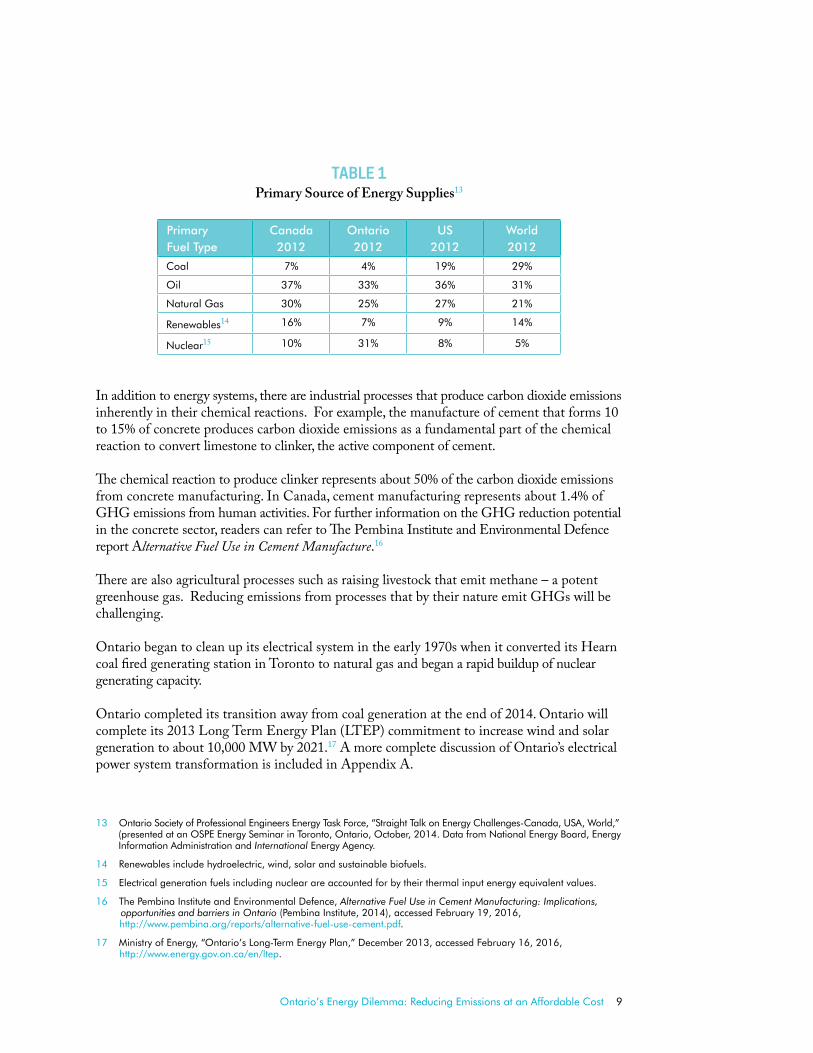
TABLE 1Primary Source of Energy Supplies13
14 15
Primary Fuel Type
Canada2012
Ontario2012
US2012
World 2012
Coal 7% 4% 19% 29%
Oil 37% 33% 36% 31%
Natural Gas 30% 25% 27% 21%
Renewables14 16% 7% 9% 14%
Nuclear15 10% 31% 8% 5%
In addition to energy systems, there are industrial processes that produce carbon dioxide emissions inherently in their chemical reactions. For example, the manufacture of cement that forms 10 to 15% of concrete produces carbon dioxide emissions as a fundamental part of the chemical reaction to convert limestone to clinker, the active component of cement.
The chemical reaction to produce clinker represents about 50% of the carbon dioxide emissions from concrete manufacturing. In Canada, cement manufacturing represents about 1.4% of GHG emissions from human activities. For further information on the GHG reduction potential in the concrete sector, readers can refer to The Pembina Institute and Environmental Defence report Alternative Fuel Use in Cement Manufacture.16
There are also agricultural processes such as raising livestock that emit methane – a potent greenhouse gas. Reducing emissions from processes that by their nature emit GHGs will be challenging.
Ontario began to clean up its electrical system in the early 1970s when it converted its Hearn coal fired generating station in Toronto to natural gas and began a rapid buildup of nuclear generating capacity.
Ontario completed its transition away from coal generation at the end of 2014. Ontario will complete its 2013 Long Term Energy Plan (LTEP) commitment to increase wind and solar generation to about 10,000 MW by 2021.17 A more complete discussion of Ontario’s electrical power system transformation is included in Appendix A.
13 Ontario Society of Professional Engineers Energy Task Force, “Straight Talk on Energy Challenges-Canada, USA, World,” (presented at an OSPE Energy Seminar in Toronto, Ontario, October, 2014. Data from National Energy Board, Energy Information Administration and International Energy Agency.
14 Renewables include hydroelectric, wind, solar and sustainable biofuels.
15 Electrical generation fuels including nuclear are accounted for by their thermal input energy equivalent values.
16 The Pembina Institute and Environmental Defence, Alternative Fuel Use in Cement Manufacturing: Implications, opportunities and barriers in Ontario (Pembina Institute, 2014), accessed February 19, 2016, http://www.pembina.org/reports/alternative-fuel-use-cement.pdf.
17 Ministry of Energy, “Ontario’s Long-Term Energy Plan,” December 2013, accessed February 16, 2016, http://www.energy.gov.on.ca/en/ltep.
Ontario’s Energy Dilemma: Reducing Emissions at an Affordable Cost 9

A commentary published by the Council for Clean and Reliable Energy (CCRE) titled Rethinking Ontario’s Long Term Energy Plan shows which technologies contributed to the GHG emission reduction since 2005.18 The majority of carbon reductions over the past 12 years occurred as a result of the restart of six base-load nuclear reactors at the Pickering and Bruce nuclear sites. The next largest reduction was due to the switch to natural gas from coal-fired generation. The remaining and smaller contribution was from the addition of renewable generation capacity.
Figure 1 shows how the GHG emissions from Ontario’s electricity sector have changed since 2005.
FIGURE 1Carbon Dioxide missions from Ontario’s Electricity Sector19
18 Marc Brouillette, CCRE Commentary: Rethinking Ontario’s Long-Term Energy Plan (Mississauga: Council for Clean and Reliable Electricity, 2014), accessed February 16, 2016, http://www.thinkingpower.ca/PDFs/Commentary/CCRE%20 Commentary%20-%20Rethinking%20Ontario’s%20Long-term%20Energy%20Plan%20-%20December%202014.pdf.
19 This graph appears as “Figure 20: Greenhouse Gas Emissions Forecast” in Ministry of Energy, “Ontario’s Long-Term Energy Plan.” Emissions in any one year could be higher or lower than the projection depending on the specific operating conditions experienced in the system. Data for 1990 came from Ministry of the Environment and Climate Change, “Ontario’s Climate Change Update 2014.”
Historical emissions Emissions projection
If we stay below the 5 MTonne line we will continue to achieve the 80% carbon reduction goal.
CO
₂ EM
ISS
ION
S (M
EGA
TO
NN
ES)
YEAR
25.5 MTonnes in 1990
32.90 MTonnes in 2005
4.25 MTonnes in 2015
This rise is due to the retirement of Pickering Nuclear. Gas-fired generation will be used for base load.
10 Ontario Society of Professional Engineers

The other sectors in the economy will face more difficult challenges to reduce emissions because they cannot easily make direct use of falling water or nuclear energy. These sectors typically require thermal energy and can only conveniently access hydraulic and nuclear energy in the form of electricity. Electricity is fundamentally more expensive to provide than fossil fuels.
The non-electrical sectors have access to the following energy technologies that are carbon-free (or carbon neutral):
• Electricity produced from carbon-free fuels
• Thermal solar
• Hydrogen
• Carbon based fuels from recycled atmospheric carbon dioxide
• Electric batteries charged by carbon-free electricity
All are currently expensive, and in the case of electric batteries, are only economic for personal use vehicles.
The rate at which new carbon-free energy technologies are embraced by industry and residentswill be driven by economic considerations (unless there is a regulatory ban on specific solutions), and by the savings realized by adopting the new technologies. Unfortunately, most new carbon-free energy technologies today cost more than the fossil fuels they hope to replace. This is the primary reason jurisdictions like Ontario are considering carbon pricing programs.
We can create higher savings for the carbon-free technologies by imposing higher costs for carbon emissions through regulatory action. However, doing this too quickly will have a negative impact on residents’ disposable income, especially those in the lower income brackets. Also the competitive position of trade-exposed Ontario businesses can be negatively impacted by transitioning too quickly. This will become more important when we open our Canadian market to competitors covered by the Comprehensive Economy and Trade Agreement (CETA) with the European Union and Trans-Pacific Partnership (TPP) among 12 Pacific Rim countries.
We can also create higher savings for using carbon-free technologies by offering subsidies. Funding these subsidies will be a challenge. Many governments including Ontario are currently running high deficits, so funds will need to be generated through other publicly acceptable means. One approach suggested by many clean energy proponents is to use the income from carbon pricing programs to fund the subsidies for deploying carbon-free technologies. This of course only works well while there is fossil fuel consumption. As our energy systems become cleaner, that revenue source disappears.
Ontario’s Energy Dilemma: Reducing Emissions at an Affordable Cost 11
There are various GHG emission reduction strategies we can adopt. Ideally we would select those strategies that are the most cost effective at reducing GHG emissions in a time period that will meet our international commitments.
Because of the rapid pace of technological developments, we need to also consider what technologies are likely to be commercially available during the planning period and make provisions to adopt them. However, we must be realistic about the time it takes to develop new energy technologies and deploy them in sufficient capacity to make a difference in our energy mix. There are several steps involved before any new energy production technology can play a major role in the provision of energy to our society. These include:
• The pure research or science phase to generate new ideas.
• The development phase to prove the idea will be practical to implement.
• The pilot testing phase when technical specifications and operating procedures are developed to make sure the technology will be reliable, cost effective and can be scaled up to commercial size.
• The commercial prototype phase to make sure the commercial-sized product can perform technically and economically as expected. Depending on the cost and complexity of the technology this may require additional scale-up steps.
• The deployment phase – the technology is installed throughout the energy sector.
The research, development, pilot testing and commercial prototype phases typically take two ormore decades. In the energy sector, the technology deployment phase is also typically measured in decades, not years. There are many reasons for this but three of the most important are:
GHG REDUCTION STRATEGIES
12 Ontario Society of Professional Engineers

• Energy infrastructure investments are large and long-term. Transitioning from the current technology to new technology will take time to avoid creating unacceptable levels of stranded debt.
• Energy infrastructure is physically large and requires considerable effort and time to replace it.
• The world’s population is still growing and more people are moving into the middle class and consuming more energy. This means energy consumption continues to grow even as we replace end-of-life facilities. This is a more serious challenge for developing countries.
Here in Ontario we have gone through four major energy transitions in the electricity sector since 1950 when Ontario had a hydroelectric power system. To reach a 30% share of installed capacity, the deployment phase took the following times:
• Coal generation – roughly 30 years
• Nuclear generation – roughly 25 years
• Gas fired generation – roughly 20 years
• Wind and solar is expected to take 20 years (we are currently 50% along after 10 years of deployment)
The transition from fossil fuels to very low emission energy sources across the entire economy is a much more complex undertaking than simply deploying new technologies in the electrical sector. It involves substitution issues that need to be managed to ensure the resulting energy supply remains reliable, very low emitting and affordable.
Ontario’s phase-out of coal-fired generation required the deployment of several technologies including renewables (hydroelectric, wind and solar), nuclear, Combined Cycle Gas Turbine (CCGT) and Simple Cycle Gas Turbine (SCGT) technologies. That deployment took the Ontario government 12 years to accomplish. However, coal-fired generation represented less than a third of the installed capacity of Ontario’s electrical power system, and electricity is only about 20% of Ontario’s energy supply. That means it took from 2003 to 2015 to achieve an 80% emission reduction for only 7% of Ontario’s energy supply. If Ontario progressed at that same pace for the rest of its energy supply, it would take over 170 years to reach the IPCC goal of 80% emission reduction for the entire Ontario economy.
Clearly it will take a lot more effort and money or a different transition strategy to achieve the international goals on time and in an affordable way. Another fact we must deal with is that three very effective emission reduction technologies come with challenges:
• Most of the best hydroelectric sites have already been developed in Ontario. Those that remain are far from the loads and can only be developed if First Nations will accept the environmental changes that are necessary to develop those resources. Also, hydraulic energy has to be delivered to consumers in the form of electrical energy for many practical reasons.
Ontario’s Energy Dilemma: Reducing Emissions at an Affordable Cost 13

• Nuclear technology has radioactive waste management, accident risk and proliferation concerns that a significant percentage of the public have difficulty accepting. Nuclear energy also has to be delivered to consumers in the form of electrical energy for many practical reasons.
• Sustainable bio-energy systems compete with food production and fresh water use so there are limits to how much this energy source can be deployed.
As mentioned earlier, electricity now accounts for a small percentage of GHG emissions in Ontario because 90% of electricity production is carbon-free. According to MOECC,20 the sector GHG emissions in 2012 were:
• 34% for transportation
• 30% for industry
• 17% for buildings
• 9% for electricity (dropped to about 3% in 2015)
• 6% for agriculture
• 4% for waste management
Trying to reduce GHG emissions further within the electricity sector is equivalent to the proverbial “squeezing blood out of a stone.” The return on investment is likely to be much better if we focus on how best to reduce emissions in the other five sectors. The Office of the Auditor General of Ontario (OAGO) 2015 Annual Report also mentioned the high cost to reduce emissions in Ontario’s very low GHG emitting power system of $257 per tonne of carbon dioxide.
Conservation and Energy Efficiency
The cheapest and lowest emitting energy we have is the one we do not use. Conservation and energy efficiency need no justification. The World Bank21 reports that in Canada we consume almost double the amount of energy per capita than that of the other G7 countries (not including the United States). While the colder climate and larger land area explains some of the difference, it does not fully explain the disparity. The main reason is that Canadians and Americans have been spoiled by low energy prices. For example, Ontario’s electricity rates today are less than half of those in Germany. The higher energy costs in other jurisdictions have encouraged industries and residents in those countries to invest more aggressively in energy efficient equipment and in insulating their buildings.
Some of the obvious areas where we can make significant improvements in energy intensity, energy costs and GHG emissions are:
20 Ministry of the Environment and Climate Change, “Ontario’s Climate Change Update 2014.”
21 “Energy use (kg of oil equivalent per capita),” World Bank, accessed February 19, 2016, http://data.worldbank.org/indicator/EG.USE.PCAP.KG.OE.
14 Ontario Society of Professional Engineers

• Lighting – replacing old incandescent and low efficiency florescent lighting with new Light emitting diodes (LED)22 and other high efficiency lighting products. This is especially economical in applications where the lights are on 24 hours a day, like in underground garages, common areas in high-rise buildings, public buildings, indoor malls, and industrial and manufacturing factories that run two or three shifts a day.
• Building insulation, windows and building envelope – upgrading insulation and replacing low efficiency or leaking windows and doors is very cost-effective. For example, improving the level of attic insulation is one of the most cost effective upgrades for most homes.
• High efficiency appliances – a variety of new high efficiency appliances including air conditioners, air and ground sourced heat pumps are available to reduce energy use and costs. High efficiency appliances that operate with fossil fuels such as gas ovens, stoves, fireplaces, furnaces and water heaters also reduce GHG emissions in addition to energy costs.
• High efficiency motors and smart controls that shutdown equipment like escalators when they are not in use or lighting when the area or room is not occupied.
However, we must be careful that the conservation dollars that we spend are actually creating the financial and environmental benefits we want. For example, Ontario has a “Conservation First” program. That program is reducing both daytime and nighttime electrical load. Ontario’s electricity system is 90% carbon-free and its costs are about 90% fixed. The wholesale electricity market prices in the adjoining power systems are low. When we export surplus electricity we only get a fraction of its total production cost. That means when Ontario consumers use less electricity, a portion of that electricity is sold at a loss and a portion is curtailed (wasted). Electricity rates then rise to collect enough money to pay the fixed costs of the power system.
When the conservation program was developed, Ontario was concerned about a lack of generatingcapacity. Ontario realized it was cheaper to invest in conservation to reduce electricity demand rather than build more capacity. However, after 10 years of no load growth and adding more capacity every year, our problem has changed. We are now curtailing carbon-free electricity or exporting it at a fraction of the production cost. Unfortunately, we have not modified our conservation programs to adapt to the new situation.
The conservation program would be more effective if it incentivized the use of the surplus carbon-free electricity it creates to reduce fossil fuel consumption in the other sectors of the economy that still have high GHG emissions.
22 Light emitting diodes (LED) are a solid state high efficiency lighting technology.
Ontario’s Energy Dilemma: Reducing Emissions at an Affordable Cost 15

Switching Among Fossil Fuels
Switching to lower emitting fossil fuels from higher emitting fossil fuels will reduce GHG emissions by 15% to 50%. For example, natural gas can successfully reduce carbon emissions by displacing solid and liquid fossil fuels in most applications because it has one of the lowest carbon dioxide emissions per unit of energy output (M.BTU)23 of any of the fossil fuels. Table 2 lists some of the fossil fuels that Ontario uses along with their emission levels.
TABLE 2Carbon dioxide emissions from fossil fuels24
Coke 251.6 pounds or 114.1 kg per M.BTU
Anthracite coal 228.6 pounds or 103.7 kg per M.BTU
Petroleum coke 225.1 pounds or 102.1 kg per M.BTU
Lignite coal 215.4 pounds or 97.7 kg per M.BTU
Bituminous coal 205.7 pounds or 93.3 kg per M.BTU
Diesel fuel 161.3 pounds or 73.2 kg per M.BTU
Heating oil 161.3 pounds or 73.2 kg per M.BTU
Gasoline 157.2 pounds or 71.3 kg per M.BTU
Jet fuel 156.3 pounds or 70.9 kg per M.BTU
Propane 139.0 pounds or 63.0 kg per M.BTU
Natural gas 117.0 pounds or 53.1 kg per M.BTU
Fossil fuels listed in the bottom of Table 2 can reduce emissions if they displace fossil fuels higher up in the list. For example, if natural gas fuel is used instead of heating oil we should see a 27% reduction in GHG emissions. Similarly, if natural gas fuel is used instead of anthracite coal we would see a 49% reduction in GHG emissions. Any additional improvements in combustion efficiency would further reduce emissions. Combustion efficiency comparisons for building heating systems are available from Natural Resources Canada.25
Government incentives can be used to accelerate the pace of switching among the fossil fuels but not the GHG emission intensity (kg CO₂ per M.BTU) of the final fuel choice. That means switching to cleaner fossil fuels will only help us meet our short-term reduction goals. The long-term IPCC or G7 goals of 80% and 100% GHG emission reduction respectively will require a different approach. We need to find alternative very low GHG emitting energy sources for our transportation, industrial, building, agriculture and waste management sectors to meet those long-term goals like we did for the electricity sector.
23 M.BTU refers to Million British Thermal Units, which is equivalent to 1.055 billion joules (GJ).
24 U.S. Energy Information Administration, “Carbon Dioxide Emissions Coefficients,” accessed February 16, 2016, https://www.eia.gov/environment/emissions/co2_vol_mass.cfm.
25 Natural Resources Canada, Heating with Oil (Ottawa: Her Majesty the Queen in Right of Canada, 2012), accessed February 16, 2016, http://www.housing.yk.ca/pdf/heating_with_oil_nrcan.pdf.
16 Ontario Society of Professional Engineers

Synthetic and Bio-Fuels
Rather than extracting fossil fuels from the earth we could manufacture equivalent carbon-based fuels using processes that are carbon-neutral.
An old technology that can supply carbon-neutral energy is biomass or plants. However, natural biomass growth is a very inefficient way to use the sun’s energy. Consequently, burning biomass forenergy has advantages only in certain locations that have few other choices. In most locations, burning biomass for energy would be unsuitable as a replacement for a significant fraction of our fossil fuels.
Another mature technology is to make ethanol fuel from plants such as corn or switchgrass using a fermentation process. However, large-scale production can compete with food production for fresh water and land.
Newer technologies to remove carbon from the atmosphere to make hydrocarbon fuels are in the research, development or pilot testing stage so they are not ready for large-scale deployment. Algenol is one company that uses algae and salt water to absorb carbon dioxide and sunlight to produce ethanol fuel and other useful byproducts. The company expects a carbon footprint 80% less than gasoline and fuel production costs of $1.30 US per gallon. The current low prices for oil and gas will create a challenging environment for the company. Algenol is currently running a pilot scale plant in Florida, US. Their website at www.algenol.com has more detailed information about their system.
Synthetic and bio-energy fuels are considered carbon neutral to the environment if the carbon originates from the atmosphere. For more information on various alternative fuels and their relative costs for the transportation sector, readers are encouraged to review the International Energy Agency report on that subject.26
Atmospheric Carbon Dioxide Sequestration The common approach to climate change mitigation is to reduce GHG emissions. An alternative is to remove or scrub carbon dioxide directly out of the atmosphere and sequester it. The scrubbing can be done either by chemical or biological processes. Scrubbing of carbon dioxide out of the atmosphere would allow society to continue to use some fossil fuels where there are no economic substitutes and still meet the IPCC emission reduction goals.
A number of startups are testing pilot systems to chemically scrub carbon dioxide from the atmosphere and make it available in concentrated form for sequestration. Typically, the carbon dioxide would be pumped deep into the earth. Two companies developing carbon dioxidescrubbers are Global Thermostat and Carbon Engineering. 27 These processes require energy to
26 International Energy Agency, Production Costs of Alternative Transportation Fuels (Paris: OECD/IEA, 2013), accessed February 16, 2016, https://www.iea.org/publications/freepublications/publication/FeaturedInsights_Alternative Fuel_FINAL.pdf.
27 For more on Global Thermostat, see http://globalthermostat.vaesite.net. For more on Carbon Engineering, see http://carbonengineering.com.
Ontario’s Energy Dilemma: Reducing Emissions at an Affordable Cost 17

reconstitute the carbon dioxide gas after it is absorbed and reacts with the chemical scrubbing solution. The energy can be provided by carbon-free energy sources like solar, wind, hydroelectric or nuclear. These technologies are still in the development stage and commercial viability has not yet been established. This may change in the future if carbon price programs are introduced widely.
We can also use older technologies to remove the carbon dioxide from the atmosphere. The obvious mature biological process to sequester carbon from the atmosphere is through natural plant growth. We can harvest the biomass such as wood from trees and use it for construction or store it in a location where it will not decompose. However, this carbon reduction strategy is costly and it competes with food production for fresh water and land.
Leveraging the Electrical System
Ontario has transformed its electrical power system by incorporating a significant fraction of carbon-free generation into its supply mix. By the end of 2015, Ontario had reduced emissions from its electrical power system to below 5 million tonnes per year. That is an emission rate of less than 40 kg CO₂ per MWh, or approximately 1/10th the rate in the United States, Europe and China. Fossil fuels – primarily natural gas – now comprise only 10% of Ontario’s electrical energy supply.
Ontario has had to make significant adjustments to its power system plans. Appendix A provides a description of the changes that have occurred since 1970 to reduce Ontario’s power system emissions.
The cost to produce electricity is different for each technology. Appendix B discusses in more detail the costs to produce electricity in Ontario. The costs of electricity from existing plants, from new plants in 2020 and the impact of carbon pricing are also discussed. All costs are expressed in cents per kilowatt-hour (kWh).28
Appendix C discusses in more detail the available low emission energy sources Ontario has available to produce low emission electricity and their advantages and disadvantages.
Appendix D includes detailed discussion and graphically illustrations of some of the challenges Ontario has experienced integrating the additional nuclear and variable renewable capacity into its existing power system.
The more important lessons from Ontario’s experiences contained in the four appendices are summarized below:
• Adding inflexible nuclear and variable renewable capacity to a power system beyond consumer demand levels will result in surplus carbon-free energy.
• Surplus carbon-free energy suppresses wholesale market prices for electricity down to the variable cost of production.
28 Kilowatt-hour (kWh) is a unit of energy that powers a 100 watt light bulb for 10 hours.
18 Ontario Society of Professional Engineers

• Surplus carbon-free energy is often exported at its variable cost of production or it is curtailed (wasted).
• The approximate variable cost of production for Ontario’s carbon free electrical generation technologies ignoring forced shutdown costs are:
•Nuclear: less than 1 cents/kWh
•Hydroelectric: less than 0.5 cents/kWh
•Wind: close to 0.0 cents/kWh
•Solar PV: close to 0.0 cents/kWh
• To satisfy contractual obligations for fixed price supply, a price adjustment on domestic electricity sales must be added.
• The price adjustments interfere with wholesale market price signals and discourage use of electricity by Ontario consumers for other purposes such as reducing fossil fuel consumption for thermal energy needs.
• It is currently cheaper to curtail (waste) energy than to build storage to prevent it.
• Once carbon-free energy is in surplus, adding more carbon-free capacity provides no value to the power system and contributes to higher electricity rates.
• Once a power system has surplus carbon-free energy it can offer that surplus electricity to other sectors at its variable cost of production without affecting electricity rates.
• Surplus carbon-free electricity sold at its variable cost of production is much cheaper than fossil fuels used for thermal energy needs.
The potential to use very low emission electricity to displace fossil fuels from other sectors is an exciting prospect. However, the important question is how it can be done at a cost that is acceptable to society. Electricity is inherently more costly to produce than fossil fuels. Electricity has higher value per unit of energy than other fuels because it can do some jobs in the economy that other fuels cannot do, like running electronic and electrical equipment. The other 80% of the jobs have been traditionally done by fossil fuels, like building and process heating, because there is no inherent advantage to paying more for electricity to perform those jobs.
At the end of 2014, electricity delivered to a residential consumer’s door was about six times more expensive (16 cents/kWh) on an equivalent energy content basis than natural gas (2.8 cents/kWh or 28.8 cents/cubic meter). Clearly full retail price electricity cannot economically displace full retail price natural gas unless we impose an extremely high carbon price. OSPE estimates we would need carbon prices of over $650 per tonne of carbon dioxide to push current natural gas prices to 16 cents/kWh – assuming a 10% loss of efficiency in the natural gas heating equipment compared to electrical heaters. That is only breakeven. To get consumers to purchase electrical heaters there has to be a significant saving to justify the purchase. Carbon prices that high are unlikely to receive public support.
Ontario’s Energy Dilemma: Reducing Emissions at an Affordable Cost 19

More expensive electrical heating equipment like air and ground source heat pumps can improve the performance of the electrical system. For example, the best ground source direct exchange heat pumps deliver four times more thermal output than simple electric heaters for the same electrical input. A carbon price of $60 per tonne of carbon dioxide would only be needed to make the best ground source heat pumps match the energy consumption cost of a high efficiency natural gas furnace. However, high efficiency ground sourced heat pumps are 2 to 3 times more expensive than electrical heaters or high efficiency gas furnaces with a separate air conditioner. Consumers would need to see substantial savings, above breakeven, to incentivize them to make the larger capital investment.
However, it is helpful to think of electricity in two categories – new capacity that needs to be built and surplus existing capacity that is wasted unless we find a use for it. New capacity has to be paid for at its full production cost. But surplus capacity can be sold at its “variable cost of production” because the fixed cost of that surplus capacity is already included in the price of electricity that is consumed within Ontario.
The variable cost of production for carbon-free electricity is less than 1 cent/kWh as indicated earlier. That means carbon-free surplus electricity can be sold at a price delivered to a consumer’s door that is less than 1/3rd of the price of natural gas on an energy equivalent basis without any carbon price penalty. Any carbon pricing program introduced in the future will make that surplus carbon-free electricity even more attractive relative to fossil fuels.
In 2014, about 7% or 10.6 TWh of Ontario’s carbon-free electricity was surplus to its needs. That is enough electricity to power over 1 million homes for one year. Half of it was sold to adjoining power systems at its variable cost of production (at a volume weighted average price of 0.8 cents/kWh). The other half was curtailed (wasted). The surplus in 2015 and 2016 as forecasted by the IESO will be similar to 2014 in the range of 10 to 11 TWh.29
The obvious question is why export or waste that surplus carbon-free electricity? We can offer that energy to Ontario businesses and residents at the same variable cost of production. Ontario consumers can then displace some of their fossil fuel consumption economically at no additional cost to the power system.
This presents three interesting options for rapid and significant GHG emission reduction in other sectors of the economy:
1. We can sell surplus carbon-free electricity at its variable cost of production to displace fossil fuels in other sectors. That would provide an immediate reduction of about 2 million tonnes of carbon dioxide each year.
2. We can import additional amounts of carbon-free electricity from adjoining power systems when it is offered at its variable cost of production (typically at wholesale market prices below 1 cent/kWh).
3. We can use revenues from carbon pricing programs to pay for the fixed costs of deliberately overbuilding our carbon-free electrical capacity. That would create more surplus carbon-free electricity that can then be sold to other sectors at its variable cost of production to further reduce fossil fuel emissions.
29 Office of the Auditor General of Ontario, 2015 Annual Report (2015), 206-242.
20 Ontario Society of Professional Engineers

The first option above can be done at any time because there is no additional cost to the electric power system. But it requires a major policy change on how electricity is sold in Ontario. It will also require some smart grid functionality and/or separate meters to allow smart controllers and billing software to differentiate between regular electricity sales and surplus carbon-free electricity sales when it is used to displace fossil fuels.
The second option above can be done at any time consistent with our transmission system and distribution system capacity limits.
The third option above requires more thought, analysis and consideration. The revenues from carbon pricing programs have many potential uses. Ideally the applications that deliver the largest and longest lasting environmental benefits at the lowest price should receive priority access to those revenues. Whether deliberately overbuilding the electrical system is the best use of carbon pricing program revenue is yet to be determined and is beyond the scope of this report. But we suggest the required analysis to evaluate this strategy is certainly worth the effort.
As we expand the electrical system to meet the energy needs of the other sectors, we need to keep an important fact in mind. Electricity is manufactured from a primary energy source. The carbon content of the input fuels used to produce electricity will affect the emission levels per unit of electricity in kWh. The technologies with zero operational GHG emissions (right column in Table 3) are the ones we need to focus on to ultimately meet the 80% to 100% reduction in GHG emissions across the entire economy.
Table 3 identifies the electricity producing technologies and their GHG emissions. The life cycle emission values in the middle column are less important than operational emissions because the life-cycle emissions will get smaller over time as we lower the GHG emissions of our energy systems. The reason is that construction and decommissioning of those future facilities will be done with lower emission energy in the future.
TABLE 3GHG Emissions from Electric Power Facilities
30 31 32 Fuel Type Life Cycle Emissions
grams CO₂ per kWh30Operating Emissionsgrams CO₂ per kWh31
Coal 1,001 973
Oil 840 n/a
Natural Gas 469 398
Renewables 4 0
Nuclear 16 0
Wind32 12 0
Solar PV32 46 0
30 Life cycle emission data is from the 50th percentile data set in Appendix II, Table A.II.4 in Working Group III of the Inter- governmental Panel on Climate Change, Renewable Energy Sources and Climate Change Mitigation, accessed March 1, 2016, http://srren.ipcc-wg3.de/report/IPCC_SRREN_Full_Report.pdf.
31 Ontario Society of Professional Engineers, “Wind and the Electrical Grid.”
32 Values above do not include required backup generation for wind and solar.
Ontario’s Energy Dilemma: Reducing Emissions at an Affordable Cost 21

There are of course applications that cannot use electricity directly. For example, heavy off-road equipment and jet airplanes cannot run on electricity. Carbon-neutral manufactured liquid fuels will be needed. However, very low GHG emitting electricity can be used to manufacture those fuels.
Electric Vehicles and the Power System
Electric cars provide us with a new technology to help manage our electric power system and reduce GHG emissions in the transportation sector. Electric cars have built-in electric storage in their batteries. The batteries range in size from about 20 kWh to 90 kWh depending on car size and range. If we assume an average battery is 30 kWh in size, then 500,000 electric cars or about 8% of Ontario’s passenger cars could time-shift about 18 GWh of electricity per day, assuming a 20% round trip charging efficiency loss. Between 11 am and 7 pm we have eight hours of charging time so that load shift represents 2,250 MW of additional base-load demand to charge these vehicles with carbon-free generation. Electric car penetration will take many years because annual sales are slow. In 2014 only 5,000 electric vehicles were sold in Canada.
Some vehicles also allow the car battery to be used to supply power to the home. This potentially opens up the possibility of using car batteries to provide grid voltage control and other types of electrical support. However, there is insufficient data and experience to confirm this type of service will not shorten battery life. The batteries are a significant cost of the vehicle so consumers will be reluctant to allow the power system to use them for grid support if the battery life is adversely affected.
The charging time and rate for electrical vehicles needs to be managed as the number of electric vehicles increase. Toronto Hydro and California utilities have found that many people who own electric cars have range anxieties. They like to top off their batteries when they get home from work so they can go out later. This means the daily peak load created in part by dinner food preparation is being made worse by electric car charging. Fast chargers operating on 240 Volt Alternating Current (VAC) can use double the power of a typical central home air conditioner. This has serious implications not only for the overall power system but also for local transformer loads in residential areas. Managing the charging time and speed may become important in the future if several neighbours supplied by the same local transformer all have electric cars. Appropriate control and communication equipment standards for electric car chargers should help the local distribution company (LDC) protect local transformers from overload and avoid service interruptions. California utilities are currently investigating this issue and what to do about it.
Smart chargers with an appropriate signal from the power system operator can be used to ensure electric vehicles are preferentially charged at a rate the power system can support and during periods when carbon-free generation is available. It is important to remember that an electric vehicle is only emission-free if it is charged with carbon-free electricity. Charging electric car batteries with fossil-fueled electricity is not a low emission strategy.
22 Ontario Society of Professional Engineers

Hydrogen and the Power System
Hydrogen is a clean fuel that burns with oxygen to form water vapour. Hydrogen can be manufactured with carbon-free electricity through the electrolysis of water. Hydrogen can also be produced at high temperatures by methane and steam reforming to produce hydrogen and carbon dioxide. The carbon dioxide would be sequestered deep in the earth and the hydrogen would be sold as a carbon-free fuel substitute for fossil fuels.
Hydrogen produced by electrolysis provides us with a way to help manage our electric power system. One interesting application of hydrogen gas produced from electricity is to “green” the natural gas supply system. Because the natural gas system already has storage at strategic locations, the storage costs of hydrogen can be eliminated if hydrogen is blended into the natural gas that is flowing in the pipelines. The concept is being developed by Hydrogenics33 and is referred to as Power-to-Gas.
However, there are two challenges for the Power-to-Gas technology. The first challenge is economic. The cost of production is high because of the high retail price of off-peak electricity, and the low capacity of the electrolysis equipment if that equipment is only operated during off-peak periods. Making surplus carbon-free electricity available at its variable cost of production will help to make the technology economic.
The second challenge is technical. There is a limit on the amount of hydrogen that can be added to natural gas before a noticeable change in safety risk occurs. Studies have indicated 5% hydrogen has negligible effect on safety and concentrations of up to 20% may be acceptable.34
Ontario is conducting a pilot test of the Power-to-Gas technology but large-scale deployment will likely require some fundamental changes to electricity pricing and introduction of carbon pricing to make the technology economically viable.
33 For more on Hydrogenics, see http://hydrogenics.com.
34 For a report on the subject of blending hydrogen into natural gas pipeline networks, see: M. W. Melaina, O. Antonia, and M. Penev, Blending Hydrogen into Natural Gas Pipeline Networks: A Review of Key Issues (Golden: National Renewable Energy Laboratory, 2013), accessed February 19, 2016, http://www.nrel.gov/docs/fy13osti/51995.pdf.
Ontario’s Energy Dilemma: Reducing Emissions at an Affordable Cost 23

Based on the lessons learned in transitioning Ontario’s electrical system and analysis done by OSPE’s Energy Task Force presented in this report, including the Appendices, we can make a number of conclusions:
• Solutions in one jurisdiction may not be cost effective in another. Each jurisdiction is unique and new energy choices must be compatible with the local conditions and power system design to achieve affordable energy costs.
• In the short to medium term, natural gas will need to play a major role in reducing emissions by displacing fossil fuels in other sectors, at least until 2030 to 2050.
• Carbon-free energy sources will be needed to displace fossil fuels directly or to manufacture carbon neutral fuels if we want to achieve the long-term GHG emission reduction goals of 80% to 100% across the whole economy.
• It is much easier and less costly to reduce carbon emissions in the electricity sector than in other sectors because it has access to hydroelectric and nuclear energy.
• Ontario’s power system operates at an emission rate of about 40 grams carbon dioxide per kWh or about 1/10th that of the United States, Europe and China.
• The major contributor to Ontario’s impressive carbon reduction achievement was the restart of six base-load nuclear reactors shut down in the 1990s. Base-load nuclear plants are powerful GHG emission reducing machines but their lack of flexibility must be accommodated.
• Power systems that have high penetration of either hydroelectric or nuclear generation have the lowest GHG emissions.
CONCLUSIONS
24 Ontario Society of Professional Engineers

• Ontario’s power system uses inflexible carbon-free generation for a large fraction of its base-load supply and has limited tie-line capacity to other power systems. Consequently, adding large amounts of variable renewable capacity without storage creates a significant amount of surplus carbon-free electricity. That surplus when it cannot be exported to adjoining power systems is curtailed (wasted).
• Ontario currently has about 20% installed capacity of variable renewables relative to its peak annual demand. In 2014 the amount of surplus carbon-free energy exceeded 10 TWh and could have reduced emissions by over 2 million tonnes of carbon dioxide if it had been used in Ontario to displace fossil fuels in other sectors. Surplus carbon-free electricity will be available for the foreseeable future (more than 15 years) according to the IESO in the OAGO 2015 annual report.35
• Ontario’s electricity price plans were originally designed to reduce peak electrical demand supplied primarily from coal and natural gas generation. Following the transformation to 90% carbon-free generation, the price plans now are a barrier to effective use of surplus carbon-free electricity. Ontario’s electricity price plans do not incentivize consumers to use surplus carbon-free electricity to displace fossil fuel consumption in other sectors. These plans are not optimally designed for Ontario’s low emission power system.
• Ontario’s conservation program has successfully reduced demand but this ironically creates more surplus carbon-free electricity because Ontario’s power system has relatively little fossil fuel generation or storage capacity. In hindsight it would have been better to place a higher priority on ways to use the resulting surplus carbon-free electricity to displace fossil fuels in other sectors.
• New energy technologies need to be integrated in cost effective ways so that energy prices do not increase needlessly.
• Wind generation offers less GHG reduction value in Ontario because base-load generation is already carbon-free and wind generation often displaces hydroelectric and nuclear base-load generation. The value of wind generation would dramatically improve if we used the electricity it produces to displace fossil fuels in other sectors.
• Because of the large size and investments in current energy systems, the economic transition to carbon-free technologies will be slow and will be measured in decades not years.
• Surplus carbon-free electricity will economically displace fossil fuels used for thermal energy needs if it is offered at its variable cost of production.
• Electrical storage is still too expensive to help integrate more renewables into the electrical power system or to replace natural gas generation.
• Thermal storage offers a lower cost option compared to electrical storage to improve power system performance including better utilization of surplus carbon-free electricity.
35 Office of the Auditor General of Ontario, 2015 Annual Report (2015), 206-242.
Ontario’s Energy Dilemma: Reducing Emissions at an Affordable Cost 25

• Ontario should support continued R&D and commercial development of promising new technologies that help reduce GHG emissions and energy costs. However, large-scale deployment of any new technology in the energy sector should only be attempted when its anticipated production cost is competitive with other options. This is an important constraint because energy prices affect the price of all goods and services sold to consumers and also impact the competitive position of trade-exposed businesses operating in Ontario.
• The lack of detailed analysis on the impact of variable renewable generation on the power system before we embarked on the coal phase-out contributed to unnecessary costs and significant amounts of surplus carbon-free electricity.
• Electric vehicles can help flatten Ontario’s electrical demand profile and can effectively use Ontario’s surplus carbon-free electricity if we manage their charging period and/or charging rate.
• Natural gas-fired generation capacity is required to provide essential reliability services and to help integrate variable renewable generation into our energy systems.
• Ontario’s power system designers have found that to both minimize the overall cost of electricity and minimize GHG emissions it is better to use each technology to supply the load demand that best matches that technology’s production characteristics.
26 Ontario Society of Professional Engineers

The experience Ontario has had with transforming its electrical power system provides valuable lessons when implementing any carbon reduction program. Based on that experience and on the results of engineering analysis presented in this report, OSPE’s Energy Task Force makes the following recommendations:
• Ensure that economic and environmental analysis is undertaken and informed by detailed engineering studies for any proposed carbon reduction technology before implementation decisions are made
• Investigate how we can best incentivize the use of surplus carbon-free electricity to displace fossil fuels in other sectors
• Ensure appropriate technology-neutral, market-based price mechanisms are put into place so that the marketplace can independently develop GHG reduction solutions that are the most economically and environmentally efficient
RECOMMENDATIONS
Ontario’s Energy Dilemma: Reducing Emissions at an Affordable Cost 27

CANDU CCGT CCRE CETA CHP CO₂ EIA FIT G7 CH4 GHG GJ GW GWh IEA IESO IPCC J kW kWh LCOE LDC LED LTEP M.BTU MOECC MW MWh NOx NEB NRCan OAGO OEB OPA OPG OSPE R&D SCGT SBG SMR TOU TPP TW TWh US VAC
INDEX OF ABBREVIATIONS
Canadian Deuterium Uranium nuclear reactorCombined Cycle Gas TurbineCouncil for Clean and Reliable EnergyComprehensive Economy and Trade Agreement (with Europe)Combined Heat and Power plant (also a co-generation plant)Carbon DioxideEnergy Information Administration (US Department of Energy)Feed-In-Tariff (program to incent renewable generation)Group of 7 developed countriesMethane gas (natural gas)Greenhouse GasGigajoule (1 billion joules)Gigawatt (power flow quantity of 1 billion watts)Gigawatt-hour (energy quantity of 1 billion watts for 1 hour)International Energy AgencyIndependent Electricity System OperatorIntergovernmental Panel on Climate ChangeJoule (a measure of thermal energy in international units)kilowatt (1000 watts)kilowatt-hour (energy quantity of 1000 watts for 1 hour)Levelized Cost of ElectricityLocal Distribution Company (local electricity distributor)Light Emitting Diode (high efficiency lighting technology)Ontario Long Term Energy PlanMillions of British Thermal Units (a measure of thermal energy)Ministry of the Environment and Climate ChangeMegawatt (power flow quantity of 1 million watts)Megawatt-hour (energy quantity of 1 million watts for 1 hour)Compounds of Nitrogen and OxygenNational Energy BoardNational Resources CanadaOffice of the Auditor General of OntarioOntario Energy BoardOntario Power Authority (now part of IESO since Jan 2015)Ontario Power Generation Inc.Ontario Society of Professional EngineersResearch and DevelopmentSimple Cycle Gas TurbineSurplus Base-load GenerationSmall Modular ReactorsTime of Use electricity price planTrans-Pacific Partnership (trade agreement with Pacific nations)Terawatt (power flow quantity of 1 trillion watts)Terawatt-hour (energy quantity of 1 trillion watts for 1 hour)United States Volt Alternating Current (a measure of electrical strength)
28 Ontario Society of Professional Engineers

Ontario’s began to introduce cleaner alternatives to coal fired generation in the early 1970s. At that time the Hearn coal fired generating station in downtown Toronto was converted to use natural gas in an effort to reduce air pollution in the downtown area. Also at that time, a rapid buildup of nuclear generation began in the province and reached 20 commercial-sized reactors in the mid-1990s. By then, coal fired generating stations were mainly operating during the day to supply peak load demand. In 1994 Ontario had 61% of its electricity supplied by nuclear plants. In the second half of the decade, eight of the oldest reactors – four Pickering A and four Bruce A reactors – were shut down for repairs due to degraded equipment conditions that made unit operation uneconomic. Emissions rose dramatically as Ontario became dependent once again on coal fired generation for some of its base-load electricity supply. Emissions began to drop rapidly when six of the reactors were refurbished and returned to service over the subsequent 10 years beginning in 2003.
During the 1980s and 1990s, Ontario also installed air pollution reduction equipment to reduce sulfur dioxide and nitrous oxides from its coal fired plant emissions.
During the past 15 years the planning environment has been particularly volatile. Ontario was forced to change its energy plans repeatedly as a number of unexpected events transpired many beyond the control of provincial government. Some of the more important are:
• The refurbishment of the older nuclear plants beginning in the late 1990’s proved to be more costly and complex than originally planned. Eventually 2 of the Pickering reactors scheduled for refurbishment had to be retired permanently.
APPENDIX A THE HISTORY OF THE TRANSFORMATION OF ONTARIO’S POWER SYSTEM
Ontario’s Energy Dilemma: Reducing Emissions at an Affordable Cost 29

• The cost of variable renewable energy sources was falling rapidly especially for solar PV systems, due to heavy investment in renewable technologies by European countries.
• A severe global recession occurred in 2008-09 following the global financial crisis. Ontario lost significant manufacturing and resource sector capacity along with the associated electrical demand.
• Public concern was rising over the health impacts of pollution and climate change.
In 2003, the Ontario government decided to phase-out coal fired generation to eliminate particulate and heavy metal emissions for health reasons.
In the mid-2000s the Ontario government began to deploy variable renewable sources – primarily wind generation.
By 2009 Ontario decided to accelerate the deployment of renewable energy sources especially wind and solar generation and to incentivize manufacturers to locate plants in Ontario to build renewable energy systems. It passed the Green Energy and Green Economy Act in 2009 and introduced a Feed-In-Tariff (FIT) program with multi-year power purchase agreements that guaranteed payments for production. A rapid build-out of renewable energy capacity began.
A commitment was made to install about 7,500 MW of wind generation and about 2,400 MW of solar generation by 2016. This period was extended to 2021 in Ontario’s 2013 Long Term Energy Plan due to lower than planned electrical demand caused by:
• The global recession in 2008-09.
• A successful conservation program.
• Higher electricity prices from the transformation of the power system was encouraging energy efficiency.
• Higher efficiency products and processes were becoming available.
Ontario had a peak load demand of about 24,400 MW and an energy demand of 139 TWh in 2009. The wind and solar capacity commitment represented about 40% penetration based on peak load demand. Approximately 50% of the committed wind and solar capacity is now operating. About 40% of the installed capacity, mostly solar, is distributed in smaller sizes and connected to the distribution system (below 50 kV36), and 60% is centralized in large energy farms and connected to the high voltage transmission system (at or above 115 kV).
By 2015 Ontario’s nuclear reactors provided 60% of its electricity, hydroelectric provided 24%, wind, solar and bio-energy provided 6% and natural gas provided the remaining 10%. Ontario’s peak load demand in 2015 was lower than expected at 22,500 MW due to a cooler summer. The annual energy demand was also lower than expected at 137 TWh.
36 kV refers to kilovolts or thousands of volts.
30 Ontario Society of Professional Engineers

Ontario’s electricity supply is now 90% carbon-free, with an overall operating emission rate of about 40 grams carbon dioxide per kWh. This is approximately 1/10th the average emission rate of power systems in the US, Europe and China, and is 80% below Ontario’s electricity sector GHG emission levels in 1990.
By 2010 Ontario’s power system engineers realized that many of the technologies that were being incentivized by the transformation program were not compatible with the design and supply mix of the existing power system. On September 1, 2010, OSPE approached the Minister of Energy about its concerns. The Minister asked OSPE to prepare engineering recommendations covering its concerns about nuclear and wind generation.37 The first report on March 8, 2011 covered nuclear generation.38 The second report on March 14, 2012 covered wind generation. The Ministry implemented many of OSPE’s recommendations over the subsequent three years.
OSPE also had an opportunity on March 9, 2011 to make a submission to the OEB on its concerns related to the design of the time of use (TOU) electricity price plan.39 The TOU price plan was not sufficiently incentivizing consumers to use more base-load energy (more load at night). With the rapid increase in both nuclear and wind capacity, if base-load did not rise, carbon-free generation would have to be curtailed (wasted).
OSPE’s views of what the TOU price plan should look like have evolved over the past four years as conditions on the power system changed. As variable renewable capacity increased it becameobvious that the peak reduction features of the TOU rate plan was interfering with the need for consumers to use variable renewable energy when it was produced even if it arrived at peak hours. OSPE has continued its discussions with the staff at the MOE, MOECC and OEB to encourage them to consider smart pricing plans that reflect Ontario’s specific supply mix and needs. A summary of OSPE’s current thinking is included in a June 2015 seminar titled “A Smart Grid Electricity Price Plan.”40
Ontario transitioned away from coal generation in a span of only 12 years from 2003 to 2014.41 Unfortunately, to be first to achieve such rapid results has been costly. Ontario’s electricity rates have increased rapidly over the past 12 years moving from among the lowest cost electricity jurisdictions in Canada to among the highest, as reported by an annual Hydro Quebec survey.42
37 Ontario Society of Professional Engineers, Ontario Electrical Grid and Project Requirements for Nuclear Plants (Toronto: Ontario Society of Professional Engineers, 2011).
38 Ontario Society of Professional Engineers, “Wind and the Electrical Grid.”
39 Ontario Society of Professional Engineers, Time of Use Rates: Let’s Use Smart Meters in a Smart Way Ontario Society of Professional Engineers, 2011), accessed February 19, 2016, https://www.ospe.on.ca/public/documents/advocacy/submissions/2011-smart-metres.pdf.
40 Ontario Society of Professional Engineers Energy Task Force, “A Smart Grid Electricity Price Plan,” (presented at an OSPE Energy Seminar in Toronto, Ontario, June, 2015).
41 Ministry of Energy, “Ontario’s Long-Term Energy Plan.”
42 Hydro Quebec, Comparison of Electricity Prices in Major North American Cities (Hydro Quebec, 2015), accessed February 19, 2016, http://www.hydroquebec.com/publications/en/docs/comparaison-electricity-prices/ comp_2015_en.pdf.
Ontario’s Energy Dilemma: Reducing Emissions at an Affordable Cost 31

For base-load electricity demand the most effective way to reduce GHG emissions is to use nuclear generation. Nuclear reactors operate 24 hours a day and they have high capacity factors of typically 85 to 90% for the year. That means for each MW of installed capacity, nuclear units can reduce GHG emissions much more than most other carbon-free energy sources. In Ontario, on a per MW installed basis, nuclear generation lowers GHG emissions 1.7 times more than hydroelectric, 2.6 times more than wind, and 6 times more than solar if we do not curtail their output.
GHG emission reductions in the electricity sector are technically easier to accomplish compared to other sectors. The electricity sector has access to hydroelectric and nuclear energy that are not easily available to other sectors. These are carbon-free technologies that do not require expensive storage for dependable 24-hour-a-day operation.
Table A-1 identifies the 2012 energy sources that were used to make grid-supplied electricity. Electrical systems with high penetration of either hydroelectric or nuclear energy have the lowest GHG emissions. Ontario has high nuclear penetration. Canada has high hydroelectric penetration. Both have much lower GHG emissions in their electricity sector than either the US or the world as a whole.
TABLE A-1Energy Source for Grid Supplied Electricity43
Fuel Source
Canada2012
Ontario2012
US2012
World 2012
Coal 9.5% 2.8% 38.6% 40.4%
Oil 0.5% 0.8% 0.5% 5.0%
Natural Gas 11.0% 14.6% 29.2% 22.5%
Renewables* 64.5% 25.4% 11.9% 21.2%
Nuclear 14.5% 56.4% 19.8% 10.9%
grams CO₂/kWh 141 109 469 490
* Renewables include hydroelectric, wind, solar and sustainable biofuels.
43 Ontario Society of Professional Engineers Energy Task Force, “Straight Talk on Energy Challenges: Canada, USA, World.” Data sources: Natural Resources Canada, “Energy Markets Fact Book 2014-2015,” 2014, http://www.nrcan.gc.ca/sites/www.nrcan.gc.ca/files/energy/files/pdf/2014/14-0173EnergyMarketFacts_e.pdf; Independent Electricity System Operator, “Supply Overview,” accessed March 1, 2016, http://www.ieso.ca/Pages/ Power-Data/Supply.aspx; U.S. Energy Information Administration, “Table 7.2b Electricity Net Generation: Electric Power Sector,” accessed March 2, 2016, http://www.eia.gov/totalenergy/data/monthly/pdf/sec7_6.pdf; International Energy Agency, “Key World Energy Statistics,” 2014, p. 24; and William Moomaw et al. “2011: Annex II: Methodology,” in IPCC Special Report on Renewable Energy Sources and Climate Change Mitigation, Ottmar Edenhofer et al. (Cambridge: Cambridge University Press, 2014), accessed March 2, 2016, http://srren.ipcc-wg3.de/report/ IPCC_SRREN_Annex_II.pdf.
32 Ontario Society of Professional Engineers

The Ontario government was able to accomplish an 80% emission reduction from 1990 levels in the electricity sector over a relatively short 12-year period from 2003 to the end of 2014 because of the following special factors:
• Ontario made extensive use of nuclear energy by restarting six existing nuclear reactors.
• Ontario replaced its coal plants with natural gas fired plants. The International Institute for Sustainable Development (IISD) pointed out in its report44 that this was easier than other jurisdictions because the Ontario government had public and all party political support, it owned all of the coal fired plants, there was no coal mining industry in Ontario to mount political opposition and several private sector companies were used to design, build and operate the new gas fired plants under long-term power purchase agreements.
• Ontario retail electricity rates are controlled and regulated centrally by the provincial government so electricity rates could be adjusted to pay for the energy transition. That transition also included significant amounts of new wind and solar capacity and to a lesser extent bio-energy, Combined Heat and Power (CHP)45 and additional hydroelectric capacity.
44 International Institute for Sustainable Development, The End of Coal: Ontario’s Coal Phase-out (Winnipeg: The International Institute for Sustainable Development, 2015), accessed February 19, 2016, https://www.iisd.org/sites/ default/files/publications/end-of-coal-ontario-coal-phase-out.pdf.
45 Combined Heat and Power (CHP) facility is also known as a cogeneration facility.
Ontario’s Energy Dilemma: Reducing Emissions at an Affordable Cost 33

A fundamental misunderstanding that many people have is that energy technologies can be compared using the unit energy contractual price in cents/kWh. The contractual and levelized cost of electricity are typically the same provided any curtailment of the plant’s production is included in both. However, not all curtailment is included in Ontario’s contractual unit energy prices. In addition there is a different cost to integrate each technology into the power system. If we want to compare the technologies using their levelized (lifetime) cost of electricity in cents/kWh we must include the cost to integrate those plants into the power system. Those costs are quite different for each technology, and will depend on:
• whether the plant supplies base-load or peak load demand
• whether that plant’s production characteristics will cause additional curtailment of other sources that have guaranteed (take or pay) contracts
• the amount of tie-line capacity with adjoining power systems
• the existing mix of generation resources in the power system
• the effectiveness of how transmission and distribution capacity are used
Table B-1 below shows the projected levelized cost of electricity in 2020 from each technology. Table B-1 also identifies the impact on the cost of electricity as the carbon price increases from $0 to $200 per tonne of carbon dioxide. As discussed above, comparisons of cost should only be made between technologies with equivalent production characteristics or alternatively the additional integration costs should also be included in the comparisons.
APPENDIX B THE COST OF PRODUCING ELECTRICITY
34 Ontario Society of Professional Engineers
A few comments are required to ensure the data in Table B-1 is interpreted and applied correctly:
• The natural gas price used in Table B-1 is the US-EIA projected Henry Hub46 price of $5.54 US/M.BTU) in 2020. That means an Ontario plant will pay about $8.2 CAN/M.BTU at the burner face due to adjustments to reflect historical Ontario gas delivery surcharges and the long-term US/CAD exchange rate of $0.87 US/CAN. However, if gas prices are higher or lower, the data in Table B-1 should be adjusted up or down as indicated in footnote 51.
• Hydroelectric and bio-energy plants have not been included in Table B-1 because their additional economic capacity is limited in Ontario. Large scale (multi-GW) purchases of hydroelectric capacity from Quebec and Manitoba is currently not possible due to limited transmission tie-line capacity.47
• Natural gas-fired generation comes in various configurations but the two most popular with power utilities are Combined Cycle Gas Turbine power plant (CCGT) and Simple Cycle Gas Turbine power plant (SCGT). Of the two, CCGT plants have higher efficiency, slower power ramp rates, higher minimum loads and higher capital cost. CCGT plants are usually better suited for base-load demand 24 hours a day. SCGT plants are usually better suited to supply the daytime peak demand and the summer/winter critical peak demand. Both plant types can provide backup for renewables, but SCGT plants are better suited for this greater flexibility. Also both types of plants can supply either base-load or peak load demand. Which role they play is dependent on the gas fuel price. When gas prices are high enough (above about $10 CAD/M.BTU) the higher efficiency CCGT plants can overcome their higher capital costs and economically supply the peak load. This is illustrated in Table B-1 when we increase fossil fuel costs by imposing carbon prices greater than $30/tonne carbon dioxide.
• Nuclear generation is best suited to supply base-load demand. They are high capital cost plants so their economics is best if they run 24 hours a day. Nuclear plants can be modified to operate at lower powers during low demand periods like nights and weekends but their cost per delivered kWh would increase as we curtail the production. Since the power system has base-loads that run 24 hours a day, nuclear plants and hydroelectric plants have traditionally supplied that base-load power in Ontario. During high demand seasons like the hottest summer months or coldest winter months coal-fired plants (in the past) and natural gas plants (now) supply any additional base-load demand required for a few weeks during those two high demand seasons.
• Wind generation produces energy both at night and during the daytime. It is best suited to displace natural gas generation that supplies base-load demand round the clock. However, wind generation cost in cents/kWh cannot be compared directly with gas generation costs on a cents/kWh. Wind generation output is variable and requires backup when there is no wind. Province wide production data is now available for wind generation and about 90% of the installed capacity of wind in Ontario needs to be backed up. The cost of that backup is not included in Table B-1.
46 The Henry Hub is one location in the North America where the price of gas is set. Natural gas prices on the New York Mercantile Exchange (NYMEX) are based on delivery at the Henry Hub. The Henry Hub is in Erath, Louisiana and has access to many of the major gas markets in the United States.
47 Independent Electricity System Operator and the Ontario Power Authority, “Review of Ontario Interties,” October 14, 2014, accessed February 16, 2016, http://www.ieso.ca/Documents/IntertieReport-20141014.pdf.
Ontario’s Energy Dilemma: Reducing Emissions at an Affordable Cost 35

• Solar Photovoltaic (Solar PV) generation produces energy during the daytime. It is best suited to displace natural gas generation during the daytime. However, solar PV generation cost in cents/kWh cannot be compared directly with gas generation costs on a cents/kWh. Solar PV output is variable and requires backup when there is no sun. Province wide production data is not yet available for solar generation to determine the amount of backup required. The cost of that backup is not included in Table B-1.
TABLE B-1 Levelized (Lifetime) Cost of Electrical Energy in Ontario in cents/kWh
in 2020 for Projected Natural Gas Prices48
49505152
Technology Ontario Capacity Factor
Existing Ontario Plants49
New Plants in
2020 with $0/Tonne of CO₂50
New Plants
in 2020 with $30/
Tonne of CO₂
New Plants
in 2020 with $90/
Tonne of CO₂
New Plants in
2020 with $150/Tonne of CO₂
New Plants in
2020 with $200/Tonne of CO₂
Gas-Base Load (CCGT)51 87% n/a 9.8 11.0 13.4 15.9 17.9
Gas-Base Load (CCGT)51 17% 12.7 18.3 19.6 22.0 24.5 26.5
Gas-Base Load (SCGT)51 17% n/a 17.7 19.5 23.2 26.8 29.8
Nuclear-Base Load (Gen III+)
87% 6.6 11.0 11.0 11.0 11.0 11.0
Wind52 33% 12.5 8.9 8.9 8.9 8.9 8.9
Solar PV (microfit)52 14% 29.4/80.2 16.2 16.2 16.2 16.2 16.2
Solar PV (<10 MW)52 14% 20.9-44.3 10.5 10.5 10.5 10.5 10.5
48 U.S. Energy Information Administration, “Levelized Cost and Levelized Avoided Cost of New Generation Resources in the Annual Energy Outlook 2015,” in Annual Energy Outlook 2015, June 3, 2015, accessed February 16, 2016, http://www.eia.gov/forecasts/aeo/electricity_generation.cfm. Hydroelectric and bio-energy are not listed in this table because Ontario does not have sufficient economic capacity to supply a substantial portion of its electricity needs with those energy sources.
49 Existing plant cost data is courtesy of the Ontario Energy Board at: Ontario Energy Board, “Regulated Price Plan Price Report: May 1, 2015 to April 30, 2016,” April 20, 2015, accessed March 2, 2016, http://www.ontarioenergyboard.ca/oeb/_Documents/EB-2004-0205/RPP_Price_Report_May-2015_20150420.pdf.
50 US-EIA LCOE data adjusted using Ontario capacity factors, 1.7% inflation from 2013 to 2020, Canadian dollar at 0.87 US dollar, natural gas fuel at 5.54 $US/M.BTU at Henry Hub and 8.2 $CAN/M.BTU at the bumer face. Base-load gas plants are CCGT at 7,667 BTU/kWh, peak load gas plants are SCGT at 11,371 BTU/kWh.
51 Each $1/M.BTU gas price increase raises electricity cost by 0.77 cents/kWh for CCGT plants and 1.14 cents/kWh for SCGT plants. Cost shown for Ontario peak load plants is a blend of mainly CCGT and some SCGT plants.
52 High penetration of wind and solar generation require back up. To achieve zero operating emissions wind and solar must be backed up by zero emitting sources or by storage at an additional cost not shown above.
36 Ontario Society of Professional Engineers

With the cautionary information above in mind, we can see from Table B-1 that new base-load nuclear plants are expected to be competitive with new base-load CCGT plants in 2020 if carbon prices exceed $30/tonne of CO₂.
The price of natural gas reached a 13 year low in December 2015 at below $2 US per M.BTU at the Henry Hub in the US. Ontario natural gas is stored at the Dawn Hub near Chatham, Ontario. That Henry Hub price will be equivalent to $3.4 CAN per M.BTU when gas is delivered to the burner face of Ontario power plants at the long term average exchange rate of $0.87 US/CAN. Table B-2 illustrates the impact of that very low natural gas price if it persisted into 2020.
TABLE B-2 Levelized (Lifetime) Cost of Electrical Energy in Ontario in cents/kWh
in 2020 for Very Low Natural Gas Prices
5354555657
Technology53 Ontario Capacity Factor
Existing Ontario Plants54
New Plants in
2020 with $0/Tonne of CO₂55
New Plants
in 2020 with $30/
Tonne of CO₂
New Plants
in 2020 with $90/
Tonne of CO₂
New Plants in
2020 with $150/Tonne of CO₂
New Plants in
2020 with $200/Tonne of CO₂
Gas-Base Load (CCGT)56 87% n/a 6.1 7.4 9.8 12.2 14.3
Gas-Base Load (CCGT)56 17% 12.7 14.7 15.9 18.4 20.8 22.9
Gas-Base Load (SCGT) 56 17% n/a 12.3 14.1 16.0 21.4 24.4
Nuclear-Base Load (Gen III+)
87% 6.6 11.0 11.0 11.0 11.0 11.0
Wind57 33% 12.5 8.9 8.9 8.9 8.9 8.9
Solar PV (microfit)57 14% 29.4/80.2 16.2 16.2 16.2 16.2 16.2
Solar PV (<10 MW)57 14% 20.9-44.3 10.5 10.5 10.5 10.5 10.5
53 Hydroelectric and bio-energy are not listed in the table above because Ontario does not have sufficient economic capacity to supply a substantial portion of its electricity needs with those energy sources.
54 Existing plant cost data is courtesy of the Ontario Energy Board at: Ontario Energy Board, “Regulated Price Plan Price Report.”
55 US-EIA LCOE data adjusted using Ontario capacity factors, 1.7% inflation from 2013 to 2020, Canadian dollar at 0.87 US dollar, natural gas fuel at 2.0 $US/M.BTU at Henry Hub and 3.4 $CAN/M.BTU at the bumer face. Base-load gas plants are CCGT at 7,667 BTU/kWh, peak load gas plants are SCGT at 11,371 BTU/kWh.
56 Each $1/M.BTU gas price increase raises electricity cost by 0.77 cents/kWh for CCGT plants and 1.14 cents/kWh for SCGT plants. Cost shown for Ontario peak load plants is a blend of mainly CCGT and some SCGT plants.
57 High penetration of wind and solar generation require back up. To achieve zero operating emissions wind and solar must be backed up by zero emitting sources or by storage at an additional cost not shown above.
Ontario’s Energy Dilemma: Reducing Emissions at an Affordable Cost 37

Natural gas at $2 US/M.BTU at the Henry Hub in the US renders all carbon-free sources of electricity uneconomic unless we impose significant carbon prices or we provide significant subsidies for carbon-free sources of electricity.
• Carbon prices would need to rise to over $100/tonne before nuclear plants are competitive with base-load CCGT plants.
• If storage was free and 100% efficient (which of course it is not):
•Wind would not be competitive with base-load CCGT plants until carbon prices exceeded $70/Tonne.
•Ground-based solar PV up to 10 MW size would not be competitive with base-load CCGT plants until carbon prices exceeded $100/tonne.
• Small roof-top solar PV systems would not be competitive with peak load SCGT plants until carbon prices exceeded $100/tonne or with base-load CCGT plants until carbon prices exceeded $250/tonne.
38 Ontario Society of Professional Engineers
Renewable Energy
Ontario’s renewable energy generation sources are hydroelectric, wind, solar and bio-energy. In energy terms, in 2014 they provided 24%, 4%, <1% and <1%, respectively of the high voltage power system’s production. The wind and solar PV capacity that is installed in the lower voltage distribution system and not included in the above data produced an additional 1% and 2% respectively of our electricity in Ontario.
Wind and solar energy are variable sources so they present special challenges to integrate into the electrical power system where dependability is a key performance expectation of consumers. Wind and solar generation require backup when they do not produce. Also if we install too much variable capacity without storage, it will compete with other forms of carbon-free generation and result in curtailment (waste). Consequently, until low cost storage becomes available we need to manage the installed capacity of variable renewable generation carefully to avoid curtailing too much of their output.
Off-grid applications are a special case where renewables can currently be installed economically. The reason is that off-grid communities use diesel to produce their electricity. Diesel is a high GHG emitting energy source. Also the high cost of delivering diesel to off-grid remote communities results in electricity costs (before subsidies) that can range from about 50 to 200 cents/kWh in Ontario. In that situation wind generation with modest amounts of storage can be an economic alternative to diesel generation and reduces GHG emissions significantly. The Ontario government recently recognized this opportunity and has included deployment of variable renewables in off-grid applications in their 2013 Long Term Energy Plan.58
58 Ministry of Energy, “Ontario’s Long-Term Energy Plan.”
APPENDIX C LOW CARBON TECHNOLOGIES FOR ONTARIO’S POWER SYSTEM
Ontario’s Energy Dilemma: Reducing Emissions at an Affordable Cost 39

The variability of wind and solar energy systems is not a major problem in power systems that use significant amounts of fossil fuels because the back-up is inherently available. Ontario does not use much fossil fuel to make electricity. Only 10% of energy production in both 2014 and 2015 was from natural gas-fired generation. However, if electricity was used to displace fossil fuels in other sectors, additional capacity of wind and solar generation could be accommodated on the Ontario electrical power system without creating curtailment (waste). To enable this to happen, however, we need to change the way electricity is priced when it is used to displace fossil fuel consumption in other sectors.
Nuclear Energy
Ontario’s largest source of electrical energy is nuclear at 62% and 60% of the total in 2014 and 2015 respectively. This energy is carbon-free. Reactors supply the base-load demand (the constant demand 24 hours a day). Ontario uses Canadian Deuterium Uranium (CANDU) reactors developed in Canada. They have unique design features that make them among the safest reactors in the world. These include:
• Use of natural uranium fuel with heavy water moderator and coolant. The reactors are incapable of restarting after a major loss of coolant accident because the heavy water is downgraded by injection of ordinary water by the emergency cooling system.
• On-line refueling at full power. The reactor does not carry a significant amount of excess reactivity (excess fuel) during its normal operation because fueling occurs daily at full power using specially designed fueling machines.
• Ontario reactors use vacuum containment. In the event of a loss of coolant accident the radioactive fluids are sucked into the vacuum building for a period of time following the accident.
• The reactors are extensively monitored and controlled by fault tolerant redundant computer systems.
The Bruce Power units have been modified to lower their electrical output from 100% full power to 65% daily while the reactor continues to operate at full power. The unused steam is discharged to the condensers where the heat is rejected to the lake. Reducing the electrical output allows the nuclear plant to accommodate increasing output from solar and wind generation when the electrical demand is insufficient to utilize all the available sources of carbon-free energy. However, by curtailing its electrical output we increase the cost per kWh of the electricity it supplies to the power system.
The Darlington reactors will be modified during their refurbishment program so they can also change their electrical output daily. The Pickering reactors cannot be easily modified so they will not participate in electrical power output changes on a daily basis.
Nuclear reactors could be made more flexible but their high fixed costs means that they are more economic if they are operated continuously at high power. That is why nuclear plants usually supply the base-load (the steady 24-hour a day) demand.
40 Ontario Society of Professional Engineers

Nuclear plants operate at lower temperatures than coal and natural gas plants so their thermal to electrical conversion efficiency is relatively low at between 25 and 35% depending on the design. That means their thermal output or steam could be more efficiently used if that steam was directly supplied to industrial or building thermal loads. Currently that is not done because of the large distances between nuclear plants and industrial and building loads. The exception was the Bruce nuclear site that had large industrial and building loads on the site for heavy water production until the 1990s.
During the 1970s to the 1990s Bruce site had one of the largest district heating systems in the world powered by the four Bruce A reactors. The Bruce site had limited transmission capacity at that time and the unused nuclear plant capacity was repurposed to supply steam to the site facilities. The steam was used at the heavy water plants for process heating, at site buildings for their hot water and space heating needs and at the Bruce Energy Centre for greenhouses and other commercial operations. The nuclear powered district energy system contributed to a major reduction in fossil fuel use at the site. The facility also saved Ontario Hydro hundreds of thousands of dollars per day in fuel costs because nuclear fuel was less than 1/10th the cost of fossil fuel. The facility was retired after the Bruce Power A reactors were shut down for repairs and the heavy water plants were decommissioned in the latter 1990s.
The Ontario government was planning to retire the Pickering reactors in 202059 but recently announced they would extend their operation to 2024. The Pickering reactors will not be replaced with new nuclear reactors. The nuclear contribution to the energy supply is being lowered to make room for more wind and solar generation. Because wind and solar generation use gas-fired backup, when the Pickering reactors are retired, GHG emissions in the electricity sector in Ontario will almost double. That is the unfortunate mathematical result of moving away from nuclear energy before low cost efficient storage technologies become available to back up wind and solar generation with zero emitting electricity.
Current nuclear plants enjoy preferential treatment for accident insurance coverage because they are not required by law to carry more than 1 billion dollars of private insurance for third party liability. Many opponents of nuclear energy point to that fact as proof that nuclear plants are unsafe. However, the actual safety data for large-scale energy producing technologies show that nuclear plants have the least number of fatalities or serious injuries per TWh of delivered energy by a significant margin.60
The private insurance industry is currently unable to offer very large coverage for reactor accidents at realistic rates because the insurance pool of operating reactor sites is not sufficiently large to support a competitive insurance market. If society wants to benefit from ampleamounts of carbon-free base-load electricity at rates comparable to today’s electricity prices it will be necessary for governments to continue to self-insure nuclear power plants beyond the billion dollar coverage that the private sector can provide at reasonable terms.
59 Ibid.
60 For comparative accident data, see World Nuclear Association, “Safety of Nuclear Power Reactors,” August 2015, accessed March 2, 2016, http://www.world-nuclear.org/info/safety-and-security/safety-of-plants/safety-of-nuclear- power-reactors.
Ontario’s Energy Dilemma: Reducing Emissions at an Affordable Cost 41

It is also important to note that nuclear reactors that have operated with a good safety culture at the site in compliance with industry standards and subject to effective independent regulatory oversight have operated throughout their lifetime without any major accidents. Maintaining a good safety culture at the reactor site and having independent regulatory oversight is key to ensuring safe reactor operation.
Nuclear R&D is continuing around the world to improve the cost and safety of nuclear reactors. New Generation III reactors such as the CANDU EC6 are now available that are safer than existing Generation II reactors. A number of companies are developing what are called Generation IV Small Modular Reactors (SMRs).61 Some of the more advanced designs can be mass-produced in a factory and shipped to a site fully assembled (except for their fuel) by truck or train. They are passively safe because they shut themselves down if they get too hot. They don’t require human intervention to remove the decay heat after shutdown. They are more flexible with respect to power output changes than current reactor designs. They operate at much lower pressures than current reactors. They consume their own long-lived radioactive transuranic wastes so their radioactive wastes decay to the same radioactivity level as natural uranium in about 400 years instead of the current 400,000 years. They also consume fuel more efficiently than present dayreactors so their spent fuel waste volume can be as low as only 1% of present reactors.
These characteristics make SMRs potentially benign enough that they can be located closer to industrial loads and communities so they can economically provide carbon-free thermal energy in the form of hot water and steam directly to industry and communities at less than half the cost of supplying that energy as electricity.
Unfortunately, to achieve these impressive benefits, the spent fuel for SMR’s must be processed and recycled back into the reactor to consume those long-lived radioactive isotopes. Currently, fuel reprocessing in North America is not permitted for commercial reactors out of concerns about diversion of nuclear materials. Policy changes and appropriate security and regulatory oversight will be required to allow these advanced reactors to be built in North America. SMRs, therefore, are not a near term solution to reduce GHG emissions because their commercial development and associated policy and other changes are likely to take 20 years followed by the deployment phase. SMRs can however play a role to meet the IPCC and G7 longer-term GHG reduction goals beyond 2050 if our political leaders are prepared to fund the development work now.
In the longer term we hope researchers are successful in discovering the secret to commercial fusion reactors. However, we should not wait for a solution to this difficult problem. We can build safe fission reactors to meet our near term GHG reduction goals now and when fusion is commercialized we can switch from fission reactors to fusion reactors. Alternatively, if low cost efficient storage technologies are developed we can switch from fission reactors to variable renewables with storage for our base-load energy needs.
61 Generation IV SMR are Small Modular Reactors that have improved safety and reduced waste production characteristics compared to present day (Generation III) reactors.
42 Ontario Society of Professional Engineers

Since climate change concerns appear to be intensifying it would seem prudent not to discard any promising nuclear energy technology that can produce abundant amounts of carbon-free energy for centuries.
Electrical Storage
If low cost and efficient electrical storage become available in the future, variable renewable sources could be more extensively used. Unfortunately, storage is currently very expensive at the present time and most of the storage technologies are not particularly efficient.
The cheapest short-term storage (less than a few hours) is battery storage. Power system qualified battery storage is currently about $1,000/kWh in capital cost. Six hours of storage would therefore cost $6,000 per kW. Large wind turbines cost about $2,000 per kW. Solar PV systems cost about $3,500 to $5,000 per kW depending on the size and design. Appendix D presents some analysis to show that about 5 or 6 hours of storage at the full rating of the generation facility is needed to match the production of variable renewables with the power system demand profile over periods of only 1 week. That means load matching using battery storage, over individual weekly periods, would increase the capital cost of wind generation to $8,000 per kW (quadruple), and solar generation to $9,500 to $11,000 per kW (more than double).
Battery innovation will continue and costs will drop. Tesla’s CEO has suggested its Gigafactory in Nevada, US will achieve cost reductions of 30% when it is fully operational in 2020.62 That means battery storage will continue to be uneconomic for power system applications for all but the shortest storage applications (less than 1-hour storage) for many years.
Variable renewables require long storage periods to fully utilize the energy from the seasonal variations in their output. Ontario’s electrical demand profile combined with limited tie-line capacity to other power systems would require very large amounts of storage to provide year-round dependable energy using only variable renewable sources. The exact amount of storage would depend on the mix of solar and wind generation. For these large storage periods, pumped hydroelectric storage is currently the lowest cost technology with a capital cost of about $7,500/kW. However, you must have suitable geography available for the two large storage ponds and the local population must be supportive of the facility. Pumped hydroelectric storage is mature technology and its price is unlikely to fall significantly in the future.
Research and development efforts will improve the economics of new storage technologies over time. OSPE is therefore supportive of R&D efforts and testing of small pilot installations to develop experience and improve the technologies. However, deployment of large amounts of long-term electrical storage in the near future is premature and will drive up electricity costs unnecessarily.
62 Peter Maloney, “Tesla shifts production to its Gigafactory to accommodate Powerwall demand, Utility Drive, January 26, 2016, accessed February 19, 2016, http://www.utilitydive.com/news/tesla-shifts-production-to-its-gigafactory-to- accommodate-powerwall-demand/411985.
Ontario’s Energy Dilemma: Reducing Emissions at an Affordable Cost 43

Thermal Storage
Thermal storage is usually much less expensive than electrical storage. There are various technologies available ranging from solids (bricks), liquids (water), phase change devices (water-ice or molten salts) and hygroscopic materials that can repeatedly absorb and release energy using absorption or adsorption processes.
Where electricity can provide the thermal energy we need, we can use thermal storage to improve power system performance. We can shift the load demand to when carbon-free electricity supply is available and store it as thermal energy for later use. That reduces the amount of gas-fired generation needed later in the day.
For example, air conditioning is provided by refrigeration equipment operating on electricity. Buildings inherently have thermal storage in the concrete, drywall and steel in their construction and objects in the building. If we were to allow some temperature cycling, for example, by pre-cooling the space before the daily peak load, we could effectively shift some of the peak air conditioning load to an earlier period when either carbon-free base-load generation or variable renewable generation was surplus. This can be accomplished using a smart thermostat or smart load controller at an installed cost of only about $500. The controller would need an appropriate signal from the power system operator indicating when surplus carbon-free energy was available.
Figure C-1 shows actual data demonstrating the load shift that was achieved using a “peak saver plus” programmable thermostat by pre-cooling a house at midnight by only 3°F temperature. The thermostat did not have fractional degree control capability. A 3°F shift was used rather than 2°C because the residents found a 2°C shift was uncomfortable. The pre-cooling reduced the amount of air-conditioning required during the daytime peak load period and reduced the house electrical load by about 0.5 kWh each hour during the day. GHG emissions would be reduced by 2 kg carbon dioxide per cooling day if that load was supplied by carbon-free generation rather than gas-fired peak load generation.
44 Ontario Society of Professional Engineers
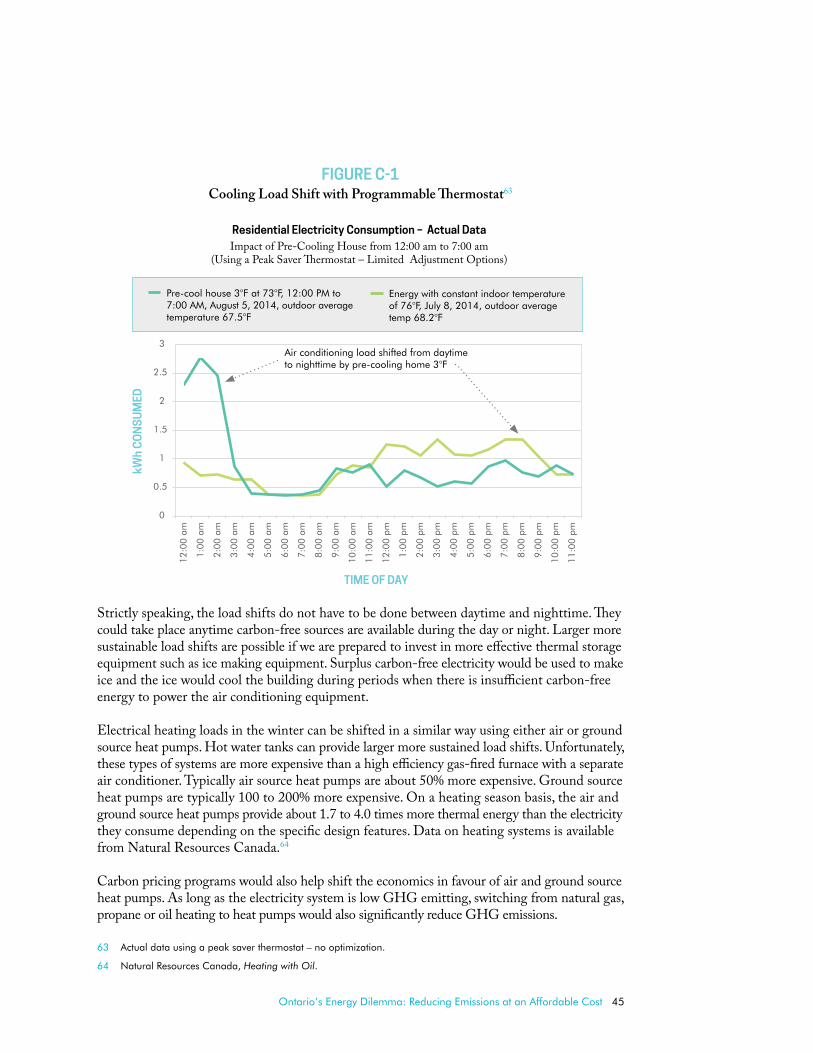
FIGURE C-1Cooling Load Shift with Programmable Thermostat63
Strictly speaking, the load shifts do not have to be done between daytime and nighttime. They could take place anytime carbon-free sources are available during the day or night. Larger more sustainable load shifts are possible if we are prepared to invest in more effective thermal storage equipment such as ice making equipment. Surplus carbon-free electricity would be used to make ice and the ice would cool the building during periods when there is insufficient carbon-free energy to power the air conditioning equipment.
Electrical heating loads in the winter can be shifted in a similar way using either air or ground source heat pumps. Hot water tanks can provide larger more sustained load shifts. Unfortunately, these types of systems are more expensive than a high efficiency gas-fired furnace with a separate air conditioner. Typically air source heat pumps are about 50% more expensive. Ground source heat pumps are typically 100 to 200% more expensive. On a heating season basis, the air and ground source heat pumps provide about 1.7 to 4.0 times more thermal energy than the electricity they consume depending on the specific design features. Data on heating systems is available from Natural Resources Canada.64
Carbon pricing programs would also help shift the economics in favour of air and ground source heat pumps. As long as the electricity system is low GHG emitting, switching from natural gas, propane or oil heating to heat pumps would also significantly reduce GHG emissions.
63 Actual data using a peak saver thermostat – no optimization.
64 Natural Resources Canada, Heating with Oil.
kWh
CO
NS
UM
ED
TIME OF DAY
Air conditioning load shifted from daytime to nighttime by pre-cooling home 3°F
Energy with constant indoor temperature of 76°F, July 8, 2014, outdoor average temp 68.2°F
Pre-cool house 3°F at 73°F, 12:00 PM to 7:00 AM, August 5, 2014, outdoor average temperature 67.5°F
Residential Electricity Consumption – Actual DataImpact of Pre-Cooling House from 12:00 am to 7:00 am
(Using a Peak Saver Thermostat – Limited Adjustment Options)
Ontario’s Energy Dilemma: Reducing Emissions at an Affordable Cost 45

Load shifting during the spring and autumn is more difficult because there is relatively little demandfor cooling or heating during those seasons. However, we can do some modest load shifting with electric hot water tanks and food freezers if they had a smart controller capability that allows them to be operated preferentially during periods when surplus carbon-free energy is available.Industrial and commercial thermal loads exist all year round so these can be supplied by carbon-free electricity year round if we wanted to displace their fossil fuel use.
Natural Gas and Its Special Role in a Low Emission Power System
Natural gas-fired plants provide several essential services required for reliable electricity supply, including:
• Spinning and standby reserve for sudden forced outages.
• Contingency reserve for unplanned outages and for extreme weather impacts on hydroelectric, wind and solar generation.
• Short and medium term planning contingencies for unplanned growth.
• System restoration following a blackout.
• Management of fast power imbalances between supply and demand especially if variable renewable sources represent a significant portion of the generation resources.
Ontario does not have sufficient hydroelectric storage capability to replace natural gas for those essential services. Also low cost efficient electrical storage is not yet commercially available to displace gas-fired generation.
Natural gas-fired plants are currently the most cost effective way to provide those essential services because:
• high capacity factors are not required to provide those services
• capital and labour costs are modest relative to other energy sources
• natural gas fuel prices are low in Ontario.
GHG emissions from an overall power system perspective will be modest (less than 40 kg of carbon dioxide per MWh) if:
• the natural gas plants are operated at low capacity factors (typically under 20% average capacity factor in Ontario), and
• the remaining generation is either carbon-free or carbon-neutral.
The provision of those services by other carbon-free energy sources is very costly and provides little emission benefit for the additional costs involved. Consequently, natural gas-fired generation capacity cannot be economically eliminated from the Ontario electric power system at the present time.
46 Ontario Society of Professional Engineers

The decision to undertake a transformation of the power system energy mix was made without the benefit of a detailed analysis of the engineering and economic implications of the introduction of variable renewable generation. The subsequent electricity rate increases to pay for the transformation have been much greater than expected. Some of the lessons Ontario power engineers have learned in implementing the transformation are summarized in this Appendix.
Hydroelectric Energy
Ontario developed most of its commercially viable hydroelectric resources before the 1970’s. There are more hydroelectric resources in the northern reaches of the province but they are not close enough to population centers and the lack of easy access makes construction of major hydroelectric capacity uneconomical. For example the recent Lower Mattagami hydroelectric project, between Kapuskasing and Moosonee in the James Bay watershed, cost 13.5 cents/kWh or about 2 to 3 times the cost of other hydroelectric projects in Ontario according to the 2015 Annual Report of the OAGO.65
Ontario continues to look for and develop smaller hydroelectric projects but they are not sufficiently large to impact the supply mix at the overall power system level.
Pumped hydroelectric storage capacity would be very useful but there are few sites that are suitable and that also have accepting local populations. Falling water contains relatively little stored energy per unit volume so large storage ponds are required. Flooding of large areas of land is not environmentally benign.
65 Office of the Auditor General of Ontario, 2015 Annual Report.
APPENDIX D LESSONS FROM ONTARIO’SPOWER SYSTEM TRANSFORMATION
Ontario’s Energy Dilemma: Reducing Emissions at an Affordable Cost 47

Bio-Energy
Ontario has invested in a number of bio-energy plants using different technologies. Their capacity is very modest at about 1% of total power system installed capacity and energy production was much less than 1% of total capacity in both 2014 and 2015.66 Fuel costs can be very high67 if imported fuels are used like the Thunder Bay bio-mass conversion project which uses imported specially treated wood pellets that can be stored outdoors. Bio-energy fuel supply availability is limited. Also sustainable bio-mass competes with other land uses.
These challenges typically mean that bio-energy plants are best matched to local circumstances where conditions are favourable for these types of plants. Some examples include:
• combustion of methane from landfill sites to produce electricity
• combustion of methane from animal waste to produce electricity
• combustion of municipal waste to produce electricity
Wind Energy
Wind generation is best used to supply base-load demand because wind can blow both at night and during the day. OSPE undertook an analysis of two weekly periods to illustrate the storage requirements needed to smooth out wind production so it can provide steady base-load supply. Figure D-1 shows the analysis in graphical form for two periods that were analyzed.
66 Independent Electricity System Operator, “Power Data,” accessed February 16, 2016, http://www.ieso.ca/ Pages/Power-Data/default.aspx.
67 Office of the Auditor General of Ontario, 2015 Annual Report.
48 Ontario Society of Professional Engineers

FIGURE D-1Wind Generation Production Characteristics (Two Typical Weeks)
The week of January 6 to 12, 2014 was analyzed because it contained the peak system demand in 2014 with strong winds. The week of May 20 to 26, 2014 was analyzed because it had the minimum system demand in 2014 with weak winds. However, we should point out that wind production in the spring is usually high so this specific week was an unusually low production week. Wind generation requires storage in order to supply steady base-load energy. The stor-age reservoir fluctuations are also shown in Figure D-1. The storage reservoir level (green line in the 2 weekly charts) is calibrated in MWh (right scale).
To arrive at a dependable value for storage requirements for wind generation requires a com-prehensive analysis over several years. That is beyond the scope of this report. OSPE undertook a simplified analysis over a 1-year period to determined the storage needed to support a power system with 100% wind generation. That analysis indicated we would need about 540 hours of storage rated at 1.6 times the peak system demand for wind generation to match the electrical
MW
MW
MW
h
MW
h
January 6 to 12, 2014Installed Wind Capacity = 2,162 MW
May 20 to 26, 2014Installed Wind Capacity = 2,485 MW
Wind turbine output MW (left scale)
Energy delivered to the grid MW (left scale)
Energy in storage MWh (right scale)
Ontario’s Energy Dilemma: Reducing Emissions at an Affordable Cost 49

demand profile for an entire year. The very large storage required stems from wind generation’s weak summer production when system demand is highest. That amount of storage would make wind prohibitively expensive. Of course a 100% wind supplied power system is not a realistic design solution but it does illustrate how rapidly storage requirements and costs increase if we use wind in situations where it is poorly suited.
If we smooth out wind production over periods of one-week, the storage requirements drop considerably to 5 and 17 hours for the two weeks that were analyzed in Figure D-1. As a first approximation, if we assume we can scale the levelized cost of electricity by the same ratio as the capital cost increase caused by adding storage that would result in a levelized energy cost for wind generation including storage of about 27.7 to 36.0 cents/kWh to supply base-load (steady) output using large wind turbine farms priced at 8.9 cents/kWh from Table B-1 in Appendix B.
Wind production is strong in the spring and autumn but load demand is weak in Ontario. This means we will have to curtail wind generation or some other carbon-free energy source in the spring and autumn if we only install storage suitable for weekly smoothing. During the summer high demand season, wind is weak in Ontario so we would have to back it up with natural gas generation. This means the cost of wind generation presented above does not include the additional cost for curtailment in the spring and autumn and the capacity cost for the additional backup generation in the summer.
Ontario currently does not use storage to smooth out wind generation’s variability. When wind production is too high Ontario exports what it can and curtails the rest either directly or by curtailing hydroelectric or nuclear instead. That is a much cheaper approach than building storage.Unfortunately, when wind is not blowing, natural gas generation must be used to back up wind generation and we incur GHG emissions at the rate of about 400 grams of carbon dioxide per kWh of gas-fired production. Wind with gas-fired backup is not a low GHG emission strategy.
Because wind blows both at night and during the day if we do not use storage, wind generation competes with solar generation for load demand during the day. During the night, wind competes with hydroelectric and nuclear generation. As the power system becomes increasingly carbon-free, the useful energy output from wind generation decreases because it would displace carbon-free generation. Consequently, its effective cost per kWh increases. Unfortunately, when Ontario decided to install significant amounts of carbon-free solar, hydroelectric and nuclear generation in order to eliminate coal generation, it unknowingly undermined the economic justification for wind generation.
An OSPE analysis published in 2012 of wind patterns and associated wind generation output during 201168 showed that wind is difficult and costly to integrate into Ontario’s power system due to its inflexible base-load generation. Figure D-2 identifies the seasonal and hourly variation in wind production from OSPE’s 2011 analysis.
68 Ontario Society of Professional Engineers, “Wind and the Electrical Grid.”
50 Ontario Society of Professional Engineers

FIGURE D-2Seasonal and Hourly Variation in Wind Generation Production
OSPE’s analysis of Ontario’s 2011 wind production data showed there were 20 periods of at least 24 hours duration when wind generation output was below 10% of its total nameplate capacity across the entire province. There was also one period of 72 hours where that was the case. This means Ontario’s proposed 7,500 MW fleet of wind turbines by 2021 will periodically operate as a single turbine of 7,500 MW. This has significant implications for power system reliability and system reserve requirements. Effectively the largest unit outage that must be accommodated by system reserve for the wind generation fleet is almost the entire wind generation capacity in the province. The system reserve requirement to accommodate the loss of 7,500 MW of wind generation on a periodic basis is significant.
Using the analysis from 2011, OSPE has projected the wind production in 2021 when the full planned capacity of wind is expected to be operating and power system load is assumed to be similar to 2011 (no load growth). Figure D-3 below shows the projected wind production profile for both a low demand and a high demand week in 2021. Figure D-3 below also shows how wind generation competes with the other carbon-free sources in Ontario’s power system. That competition means GHG emissions do not drop as much as expected when wind capacity is added to Ontario’s very low GHG emitting power system.
Annual production
Autumn production
Winter production
Spring production
Summer production
WIN
D O
UTP
UT
MW
h
TIME OF DAY (hours)
Ontario Wind Output September 2010 to September 2011 Total Production by Hours of the DayInstalled Wind Capacity of 1,412 MW
Ontario’s Energy Dilemma: Reducing Emissions at an Affordable Cost 51

FIGURE D-3Wind Generation Competes with Carbon-Free Production
Solar Energy
A similar analysis can be done for solar generation once the province wide production data from multiple locations becomes available. It is expected that the geographic diversity of solar production will be much better than that of wind but until the data is available we cannot be certain of how much better. However, it is not possible to eliminate the output variation from daytime to nighttime without storage because there is a limit to how far electricity can be transmitted economically. Fortunately, there is no need to do this because solar generation can be assigned to supply the peak load demand during the day when the sun is shining.
Peak load
Base load
Peak load
Base load
Wind competes with solar during the day and hydro-electric and nuclear generation at night because there is not enought system demand to accommodate all carbon-free sources. Wind provides noemission reduction value to the extent it displaces hydro-electric and nuclear base-load or solar peak load generation.
Wind disappears for 24 hours across the entire province and requires backup for most of its capacity.
Wind competes with hydro-electric and nuclear generation at night. It provides no emission reduction value to the extent it displaces hydroelectric and nuclear base load generation.
Ontario demand only
Wind output with 7,500 MW installed
Projected Wind Production vs Ontario Demand
Lowest Demand Week in 2021
Projected Wind Production vs Ontario Demand
Highest Demand Week in 2021
MW
Low Demand Week ProfileTypically a Spring Week
High Demand Week ProfileTypically a Hot Summer Week
52 Ontario Society of Professional Engineers

Solar does have one complicating characteristic. It produces a considerable amount of energy in the spring and autumn when energy demand is lower. We can export or curtail that production or store that output for later use during higher demand periods. Each of these three options has different cost implications for solar generation.
To arrive at a dependable value for storage requirements for solar generation requires a com-prehensive analysis over several years. That is beyond the scope of this report. OSPE undertook a simplified analysis over a 1-year period using only one solar facility to determine the storage needed to support a power system with 100% solar generation. That analysis69 indicated we would need about 250 hours of storage rated at 4.5 times the peak system demand for solar generation to match the electrical demand profile for an entire year. The very large power rating required stems from the low capacity factor of solar generation and its absence in the evening when system demand is still typically 60% of the daytime demand. That amount of storage would make solar prohibitively expensive. Of course a 100% solar supplied power system is not a realistic design solution but it does illustrate how rapidly storage requirements and costs increase if we use solar in situations where it is poorly suited.
In 2016, we only have hourly solar production data for the power system for one large 100 MW Solar PV facility. The benefits of geographic diversification are not apparent with data for only one facility. More than 1,600 MW of installed solar generation is connected to the distribution system and is not visible at the high voltage power system level where all the data monitoring equipment is installed. We see the effects of that production as a drop in the overall power system demand during the mid-day hours when the sun shines. This has two unwanted effects. It causes the gas-fired plants to cycle up and down twice during the day and that reduces their efficiency and increases their emissions.
Another unwelcome effect is the much faster load demand ramps that are imposed on the back-up gas-fired plants at the end of each sunny day. The faster load ramps occur because we have both a load rise from cooking demands and a fall off in solar production at the distribution level as the sun sets. The gas-fired plants must respond to those faster load ramps. As we add more solar capacity to a power system without storage, the dip in mid-day load demand and the rapid rise in evening load demand will become more severe. California has been forced to order significant amounts of storage recently to manage those ramps from their larger solar generation fleet. Storage can manage those load ramps but at a relatively high cost. When planning a power system those integration costs must be factored into the economic evaluations when we compare different generation technologies with different performance characteristics.
We don’t yet have province-wide solar production data so we cannot see the level of production smoothing that occurs across the whole province from one day to the next for the entire year. That data will help determine the amount of reserve that solar will require. We have however performed a simplified analysis of two weeks in the third quarter of 2015 using the output for that one 100 MW facility for illustration purposes. The analysis allows us to see how best to use storage to minimize GHG emissions from gas-fired peak load generation. The analysis is shown graphically in Figure D-4.
69 Ontario Society of Professional Engineers Energy Task Force, “The Real Cost of Electrical Energy.”
Ontario’s Energy Dilemma: Reducing Emissions at an Affordable Cost 53

Figure D-4 presents one higher and one lower production week from the second quarter of 2015. The week of April 5 to 11, 2015 was analyzed because it was a lower production week. The week of April 26 to May 2, 2015 was analyzed because it was a higher production week.
Because the sun shines only during the day, solar PV should be assigned to provide peak load demand during the day. Solar PV needs storage to reduce the amount of cycling that would otherwise be imposed on the gas-fired plants. We adjusted the output from the storage to follow the daily peak load demand profile of the overall power system in order to minimize cycling of the gas plants. The storage reservoir fluctuations are also shown in Figure D-4. The storage reservoir level (green line in the 2 weekly charts below) is calibrated in MWh (right scale).
FIGURE D-4Solar PV Production Characteristics (Two Typical Weeks)
MW MWh MW MWh
Solar output MW (left scale)
Energy delivered to the grid MW (left scale)
Energy in storage MWh (right scale)
Week of April 5 to April 11, 2015Installed Solar Capacity = 100 MW
Week of April 26 to May 2, 2015Installed Solar Capacity = 100 MW
54 Ontario Society of Professional Engineers

If we smooth out solar production daily over periods of one week the storage requirements drop considerably to 5.5 and 6.6 hours for the two periods shown above. As a first approximation, if we assume we can scale the levelized cost of electricity by the same ratio as the capital cost increase caused by adding storage that would result in a levelized energy cost for solar generation with storage of about 27.9 to 31.6 cents/kWh to supply peak load using large ground mounted solar PV systems priced 10.5 cents/kWh from Table B-1 in Appendix B. Solar production is strong in the spring and autumn but demand is weak in Ontario. This means we will have to curtail solar generation or some other carbon-free energy source in the spring and autumn if we only install storage suitable for weekly smoothing. The cost of solar generation stated above does not include the additional cost for curtailment in the spring and autumn.
Ontario currently does not use storage to smooth out solar generation to deal with its variability. Similarly, as we indicated above with wind generation, when solar production is too high, Ontario exports what it can and curtails the rest either directly or by curtailing hydroelectric or nuclear instead. That is a much cheaper approach than building storage. Unfortunately, when the sun is not shining, natural gas generation must be used to back up solar and we incur GHG emissions at the rate of about 400 grams carbon dioxide per kWh of gas-fired production. Solar with gas-fired backup is not a low GHG emission strategy.
Nuclear Energy
Ontario uses CANDU nuclear reactors to make electricity. Most of these reactors were designed to operate as base-load plants operating at full load continuously between maintenance outages. The later plants like Bruce B and Darlington have control adjusters and steam bypass systems that could in theory allow them to reduce load at night by up to 35% of full power. However, experience has shown that reactor power reductions can create reactor neutron flux distortions in the reactor core that would result in de-ratings for many hours after a power reduction. Consequently reactor power changes on a daily basis are typically avoided.
Bruce Power has improved the performance of its steam bypass systems and has provided flexible nuclear capacity from its reactors since February 2013. Electrical power can be lowered up to 35% of full power by diverting steam from the turbine-generators to the condensers. However, when this is done no fuel is conserved because the reactors continue to operate at full power.
Nuclear reactors have high fixed costs so the cost per unit of useful electrical energy output will rise as its electrical output is curtailed. From a cost perspective it would be better to use the surplus energy to displace fossil fuels in the non-electrical sector rather than curtail nuclear output. To accomplish this however, we would need to change our retail electricity price plans so that surplus nuclear energy can be sold at its variable cost of production when it is used to displace fossil fuels in other sectors.
Ontario’s Energy Dilemma: Reducing Emissions at an Affordable Cost 55

Conservation
Ontario’s “Conservation First” program incentivizes consumers to use less electricity. The cost of conservation programs is included in the global adjustment surcharge in electricity rates. With electricity rates rising much faster than general inflation and wages, consumers are very motivated to replace old appliances with more efficient units. Consumers are also making energy upgrades during renovations to their homes and business. As a result, electricity load demand from the power system has been declining even as the population is rising.
Figure D-5 shows Ontario’s annual maximum and minimum load demand. The summers of 2014 and 2015 were unusually cool so the large drop in maximum demand is not normal. However, the general trend in electricity demand in MW has been flat to slightly down since 2006. Ontario’s 2010 and 2013 Long Term Energy Plan projected rising demand. As a result we have now built a significant amount of excess capacity of carbon-free generation into the power system.
When we have excess capacity, conservation actually drives electricity prices higher to pay for the fixed costs of present and new capacity that was planned earlier.
FIGURE D-5Ontario’s Annual Minimum/Maximum Electricity Load Demand
Maximum hourly demand
Minimum hourly demand
MW
YEAR
56 Ontario Society of Professional Engineers

Exporting the excess carbon-free electricity at low wholesale prices can recover a portion of the fixed costs from our US and Quebec neighbours. However, when the wholesale market price drops to the variable cost of production of carbon-free electricity, it would be better to use that excess carbon-free energy within Ontario to displace fossil fuels in other sectors. The wholesale electricity price during periods of surplus carbon-free electricity is typically lower than the cost of fossil fuels on a thermal energy equivalent basis, and at times the market price is actually negative. In 2014 there were 861 hours when the wholesale market price was negative and Ontario paid to export electricity.
That means it is to our economic and environmental advantage to use surplus carbon-free energy to displace fossil fuels in other sectors rather than export the surplus.
Unfortunately, Ontario’s retail electricity price plans do not allow Ontario businesses or homes to purchase surplus carbon-free electricity at the same low wholesale market price as our adjoining power systems in the US and Quebec.
Minimizing Costs and Emissions
The important lessons from this analysis are:
• It is expensive to add storage.
• It is expensive to overbuild wind and solar capacity and then curtail them or export the excess production at typically low wholesale market prices.
• Wind generation offers little GHG reduction value in Ontario’s electrical power system because base-load generation is already carbon-free.
• It is expensive to overbuild nuclear capacity beyond the base-load demand and then curtail it or export the excess production at typically low wholesale market prices.
• It is better economically and environmentally to use surplus carbon-free electricity to displace fossil fuels in other sectors rather than export or curtail it.
Ontario’s additional peak load demand (the amount above the base-load demand) varies between about 4,000 MW in the spring and autumn and about 7,000 MW during hot summer days. Ideally we could accommodate about 4,000 MW of solar generation in Ontario’s power system without creating surplus carbon-free energy. Ontario has committed to install about 2,500 MW of solar capacity in both its 2010 and 2013 Long Term Energy Plan.70 However, Ontario also has committed to install 7,500 MW of wind generation. These two commitments combined create a serious energy management problem for Ontario’s power system engineers and operators. About 50% of that capacity is already installed.
70 Ministry of Energy, “Ontario’s Long-Term Energy Plan.”
Ontario’s Energy Dilemma: Reducing Emissions at an Affordable Cost 57

Unfortunately, that means Ontario has already overbuilt wind generation and has committed to add additional capacity over the next 6 years. Surplus carbon-free electricity will persist for over 15 years according to the Office of the Auditor General of Ontario (OAGO) 201571 report unless we find a productive way to use that energy.
The amount of surplus carbon-free energy during the week of September 8 to 14, 2014 is illustrated graphically in Figure D-6.
FIGURE D-6Availability of surplus carbon-free electricity72
71 Office of the Auditor General of Ontario, 2015 Annual Report.
72 Independent Electricity System Operator, “Power Data.”
MW HOEP cents/kWh(black line only)
“Export” of carbon-free electricity occurs when avail-able supply exceeds Ontario demand (green) line.
“Curtailment (waste)” of carbon-free electricity occurs when available supply exeeds the total demand (red) line
Electricity prices can become negative (Ontario pays to export) when carbon-free electricity is being curtailed.
Wind availability MW
Hydro and nuclear availability MW
Total demand including exports MW
Ontario demand MW
HOEP price (cents/kWh)
Week of September 8 to 14, 2014Supply vs Demand
58 Ontario Society of Professional Engineers
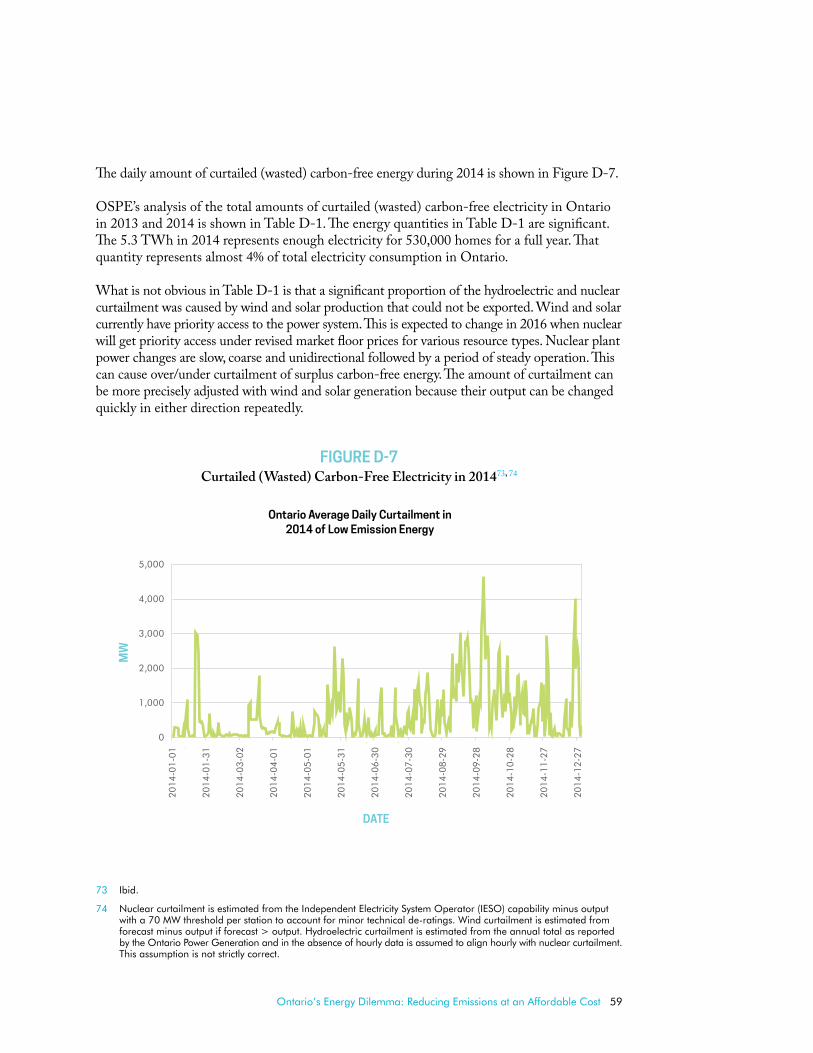
The daily amount of curtailed (wasted) carbon-free energy during 2014 is shown in Figure D-7.
OSPE’s analysis of the total amounts of curtailed (wasted) carbon-free electricity in Ontario in 2013 and 2014 is shown in Table D-1. The energy quantities in Table D-1 are significant. The 5.3 TWh in 2014 represents enough electricity for 530,000 homes for a full year. That quantity represents almost 4% of total electricity consumption in Ontario.
What is not obvious in Table D-1 is that a significant proportion of the hydroelectric and nuclear curtailment was caused by wind and solar production that could not be exported. Wind and solar currently have priority access to the power system. This is expected to change in 2016 when nuclear will get priority access under revised market floor prices for various resource types. Nuclear plant power changes are slow, coarse and unidirectional followed by a period of steady operation. This can cause over/under curtailment of surplus carbon-free energy. The amount of curtailment can be more precisely adjusted with wind and solar generation because their output can be changed quickly in either direction repeatedly.
FIGURE D-7Curtailed (Wasted) Carbon-Free Electricity in 201473, 74
73 Ibid.
74 Nuclear curtailment is estimated from the Independent Electricity System Operator (IESO) capability minus output with a 70 MW threshold per station to account for minor technical de-ratings. Wind curtailment is estimated from forecast minus output if forecast > output. Hydroelectric curtailment is estimated from the annual total as reported by the Ontario Power Generation and in the absence of hourly data is assumed to align hourly with nuclear curtailment. This assumption is not strictly correct.
MW
DATE
Ontario Average Daily Curtailment in 2014 of Low Emission Energy
Ontario’s Energy Dilemma: Reducing Emissions at an Affordable Cost 59

TABLE D-1Amount of curtailed (wasted) electrical energy75
Curtailed Source
2013TWh
2014TWh
Hydroelectric 1.7 3.2
Nuclear 1.4 1.7
Wind nil 0.4
Solar nil nil
TOTAL 3.4 TWh 5.3 TWh
Note: Curtailment of solar has begun in 2015.
In addition to the curtailed quantities in 2014, OSPE estimates another 5.3 TWh of surplus carbon-free electricity was exported to adjoining power systems at wholesale prices below 1 cent/kWh.
Effectively, Ontario allows adjoining power systems to access surplus carbon-free electricity at its variable cost of production but it does not allow Ontario consumers to do so.
The average price received for that 10.6 TWh or 7% of Ontario’ electricity demand was less than 0.5 cents/kWh. That electricity price on a BTU basis is only about 1/5 of the cost of natural gas fuel for residential customers who buy gas from their local gas distributor. Natural gas is used by urban consumers for their thermal energy needs including hot water, space heating and cooking. That 10.6 TWh of electricity in 2014 had the ability to reduce carbon dioxide emissions by 2 million tonnes in Ontario if it had been used to displace natural gas in Ontario. The reduction would be 16 to 27% larger if propane or heating oil respectively were being displaced in rural areas.
Ontario’s power system designers have found that to minimize the overall cost of electricity while minimizing GHG emissions it is better to use each technology to supply the load demand that best matches that technology’s production characteristics. This means:
• Base-load demand should be supplied by carbon-free dependable base-load plants like hydroelectric, bio-energy and nuclear generation.
• Peak load demand should be supplied by dependable peak load plants like lower emission natural gas generation.
• Solar PV should be used to displace peak load fossil fuel generation that operates during daylight hours.
• Wind is best used to displace base-load fossil fuel generation that operates all day long. Ontario no longer has fossil fuel base-load generation operating during most of the year. The small amount of gas-fired generation that runs during the evening must do so for spinning reserve reasons and cannot be displaced by other generation sources.
75 Independent Electricity System Operator, “Power Data.”
60 Ontario Society of Professional Engineers

• Wind and solar capacity should not be used to displace each other or any other carbon-free energy sources. However, modest amounts of curtailment or storage may be economically justified.
• Because of the extra cost involved, the amount of storage and curtailment of carbon-free sources should be minimized. This can be accomplished by carefully planning by selecting the supply mix to suit the consumer load demand profile on an hourly basis for the whole year.
• If surplus carbon-free electricity is available it should be used to displace fossil fuels in other sectors in preference to exporting it. This will require major changes to our electricity retail price plans.
The Ontario government is under pressure to increase the capacity of wind and solar generation because of public support for these technologies. However, the hourly, daily and seasonal output variability from wind and solar facilities make their integration into a low emission power system difficult and costly. The production characteristics of wind and solar generation is out of phase with consumer electricity demand. The less flexible generation that Ontario has already installed such as hydroelectric plants with limited storage and inflexible base-load nuclear plants makes integration of wind and solar more challenging.
A fundamental misunderstanding that many people have is to assume all carbon-free energy sources can supply both base-load and peak load demand effectively with zero GHG emissions. This is not the case.
Variable sources like wind and solar generation cannot effectively supply base-load demand with carbon-free energy because they need to be backed up by GHG-emitting sources like natural gas-fired generation. The current state of the technology for electrical storage makes it too inefficient and costly to displace GHG-emitting backup supplies.
Similarly, hydroelectric and nuclear generation cannot cost effectively supply peak load demand if they do not have access to low cost efficient storage technologies.
As the power system becomes lower emitting, variable renewable sources like wind and solar begin to displace low emission sources like hydroelectric and nuclear generation. There is no economic or environmental justification to do that. Consequently, as the power system becomes lower emitting, it becomes economically important to find ways to use variable renewable generation to displace fossil fuels in other non-electrical sectors.
Because Ontario now has a surplus of carbon-free electricity it is actually cost effective to sell that surplus electricity at its variable cost of production. Because the variable cost of production of many carbon-free electricity sources is very low or close to zero, it is economically efficient to displace fossil fuel consumption in thermal load applications.
For Ontario to reduce or eliminate its surplus of carbon-free electricity it will need to modify its retail electricity price plans. Ontario consumers should be charged a much lower price for surplus carbon-free electricity when it is used to displace fossil fuels in thermal load applications.
Ontario’s Energy Dilemma: Reducing Emissions at an Affordable Cost 61

A secondary benefit of doing that is that the suppression of the Ontario wholesale market price caused by surplus carbon-free electricity will be alleviated to some extent. Ontario is part of a larger continental electricity market that also affects the wholesale price in Ontario. Our adjoining power systems are also experiencing periods of excess generation when variable renewable sources are producing at maximum output. So we should expect only a modest wholesale market price recovery. The reason is that the increase in Ontario’s electrical demand due to our use of surplus carbon-free electricity to displace fossil fuels in other non-electrical sectors is modest relative to the overall demand of the continental region we operate in.
62 Ontario Society of Professional Engineers

Ontario Society of Professional Engineers4950 Yonge Street, Suite 502Toronto, Ontario M2N 6K1
Tel. 416-223-9961www.ospe.on.ca