open access associations of il 10 genetic a meta-analysis ... · in ca versus aa (p = 0.04, or...
TRANSCRIPT

Shi et al. SpringerPlus (2016) 5:2034 DOI 10.1186/s40064-016-3705-0
RESEARCH
Associations of IL-10 genetic polymorphisms with the risk of urologic cancer: a meta-analysis based on 18,415 subjectsXiaohan Shi1,2, Xiaochuan Xie3, Xiaoshuang Xun4, Yingxian Jia1,2 and Shangwei Li1,2*
Abstract
Background: Interleukin-10 (IL-10) is a powerful modulator of anti-tumor immune responses. The IL-10 promoter region polymorphisms are known to regulate IL-10 production, and thus are thought to be implicated in tumorigen-esis. Recently, the roles of these polymorphisms in urologic cancer have been extensively studied, with conflicting results. Therefore, we conducted the present meta-analysis to better elucidate the correlations between IL-10 poly-morphisms and urologic cancer risk.
Methods: Eligible articles were searched in PubMed, Medline, Embase, Scopus and CNKI up to May 2016. Odds ratios (ORs) and 95% confidence intervals (CIs) were used to detect any potential associations between IL-10 polymor-phisms and the risk of urologic cancer.
Results: A total of 22 case–control studies including 8572 patients and 9843 controls were analyzed. The overall meta-analysis results showed that IL-10 −592C>A polymorphism was significantly associated with urologic cancer in CA versus AA (P = 0.04, OR 0.87, 95% CI 0.76–0.99) and AA versus CC+CA (P = 0.03, OR 1.15, 95% CI 1.02–1.31). Subgroup analyses by cancer types suggested there were significant associations between all the three investigated IL-10 polymorphisms and bladder cancer. However, subgroup analyses by ethnicity only detected a weak association between IL-10 −819C>T and Asian population.
Conclusions: Our findings suggests that IL-10 −592C>A polymorphism may implicate with urologic cancer risk. Besides, promoter region polymorphisms of IL-10 may serve as potential biological markers, especially for bladder cancer. Furthermore, IL-10 −819C>T polymorphism may contribute to urologic cancer susceptibility in Asians while all the three studied variants of IL-10 did not relate to Caucasian urologic cancer predisposition.
Keywords: Interleukin-10 (IL-10), Urologic cancer, Genetic polymorphisms, Meta-analysis
© The Author(s) 2016. This article is distributed under the terms of the Creative Commons Attribution 4.0 International License (http://creativecommons.org/licenses/by/4.0/), which permits unrestricted use, distribution, and reproduction in any medium, provided you give appropriate credit to the original author(s) and the source, provide a link to the Creative Commons license, and indicate if changes were made.
BackgroundCommonly seen urologic cancers such as prostate can-cer, renal cancer, and bladder cancer are leading causes of cancer-related morbidity and mortality globally (Siegel et al. 2014). Despite rapid advances in early diagnosis and surgical treatment over the past few decades, the num-bers of new urologic cancer cases and associated deaths are continue to increase, making it becomes one of the
major threats to public health worldwide (Ferlay et al. 2015).
To date, the exact cause of urologic cancer remains unclear. Certain environmental factors like smoking habit, heavy alcohol intake, high caloric diet and chemi-cal dyes have been identified as potential etiological factors for urologic cancer. However, the fact that only a small portion of individuals exposed to these carcino-genic agents ultimately develop urologic cancer suggests that genetic susceptibility factors may play a crucial part in its pathogenesis (Jiang et al. 2014).
Interleukin-10 (IL-10), encoded by the IL-10 gene located on chromosome 1q31–32, is a potent regulator
Open Access
*Correspondence: [email protected] 1 Division of Reproductive Medical Center, West China Second University Hospital, Sichuan University, Chengdu, Sichuan, ChinaFull list of author information is available at the end of the article

Page 2 of 19Shi et al. SpringerPlus (2016) 5:2034
of anti-tumor immune responses (Eskdale et al. 1997; Mocellin et al. 2005). As a result, certain polymorphisms located in the promoter region of IL-10 gene (−592C>A, −819C>T and −1082A>G), which regulate the expres-sion level of IL-10 protein (Turner et al. 1997; Kingo et al. 2005), were thought to be implicated in the pathogenesis of various kinds of cancers. Recently, many genetic asso-ciation studies have been carried out to investigate the potential correlations between IL-10 promoter region polymorphisms and urologic cancer risk. However, results of these studies were controversial and the statis-tical power of individual studies was insufficient. There-fore, we conducted the present meta-analysis to better assess the potential associations of IL-10 genetic poly-morphisms with the risk of urologic cancer.
MethodsLiterature searching strategyTo retrieve all relevant articles, a systematic literature search of PubMed, Medline, Embase, Scopus and China National Knowledge Infrastructure (CNKI) was per-formed using the following keywords: “Interleukin-10”, “IL-10”, “Interleukin 10”, “IL 10”, “polymorphism”, “vari-ant”, “genotype”, “allele”, “prostate”, “renal”, “bladder”, “urinary”, “urologic”, “cancer”, “tumor”, “carcinoma”, “neo-plasm” and “malignancy”. The initial search was con-ducted in September 2015 and the latest update was performed in May 2016. In addition, the reference lists of all retrieved articles were reviewed manually for further identification of potentially relevant articles.
Inclusion criteriaThe inclusion criteria for the present study were set prior to the literature search. Eligible studies met all the fol-lowing conditions: (1) case–control study of unrelated urologic cancer patients and control subjects; (2) evalu-ation of the associations between IL-10 polymorphisms (−592C>A, −819C>T and −1082A>G) and the risk of urologic cancer; (3) presentation of sufficient data to calculate the odds ratios (ORs) and corresponding 95% confidence intervals (CIs); (4) full text in English or Chi-nese available. If the report was duplicated or identi-cal patients were enrolled in two studies, only the most recent and complete article was included. Abstracts, fam-ily-based association studies, case reports, case series, reviews, editorials, expert opinions and conference pres-entations were intentionally excluded.
Data extraction and quality assessmentFrom each included studies, the following data were extracted: references, country of origin, ethnicity of study population, the number of cases and controls, types of urologic cancer, allelic and genotypic frequencies of IL-10
polymorphisms in urologic cancer patients and control subjects, and whether the distributions of IL-10 poly-morphisms in the control group were in accordance with Hardy–Weinberg equilibrium (HWE). The Newcastle-ottawa quality assessment scale (NOS), a classical rat-ing tool which evaluates the credibility of observational studies from three perspectives: selection, comparabil-ity and exposure, was used to assess the reliability of all case–control studies included (Zhang et al. 2014). This rating system has a score range of 0–9, and studies with a score of more than 7 were assumed to be of high quality. Two reviewers (Shi and Xie) conducted the data extrac-tion and quality assessment independently. When neces-sary, the reviewers wrote to the corresponding authors for extra information or raw data. Any discrepancies between two reviewers were resolved by discussion until reaching a consensus. The final results were reviewed by a senior reviewer (Li).
Statistical analysisAll data analyses were performed using Review Man-ager Version 5.3.3 (The Cochrane Collaboration, Soft-ware Update, Oxford, United Kingdom). HWE was explored with the Chi square test. ORs and 95% CIs were employed to evaluate potential associations between IL-10 polymorphisms and the risk of urologic cancer. Het-erogeneity between studies was assessed by using the Q test and I2 statistic. If probability value (P value) of Q test was less than 0.1 or I2 was greater than 50%, the random-effect model (REM) would be adopted for analyses due to the existence of significant between-study heteroge-neity. Otherwise, the fixed-effect model (FEM) would be applied for analyses. Subgroup analyses were performed based on types of cancer and ethnicity of study popula-tion. Sensitivity analyses were carried out by omitting one individual study each time. Publication bias was fur-ther evaluated with funnel plots. And a P value of 0.05 or less was considered to be statistically significant for all analyses.
ResultsIncluded studiesThe literature search yielded 462 results. After exclusion of irrelevant or duplicate articles by reading titles and abstracts, 39 articles were selected for further evaluation. Among these, a total of 22 case–control studies including 8572 urologic cancer patients and 9843 control subjects met our inclusion criteria (see Fig. 1), 14/22 were about the IL-10 −592C>A polymorphism, 13/22 were about the IL-10 −819C>T polymorphism, and 20/22 were about the IL-10 −1082A>G polymorphism. All included stud-ies were published between 2002 and 2016. Of these, there were 16 studies of prostate cancer, 4 studies of renal

Page 3 of 19Shi et al. SpringerPlus (2016) 5:2034
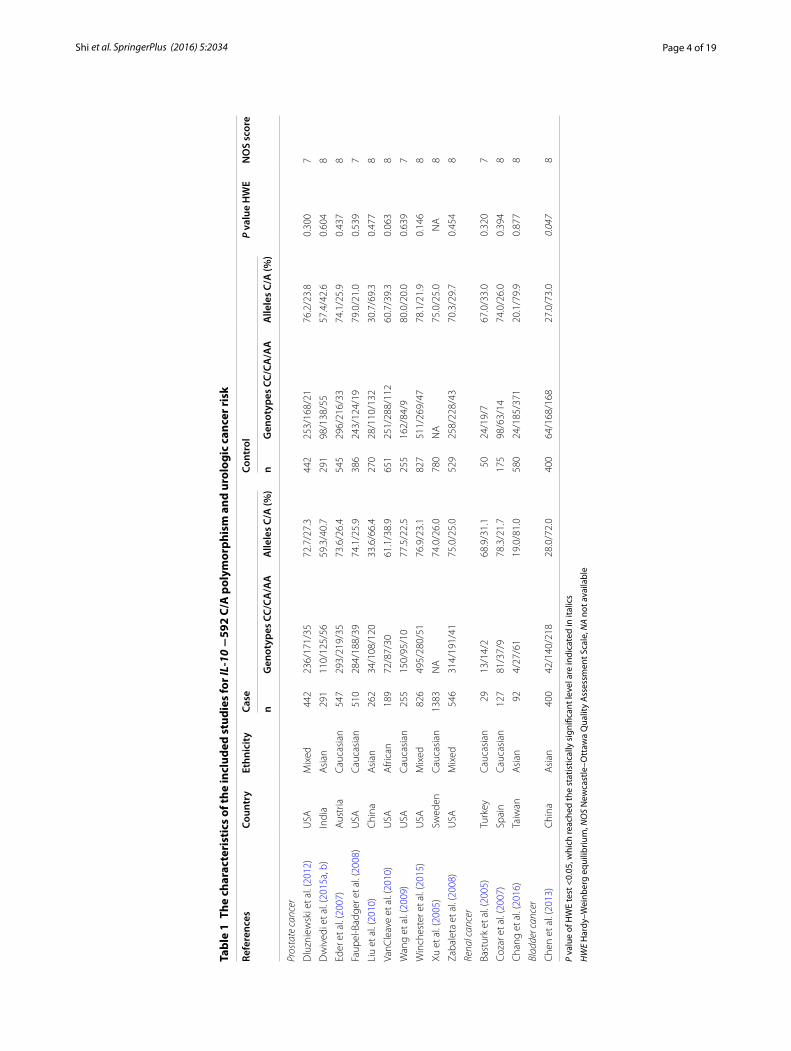
cancer, and 2 studies of bladder cancer. All articles were published in English except for two in Chinese. Charac-teristics of studies analyzing IL-10 −592C>A polymor-phism were summarized in Table 1, characteristics of studies examining IL-10 −819C>T polymorphism were summarized in Table 2, and characteristics of studies investigating IL-10 −1082A>G polymorphism were sum-marized in Table 3.
Risk of bias in included studiesAs shown in Tables 1, 2 and 3, the average NOS score of included studies was 7.59 (range from 7 to 8), suggest-ing that all enrolled articles were of relatively high qual-ity. The improper selection of controls and mismatching baseline characteristics of urologic cancer cases and control subjects (age and/or ethnicity) were the major sources of biases.
IL‑10 −592C>A polymorphism and urologic cancer riskFor IL-10 −592C>A polymorphism, a total of 14 stud-ies including 5899 urologic cancer patients and 6181 control subjects were investigated (Dluzniewski et al. 2012; Dwivedi et al. 2015a, b; Eder et al. 2007; Faupel-Badger et al. 2008; Liu et al. 2010; VanCleave et al. 2010; Wang et al. 2009; Winchester et al. 2015; Xu et al. 2005; Zabaleta et al. 2008; Basturk et al. 2005; Cozar et al. 2007; Chang et al. 2016; Chen et al. 2013). HWE test for the control group of each included studies demonstrated that only 1 study deviated from HWE (see Table 1). In order to explore the association between IL-10 −592C>A poly-morphism and urologic cancer risk, we compared distri-bution of genotypes and alleles in every genetic model. For CC versus AA, CA versus AA, CA versus CC+AA, and AA versus CC+CA, between-study heterogene-ity was mild, and analyses were performed with FEMs.
Fig. 1 Flowchart of study selection for the present study
Page 4 of 19Shi et al. SpringerPlus (2016) 5:2034
Tabl
e 1
The
char
acte
rist
ics
of th
e in
clud
ed s
tudi
es fo
r IL-10
−59
2 C/
A p
olym
orph
ism
and
uro
logi
c ca
ncer
risk
P va
lue
of H
WE
test
<0.
05, w
hich
reac
hed
the
stat
istic
ally
sig
nific
ant l
evel
are
indi
cate
d in
ital
ics
HW
E H
ardy
–Wei
nber
g eq
uilib
rium
, NO
S N
ewca
stle
–Ott
awa
Qua
lity
Ass
essm
ent S
cale
, NA
not a
vaila
ble
Refe
renc
esCo
untr
yEt
hnic
ity
Case
Cont
rol
P va
lue
HW
EN
OS
scor
e
nG
enot
ypes
CC/
CA/A
AA
llele
s C/
A (%
)n
Gen
otyp
es C
C/CA
/AA
Alle
les
C/A
(%)
Pros
tate
can
cer
Dlu
znie
wsk
i et a
l. (2
012)
USA
Mix
ed44
223
6/17
1/35
72.7
/27.
344
225
3/16
8/21
76.2
/23.
80.
300
7
Dw
ived
i et a
l. (2
015a
, b)
Indi
aA
sian
291
110/
125/
5659
.3/4
0.7
291
98/1
38/5
557
.4/4
2.6
0.60
48
Eder
et a
l. (2
007)
Aus
tria
Cauc
asia
n54
729
3/21
9/35
73.6
/26.
454
529
6/21
6/33
74.1
/25.
90.
437
8
Faup
el-B
adge
r et a
l. (2
008)
USA
Cauc
asia
n51
028
4/18
8/39
74.1
/25.
938
624
3/12
4/19
79.0
/21.
00.
539
7
Liu
et a
l. (2
010)
Chi
naA
sian
262
34/1
08/1
2033
.6/6
6.4
270
28/1
10/1
3230
.7/6
9.3
0.47
78
VanC
leav
e et
al.
(201
0)U
SAA
frica
n18
972
/87/
3061
.1/3
8.9
651
251/
288/
112
60.7
/39.
30.
063
8
Wan
g et
al.
(200
9)U
SACa
ucas
ian
255
150/
95/1
077
.5/2
2.5
255
162/
84/9
80.0
/20.
00.
639
7
Win
ches
ter e
t al.
(201
5)U
SAM
ixed
826
495/
280/
5176
.9/2
3.1
827
511/
269/
4778
.1/2
1.9
0.14
68
Xu e
t al.
(200
5)Sw
eden
Cauc
asia
n13
83N
A74
.0/2
6.0
780
NA
75.0
/25.
0N
A8
Zaba
leta
et a
l. (2
008)
USA
Mix
ed54
631
4/19
1/41
75.0
/25.
052
925
8/22
8/43
70.3
/29.
70.
454
8
Rena
l can
cer
Bast
urk
et a
l. (2
005)
Turk
eyCa
ucas
ian
2913
/14/
268
.9/3
1.1
5024
/19/
767
.0/3
3.0
0.32
07
Coza
r et a
l. (2
007)
Spai
nCa
ucas
ian
127
81/3
7/9
78.3
/21.
717
598
/63/
1474
.0/2
6.0
0.39
48
Cha
ng e
t al.
(201
6)Ta
iwan
Asi
an92
4/27
/61
19.0
/81.
058
024
/185
/371
20.1
/79.
90.
877
8
Blad
der c
ance
r
Che
n et
al.
(201
3)C
hina
Asi
an40
042
/140
/218
28.0
/72.
040
064
/168
/168
27.0
/73.
00.
047
8

Page 5 of 19Shi et al. SpringerPlus (2016) 5:2034
Tabl
e 2
The
char
acte
rist
ics
of th
e in
clud
ed s
tudi
es fo
r IL-10
−81
9 C/
T po
lym
orph
ism
and
uro
logi
c ca
ncer
risk
P va
lue
of H
WE
test
<0.
05, w
hich
reac
hed
the
stat
istic
ally
sig
nific
ant l
evel
are
indi
cate
d in
ital
ics
HW
E H
ardy
–Wei
nber
g eq
uilib
rium
, NO
S N
ewca
stle
–Ott
awa
Qua
lity
Ass
essm
ent S
cale
, NA
not a
vaila
ble
Refe
renc
esCo
untr
yEt
hnic
ity
Case
Cont
rol
P va
lue
HW
EN
OS
scor
e
nG
enot
ypes
CC/
CT/T
TA
llele
s C/
T (%
)n
Gen
otyp
es C
C/CT
/TT
Alle
les
C/T
(%)
Pros
tate
can
cer
Dw
ived
i et a
l. (2
015a
, b)
Indi
aA
sian
291
68/1
31/9
245
.9/5
4.1
291
60/1
51/8
046
.6/5
3.4
0.46
68
Faup
el-B
adge
r et a
l. (2
008)
USA
Cauc
asia
n50
728
3/18
4/40
74.0
/26.
038
424
4/12
2/18
79.4
/20.
60.
585
7
Kesa
rwan
i et a
l. (2
009)
Indi
aA
sian
159
52/6
8/39
54.1
/45.
925
965
/125
/69
49.2
/50.
80.
579
8
Liu
et a
l. (2
010)
Chi
naA
sian
262
34/1
08/1
2033
.6/6
6.4
270
28/1
10/1
3230
.7/6
9.3
0.47
78
Mic
haud
et a
l. (2
006)
USA
Mix
ed12
4671
6/44
7/83
75.4
/24.
617
6296
4/65
9/13
973
.4/2
6.6
0.07
88
VanC
leav
e et
al.
(201
0)U
SAA
frica
n19
176
/85/
3062
.0/3
8.0
635
246/
278/
111
60.6
/39.
40.
037
8
Win
ches
ter e
t al.
(201
5)U
SAM
ixed
611
372/
206/
3377
.7/2
2.3
659
408/
217/
3478
.4/2
1.6
0.46
48
Zaba
leta
et a
l. (2
008)
USA
Mix
ed52
630
8/18
0/38
75.7
/24.
349
424
9/20
4/41
71.1
/28.
90.
931
8
Rena
l can
cer
Bast
urk
et a
l. (2
005)
Turk
eyCa
ucas
ian
2913
/14/
269
.0/3
1.0
5024
/19/
767
.0/3
3.0
0.32
07
Coza
r et a
l. (2
007)
Spai
nCa
ucas
ian
127
81/3
7/9
78.3
/21.
717
598
/63/
1474
.0/2
6.0
0.39
48
Cha
ng e
t al.
(201
6)Ta
iwan
Asi
an92
4/26
/62
18.5
/81.
558
061
/209
/310
28.5
/71.
50.
005
8
Blad
der c
ance
r
Ahi
rwar
et a
l. (2
009)
Indi
aA
sian
214
46/1
03/6
545
.6/5
4.4
385
115/
165/
105
51.3
/48.
70.
005
8
Che
n et
al.
(201
3)C
hina
Asi
an40
042
/140
/218
28.0
/72.
040
064
/168
/168
37.0
/63.
00.
047
8

Page 6 of 19Shi et al. SpringerPlus (2016) 5:2034
Tabl
e 3
The
char
acte
rist
ics
of th
e in
clud
ed s
tudi
es fo
r IL-10
−10
82 A
/G p
olym
orph
ism
and
uro
logi
c ca
ncer
risk
P va
lue
of H
WE
test
<0.
05, w
hich
reac
hed
the
stat
istic
ally
sig
nific
ant l
evel
are
indi
cate
d in
ital
ics
HW
E H
ardy
–Wei
nber
g eq
uilib
rium
, NO
S N
ewca
stle
–Ott
awa
Qua
lity
Ass
essm
ent S
cale
, NA
not a
vaila
ble
Refe
renc
esCo
untr
yEt
hnic
ity
Case
Cont
rol
P va
lue
HW
EN
OS
scor
e
nG
enot
ypes
AA
/AG
/GG
Alle
les
A/G
(%)
nG
enot
ypes
AA
/AG
/GG
Alle
les
A/G
(%)
Pros
tate
can
cer
Dlu
znie
wsk
i et a
l. (2
012)
USA
Mix
ed45
814
6/21
2/10
055
.0/4
5.0
458
112/
242/
104
50.9
/49.
10.
222
7
Faup
el-B
adge
r et a
l. (2
008)
USA
Cauc
asia
n50
917
3/25
1/85
58.6
/41.
438
211
5/19
4/73
55.5
/44.
50.
582
7
Iann
i et a
l. (2
013)
Italy
Cauc
asia
n17
179
/74/
1845
.2/5
4.8
9625
/43/
2848
.4/5
1.6
0.31
27
Kesa
rwan
i et a
l. (2
009)
Indi
aA
sian
159
69/7
8/12
67.9
/32.
125
911
1/10
3/45
62.7
/37.
30.
016
8
Liu
et a
l. (2
010)
Chi
naA
sian
262
222/
36/4
91.6
/8.4
270
240/
27/3
93.9
/6.1
0.03
58
McC
arro
n et
al.
(200
2)U
KCa
ucas
ian
247
78/1
13/5
654
.5/4
5.5
223
46/1
20/5
747
.5/5
2.5
0.23
97
Mic
haud
et a
l. (2
006)
USA
Mix
ed12
4535
6/59
9/29
052
.7/4
7.3
1763
523/
857/
383
54.0
/46.
00.
364
8
Niu
(201
1)C
hina
Asi
an98
24/5
6/18
53.1
/46.
988
42/4
4/2
72.7
/27.
30.
015
7
Om
rani
et a
l. (2
009)
Iran
Cauc
asia
n41
5/31
/550
.0/5
0.0
103
16/7
7/10
52.9
/47.
1<
0.00
017
VanC
leav
e et
al.
(201
0)U
SAA
frica
n19
222
/95/
7536
.3/6
3.7
660
92/2
80/2
8835
.2/6
4.8
0.07
48
Wan
g et
al.
(200
9)U
SACa
ucas
ian
255
56/1
30/6
947
.6/5
2.4
257
83/1
17/5
755
.1/4
4.9
0.19
97
Win
ches
ter e
t al.
(201
5)U
SAM
ixed
832
206/
434/
192
63.0
/37.
083
620
4/42
9/20
350
.1/4
9.9
0.44
78
Xu e
t al.
(200
5)Sw
eden
Cauc
asia
n13
83N
A53
.0/4
7.0
780
NA
51.0
/49.
0N
A8
Zaba
leta
et a
l. (2
008)
USA
Mix
ed54
113
1/27
7/13
349
.8/5
0.2
523
144/
280/
9954
.3/4
5.7
0.07
28
Rena
l can
cer
Bast
urk
et a
l. (2
005)
Turk
eyCa
ucas
ian
2917
/9/3
74.1
/25.
950
32/1
3/5
77.0
/23.
00.
060
7
Coza
r et a
l. (2
007)
Spai
nCa
ucas
ian
126
42/6
2/22
57.9
/42.
117
558
/87/
3058
.0/4
2.0
0.78
78
Hav
rane
k et
al.
(200
5)U
KM
ixed
147
65/5
6/26
63.3
/36.
714
945
/69/
3553
.4/4
6.6
0.39
57
Cha
ng e
t al.
(201
6)Ta
iwan
Asi
an92
71/1
6/5
85.9
/14.
158
044
4/10
7/29
85.8
/14.
2<
0.00
018
Blad
der c
ance
r
Ahi
rwar
et a
l. (2
009)
Indi
aA
sian
214
84/1
12/1
865
.4/3
4.6
385
143/
181/
6160
.6/3
9.4
0.76
88
Che
n et
al.
(201
3)C
hina
Asi
an40
037
4/25
/196
.6/3
.440
035
0/48
/293
.5/6
.50.
799
8

Page 7 of 19Shi et al. SpringerPlus (2016) 5:2034
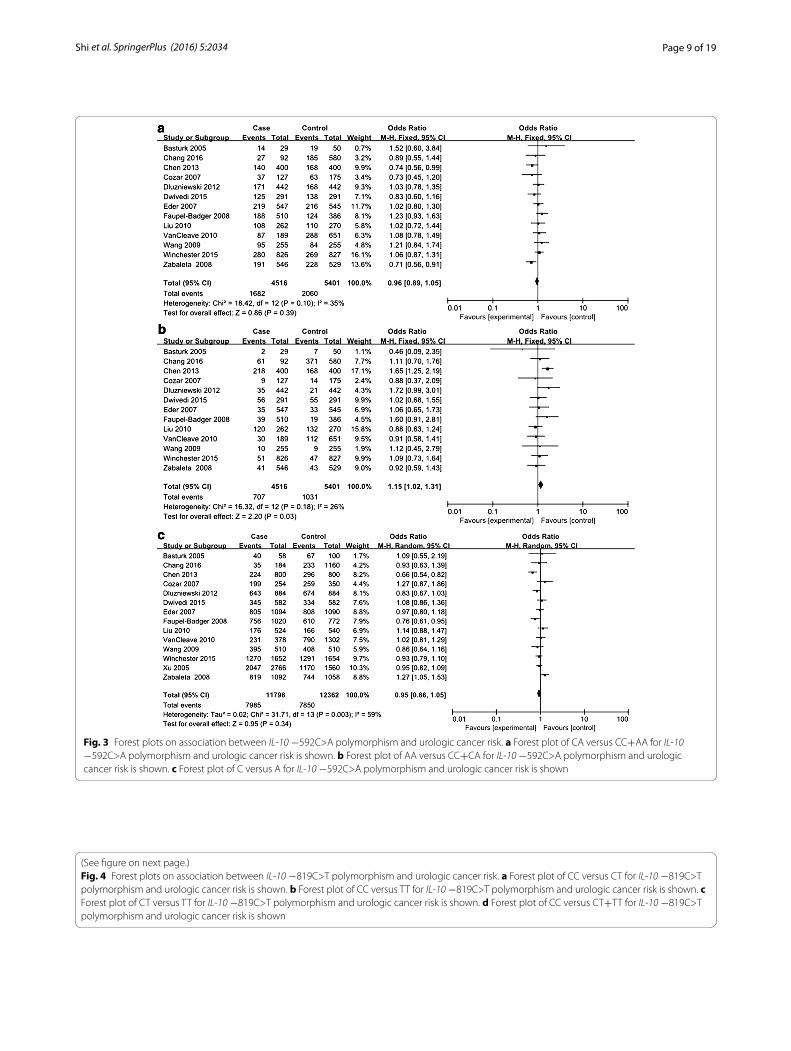
For CC versus CA, CC versus CA+AA, and C versus A, REMs were selected due to severe between-study het-erogeneity. A significant association with urologic cancer was found for IL-10 −592C>A polymorphism in CA ver-sus AA (P = 0.04, OR 0.87, 95% CI 0.76–0.99) and AA versus CC+CA (P = 0.03, OR 1.15, 95% CI 1.02–1.31) (see Figs. 2, 3).
IL‑10 −819C>T polymorphism and urologic cancer riskA total of 13 studies with 4655 cancer cases and 6344 healthy controls were enrolled to evaluate the asso-ciation between IL-10 −819C>T polymorphism and urologic cancer risk (Dwivedi et al. 2015a, b; Faupel-Badger et al. 2008; Liu et al. 2010; VanCleave et al. 2010; Winchester et al. 2015; Zabaleta et al. 2008; Bas-turk et al. 2005; Cozar et al. 2007; Chang et al. 2016; Chen et al. 2013; Kesarwani et al. 2009; Michaud et al. 2006; Ahirwar et al. 2009). HWE test for the control group of eligible studies revealed that 4 studies violated HWE (see Table 2). All genetic models were tested to detect any differences in genotypic and allelic frequen-cies of cases and controls. For CT versus TT, there was only trivial between-study heterogeneity, and FEM was employed for analysis. For CC versus CT, CC versus TT, CC versus CT+TT, CT versus CC+TT, TT versus CC+CT, and C versus T, between-study heterogeneity was obvious, and REMs were adopted for analyses. No significant association with urologic cancer was found for IL-10 −819C>T polymorphism in any genetic mod-els (see Figs. 4, 5).
IL‑10 −1082A>G polymorphism and urologic cancer riskOf the 20 included studies for IL-10 −1082A>G poly-morphism, there were 7401 urologic cancer patients and 8437 controls (Dluzniewski et al. 2012; Faupel-Badger et al. 2008; Liu et al. 2010; VanCleave et al. 2010; Wang et al. 2009; Winchester et al. 2015; Xu et al. 2005; Zabaleta et al. 2008; Basturk et al. 2005; Cozar et al. 2007; Chang et al. 2016; Chen et al. 2013; Kesarwani et al. 2009; Michaud et al. 2006; Ahirwar et al. 2009; Ianni et al. 2013; McCarron et al. 2002; Niu 2011; Omrani et al. 2009; Havranek et al. 2005). Deviations from HWE were found in 5 studies while the remaining 15 studies were in accordance with HWE (see Table 3). For evaluation of the association between IL-10 −1082A>G polymor-phism and urologic cancer risk, frequencies of genotypes and alleles in cases and control subjects were compared
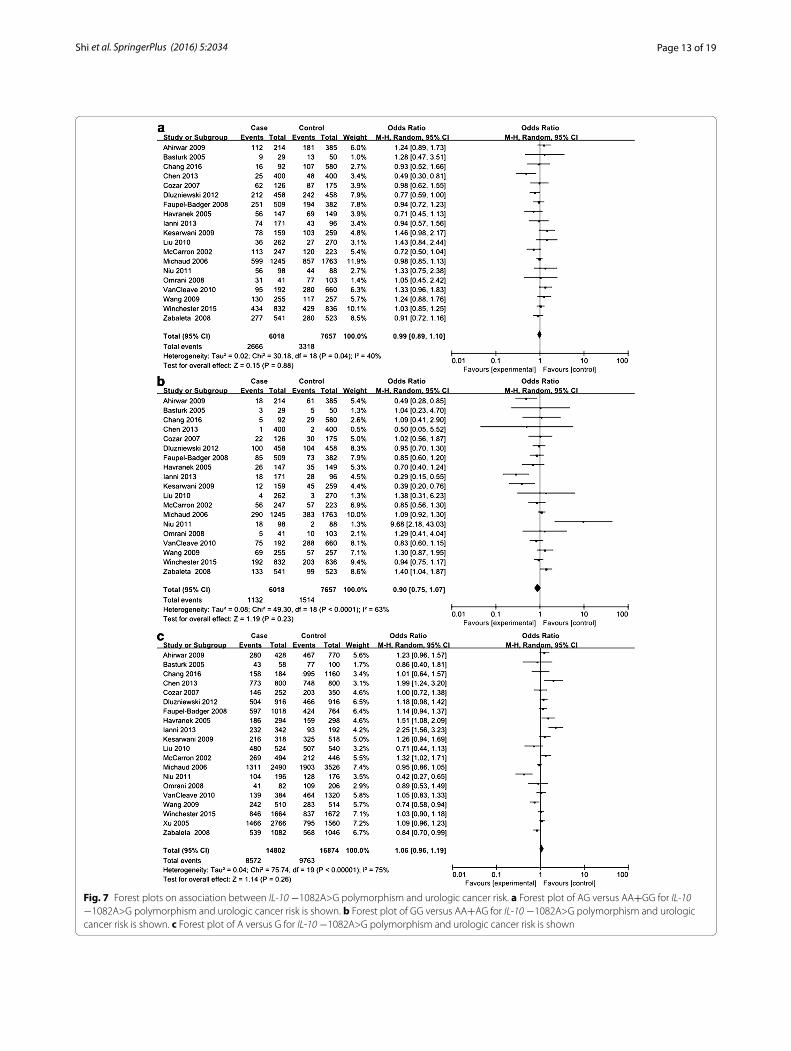
in every genetic model. REMs were used for all analyses on account of striking between-study heterogeneity, and no significant association was detected between IL-10 −1082A>G polymorphism and urologic cancer risk (see Figs. 6, 7).
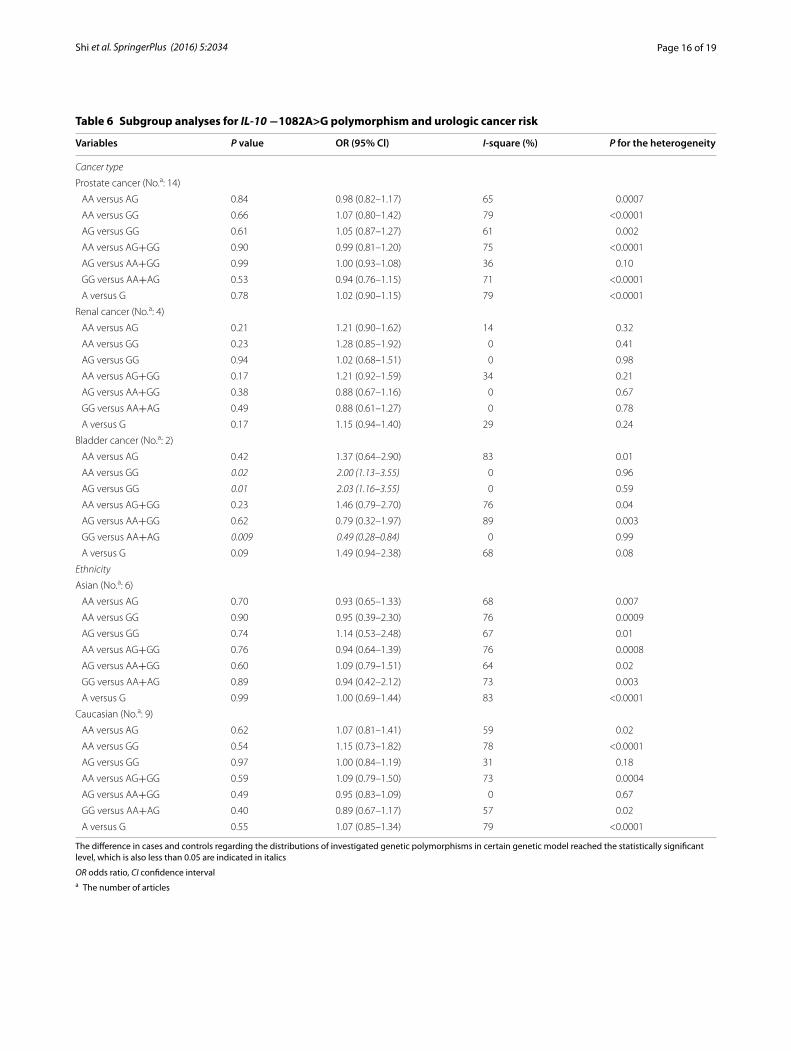
Subgroup analysisFor IL-10 polymorphisms (−592C>A, −819C>T, −1082A>G) and urologic cancer risk, subgroup analy-ses were performed by stratifying available data accord-ing to types of cancer and ethnicity of study population. When data were stratified by cancer types, we found that IL-10 −592C>A polymorphism was significantly associated with bladder cancer risk in CC versus AA (P = 0.002, OR 0.51, 95% CI 0.33–0.78), CA versus AA (P = 0.004, OR 0.64, 95% CI 0.48–0.87), CC versus CA+AA (P = 0.02, OR 0.62, 95% CI 0.41–0.93), CA versus CC+AA (P = 0.04, OR 0.74, 95% CI 0.56–0.99), AA versus CC+CA (P = 0.0004, OR 1.65, 95% CI 1.25–2.19), and C versus A (P = 0.00001, OR 0.66, 95% CI 0.54–0.82). Besides, IL-10 −819C>T polymorphism was significantly correlated with bladder cancer risk in CC versus CT (P = 0.03, OR 0.71, 95% CI 0.52–0.96), CC versus TT (P = 0.0005, OR 0.57, 95% CI 0.41–0.78), CC versus CT+TT (P = 0.002, OR 0.63, 95% CI 0.47–0.84), and C versus T (P < 0.00001, OR 0.72, 95% CI 0.61–0.84). Additionally, IL-10 −1082A>G polymorphism was also significantly associated with the risk of bladder cancer in AA versus GG (P = 0.02, OR 2.00, 95% CI 1.13–3.55), AG versus GG (P = 0.01, OR 2.03, 95% CI 1.16–3.55), and GG versus AA+AG (P = 0.009, OR 0.49, 95% CI 0.28–0.84). When data were subsequently stratified by ethnic-ity, we observed a significant association with urologic cancer risk for IL-10 −819C>T polymorphism in CT ver-sus TT (P = 0.0009, OR 0.81, 95% CI 0.69–0.95). No any other associations were found in subgroup analyses (see Tables 4, 5, 6).
Sensitivity analysisSensitivity analyses were carried out through removing one individual study each time. For IL-10 −519C>A poly-morphism, when the study performed by Dluzniewski et al. (2012), Faupel-Badger et al. (2008) or Chen et al. (2013) was excluded, the significant association with uro-logic cancer was no longer observed in CA versus AA, and AA versus CC+CA. For IL-10 −819C>T polymor-phism, when the study of Liu et al. (2010) or Michaud
(See figure on next page.) Fig. 2 Forest plots on association between IL-10 −592C>A polymorphism and urologic cancer risk. a Forest plot of CC versus CA for IL-10 −592C>A polymorphism and urologic cancer risk is shown. b Forest plot of CC versus AA for IL-10 −592C>A polymorphism and urologic cancer risk is shown. c Forest plot of CA versus AA for IL-10 −592C>A polymorphism and urologic cancer risk is shown. d Forest plot of CC versus CA+AA for IL-10 −592C>A polymorphism and urologic cancer risk is shown

Page 8 of 19Shi et al. SpringerPlus (2016) 5:2034
Page 9 of 19Shi et al. SpringerPlus (2016) 5:2034
Fig. 3 Forest plots on association between IL-10 −592C>A polymorphism and urologic cancer risk. a Forest plot of CA versus CC+AA for IL-10 −592C>A polymorphism and urologic cancer risk is shown. b Forest plot of AA versus CC+CA for IL-10 −592C>A polymorphism and urologic cancer risk is shown. c Forest plot of C versus A for IL-10 −592C>A polymorphism and urologic cancer risk is shown
(See figure on next page.) Fig. 4 Forest plots on association between IL-10 −819C>T polymorphism and urologic cancer risk. a Forest plot of CC versus CT for IL-10 −819C>T polymorphism and urologic cancer risk is shown. b Forest plot of CC versus TT for IL-10 −819C>T polymorphism and urologic cancer risk is shown. c Forest plot of CT versus TT for IL-10 −819C>T polymorphism and urologic cancer risk is shown. d Forest plot of CC versus CT+TT for IL-10 −819C>T polymorphism and urologic cancer risk is shown

Page 10 of 19Shi et al. SpringerPlus (2016) 5:2034

Page 11 of 19Shi et al. SpringerPlus (2016) 5:2034
Fig. 5 Forest plots on association between IL-10 −819C>T polymorphism and urologic cancer risk. a. Forest plot of CT versus CC+TT for IL-10 −819C>T polymorphism and urologic cancer risk is shown. b Forest plot of TT versus CC+CT for IL-10 −819C>T polymorphism and urologic cancer risk is shown. c Forest plot of C versus T for IL-10 −819C>T polymorphism and urologic cancer risk is shown
(See figure on next page.) Fig. 6 Forest plots on association between IL-10 −1082A>G polymorphism and urologic cancer risk. a Forest plot of AA versus AG for IL-10 −1082A>G polymorphism and urologic cancer risk is shown. b Forest plot of AA versus GG for IL-10 −1082A>G polymorphism and urologic cancer risk is shown. c Forest plot of AG versus GG for IL-10 −1082A>G polymorphism and urologic cancer risk is shown. d Forest plot of AA versus AG+GG for IL-10 −1082A>G polymorphism and urologic cancer risk is shown

Page 12 of 19Shi et al. SpringerPlus (2016) 5:2034
Page 13 of 19Shi et al. SpringerPlus (2016) 5:2034
Fig. 7 Forest plots on association between IL-10 −1082A>G polymorphism and urologic cancer risk. a Forest plot of AG versus AA+GG for IL-10 −1082A>G polymorphism and urologic cancer risk is shown. b Forest plot of GG versus AA+AG for IL-10 −1082A>G polymorphism and urologic cancer risk is shown. c Forest plot of A versus G for IL-10 −1082A>G polymorphism and urologic cancer risk is shown

Page 14 of 19Shi et al. SpringerPlus (2016) 5:2034
Table 4 Subgroup analyses for IL-10 −592C>A polymorphism and urologic cancer risk
The difference in cases and controls regarding the distributions of investigated genetic polymorphisms in certain genetic model reached the statistically significant level, which is also less than 0.05 are indicated in italics
OR odds ratio, CI confidence interval, NA not applicablea The number of articles
Variables P value OR (95% Cl) I‑square (%) P for the heterogeneity
Cancer type
Prostate cancer (No.a: 10)
CC versus CA 0.99 1.00 (0.87–1.15) 49 0.05
CC versus AA 0.51 0.94 (0.80–1.12) 22 0.25
CA versus AA 0.37 0.93 (0.79–1.09) 0 0.85
CC versus CA+AA 0.85 0.99 (0.85–1.14) 56 0.02
CA versus CC+AA 0.97 1.00 (0.91–1.09) 36 0.13
AA versus CC+CA 0.47 1.06 (0.91–1.23) 0 0.54
C versus A 0.55 0.97 (0.89–1.07) 49 0.04
Renal cancer (No.a: 3)
CC versus CA 0.35 1.21 (0.80–1.83) 0 0.50
CC versus AA 0.47 1.26 (0.67–2.36) 0 0.83
CA versus AA 0.94 0.99 (0.65–1.49) 0 0.50
CC versus CA+AA 0.30 1.23 (0.83–1.82) 0 0.66
CA versus CC+AA 0.40 0.87 (0.63–1.20) 0 0.39
AA versus CC+CA 0.98 1.00 (0.67–1.47) 0 0.56
C versus A 0.48 1.10 (0.85–1.41) 0 0.55
Bladder cancer (No.a: 1)
CC versus CA 0.30 0.79 (0.50–1.23) NA NA
CC versus AA 0.002 0.51 (0.33–0.78) NA NA
CA versus AA 0.004 0.64 (0.48–0.87) NA NA
CC versus CA+AA 0.02 0.62 (0.41–0.93) NA NA
CA versus CC+AA 0.04 0.74 (0.56–0.99) NA NA
AA versus CC+CA 0.0004 1.65 (1.25–2.19) NA NA
C versus A 0.00001 0.66 (0.54–0.82) NA NA
Ethnicity
Asian (No.a: 4)
CC versus CA 0.57 1.07 (0.84–1.37) 0 0.44
CC versus AA 0.70 0.91 (0.55–1.50) 68 0.03
CA versus AA 0.05 0.82 (0.68–1.00) 40 0.17
CC versus CA+AA 0.93 0.98 (0.66–1.46) 58 0.07
CA versus CC+AA 0.06 0.85 (0.71–1.01) 0 0.58
AA versus CC+CA 0.38 1.15 (0.84–1.58) 66 0.03
C versus A 0.61 0.93 (0.70–1.23) 78 0.003
Caucasian (No.a: 7)
CC versus CA 0.89 0.99 (0.86–1.13) 52 0.06
CC versus AA 0.31 0.87 (0.66–1.14) 0 0.58
CA versus AA 0.37 0.88 (0.66–1.16) 0 0.75
CC versus CA+AA 0.84 0.98 (0.80–1.20) 53 0.06
CA versus CC+AA 1.00 1.00 (0.82–1.22) 49 0.08
AA versus CC+CA 0.30 1.15 (0.88–1.51) 0 0.70
C versus A 0.31 0.96 (0.88–1.04) 35 0.16

Page 15 of 19Shi et al. SpringerPlus (2016) 5:2034
Table 5 Subgroup analyses for IL-10 −819C>T polymorphism and urologic cancer risk
The difference in cases and controls regarding the distributions of investigated genetic polymorphisms in certain genetic model reached the statistically significant level, which is also less than 0.05 are indicated in italics
OR odds ratio, CI confidence intervala The number of articles
Variables P value OR (95% Cl) I‑square (%) P for the heterogeneity
Cancer type
Prostate cancer (No.a: 8)
CC versus CT 0.22 1.10 (0.95–1.27) 46 0.07
CC versus TT 0.18 1.11 (0.95–1.30) 27 0.22
CT versus TT 0.79 0.98 (0.85–1.14) 0 0.68
CC versus CT+TT 0.27 1.09 (0.94–1.27) 56 0.03
CT versus CC+TT 0.16 0.94 (0.86–1.03) 32 0.17
TT versus CC+CT 0.63 0.97 (0.84–1.11) 9 0.36
C versus T 0.44 1.05 (0.93–1.17) 58 0.02
Renal cancer (No.a: 3)
CC versus CT 0.75 1.07 (0.71–1.59) 40 0.19
CC versus TT 0.77 0.85 (0.30–2.46) 60 0.08
CT versus TT 0.15 0.74 (0.49–1.11) 26 0.26
CC versus CT+TT 0.71 0.87 (0.42–1.80) 61 0.08
CT versus CC+TT 0.13 0.78 (0.57–1.08) 12 0.32
TT versus CC+CT 0.08 1.42 (0.96–2.09) 50 0.13
C versus T 0.74 0.91 (0.52–1.60) 77 0.01
Bladder cancer (No.a: 2)
CC versus CT 0.03 0.71 (0.52–0.96) 0 0.51
CC versus TT 0.0005 0.57 (0.41–0.78) 0 0.45
CT versus TT 0.29 0.79 (0.51–1.23) 68 0.08
CC versus CT+TT 0.002 0.63 (0.47–0.84) 0 0.88
CT versus CC+TT 0.85 0.95 (0.58–1.57) 80 0.02
TT versus CC+CT 0.05 1.42 (1.01–2.00) 55 0.14
C versus T <0.00001 0.72 (0.61–0.84) 21 0.26
Ethnicity
Asian (No.a: 6)
CC versus CT 0.91 0.98 (0.72–1.35) 56 0.04
CC versus TT 0.30 0.81 (0.55–1.21) 69 0.006
CT versus TT 0.009 0.81 (0.69–0.95) 34 0.18
CC versus CT+TT 0.54 0.89 (0.62–1.28) 70 0.005
CT versus CC+TT 0.05 0.87 (0.75–1.00) 36 0.17
TT versus CC+CT 0.09 1.23 (0.97–1.56) 60 0.03
C versus T 0.21 0.87 (0.70–1.08) 77 0.0005
Caucasian (No.a: 4)
CC versus CT 0.81 1.04 (0.74–1.48) 64 0.04
CC versus TT 0.25 0.81 (0.57–1.16) 33 0.21
CT versus TT 0.22 0.79 (0.55–1.15) 0 0.53
CC versus CT+TT 0.89 1.03 (0.72–1.46) 68 0.02
CT versus CC+TT 0.77 0.95 (0.69–1.31) 58 0.07
TT versus CC+CT 0.33 1.22 (0.82–1.80) 13 0.33
C versus T 0.97 1.01 (0.75–1.34) 68 0.02
Page 16 of 19Shi et al. SpringerPlus (2016) 5:2034
Table 6 Subgroup analyses for IL-10 −1082A>G polymorphism and urologic cancer risk
The difference in cases and controls regarding the distributions of investigated genetic polymorphisms in certain genetic model reached the statistically significant level, which is also less than 0.05 are indicated in italics
OR odds ratio, CI confidence intervala The number of articles
Variables P value OR (95% Cl) I‑square (%) P for the heterogeneity
Cancer type
Prostate cancer (No.a: 14)
AA versus AG 0.84 0.98 (0.82–1.17) 65 0.0007
AA versus GG 0.66 1.07 (0.80–1.42) 79 <0.0001
AG versus GG 0.61 1.05 (0.87–1.27) 61 0.002
AA versus AG+GG 0.90 0.99 (0.81–1.20) 75 <0.0001
AG versus AA+GG 0.99 1.00 (0.93–1.08) 36 0.10
GG versus AA+AG 0.53 0.94 (0.76–1.15) 71 <0.0001
A versus G 0.78 1.02 (0.90–1.15) 79 <0.0001
Renal cancer (No.a: 4)
AA versus AG 0.21 1.21 (0.90–1.62) 14 0.32
AA versus GG 0.23 1.28 (0.85–1.92) 0 0.41
AG versus GG 0.94 1.02 (0.68–1.51) 0 0.98
AA versus AG+GG 0.17 1.21 (0.92–1.59) 34 0.21
AG versus AA+GG 0.38 0.88 (0.67–1.16) 0 0.67
GG versus AA+AG 0.49 0.88 (0.61–1.27) 0 0.78
A versus G 0.17 1.15 (0.94–1.40) 29 0.24
Bladder cancer (No.a: 2)
AA versus AG 0.42 1.37 (0.64–2.90) 83 0.01
AA versus GG 0.02 2.00 (1.13–3.55) 0 0.96
AG versus GG 0.01 2.03 (1.16–3.55) 0 0.59
AA versus AG+GG 0.23 1.46 (0.79–2.70) 76 0.04
AG versus AA+GG 0.62 0.79 (0.32–1.97) 89 0.003
GG versus AA+AG 0.009 0.49 (0.28–0.84) 0 0.99
A versus G 0.09 1.49 (0.94–2.38) 68 0.08
Ethnicity
Asian (No.a: 6)
AA versus AG 0.70 0.93 (0.65–1.33) 68 0.007
AA versus GG 0.90 0.95 (0.39–2.30) 76 0.0009
AG versus GG 0.74 1.14 (0.53–2.48) 67 0.01
AA versus AG+GG 0.76 0.94 (0.64–1.39) 76 0.0008
AG versus AA+GG 0.60 1.09 (0.79–1.51) 64 0.02
GG versus AA+AG 0.89 0.94 (0.42–2.12) 73 0.003
A versus G 0.99 1.00 (0.69–1.44) 83 <0.0001
Caucasian (No.a: 9)
AA versus AG 0.62 1.07 (0.81–1.41) 59 0.02
AA versus GG 0.54 1.15 (0.73–1.82) 78 <0.0001
AG versus GG 0.97 1.00 (0.84–1.19) 31 0.18
AA versus AG+GG 0.59 1.09 (0.79–1.50) 73 0.0004
AG versus AA+GG 0.49 0.95 (0.83–1.09) 0 0.67
GG versus AA+AG 0.40 0.89 (0.67–1.17) 57 0.02
A versus G 0.55 1.07 (0.85–1.34) 79 <0.0001
Page 17 of 19Shi et al. SpringerPlus (2016) 5:2034
et al. (2006) was removed, the null association with urologic cancer in CT versus TT was altered. For IL-10 −1082A>G polymorphism, however, removing any study did not impact the overall results.
Publication biasPotential publication bias was evaluated with fun-nel plots. Visual inspection of funnel plots revealed no apparent asymmetry for IL-10 −592C>A, −819C>T, and −1082A>G polymorphisms. And these results indicated that significant publication bias was unlikely.
DiscussionUrologic cancer is a major public health problem. According to a recent survey, prostate cancer, renal cancer and bladder cancer altogether accounted for 13.3% (1879,000/14090,000) new cancer cases and 7.5% (616,000/8201,000) cancer-related deaths worldwide in 2012, making the urologic cancer ranked as the second most common group of malignancies in terms of mor-bidity, and the third most common group of malignan-cies in terms of mortality (Ferlay et al. 2015).
To date, the etiologies of urologic cancer are still largely unknown in spite of extensive studies. However, it has become evident recently that multiple immunomodu-latory cytokines are implicated in the process of tumor genesis (Kurzrock 2001; Smyth et al. 2004). Among these cytokines, IL-10 is a multifunctional immunological reg-ulator mainly produced by B cells, T cells and activated monocytes/marcophages. As an important modulator of immune responses, IL-10 can be both tumor-promoting and tumor-inhibiting since it has both immunosuppres-sive and anti-angiogenic functions (Mocellin et al. 2005). On the one hand, the immunosuppressive property of IL-10 may suppress anti-tumor immune responses and promote tumor development. On the other hand, the anti-angiogenic property of IL-10 may inhibit microvas-culature formation and tumor growth. Previous studies have found that serum level of IL-10 was significantly elevated in urologic cancer, and it was closely correlated with tumor progression and metastasis (Stearns et al. 1999; Uwatoko et al. 2002; Dwivedi et al. 2015a, b), which suggested that IL-10 may play a vital role in the develop-ment of urologic cancer.IL-10 gene is located on chromosome 1q31–32. Com-
mon promoter region polymorphisms of IL-10 gene, −592C>A (rs1800872), −819C>T (rs1800871) and −1082A>G (rs1800896) were found to influence the pro-duction of IL-10 (Turner et al. 1997; Kingo et al. 2005). Consequently, it is biologically plausible that these poly-morphisms may be associated with susceptibility to uro-logic cancer.
Recently, numerous studies have tried to explore the potential associations between IL-10 polymorphisms and the risk of urologic cancer, but the results were contradicted. Thus, we conducted the present meta-analysis to solve the conflict and obtain a more con-clusive result. And our overall analyses suggested that IL-10 −592C>A polymorphism was significantly associ-ated with the risk of urologic cancer in CA versus AA, and AA versus CC+CA. However, we failed to detect any significant associations with urologic cancer for IL-10 −819C>T and −1082A>G polymorphisms in overall analyses. Considering the differences of carcinogenic mechanisms for each type of cancer and the importance of ethnic background in genetic investigations, stratified analyses were subsequently performed by categorizing included studies into different subgroups on the basis of types of cancer and ethnicity of study population. When data were stratified by types of cancer, we found that IL-10 −592C>A, −819C>T and −1082A>G polymorphisms were all significantly associated with the risk of bladder cancer in certain genetic models. In addition, the A allele of −592C>A polymorphism and T allele of −819C>T polymorphism conferred an increased susceptibility to bladder cancer. When data were stratified by ethnicity of study population, a significant association with urologic cancer risk in Asians was detected for IL-10 −819C>T polymorphism in CT versus TT. No any other signifi-cant associations between IL-10 polymorphisms and urologic cancer risk were observed in subgroup analyses. For the evaluation of the heterogeneity, we found that the between-study heterogeneity remained significant in sev-eral subgroup comparisons, suggesting that differences in cancer type and ethnicity could not fully elucidate the observed inconsistent results, and other unmeasured characteristics of study participants may partially attrib-ute to the heterogeneity between studies. Moreover, we noticed a substantial decrease of heterogeneity for IL-10 −592C>A polymorphism when the study performed by Zabaleta et al. (2008) was omitted, and that for IL-10 −819C>T polymorphism when the study conducted by Chen et al. (2013) was removed or that for IL-10 1082A>G polymorphism when the studies of Ianni et al. (2013) and Niu (2011) were excluded, which suggested that these studies were the major sources of the observed heterogeneity.
This study is certainly not without limitations. Firstly, the number of studies investigating the associations of certain IL-10 polymorphisms with renal cancer or blad-der cancer is still limited, and sample size of several included studies were obviously not sufficient, which precluded us from drawing definite conclusions. Sec-ondly, our results were based on unadjusted estimates

Page 18 of 19Shi et al. SpringerPlus (2016) 5:2034
since the majority of included studies failed to report baseline characteristics of individuals, such as age, sex, smoking status and eating habits. And lack of analyses adjusted for these potential confounding factors may affect the reliability of our results. Thirdly, although funnel plots revealed no apparent publication bias, we still could not eliminate the possibility of publica-tion bias since only published studies were included. Fourthly, all included studies were published in English or Chinese, therefore, maybe some qualified articles in other languages were missed. Fifthly, genetic associa-tions of IL-10 polymorphisms with urologic cancer may also be influenced by gene–gene and gene-environ-mental interactions. It is possible that one certain poly-morphism may be associated with the risk of urologic cancer, but due to interactions with multiple genes and environmental factors, the association would no longer be observed.
ConclusionsIn conclusion, the current meta-analysis suggests that IL-10 −592C>A polymorphism may implicate with urologic cancer risk. Besides, promoter region polymorphisms of IL-10 may serve as potential biological markers, espe-cially for bladder cancer. Furthermore, IL-10 −819C>T polymorphism may contribute to urologic cancer sus-ceptibility in Asians while all the three studied variants of IL-10 did not relate to Caucasian urologic cancer predis-position. However, it should be pointed out that the pre-sent results concerning renal cancer and bladder cancer were based on limited number of case–control studies, and further multi-center studies with larger sample size from different populations are warranted to confirm our results. Besides, given that immunomodulating cytokines play a crucial role in regulating anti-tumor immune responses, future investigations are needed to explore the potential roles of other polymorphisms of these cytokine genes in the occurrence and development of urologic cancer.
Authors’ contributionsXHS and SWL conceived of the study, participated in its design. XHS and XCX conducted the systematic literature review. XSX and YXJ performed data analyses. XHS, XCX and SWL drafted the manuscript. All authors read and approved the final manuscript.
Author details1 Division of Reproductive Medical Center, West China Second University Hos-pital, Sichuan University, Chengdu, Sichuan, China. 2 Key Laboratory of Birth Defects and Related Diseases of Women and Children, West China Second University Hospital of Sichuan University, Chengdu, Sichuan, China. 3 Depart-ment of Cardiology, West China Hospital, Sichuan University, Chengdu, Sichuan, China. 4 West China School of Public Health, Sichuan University, Chengdu, Sichuan, China.
AcknowledgementsThe authors have no support or funding to report.
Competing interestsThe authors declare that they have no competing interests.
Received: 3 June 2016 Accepted: 18 November 2016
ReferencesAhirwar D, Mandhani A, Mittal RD (2009) Interleukin-10 G-1082A and C-819T
polymorphisms as possible molecular markers of urothelial bladder cancer. Arch Med Res 40:97–102
Basturk B, Yavascaoglu I, Vuruskan H et al (2005) Cytokine gene polymor-phisms as potential risk and protective factors in renal cell carcinoma. Cytokine 30:41–45
Chang WS, Liao CH, Tsai CW et al (2016) The role of IL-10 promoter polymor-phisms in renal cell carcinoma. Anticancer Res 36:2205–2209
Chen ZG, Zhou W, Dai MJ, Wu ZG, Jin R (2013) Association between the inter-action polymorphisms of interleukin-10 and smoking on patients with bladder cancer risk from a case–control study. Zhonghua Liu Xing Bing Xue Za Zhi 34:183–186
Cozar JM, Romero JM, Aptsiauri N et al (2007) High incidence of CTLA-4 AA (CT60) polymorphism in renal cell cancer. Hum Immunol 68:698–704
Dluzniewski PJ, Wang MH, Zheng SL et al (2012) Variation in IL10 and other genes involved in the immune response and in oxidation and prostate cancer recurrence. Cancer Epidemiol Biomark Prev 21:1774–1782
Dwivedi S, Goel A, Khattri S et al (2015a) Genetic variability at promoters of IL-18 (pro-) and IL-10 (anti-) inflammatory gene affects susceptibility and their circulating serum levels: an explorative study of prostate cancer patients in North Indian populations. Cytokine 74:117–122
Dwivedi S, Goel A, Mandhani A et al (2015b) Functional genetic variability at promoters of pro-(IL-18) and anti-(IL-10) inflammatory affects their mRNA expression and survival in prostate carcinoma patients: five year follow-up study. Prostate 75:1737–1746
Eder T, Mayer R, Langsenlehner U et al (2007) Interleukin-10 [ATA] promoter haplotype and prostate cancer risk: a population-based study. Eur J Cancer 43:472–475
Eskdale J, Kube D, Tesch H, Gallagher G (1997) Mapping of the human IL10 gene and further characterization of the 5′ flanking sequence. Immuno-genetics 46:120–128
Faupel-Badger JM, Kidd LC, Albanes D, Virtamo J, Woodson K, Tangrea JA (2008) Association of IL-10 polymorphisms with prostate cancer risk and grade of disease. World J Urol 19:119–124
Ferlay J, Soerjomataram I, Dikshit R et al (2015) Cancer incidence and mortality worldwide: sources, methods and major patterns in GLOBOCAN 2012. Int J Cancer 136:E359–E386
Havranek E, Howell WM, Fussell HM, Whelan JA, Whelan MA, Pandha HS (2005) An interleukin-10 promoter polymorphism may influence tumor devel-opment in renal cell carcinoma. J Urol 173:709–712
Ianni M, Porcellini E, Carbone I et al (2013) Genetic factors regulating inflam-mation and DNA methylation associated with prostate cancer. Prostate Cancer Prostatic Dis 16:56–60
Jiang W, Sun G, Xiong J, Xi X, Shi Z (2014) Association of CYP1B1 L432V polymorphism with urinary cancer susceptibility: a meta-analysis. Diagn Pathol 9:113
Kesarwani P, Ahirwar DK, Mandhani A et al (2009) IL-10 1082 G>A: a risk for prostate cancer but may be protective against progression of prostate cancer in North Indian cohort. World J Urol 27:389–396
Kingo K, Ratsep R, Koks S, Karelson M, Silm H, Vasar E (2005) Influence of genetic polymorphisms on interleukin-10 mRNA expression and psoriasis susceptibility. J Dermatol Sci 37:111–113
Kurzrock R (2001) Cytokine deregulation in cancer. Biomed Pharmacother 55:543–547
Liu J, Song B, Bai X et al (2010) Association of genetic polymorphisms in the interleukin-10 promoter with risk of prostate cancer in Chinese. BMC Cancer 10:456
McCarron SL, Edwards S, Evans PR et al (2002) Influence of cytokine gene polymorphisms on the development of prostate cancer. Cancer Res 62:3369–3372

Page 19 of 19Shi et al. SpringerPlus (2016) 5:2034
Michaud DS, Daugherty SE, Berndt SI et al (2006) Genetic polymorphisms of interleukin-1B (IL-1B), IL-6, IL-8, and IL-10 and risk of prostate cancer. Cancer Res 66:4525–4530
Mocellin S, Marincola FM, Young HA (2005) Interleukin-10 and the immune response against cancer: a counterpoint. J Leukoc Biol 78:1043–1051
Niu WQ (2011) The study on the association between the IL-10 promoter genetic polymorphisms and prostate cancer in Hubei Hans population. Int J Lab Med 32:41–43
Omrani MD, Bazargani S, Bageri M (2009) Interlukin-10, interferon-g and tumor necrosis factor—a genes variation in prostate cancer and benign prostatic hyperplasia. Curr Urol 2:175–180
Siegel R, Ma J, Zou Z, Jemal A (2014) Cancer statistics, 2014. CA Cancer J Clin 64:9–29
Smyth MJ, Cretney E, Kershaw MH, Hayakawa Y (2004) Cytokines in cancer immunity and immunotherapy. Immunol Rev 202:275–293
Stearns ME, Rhim J, Wang M (1999) Interleukin 10 (IL-10) inhibition of primary human prostate cell-induced angiogenesis: IL-10 stimulation of tissue inhibitor of metalloproteinase-1 and inhibition of matrix metalloprotein-ase (MMP)-2/MMP-9 secretion. Clin Cancer Res 5:189–196
Turner DM, Williams DM, Sankaran D, Lazarus M, Sinnott PJ, Hutchinson IV (1997) An investigation of polymorphism in the interleukin-10 gene promoter. Eur J Immunogenet 24:1–8
Uwatoko N, Tokunaga T, Hatanaka H et al (2002) Expression of interleukin-10 is inversely correlated with distant metastasis of renal cell carcinoma. Int J Oncol 20:729–733
VanCleave TT, Moore JH, Benford ML et al (2010) Interaction among variant vascular endothelial growth factor (VEGF) and its receptor in relation to prostate cancer risk. Prostate 70:341–352
Wang MH, Helzlsouer KJ, Smith MW et al (2009) Association of IL10 and other immune response-and obesity-related genes with prostate cancer in CLUE II. Prostate 69:874–885
Winchester DA, Till C, Goodman PJ et al (2015) Variation in genes involved in the immune response and prostate cancer risk in the placebo arm of the prostate cancer prevention trial. Prostate 75:1403–1418
Xu J, Lowey J, Wiklund F et al (2005) The interaction of four genes in the inflammation pathway significantly predicts prostate cancer risk. Cancer Epidemiol Biomark Prev 14:2563–2568
Zabaleta J, Lin HY, Sierra RA et al (2008) Interactions of cytokine gene polymor-phisms in prostate cancer risk. Carcinogenesis 29:573–578
Zhang R, Wang J, Yang R et al (2014) Effects of Pro12Ala polymorphism in per-oxisome proliferator-activated receptor-γ2 gene on metabolic syndrome risk: a meta-analysis. Gene 535:79–87