open access discussions analysis of a winter regional … · open access discussions analysis of a...
TRANSCRIPT

Atmos. Chem. Phys., 13, 5685–5696, 2013www.atmos-chem-phys.net/13/5685/2013/doi:10.5194/acp-13-5685-2013© Author(s) 2013. CC Attribution 3.0 License.
EGU Journal Logos (RGB)
Advances in Geosciences
Open A
ccess
Natural Hazards and Earth System
Sciences
Open A
ccess
Annales Geophysicae
Open A
ccessNonlinear Processes
in Geophysics
Open A
ccess
Atmospheric Chemistry
and PhysicsO
pen Access
Atmospheric Chemistry
and Physics
Open A
ccess
Discussions
Atmospheric Measurement
Techniques
Open A
ccess
Atmospheric Measurement
Techniques
Open A
ccess
Discussions
Biogeosciences
Open A
ccess
Open A
ccess
BiogeosciencesDiscussions
Climate of the Past
Open A
ccess
Open A
ccess
Climate of the Past
Discussions
Earth System Dynamics
Open A
ccess
Open A
ccess
Earth System Dynamics
Discussions
GeoscientificInstrumentation
Methods andData Systems
Open A
ccess
GeoscientificInstrumentation
Methods andData Systems
Open A
ccess
Discussions
GeoscientificModel Development
Open A
ccess
Open A
ccess
GeoscientificModel Development
Discussions
Hydrology and Earth System
Sciences
Open A
ccess
Hydrology and Earth System
Sciences
Open A
ccess
Discussions
Ocean Science
Open A
ccess
Open A
ccess
Ocean ScienceDiscussions
Solid Earth
Open A
ccess
Open A
ccess
Solid EarthDiscussions
The Cryosphere
Open A
ccess
Open A
ccess
The CryosphereDiscussions
Natural Hazards and Earth System
Sciences
Open A
ccess
Discussions
Analysis of a winter regional haze event and its formationmechanism in the North China Plain
X. J. Zhao, P. S. Zhao, J. Xu, W. Meng,, W. W. Pu, F. Dong, D. He, and Q. F. Shi
Institute of Urban Meteorology, Chinese Meteorological Administration, Beijing 100089, China
Correspondence to:X. J. Zhao ([email protected])
Received: 9 November 2012 – Published in Atmos. Chem. Phys. Discuss.: 9 January 2013Revised: 29 April 2013 – Accepted: 2 May 2013 – Published: 13 June 2013
Abstract. A regional haze episode occurred in the Beijing,Tianjin and Hebei province (BTH) area in the North ChinaPlain (NCP) from 16 to 19 January 2010. Data were collectedand analyzed during the time frame of 14 through 23 January2010 to include the haze event. The increase of secondaryinorganic pollutants (SO2−
4 , NO−
3 , NH+
4 ) in PM2.5 was ob-served simultaneously at four sites, especially in the plainarea of the BTH, which could be identified as a commoncharacteristic of pollution haze in east China. The sulfate andnitrate in PM2.5 were mainly formed through the heteroge-neous reaction process in the urban area. The organic matter(OM) increased more significantly at the Chengde (CD) sitethan the other three sites in the plain area. The secondary or-ganic aerosols only existed during haze days at CD but inboth haze and non-haze days at the other three sites, whichsuggested the greater regional impact of secondary forma-tion process during the haze episode. The secondary forma-tion of aerosol was one important formation mechanism ofhaze. The strong temperature inversion and descending airmotions in the planetary boundary layer (PBL) allowed pol-lutants to accumulate in a shallow layer. The weak surfacewind speed produced high pollutants concentration withinsource regions. The accumulation of pollutants was one mainfactor in the haze formation. The enhanced southwest windin the last period of this episode transported pollutants to thedownwind area and expanded the regional scope of the haze.
1 Introduction
China has undergone very rapid economic growth since theeconomic reforms began in 1978 and this has resulted inan increase in energy consumption, air pollution and asso-
ciated health effects. In China large emissions were concen-trated in the megacity clusters, such as BTH, the Pearl Riverdelta (PRD) and the Yangtze River delta (YRD) regions (Par-rish and Zhu, 2009). The BTH is one region in north Chinawhere the economic development is most active. It consistsof two municipalities, Beijing and Tianjin, the capital cityShijiazhuang and other six cities of Hebei province. Chengdeis one of the six cities and located in the northern mountain-ous area of Hebei.
With the rapid economic development, population expan-sion and urbanization, the BTH region has been experiencinga severe air pollution problem, especially aerosol pollution.The decrease of visibility is one of the most notable effects ofaerosol. In the BTH region, the visibility showed a decreas-ing trend during 1980–2008 and haze days increased after the1990s (Zhao et al., 2011a). In the urban area, haze days usu-ally accompany severe air pollution. Numerous field studiesprovide abundant information about concentrations, compo-sitions, source and optical properties of aerosol particles inmajor cities and other areas in the BTH. By comparing thedifferent chemical characteristics of aerosols in dust, haze,and clear days in Beijing, Wang et al. (2005) pointed outthat (NH4)2SO4, NH4NO3, and Ca(NO3)2 were the majorspecies on haze days in spring. Sun et al. (2006) investigatedthe chemical characteristics of PM2.5 and PM10 in haze–fogepisodes in Beijing and found that the concentrations of el-ements and water-soluble ions in haze–fog episodes weremore than 10 times higher than those on non-episode days.The serious air pollution in haze–fog episodes was stronglycorrelated with the meteorological conditions and the emis-sions of pollutants from anthropogenic sources. With analy-sis of the phase and mixing state of individual aerosol par-ticles, Li et al. (2010) found that the agricultural biomass
Published by Copernicus Publications on behalf of the European Geosciences Union.
5686 X. J. Zhao et al.: Analysis of a winter regional haze event
1
2
3
4
5
6
7
8
9
10
11
12
13
14
15
16
17
18
19
20
21
22
23
Fig 1. Sampling sites of PM2.5 24
25
26
27
28
29
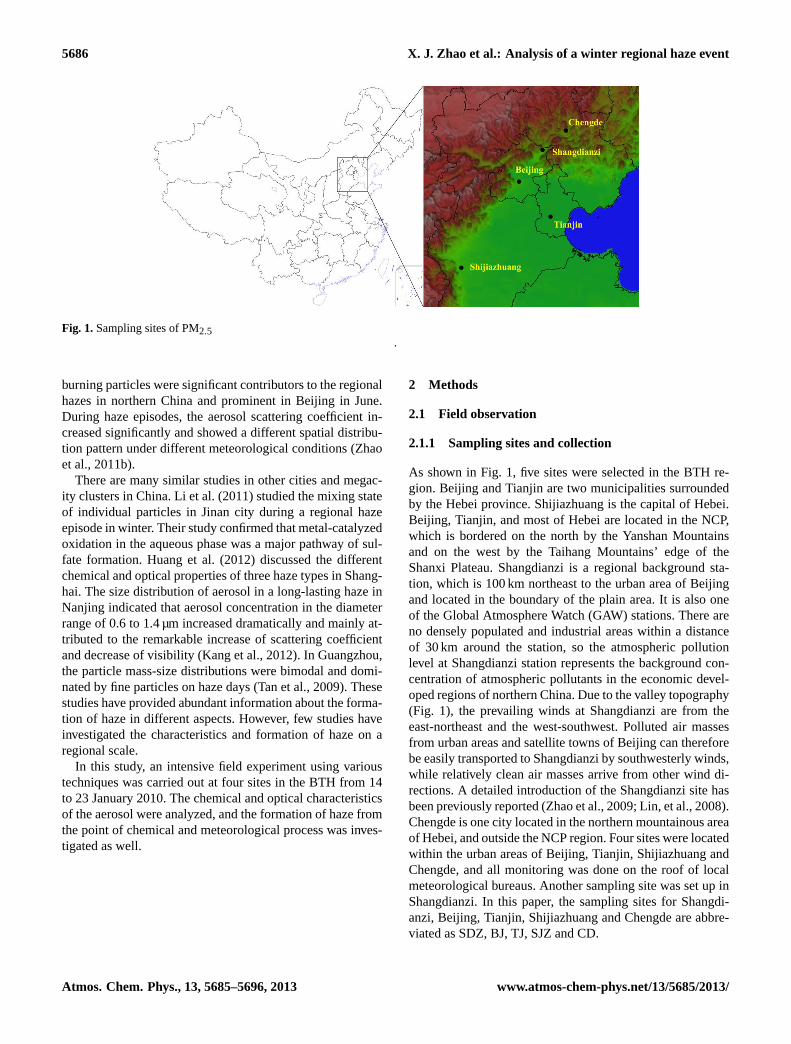
Fig. 1.Sampling sites of PM2.5.
burning particles were significant contributors to the regionalhazes in northern China and prominent in Beijing in June.During haze episodes, the aerosol scattering coefficient in-creased significantly and showed a different spatial distribu-tion pattern under different meteorological conditions (Zhaoet al., 2011b).
There are many similar studies in other cities and megac-ity clusters in China. Li et al. (2011) studied the mixing stateof individual particles in Jinan city during a regional hazeepisode in winter. Their study confirmed that metal-catalyzedoxidation in the aqueous phase was a major pathway of sul-fate formation. Huang et al. (2012) discussed the differentchemical and optical properties of three haze types in Shang-hai. The size distribution of aerosol in a long-lasting haze inNanjing indicated that aerosol concentration in the diameterrange of 0.6 to 1.4 µm increased dramatically and mainly at-tributed to the remarkable increase of scattering coefficientand decrease of visibility (Kang et al., 2012). In Guangzhou,the particle mass-size distributions were bimodal and domi-nated by fine particles on haze days (Tan et al., 2009). Thesestudies have provided abundant information about the forma-tion of haze in different aspects. However, few studies haveinvestigated the characteristics and formation of haze on aregional scale.
In this study, an intensive field experiment using varioustechniques was carried out at four sites in the BTH from 14to 23 January 2010. The chemical and optical characteristicsof the aerosol were analyzed, and the formation of haze fromthe point of chemical and meteorological process was inves-tigated as well.
2 Methods
2.1 Field observation
2.1.1 Sampling sites and collection
As shown in Fig. 1, five sites were selected in the BTH re-gion. Beijing and Tianjin are two municipalities surroundedby the Hebei province. Shijiazhuang is the capital of Hebei.Beijing, Tianjin, and most of Hebei are located in the NCP,which is bordered on the north by the Yanshan Mountainsand on the west by the Taihang Mountains’ edge of theShanxi Plateau. Shangdianzi is a regional background sta-tion, which is 100 km northeast to the urban area of Beijingand located in the boundary of the plain area. It is also oneof the Global Atmosphere Watch (GAW) stations. There areno densely populated and industrial areas within a distanceof 30 km around the station, so the atmospheric pollutionlevel at Shangdianzi station represents the background con-centration of atmospheric pollutants in the economic devel-oped regions of northern China. Due to the valley topography(Fig. 1), the prevailing winds at Shangdianzi are from theeast-northeast and the west-southwest. Polluted air massesfrom urban areas and satellite towns of Beijing can thereforebe easily transported to Shangdianzi by southwesterly winds,while relatively clean air masses arrive from other wind di-rections. A detailed introduction of the Shangdianzi site hasbeen previously reported (Zhao et al., 2009; Lin, et al., 2008).Chengde is one city located in the northern mountainous areaof Hebei, and outside the NCP region. Four sites were locatedwithin the urban areas of Beijing, Tianjin, Shijiazhuang andChengde, and all monitoring was done on the roof of localmeteorological bureaus. Another sampling site was set up inShangdianzi. In this paper, the sampling sites for Shangdi-anzi, Beijing, Tianjin, Shijiazhuang and Chengde are abbre-viated as SDZ, BJ, TJ, SJZ and CD.
Atmos. Chem. Phys., 13, 5685–5696, 2013 www.atmos-chem-phys.net/13/5685/2013/

X. J. Zhao et al.: Analysis of a winter regional haze event 5687
Aerosol samples of PM2.5 were collected on 90 mmpolypropylene membrane filters and quartz fiber filters us-ing two parallel medium-volume samplers (100 L min−1) ateach site. The duration of sampling was generally 24 h from09:00 to 08:00 LT (local time) the following day. Polypropy-lene membrane filters were used for analysis of inorganic el-ements. Quartz fiber filters were used for carbon and water-soluble ion components, and preheated at 800◦C for 3 h be-fore using. All of the filters were weighed with an analyticalbalance (Mettler XS105DU, reading precision 0.01 mg). Be-fore and after sampling, the filters were weighed after beingequilibrated for 24 h in a desiccator. All the samples werestored in a refrigerator under 3◦C and analyzed for chemicalspecies within one month. More detailed information aboutthe quality control of sampling, weighting and analyzing offilters has been provided in another work (Zhao et al., 2013).
2.1.2 Automatic PM2.5 and gases monitor
The real-time mass concentrations of PM2.5 were measuredby a tapered element oscillating microbalance (Thermo Elec-tron Corporation, TEOM 1400a at BJ and SDZ and 1405Dat TJ). Concentrations of sulfur dioxide (SO2), ozone (O3)
and its precursors (CO, NO, NO2 and NOx) at the BJ sta-tion were observed by a set of commercial instruments fromEcotech, Inc., Australia. The instruments include an EC9810ozone analyzer, EC9830 CO analyzer, EC9841 NOx analyzerand EC9850 SO2 analyzer. The precision of these four ana-lyzers is 1.0 ppb, 0.1 ppm, 0.5 ppb and 0.5 ppb, respectively.At TJ and SDZ stations, gases were observed by a set ofcommercial instruments from Thermo Environmental Instru-ment, Inc., USA. The instruments include a TE49C O3 ana-lyzer, TE48C CO analyzer, TE 42CTL NOx analyzer and aTE43C SO2 analyzer. The precision of these four analyzersis 1.0 ppb, 0.1 ppm, 0.4 ppb and 1.0 ppb, respectively. All in-struments at each site are housed in an air-conditioned roomwith a relatively constant temperature. The TEOM instru-ment is operated with a hydrophobic filter material to reducethe humidity of the incoming sampled air. The sample streamis preheated to 50◦C before entering the mass transducer, andhence semi-volatiles such as ammonium nitrate and water arenot measured. The filter loading percentage and flow rates ofTEOM are checked once a week, and the filter is replacedwhen the filter loading percentage is greater than 30 %. Theaveraging time was set to 5 min, and subsequently processedto hourly means in this study. The uncertainty in hourly mea-surement was ± 1.50 µg m−3. For gas measurement instru-ments, daily zero/span checks are automatically done usinga dynamic gas calibrator (TE 146C) in combination with azero air supply (TE111) and a set of standard reference gasmixtures (Chemical Metrology & Analytical Science Divi-sion, National Institute of Metrology, Beijing, China). Multi-point calibrations are made every 3–6 months. For ozone, thestandards are traceable to the Standard Reference Photome-ter (SRP) maintained by the WMO World Calibration Centre
in Switzerland (EMPA). The national standard gases of SO2,NO, and CO are compared against NIST (National Instituteof Standards and Technology)-traceable standards from ScottSpecialty Gases, USA. After the correction of data on the ba-sis of multipoint calibration, hourly average data are calcu-lated and are used for further analysis in this study.
2.1.3 Optical observations
At the regional background station SDZ, the aerosol scat-tering coefficient (σsp) was measured by an integratingnephelometer (Model M9003, EcoTech, Australia). The BCaerosol concentration was measured with an aethalome-ter (Model AE31, Magee Scientific, USA). The AE31Aethalometer measured the optical attenuation of light fromLED lamps with seven different wavelengths (370, 470, 520,590, 660, 880, and 950 nm) transmitted through the aerosolsdeposited continuously on a quartz fiber filter. The attenua-tion of light is converted to the BC mass concentration usingwavelength dependent calibration factors as recommendedby the manufacturer. The light absorption coefficient (σap)
was indirectly calculated with the BC concentration by themethod introduced below. The detailed working principleand maintenance of the instruments has been discussed pre-viously (Zhao et al., 2011b; Yan et al., 2009). An aerosollidar (ALS300, EZ manufactured by Leosphere) was em-ployed in this field campaign at SDZ. The lidar system isbased on 355 nm Nd:YAG pulsed laser operating at 16 mJwith 20 Hz repetition rate. The backscattered light is col-lected by an optical system and its intensity is measured bya photo-detector. The amount of the collected optical radia-tion is converted into an electronics signal and stored onto acomputer. The lidar continuously operated with 30 min inter-vals and 15 m height resolution. The maximum range is about20 km. The backscatter and extinction coefficient profiles areretrieved using the well known Klett–Fernald–Sasano eval-uation approach with an assumption of so-called lidar ratio(Klett, 1981, 1985; Fernald, 1984). The aerosol optical depthintegrated over the maximum of the available lidar range.
2.2 Chemical analysis
Each polypropylene and blank filter was cut into fragmentsand digested with 16 ml concentrated HNO3 and 4 ml con-centrated HClO4 in a conical flask, and then heated untilthere was∼ 3 ml residual left. After cooling, the solutionwas filtered, and then diluted to 15 ml with ultrapure water.A total of 19 elements (Al, As, Ba, Ca, Cd, Co, Cr, Cu, Fe,K, Mg, Mn, Ni, P, Pb, Sr, Ti, V and Zn) were analyzed by in-ductively coupled plasma spectroscopy and atomic emissionspectroscopy (ICP-AES)( (Model: ULTIMA, JOBIN-YVONCompany, France).
One fourth of each quartz fiber filter was put into aglass tube and 10 ml of deionized water was added. After a15 min ultrasonic bath at room temperature, the solution was
www.atmos-chem-phys.net/13/5685/2013/ Atmos. Chem. Phys., 13, 5685–5696, 2013

5688 X. J. Zhao et al.: Analysis of a winter regional haze event
1
2
3
4
5
6
7
8
(a) (b)
9
Fig.2. Surface weather patterns at 08:00 a.m. on (a) 18 January 2010 and (b) 19 10
January 2010. 11
12
13
14
15
16
17
18
19
20
21
22
23
24
25
26
27
28
29
Fig. 2.Surface weather patterns at 08:00 (LT) on(a) 18 January 2010 and(b) 19 January 2010.
drawn into a 5 ml syringe, filtered by a syringe filter, and in-jected into a polymeric vial with filter cap. The polymericvials were put into a Dionex AS-DV Autosampler and an-alyzed by an ion chromatography (ICS-1000, DIONEX) forwater-soluble ions (Na+, NH+
4 , K+, Mg2+, Ca2+, Cl−, NO−
3 ,and SO2−
4 ).A 0.5 cm2 punch from each quartz-fiber filter was ana-
lyzed by a thermal optical carbon analyzer (DRI-2001A) foreight carbon fractions, following the IMPROVEA protocol(Chow et al., 1993, 2001, 2007).
2.3 Methods for aerosol absorption coefficient (σap)
calculation
The aerosol light absorption coefficient (σap) can be directlycalculated from the attenuation measured by the Aethalome-ter or indirectly calculated based on the BC concentrationsrecorded by the instrument. The detailed calculation methodhas been described in Yan et al. (2008). In this work, the indi-rect method was employed to calculate theσap based on thefollowing equation:
σap = α × [BC] (1)
where,α is the conversion factor or the BC absorption ef-ficiency, and is adopted as 8.28 mg m−2 in this work to ob-tain theσap at 532 nm with BC concentration at 880 nm. Thisvalue had been used as the conversion factor in previous workat the SDZ station by Yan et al. (2009), which was obtainedbased on the result of the inter-comparison experiment con-ducted in southern China. Yan et al. (2009) had comparedthis value with those reported in previous studies. They foundthat it was within their variance ofα for different regions andvery close to the value of 8.0 mg m−2 obtained in the Beijingurban area (Bergin et al., 2001). This value ofα is higherthan the best estimate given by Bond and Bergstrom (2001)but still well within their variance ofα for varying sourceregions.
2.4 The meteorological data
The meteorological data, mainly the visibility over China,was obtained from the China Meteorological Administra-tion (CMA). The hourly meteorological data, wind direction,wind speed, relative humidity (RH), temperature and pres-sure were measured with an automatic weather station in-stalled at the SDZ meteorological station. Wind parametersare observed at 10 m height, while temperature, pressure andmoisture information are collected at 1.5 m height. Visibil-ity was monitored with a forward scattering measuring visi-bility meter (Model FD 12, Vaisala Corporation, Finland) atSDZ. In the Beijing urban area, the wind profile with timeresolution of 5 min was observed with a boundary layer windprofile lidar located at the Haidian meteorology station, ap-proximately 4 km to the north of BJ site. The profile’s rangeis 3500 m with 50 m vertical resolution. The radiosonde dataof Beijing meteorological station (54511) was used to ana-lyze the vertical structure of temperature in this work.
3 Results and discussion
3.1 Meteorological condition and pollutantconcentrations
In winter, the NCP region is often dominated by cold high-pressure system with low surface wind speeds, sometimesalso accompanied by surface temperature inversion. Thoseconditions are favorable for the formation of haze or fog, andusually lead to high levels of pollutants concentration due toweak mixing and dispersion (Xu et al., 2011).
A surface weak high-pressure system persisted from 16to 18 January 2010 in Beijing and the surrounding area andwas replaced by a low-pressure system until 20 January. Thisweather condition was unfavorable for the dispersion of pol-lutants and resulted in the occurrence of a haze episode from16 to 19 January. The weather system was finally terminated
Atmos. Chem. Phys., 13, 5685–5696, 2013 www.atmos-chem-phys.net/13/5685/2013/

X. J. Zhao et al.: Analysis of a winter regional haze event 5689
1
2
3
4
5
6
7
8
9
10
11
12
14 15 16 17 18 19 20 21 22 23
980
985
990
995
1000
1005
1010
Pressure Visibility
Pre
ssure(
hP
a)
0
10
20
30
40
50
60
Vis
ibili
ty(
km)
14 15 16 17 18 19 20 21 22 230
2
4
6
8
10
12
C
O(p
pm
)
TJ BJ SDZ
(a)
(b)
(c)
(d)
(e)
(f)
14 15 16 17 18 19 20 21 22 230
90
180
270
360
WD WS
WD
(degre
e)
0
2
4
6
8
WS(
m s
-1)
14 15 16 17 18 19 20 21 22 230
100
200
300
400
500
PM
2.5(μ
g m
-3)
TJ BJ SDZ
14 15 16 17 18 19 20 21 22 230
25
50
75
100
NO
2(p
pb)
TJ BJ SDZ
14 15 16 17 18 19 20 21 22 23-20
-15
-10
-5
0
5
10
Temp RH
Te
mp
(oC
)
20
40
60
80
100
RH
(%)
13
Fig.3. Time series variations of meteorological parameters at SDZ and pollutants at TJ, 14
BJ and SDZ from 14 to 23 January 2010. (a) wind direction and wind speed (m s−1
), 15
(b) temperature (°C) and relative humidity (%), (c) atmospheric pressure (hPa) and 16
visibility (km), (d) PM2.5 concentration (μg m-3
), (e)NO2 (ppb), (f) CO(ppb) 17
18
19
20
21
Fig. 3. Time series variations of meteorological parameters at SDZ and pollutants at TJ, BJ and SDZ from 14 to 23 January 2010.(a) winddirection and wind speed (m s−1), (b) temperature (°C) and relative humidity (%),(c) atmospheric pressure (hPa) and visibility (km),(d)PM2.5 concentration (µg m−3), (e)NO2 (ppb),(f) CO(ppb).
by the Mongolia anticyclone with strong northerly wind on20 January (Fig. 2). Under this synoptic condition, winds atthe surface were very weak with the wind speed lower than3.0 m s−1 at SDZ and even lower in the Beijing urban areas(lower than 2.0 m s−1). Both the temperature and relative hu-midity (RH) showed evident diurnal variation. The tempera-ture increased continuously day by day, and the RH remainedhigh. The surface pressure persistently decreased during thisepisode (Fig. 3a–c). The weak winds and lower pressure wereunfavorable for the dispersion of pollutants, which caused theaccumulation of pollutants on a regional scale. As shown inFig. 3, the particulate and gaseous pollutants (Fig. 3d–f) in-creased continuously from 16 to 18 January at three sites,while they decreased at TJ and BJ, and increased obviouslyat SDZ on 19 January. The concentrations of PM2.5 and COat BJ and TJ were evidently higher than that at SDZ. Thehighest concentration of PM2.5 was 445.6 and 318.1 µg m−3
at TJ and BJ, respectively. The concentration of CO exceeded8.0 ppm at TJ and BJ. The NO2 increased simultaneously atthree sites and showed significant diurnal variation at SDZ.The average concentrations of PM2.5, NO2 and CO on hazedays (16–19 January) were 5∼ 8, 2∼ 6 and 3∼ 5 times ashigh as that in non-haze days (all other days in the periodfrom 14 through 23 January). The sharp increase of pollu-tants at SDZ on 19 January was mainly attributed to the re-gional transport, which will be discussed as a part of thisstudy in the following section.
3.2 Light extinction effect of aerosol in this episode
Visibility as a standard meteorological parameter is regu-larly measured at synoptic meteorological stations all overthe world. Since it is determined mostly by the light extinc-tion by aerosol particles, this parameter can be consideredas a good indicator of air pollution (Molnar et al., 2008).The standard visibility measurements are carried out underambient relative humidity (RH), and strongly depend on theavailable atmospheric water vapor due to the hygroscopicgrowth of the particles. Consequently, the extinction effectof a given, dry aerosol volume concentration should be sep-arated from that due to hygroscopic growth of the particlesvia adsorbed water vapor. The noon visibility data has beenwidely used to examine the spatiotemporal haze trends inthe United States (Husar and Wilson, 1993; Schichte et al.,2001). Zhao et al. (2011c) pointed out that it was better toquantify haze days with the meteorological observation dataat 14:00 (LT; visibility and RH) after comparison two meth-ods of distinguishing haze days with daily mean and 14:00(LT) meteorological data in the BTH area. Therefore, the vis-ibility observed at 14:00 (LT) was employed in this study toreflect the aerosol extinction effect on a regional scale. Thevisibility data was obtained from the China MeteorologicalAdministration (CMA). As shown in Fig. 4, the area withvisibility lower than 10 km mostly appeared in the south ofChina on 16 January, and then gradually expanded northwardand covered most regions of eastern China including Beijing
www.atmos-chem-phys.net/13/5685/2013/ Atmos. Chem. Phys., 13, 5685–5696, 2013

5690 X. J. Zhao et al.: Analysis of a winter regional haze event
(a) (b) (c)
(d) (e)
January 16 January 17 January 18
January 19 January 20
(a) (b) (c)
(d) (e)
January 16 January 17 January 18
January 19 January 20
1
Fig.4. Regional distribution of visibility (km) at 14:00 (local time) during January 2
16-20. 3
4
5
6
7
8
9
10
11
12
13
14
15
16
17
18
19
20
21
22
23
24
25
26
Fig. 4.Regional distribution of visibility (km) at 14:00 (LT) during 16–20 January.
1
14 15 16 17 18 19 20 21 22 23
0
300
600
900
1200
1500
σsp
σap
AOD
σsp(M
m-1)
0
30
60
90
120
150
σa
p(M
m-1)
-0.5
0.0
0.5
1.0
1.5
2.0
2.5
AO
D
2
3
Fig. 5. Time series of aerosol scattering (σsp), absorption coefficient (σap) and 4
aerosol optical depth (AOD) at (SDZ) from 14 to 23 January 2010. 5
6
7
8
9
10
11
12
13
14
15
16
17
18
19
Fig. 5.Time series of aerosol scattering (σsp), absorption coefficient(σap) and aerosol optical depth (AOD) at SDZ from 14 to 23 January2010.
and Tianjin on 19 January, finally shifting to the south on20 January driven by the strong northerly winds. Correspond-ing to the visibility variation, the weather phenomenon ob-served in the low visibility area was mainly haze at 14:00(LT) from 16 to 18 January, mist was observed and began toincrease on 19 January. The haze phenomenon recorded indaytime suggested that the aerosol loading was high enoughin this episode to extinct the light and then cause low visibil-ity. These hygroscopic aerosol particles accompanied withincreased RH ultimately resulted in the lower visibility, es-pecially during the nighttime.
The extinction by aerosol included scattering and absorp-tion. The observedσsp and calculatedσap at SDZ are pre-sented in Fig. 5. The AOD retrieved with the lidar obser-vation is presented as well, which can provide columnaraerosol properties. Similar to the PM2.5 concentration, the
σsp and σap gradually increased from 16 January to mid-day on 18 January, and showed significant diurnal varia-tion with high values around evening and low values aroundnoon. The AOD began to increase on 16 January and grad-ually increased in the following two days. There was no ob-vious diurnal variation observed in AOD. All the three pa-rameters increased significantly in the afternoon of 18 Jan-uary and reached their maxima on 19 January with valuesof 1430.1 km−1, 219.4 km−1 and 2.1 forσsp, σap and AOD,respectively. In this period, the lidar captured several highvalues of AOD (above 1.5) in the end of the haze episode,though the values of AOD were mostly missed on 19 Jan-uary due to the presence of cumulus clouds at the top ofthe PBL. The annual average AOD at 550 nm of Beijing was0.8 derived from the MODIS (Moderate Resolution ImagingSpectroradiometer) dataset (Xu et al., 2011). The enhancedAOD indicated that the aerosol loading in the vertical direc-tion was also increased significantly on 19 January. On hazedays (16–19 January), the average values ofσsp andσap were577.3 and 55.6 Mm−1, and were 8.1 and 5.2 times as high asthat in non-haze days, respectively. Compared with the sea-sonal averages ofσsp in winter, 176 km−1observed at SDZin 2008, theσsp averagely increased 2.3 times on haze days(Zhao et al., 2011b). However, the meanσsp andσap werelower than that observed at Wuqing (a site located betweenBJ and TJ) with values of 742 and 112 Mm−1 during thepollution episode in spring and 874 and 85 Mm−1 in sum-mer, respectively (Ma et al., 2011). The daily averageσsp andσap was 1116.7 and 89.4 Mm−1 on 19 January, which caused
Atmos. Chem. Phys., 13, 5685–5696, 2013 www.atmos-chem-phys.net/13/5685/2013/

X. J. Zhao et al.: Analysis of a winter regional haze event 5691
14 15 16 17 18 19 20 21 22 23
Ammonium
Sulfate
Nitrate
POM
EC
Dust
0
50
100
150
200
250
300
350
400
450 PM2.5
PM
2.5,
Specie
s(μ
g/m
3)
14 15 16 17 18 19 20 21 22 23
Ammonium
Sulfate
Nitrate
POM
EC
Dust
0
50
100
150
200
250
300 PM2.5
PM
2.5,
Specie
s(μ
g/m
3)
14 15 16 17 18 19 20 21 22 23
Ammonium
Sulfate
Nitrate
POM
EC
Dust
0
50
100
150
200
250
300
350
400
450 PM2.5
PM
2.5,
Specie
s(μ
g/m
3)
(a) (b)
(c) (d)
14 15 16 17 18 19 20 21 22 23
Ammonium
Sulfate
Nitrate
POM
EC
Dust
0
40
80
120
160
200 PM2.5
PM
2.5,
Specie
s(μ
g/m
3)
14 15 16 17 18 19 20 21 22 23
Ammonium
Sulfate
Nitrate
POM
EC
Dust
0
50
100
150
200
250
300
350
400
450 PM2.5
PM
2.5,
Specie
s(μ
g/m
3)
14 15 16 17 18 19 20 21 22 23
Ammonium
Sulfate
Nitrate
POM
EC
Dust
0
50
100
150
200
250
300 PM2.5
PM
2.5,
Specie
s(μ
g/m
3)
14 15 16 17 18 19 20 21 22 23
Ammonium
Sulfate
Nitrate
POM
EC
Dust
0
50
100
150
200
250
300
350
400
450 PM2.5
PM
2.5,
Specie
s(μ
g/m
3)
(a) (b)
(c) (d)
14 15 16 17 18 19 20 21 22 23
Ammonium
Sulfate
Nitrate
POM
EC
Dust
0
40
80
120
160
200 PM2.5
PM
2.5,
Specie
s(μ
g/m
3)
1
Fig.6. Variation of concentrations of PM2.5 and chemical species at (a) TJ, (b)BJ, (c) 2
SDZ and (d) CD. 3
4
5
6
7
8
9
10
11
12
13
14
15
Fig. 6.Variation of concentrations of PM2.5 and chemical species at(a) TJ, (b) BJ, (c) SDZ and(d) CD from 14 to 23 January 2010.
further reduction of visibility. The visibility on this day wasmostly lower than 2 km. The rapid increase of aerosol load-ing at the surface and in the vertical distribution was mostlyattributed to the regional transport, which is demonstrated indetail later in this paper.
3.3 Chemical characteristics and secondary formationof this episode
The results of chemical analysis of PM2.5 at four sites inBeijing, Tianjin and the Hebei province are presented inthis section to identify the chemical characteristics of theaerosol during this haze episode (16–19 January) and discusssecondary formation. The sampling of PM2.5 was missed atSJZ during this episode and not analyzed in this paper. Thedust matter in PM2.5 was calculated as the sum of oxides ofaluminum, calcium, iron, titanium, magnesium and silicon(i.e., mineral dust = 1.89 Al + 2.14 Si + 1.4 Ca + 1.43 Fe +1.66 Mg + 1.67 Ti) based on our measurement of the con-centration of these elementals (Taylor and Mclennan, 1985;Hueglin et al., 2005). The concentration of Si was estimatedaccording to the average ratio of Si / Al (3.9) obtained fromZhang et al. (2003). Organic material (OM) was obtained bymultiplying OC concentrations by a factor of 1.2, account-ing for hydrogen and oxygen in the organic compounds. Thisconversion factor had been used in previous work in Bei-jing (Sun et al., 2004). The PM2.5 concentrations were ob-tained from a gravimetric analysis with quartz fiber filters,due to their better collection efficiency (Zhao et al., 2013).The results showed that the PM2.5 concentration increasedsharply during the haze episode. The SO2−
4 , NO−
3 , NH+
4 ,
OM, dust matter, and element carbon were the six dominantspecies in PM2.5 at fours sites in both haze and non-haze days(Fig. 6). However, the secondary inorganic pollutants (SO2−
4 ,NO−
3 and NH+
4 ) and OM increased evidently during the hazeepisode and became the dominant components of PM2.5. Thetotal concentrations of SO2−
4 , NO−
3 and NH+
4 exhibited thehighest levels during this episode with the average value of127.0, 113.5, 56.9 and 46.2 µg m−3 at TJ, BJ, SDZ and CD,respectively. The three components together accounted for44.8, 37.7, 41.9 and 20.1 % of PM2.5 mass concentration atTJ, BJ, SDZ and CD, respectively. The concentration of thosecomponents on haze days was about 4.3∼ 9.1 times higherthan that on non-haze days at these four sites, and was signif-icantly higher in large cities, Beijing and Tianjin, than in theregional background area (SDZ) and in the city to the northof Hebei province (CD) on haze days. However, the percent-ages were comparable at three sites in the North China Plain,and considerably higher than that at the CD site. The increaseof secondary inorganic pollutants had been observed in thepollution haze in several cities in eastern China (Sun et al.,2006; Wang et al., 2006; Tan et al., 2009; Li et al., 2011;Huang et al., 2012 ). This phenomenon was observed simul-taneously at four sites on a regional scale in this study, whichcould be identified as a common characteristic of pollutionhaze in eastern China.
The higher contribution of sulfate and nitrate in a hazeepisode could be related to high oxidation rates of SO2 andNO2. Previous studies have indicated that the sulfur oxi-dation ratio SOR = nSO2−
4 / (nSO2−
4 + nSO2) (n refers tomolar concentration) and nitrogen oxidation ratio NOR =nNO−
3 / (nNO−
3 + nNO2) can be used to estimate the degree
www.atmos-chem-phys.net/13/5685/2013/ Atmos. Chem. Phys., 13, 5685–5696, 2013

5692 X. J. Zhao et al.: Analysis of a winter regional haze event
Table 1.SOR, NOR and OC / EC during haze days and non-haze days at four sites.
TJ BJ SDZ CD
SOR NOR OC/EC SOR NOR OC/EC SOR NOR OC/EC SOR NOR OC/ECHD 0.16 0.40 4.40 0.29 0.51 4.53 0.16 0.33 4.09 N N 4.34NHD 0.06 0.19 3.00 0.16 0.28 3.27 0.23 0.20 4.47 N N 1.72Ratio 2.50 2.14 1.47 1.81 1.78 1.39 0.69 1.67 0.91 N N 2.52
HD: haze days; ND: normal days; ratio: the ratio of values in HD to that in ND; N: no data.
14 15 16 17 18 19 20 21 22 230
25
50
75
100
Concentr
ation(p
pb)
O3 NO
2
14 15 16 17 18 19 20 21 22 230
25
50
75
100
Concentr
ation(p
pb)
O3 NO
2
(a)
(b)
14 15 16 17 18 19 20 21 22 230
25
50
75
100
Concentr
ation(p
pb)
O3 NO
2
14 15 16 17 18 19 20 21 22 230
25
50
75
100
Concentr
ation(p
pb)
O3 NO
2
(a)
(b)
1
Fig.7. Time series variations of O3 and NO2 at (a) BJ and (b) SDZ from 14 to 23 2
January 2010. 3
4
5
6
7
8
9
10
11
12
13
14
15
16
17
18
19
20
21
22
23
24
25
26
27
Fig. 7.Time series variations of O3 and NO2 at (a) BJ and(b) SDZfrom 14 to 23 January 2010.
Fig. 8. Variation of temperature in vertical direction from 16 to20 January.
of secondary formation of nitrogen and sulfur (Sun et al.,2006; Wang et al., 2006). As shown in Table 1, the averagevalues of SOR and NOR were 0.16 and 0.40 on haze daysat TJ and about 1.50 and 1.14 times higher than that on non-haze days, respectively. At BJ, both SOR and NOR on hazedays with values of 0.29 and 0.51 were about 1.8 times as
much as that in the non-haze days. The increased SOR andNOR on haze days indicated the effect of secondary forma-tion. The conversion of SO2 to sulfate was mainly attributedto the gas-phase oxidation by OH and H2O2 radical or het-erogeneous oxidation (Seinfeld et al., 1986; Calvert et al.,1985). Many studies suggested that the conversion of SO2 tosulfate in winter haze was more significant through the aque-ous phase oxidation of SO2 by the catalysis of the transitionmetals instead of the gas-phase oxidation (Sun et al., 2006;Tan et al., 2009; Li et al., 2011; Sun et al., 2013). Our mea-surements confirmed this view in our study area. As shownin Fig. 7a, the concentration of NO2 was very high but theO3 concentration was less than 5ppb during the haze episode(16 to 19 January) at BJ (TJ was similar to BJ and not shownhere); both of them had no evident diurnal variation. Theseresults suggested that the photochemical activity was veryweak during the haze period. The high levels of NO2 andthe weak photochemical activity could not produce sufficientconversion oxidants (OH and H2O2 radicals) for gas-phaseoxidation of SO2 (Poppe et al., 1993; Hua et al., 2008). Theincreased relative humidity on haze days (Fig. 3) was a favor-able factor for the aqueous phase oxidation of SO2. The for-mation of nitrate in the urban area was probably through theheterogeneous hydrolysis process. By analysis of sulfate, ni-trate, and ammonium in PM2.5 in four cities in China, Pathaket al. (2009) pointed out that the nitrate was most probablyformed via the heterogeneous hydrolysis of N2O5 on the sur-face of the moist and acidic aerosols in Beijing and Shanghai,especially during humid and hazy weather. The formation ofnitrate in PM2.5 is still less well understood and needs furtherstudy in the future. However, the observed results were dif-ferent at SDZ than from those at two urban sites. The NORwas higher on haze days with a value of 0.33, while the SORon haze days at 0.16 was lower than 0.23 on non-haze days.In Fig. 7b, it could be found that the NO2 and O3 showed ob-vious diurnal variations with a reserved trend from 16 to 18January. The concentration of O3 was highest around noonand lowest in the night, which was the typical characteris-tic of photochemical process. On the last day of the haze,namely 19 January, the variations of NO2 and O3 were sim-ilar to that at BJ, and the SOR and NOR arrived at theirmaxima, which probably suggested the role of a heteroge-neous reaction process. At the same time, the concentrationsof SO2−
4 and NO−
3 increased to their highest levels of this
Atmos. Chem. Phys., 13, 5685–5696, 2013 www.atmos-chem-phys.net/13/5685/2013/
X. J. Zhao et al.: Analysis of a winter regional haze event 5693
Hei
gh
t(m
)
(a)
(b)
Hei
gh
t(m
)
(a)
(b)
1
Fig.9. The lidar measurement of wind profile in Beijing region from January 16 to 21. 2
(a) horizontal wind vectors and wind direction (shaded); (b) vertical winds (m s-1
). 3
4
5
6
7
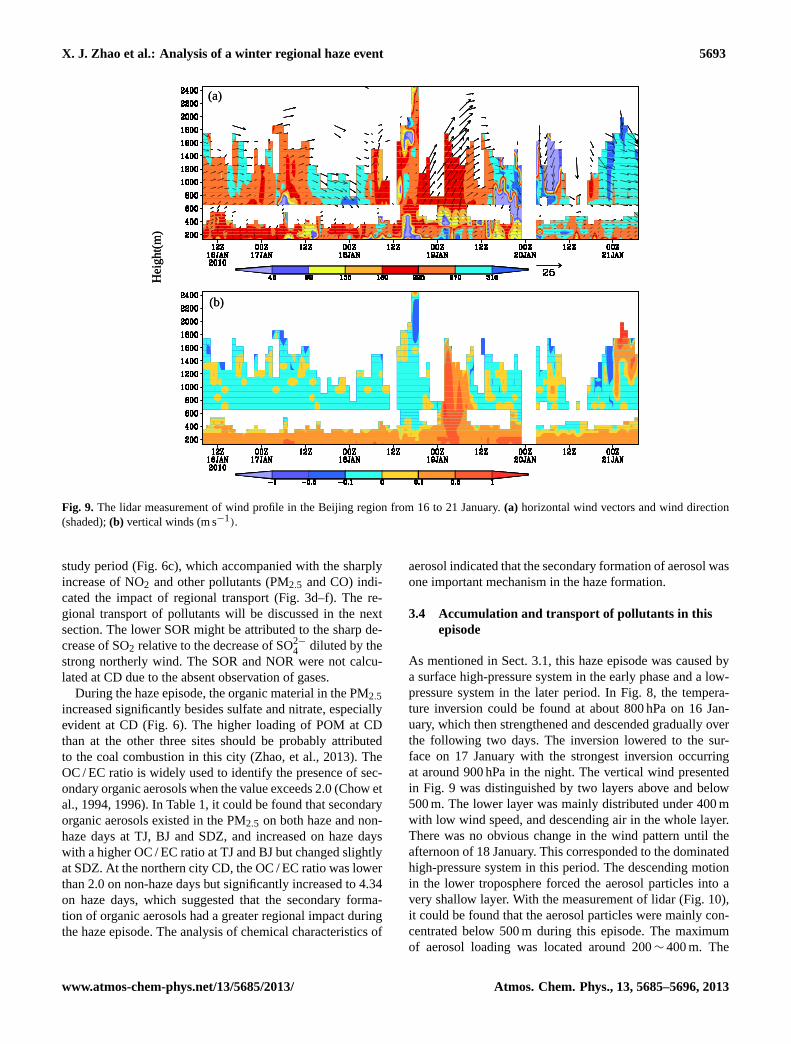
Fig. 9. The lidar measurement of wind profile in the Beijing region from 16 to 21 January.(a) horizontal wind vectors and wind direction(shaded);(b) vertical winds (m s−1).
study period (Fig. 6c), which accompanied with the sharplyincrease of NO2 and other pollutants (PM2.5 and CO) indi-cated the impact of regional transport (Fig. 3d–f). The re-gional transport of pollutants will be discussed in the nextsection. The lower SOR might be attributed to the sharp de-crease of SO2 relative to the decrease of SO2−
4 diluted by thestrong northerly wind. The SOR and NOR were not calcu-lated at CD due to the absent observation of gases.
During the haze episode, the organic material in the PM2.5increased significantly besides sulfate and nitrate, especiallyevident at CD (Fig. 6). The higher loading of POM at CDthan at the other three sites should be probably attributedto the coal combustion in this city (Zhao, et al., 2013). TheOC / EC ratio is widely used to identify the presence of sec-ondary organic aerosols when the value exceeds 2.0 (Chow etal., 1994, 1996). In Table 1, it could be found that secondaryorganic aerosols existed in the PM2.5 on both haze and non-haze days at TJ, BJ and SDZ, and increased on haze dayswith a higher OC / EC ratio at TJ and BJ but changed slightlyat SDZ. At the northern city CD, the OC / EC ratio was lowerthan 2.0 on non-haze days but significantly increased to 4.34on haze days, which suggested that the secondary forma-tion of organic aerosols had a greater regional impact duringthe haze episode. The analysis of chemical characteristics of
aerosol indicated that the secondary formation of aerosol wasone important mechanism in the haze formation.
3.4 Accumulation and transport of pollutants in thisepisode
As mentioned in Sect. 3.1, this haze episode was caused bya surface high-pressure system in the early phase and a low-pressure system in the later period. In Fig. 8, the tempera-ture inversion could be found at about 800 hPa on 16 Jan-uary, which then strengthened and descended gradually overthe following two days. The inversion lowered to the sur-face on 17 January with the strongest inversion occurringat around 900 hPa in the night. The vertical wind presentedin Fig. 9 was distinguished by two layers above and below500 m. The lower layer was mainly distributed under 400 mwith low wind speed, and descending air in the whole layer.There was no obvious change in the wind pattern until theafternoon of 18 January. This corresponded to the dominatedhigh-pressure system in this period. The descending motionin the lower troposphere forced the aerosol particles into avery shallow layer. With the measurement of lidar (Fig. 10),it could be found that the aerosol particles were mainly con-centrated below 500 m during this episode. The maximumof aerosol loading was located around 200∼ 400 m. The
www.atmos-chem-phys.net/13/5685/2013/ Atmos. Chem. Phys., 13, 5685–5696, 2013

5694 X. J. Zhao et al.: Analysis of a winter regional haze event
0
500
1000
1500
2000
2500
0.0 0.5 1.0 1.5 2.0 2.5 3.0 3.5
Particle Extinction (km-1
sr-1
)
Heig
ht(
m)
02:00
08:00
14:00
20:00
Jan 16
0
500
1000
1500
2000
2500
0.0 0.5 1.0 1.5 2.0 2.5 3.0 3.5
Jan 17 02:00
08:00
14:00
20:00
Particle Extinction (km-1
sr-1
)
Heig
ht(
m)
0
500
1000
1500
2000
2500
0 1 2 3 4 5
Particle Extinction (km-1
sr-1
)
Heig
ht(
m)
02:00 Jan 18
07:00 Jan 18
13:00 Jan 18
19:00 Jan 18
20:00 Jan 19
0
500
1000
1500
2000
2500
0.0 0.5 1.0 1.5 2.0 2.5 3.0 3.5
Jan 20 02:00
08:00
14:00
20:00
Particle Extinction (km-1
sr-1
)
Heig
ht(
m)
1
Fig. 10. Vertical profile of particle extinction at SDZ from January 16 to 20. 2
3
4
Fig. 10.Vertical profile of particle extinction at SDZ from 16 to 20 January.
similar vertical distribution of wind and aerosol indicatedthat the height of the PBL was about 400 m. The shallow PBLseverely limited pollutant diffusion in the vertical. The weakhorizontal wind limited the horizontal dispersion of pollu-tants that produced very high concentrations in the urban area(such as BJ and TJ) and relatively lower concentrations inthe more suburban area (SDZ). However, the pollutant con-centrations were still elevated above non-episode levels inthe suburban area under the large-scale stagnation weathercondition (Fig. 3d–f). The accumulation of pollution was themain factor in the haze formation on these three days. Inthe afternoon of 18 January, the controlling synoptic weatherover Beijing and the surrounding area changed to a low-pressure system. The southwest wind appeared from the sur-face to 800 m and even stronger in the layer of 800∼ 2000 m,which transported the pollutants from the more southern re-gions toward the north. Correspondingly, a layer with highaerosol loading located about at 800 to 1000 m was ob-served at 19:00 (LT) on 18 January above the downwind area(Fig. 10). Accompanying the strong southwest wind, the en-
hanced descent of air occurred in the whole vertical direc-tion on 19 January, which carried part of pollutants to theground. At the same time, the surface wind at SDZ turnedfrom east-northeast to southwest in the afternoon of 18 Jan-uary (Fig. 3a), and carried pollutants to this area that resultedin the highest aerosol loading in the lower aerosol layer on19 January. The ground and high layer transport of pollu-tants resulted in the rapid increase of pollutants in the down-wind area, but caused decrease of pollutants in urban area on19 January (Fig. 3d–f). The regional transport of pollutantsexpanded the geographical extent of the haze. With the ar-rival of the Mongolian anticyclone, the northerly wind firstappeared aloft and diluted pollutants in that layer of the at-mosphere. The higher aerosol layer had disappeared at 20:00(LT) on 19 January, while the surface layer still remainedwith high aerosol loading. On 20 January, the aerosol loadingnear the surface decreased significantly and finally the entirepolluted volume was diluted and transported by the strongnortherly wind that terminated this haze episode.
Atmos. Chem. Phys., 13, 5685–5696, 2013 www.atmos-chem-phys.net/13/5685/2013/
X. J. Zhao et al.: Analysis of a winter regional haze event 5695
4 Summary and conclusion
An intensive aerosol and trace gases campaign was carriedout over the BTH region in the North China Plain from 14to 23 January 2010. A regional haze episode, from 16 to 19January, occurred during this period. With the analysis of thechemical and optical properties of aerosols and the meteoro-logical conditions, the formation of this episode was investi-gated in this study.
The haze episode was caused by a surface high-pressuresystem during most of the time and by a low-pressure sys-tem in the later period. During this episode, the concen-trations of PM2.5 and main trace gases increased signifi-cantly on a regional scale. The area with visibility lower than10 km covered most regions of eastern China. The haze phe-nomenon recorded in daytime corresponding to the low vis-ibility suggested that the aerosol loading was high enoughin this episode to extinct the light. The increasedσsp, σapand AOD further supported the important extinction effect ofaerosol in the formation of this haze episode.
The secondary inorganic pollutants (SO2−
4 , NO−
3 andNH+
4 ) and OM increased evidently during haze days andbecame dominant components of PM2.5. The concentrationlevel of secondary pollutants was significantly higher in largecities than in the regional background area and city in thenorth area of the Hebei province, while the percentage wascomparable at three sites in the North China Plain, and ev-idently higher than that at the CD site. The increase of sec-ondary inorganic pollutants was observed simultaneously atfour sites, especially in the plain area of BTH, which couldbe identified as a common characteristic of pollution haze ineast China.
The sulfate and nitrate in PM2.5 was mainly formedthrough the heterogeneous reaction process at BJ and TJ. AtSDZ, the photochemical reaction, regional transport and het-erogeneous reaction process probably together caused the in-crease of sulfate and nitrate. The secondary organic aerosolsexisted in the PM2.5 on both haze and non-haze days at TJ,BJ and SDZ, while they only existed on haze days at CD.The increase of secondary organic aerosols at the four sitessuggested the greater regional impact of secondary formationprocess during the haze episode. The chemical characteristicsof aerosols in PM2.5 indicated that the secondary formationof aerosol was one important mechanism in the formation ofthe haze episode.
The strong temperature inversion, weak surface windspeed and descending air motions in PBL caused pollutantsto accumulate in a shallow layer and produced high pollutantconcentrations within the source region. The accumulation ofpollutants was one of the main factors in the haze formation.The enhanced southwest wind in the entire layer transportedpollutants from the southern urban area to the downwind areain the later period, which expanded the geographical scope ofthe haze.
The unfavorable meteorological condition was the exter-nal cause of this regional haze. The secondary formation pro-cesses produced a large amount of aerosols that extinct lightand resulted in the low visibility during this haze. However,the significant increase of pollutants at four sites especiallyin urban areas indicated that the anthropogenic emission on aregional scale was the basic reason of the regional haze. Thecontrol measures for ensuring air quality in megacity clustersshould be taken on a regional scale.
Acknowledgements.This work was supported by the NationalNatural Science Foundation of China (41205121, 41105092),the Beijing Natural Science Foundation (8131003, 8132025,8121002), the Research Funding of Institute of Urban Meteorology(IUMKY201209), and Special Grant in Atmospheric SciencesField supported by CMA (GYHY200806027). The authors wouldlike to thank the staff of the Shangdianzi and Chengde station forassisting the measurements. We also thank the editor for his helpfulcomments and suggestions on the manuscript and for polishing theEnglish writing.
Edited by: D. Covert
References
Bergin, M., Cass, G. R., Xu, J., Fang, F., Zeng, L. M., Yu T., Salmon,L. G., Kiang, C. S., Tang, X. Y., Zhang, Y. H., and Chameides,W. L.: Aerosol radiative, physical, and chemical properties inBeijing during June 1999, J. Geophys. Res., 106, 17969–17980,2001.
Bond, T. C. and Bergstrom R. W.: Light Absorption by Carbona-ceous Particles: An Investigative Review, Aerosol Sci. Technol.,40, 27–47, 2006.
Calvert, J., Lazrus, A., Kok, G., Heikes, B., Walega, J., Lind, J.,and Cantrell, C.: Chemical mechanisms of acid generation in thetroposphere, Nature 317, 27–35, doi:10.1038/317027a0, 1985.
Chow, J. C., Watson, J. G., Crow, D., Lowenthal, D. H., and Mer-rifield, T.: Comparison of IMPROVE and NIOSH carbon mea-surements, Aerosol Sci. Technol., 34, 23–34, 2001.
Chow, J. C., Watson, J. G., Pritchett, L. C., Pierson, W. R., Fra-zier, C. A., and Purcell, R. G.: The DRI thermal/optical re-flectance carbon analysis system: Description, evaluation and ap-plication in U.S. air quality studies, Atmos. Environ., 27A, 1185–1201,1993.
Chow, J., Waston, J., Chen, L., Chang, M., Robinson, N., Trim-ble, D., and Kohl, S.: The IMPROVEA temperature protocol forthermal/optical carbon analysis: maintaining consistency with along-term database, J. Air Waste Manage., 57, 1014–1023, 2007.
Chow, J. C., Watson, J. G., Fujita, E. M., Lu, Z., and Lawson, D.R.: Temporal and spatial variations of PM2.5 and PM10 aerosolin the southern California air quality study, Atmos. Environ., 28,3773–3785, 1994.
Chow, J. C., Watson, J. G., Lu, Z., Lowenthal, D. H., Frazier, C.A., Solomom, P. A., Thuiller, R. H., and Magliano, K.: Descrip-tive analysis of PM2.5 and PM10 at regionally representative lo-cations during SJVAQS/AUSPEX, Atmos. Environ., 30, 2079–2112, 1996.
www.atmos-chem-phys.net/13/5685/2013/ Atmos. Chem. Phys., 13, 5685–5696, 2013

5696 X. J. Zhao et al.: Analysis of a winter regional haze event
Fernald, F. G.: Analysis of Atmospheric Lidar Observations – SomeComments, Appl. Opt., 23, 652–653, 1984.
Hua, W., Chen, Z. M., Jie, C. Y., Kondo, Y., Hofzumahaus, A.,Takegawa, N., Chang, C. C., Lu, K. D., Miyazaki, Y., Kita, K.,Wang, H. L., Zhang, Y. H., and Hu, M.: Atmospheric hydrogenperoxide and organic hydroperoxides during PRIDE-PRD’06,China: their concentration, formation mechanism and contribu-tion to secondary aerosols, Atmos. Chem. Phys., 8, 6755–6773,doi:10.5194/acp-8-6755-2008, 2008.
Huang, K. Zhuang, G., Lin, Y., Fu, J. S., Wang, Q., Liu, T., Zhang,R., Jiang, Y., Deng, C., Fu, Q., Hsu, N. C., Cao , B: Typical typesand formation mechanisms of haze in an Eastern Asia megacity,Shanghai, Atmos. Chem. Phys., 12, 105–124, 2012,http://www.atmos-chem-phys.net/12/105/2012/.
Hueglin, C., Gehrig, R., Baltensperger, U., Gysel, M., Monnd, C.,and Vonmonta, H.: Chemical characteristics of PM2.5, PM10 andcoarse particles at urban, near-city and rural sites in Switzerland,Atmos. Environ., 39, 637–651, 2005.
Husar, R. B. and Wilson, W. E.: Haze and sulfur emission trendsin the eastern United States, Environ. Sci. Technol., 27, 12–16,1993.
Kang, H., Zhu, B., Su, J., Wang, H., Zhang, Q., and Wang, F.: Anal-ysis of a long-lasting haze episode in Nanjing, China, Atmos.Res., 120–121, 78–87, 2013.
Klett J. D.: Lidar inversions with variable backscatter/extinctionvalues, Appl. Opt., 24, 1638–1643, 1985.
Klett J. D.: Stable analytical inversion solution for processing Lidarreturns, Appl. Opt., 20, 211–220, 1981.
Li, W. J., Shao, L. Y., and Buseck, P. R.: Haze types in Beijingand the influence of agricultural biomass burning, Atmos. Chem.Phys., 10, 8119–8130, doi:10.5194/acp-10-8119-2010, 2010.
Li, W. J., Zhou, S., Wang, X., Xu, Z., Yuan, C., Yu, Y., Zhang,Q., and Wang, W.: Integrated evaluation of aerosols from re-gional brown hazes over northern China in winter: Concentra-tions, sources, transformation, and mixing states, J. Geophys.Res., 116, D09301, doi:10.1029/2010JD015099, 2011.
Lin, W., Xu, X., Zhang, X., and Tang, J.: Contributions of pol-lutants from North China Plain to surface ozone at the Shang-dianzi GAW Station, Atmos. Chem. Phys., 8, 5889–5898,doi:10.5194/acp-8-5889-2008, 2008.
Ma, N., Zhao, C. S., Nowak, A., Muller, T., Pfeifer, S., Cheng, Y.F., Deng, Z.Z., Liu, P. F., Xu, W. Y., Ran, L., Yan, P., Gobel, T.,Hallbauer, E., Mildenberger, K., Henning, S., Yu, J., Chen, L. L.,Zhou, X. J., Stratmann, F., and Wiedensohler, A.: Aerosol opti-cal properties in the North China Plain during HaChi campaign:an in-situ optical closure study, Atmos. Chem. Phys., 11, 5959–5973, doi:10.5194/acp-11-5959-2011, 2011.
Molnar, A. Meszaros, E., Imre, K., and Rull, A.: Trends in visibil-ity over Hungary between 1996 and 2002, Atmos. Environ., 42,2621–2629, 2008.
Parrish, D. D. and Zhu, T.: Clean Air for Megacities, Science, 326,674–675, 2009.
Poppe, D., Wallasch, M., and Zimmermann, J.: The dependence ofthe concentration of OH on its precursors under moderately pol-luted conditions: a model study, J. Atmos. Chem., 16, 61–78,1993.
Schichte, B. A., Husar, R. B., Falke, S. R., and Wilson, W. E.: Hazetrends over the United States, 1980–1995, Atmos. Environ., 35,5205–5210, 2001.
Seinfeld, J. H.: Atmospheric Chemistry and Physics of Air Pollu-tion; Wiley: New York, 1986.
Sun, Y. L., Zhuang, G. S., Wang, Y., Han, L. H., Guo, J. H., Dan, M.,Zhang, W. J., Wang, Z. F., and Hao, Z. P.: The air-borne particu-late pollution in Beijing-concentration, composition, distributionand sources, Atmos. Environ., 38, 5991–6004, 2004.
Sun, Y., Zhuang, G., Tang, A., Wang, Y., and An, Z.: Chemical char-acteristics of PM2.5 and PM10 in haze-fog episodes in Beijing,Environ. Sci. Technol. 40, 3148–3155, 2006.
Sun, Y. L., Wang, Z. F., Fu, P. Q., Yang, T., Jiang, Q., Dong, H. B.,Li, J., and Jia, J. J.: Aerosol composition, sources and processesduring wintertime in Beijing, China, Atmos. Chem. Phys., 13,4577–4592, doi:10.5194/acp-13-4577-2013, 2013.
Tan, J. H., Duan, J.C., Chen, D. H., Wang, X. H., Guo, S. J., Bi, X.H., Sheng, G. Y., He, K. B., and Fu, J. M.: Chemical character-istics of haze during summer and winter in Guangzhou, Atmos.Res., 94, 238–245, 2009.
Taylor, S. R. and Mclennan, S. M.: The Continental Crust: Its Com-position and Evolution. Blackwells, Oxford, England, 1985.
Wang, X., Wang, W., Yang, L., Gao, X., Nie, W., Yu, Y., Xu, P.,Zhou, Y., and Wang, Z.: The secondary formation of inorganicaerosols in the droplet mode through heterogeneous aqueous re-actions under haze conditions, Atmos. Environ., 63, 68–76, 2012.
Wang, Y., Zhuang, G. S., Sun, Y. L., and Zheng, A.: The variationof characteristics and formation mechanisms of aerosols in dust,haze, and clear days in Beijing, Atmos. Environ., 40, 6579–6591,2006..
Xu, W. Y., Zhao, C. S., Ran, L., Deng, Z. Z., Liu, P. F., Ma, N.,Lin, W. L., Xu, X. B., Yan, P., He, X., Yu, J., Liang, W. D., andChen, L. L.: Characteristics of pollutants and their correlation tometeorological conditions at a suburban site in the North ChinaPlain, Atmos. Chem. Phys., 11, 4353–4369, doi:10.5194/acp-11-4353-2011, 2011.
Zhang, X. Y., Gong, S. L., Shen, Z. X., Mei, F. M., Xi, X. X., Liu,L. C., Zhou, Z. J., Wang, D., Wang, Y. Q., and Cheng, Y.: Char-acterization of soil dust aerosol in China and its transport anddistribution during 2001 ACE-Asia:1. Network observations, J.Geophys. Res., 108, 4261, doi:10.1029/2002JD002632, 2003.
Zhao, P. S., Dong, F., He, D., Zhao, X. J., Zhang, X. L., Zhang,W. Z., Yao, Q., and Liu, H. Y.: Characteristics of concentrationsand chemical compositions for PM2.5 in the region of Beijing,Tianjin, and Hebei, China, Atmos. Chem. Phys., 13, 4631–4644,doi:10.5194/acp-13-4631-2013, 2013.
Zhao, P. S., Zhang, X. L., Xu, X. F., and Zhao, X. J.: Long-term vis-ibility trends and characteristics in the region of Beijing, Tianjin,and Hebei, China, Atmos. Res., 101, 711–718, 2011a.
Zhao, X. J., Zhang, X. L., Pu, W. W., Meng, W., Xu, X. F.: Scat-tering properties of the atmospheric aerosol in Beijing, China,Atmos. Res., 101, 799–808, 2011b.
Zhao, P. S., Zhang, X. L., and Xu, X. F.: Comparison between twomethods of distinguishing haze days with daily mean and 14o’clock meteorological data, Acta Scientiae Circumstantiae, 31,704–708, 2011c (in Chinese).
Zhao, X. J., Zhang, X. L., Xu, X., F. Xu, J., Meng, M., and Pu, W.W.: Seasonal and diurnal variations of ambient PM2.5 concentra-tion in urban and rural environments in Beijing, Atmos. Environ.,43, 2893–2900, 2009.
Atmos. Chem. Phys., 13, 5685–5696, 2013 www.atmos-chem-phys.net/13/5685/2013/