open access research flare frequency, healthcare...
TRANSCRIPT

Flare frequency, healthcare resourceutilisation and costs among patientswith gout in a managed care setting:a retrospective medical claims-basedanalysis
Robert Jackson,1 Aki Shiozawa,1 Erin K Buysman,2 Aylin Altan,2 Stephanie Korrer,2
Hyon Choi3
To cite: Jackson R,Shiozawa A, Buysman EK,et al. Flare frequency,healthcare resource utilisationand costs among patientswith gout in a managed caresetting: a retrospectivemedical claims-basedanalysis. BMJ Open 2015;5:e007214. doi:10.1136/bmjopen-2014-007214
▸ Prepublication history forthis paper is available online.To view these files pleasevisit the journal online(http://dx.doi.org/10.1136/bmjopen-2014-007214).
Received 14 November 2014Revised 18 March 2015Accepted 13 April 2015
1Takeda PharmaceuticalsInternational, Inc, Deerfield,Illinois, USA2Optum, Eden Prairie,Minnesota, USA3Massachusetts GeneralHospital/Harvard MedicalSchool, Boston,Massachusetts, USA
Correspondence toAki Shiozawa;[email protected]
ABSTRACTObjectives: For most gout patients, excruciatinglypainful gout attacks are the major clinical burden of thedisease. The goal of this study was to assess theassociation of frequent gout flares with healthcare burden,and to quantify how much lower gout-related costs andresource use are for those with infrequent flarescompared to frequent gout flares.Design: Retrospective cohort study.Setting: Administrative claims data from a large UShealth plan.Participants: Patients aged 18 years or above, and withevidence of gout based on medical and pharmacy claimsbetween January 2009 and April 2012 were eligible forinclusion. Patient characteristics were assessed during a12-month baseline period.Outcome measures: Frequency of gout flares,healthcare costs and resource utilisation were assessed inthe 12 months following the first qualifying gout claim.Generalised linear models were employed to assess theimpact of flare frequency on cost outcomes after adjustingfor covariates.Results: 102 703 patients with gout met study inclusioncriteria; 89 201 had 0–1 gout flares, 9714 had 2 flares,and 3788 had 3+ flares. Average counts of gout-relatedinpatient stays, emergency room visits and ambulatoryvisits were higher among patients with 2 or 3+ flares,compared to those with 0–1 flares (all p<0.001). Adjustedannual gout-related costs were $1804, $3014 and $4363in those with 0–1, 2 and 3+ gout flares, respectively(p<0.001 comparing 0–1 flares to 2 or 3+ flares).Conclusions: Gout-related costs and resource use werelower for those with infrequent flares, suggestingsignificant cost benefit to a gout management plan thathas a goal of reducing flare frequency.
INTRODUCTIONGout is the most common inflammatory arth-ritis in the USA, with a prevalence of about3.9%, or 8.3 million individuals.1 For most
patients, excruciatingly painful gout attacks arethe major clinical burden of the disease.Approximately 60% of patients experience arecurrent gout flare within 1 year after aninitial event, and 78% experience a recurrentflare within 2 years.2 It is recommended thatpatients should be treated to achieve an serumuric acid (sUA) goal of <6.0 mg/dL to managesymptoms and reduce acute gout attacks.3 4
sUA levels higher than this goal have beenassociated with increased risk of flares, andcompliance with gout medication has beenassociated with achieving lower sUA levels.5 6
Findings from several studies suggest thatgout is associated with a substantial eco-nomic burden in the USA. Total annualdirect medical costs related to gout in theUSA have been estimated at about $4 billion,and total annual indirect costs at $2.6billion.7 It has been shown that patients withgout have higher average medical costs andhealthcare utilisation than patients withoutgout.8 9 Further, gout patients with poorly
Strengths and limitations of this study
▪ A large managed care population was used toexamine the association between frequent goutflares and healthcare burden.
▪ We found that follow-up gout-related healthcarecosts and counts of gout-related inpatient stays,emergency room visits and ambulatory visitswere higher among patients with ≥2 flares (vsthose with <2 flares).
▪ These findings demonstrate the importance ofgout management from a health-economicsperspective.
▪ Medical claims data are valuable for examininghealthcare costs and resource use in a real-worldsetting; however, the claims-based algorithmsused here should be validated in future studies.
Jackson R, et al. BMJ Open 2015;5:e007214. doi:10.1136/bmjopen-2014-007214 1
Open Access Research
on 17 July 2018 by guest. Protected by copyright.
http://bmjopen.bm
j.com/
BM
J Open: first published as 10.1136/bm
jopen-2014-007214 on 24 June 2015. Dow
nloaded from

controlled sUA levels incur on average higher healthcarecosts than patients whose sUA levels are better con-trolled, and patients with higher sUA levels incur higheraverage medical costs related to gout flares, compared topatients with lower sUA levels.5 10 Given the heavy soci-etal burden of gout, there is a need to accurately under-stand the impact of acute gout attacks on health serviceutilisation and costs. The objective of the present studywas to quantify the association between frequent flaresand healthcare burden among patients with gout.
METHODSData source and patient identificationThis was a retrospective study using medical claims, phar-macy claims and enrolment information from a largenational health plan database. Laboratory results forblood-based tests were linked to claims data in theresearch database for a subset of the study population.The data have been used previously for the analysis ofcare patterns, drug treatment, costs of care and outcomesin gout. This study included commercial and MedicareAdvantage health plan members with claims indicatinggout between 1 January 2009 and 30 April 2012. Patientswere eligible for study inclusion if they met the criteriafor any one of the following claims-based identificationalgorithms. Algorithm 1: A patient had ≥1 medical claimwith an The International Classification of Diseases,Ninth Revision, Clinical Modification (ICD-9-CM) diag-nosis code for gout (274.xx) in any position and ≥1 phar-macy prescription or medical claim for a urate-loweringmedication (allopurinol, febuxostat, probenecid, colchi-cine, probenecid/colchicine, sulfinpyrazone or pegloti-case). Algorithm 2: A patient had ≥2 medical claims onseparate dates with a diagnosis code for gout in any pos-ition. Algorithm 3: A patient had ≥1 medical claim with adiagnosis code for gout in any position and ≥1 pharmacyor medical claim for non-steroidal anti-inflammatorydrugs (NSAIDs) or corticosteroids within 7 days of thegout diagnosis.Patients were identified with the above algorithms hier-
archically. For patients who met the criteria for the firstalgorithm, the index date was defined as the date of thefirst qualifying claim for either gout diagnosis or medica-tion. For patients who did not meet the criteria for thefirst algorithm, the index date was defined similarly bythe second or third algorithm. To be included in thestudy, all patients were required to be aged ≥18 years asper the index year, and patients were required to have12 months of continuous enrolment in the health planprior to the index date (baseline period) and followingthe index date (follow-up period). Patients wereexcluded if they had evidence of cancer or transplantduring the baseline or follow-up period.
Patient characteristicsAge was defined by index year, and gender and geo-graphic region were captured from enrolment
information. Patients with missing demographic datawere not included in the study. Comorbid conditionswere identified based on the presence of diagnosiscodes on medical claims in the baseline period, and theQuan-Charlson comorbidity score was calculated.11 12
Evidence of renal impairment was identified based ondiagnosis codes, procedure codes, and/or revenuecodes appearing in the baseline period (includingclaims for kidney failure, end-stage renal disease orchronic kidney disease). Alternatively, in patients withavailable baseline serum creatinine laboratory results,evidence of renal impairment was determined using aglomerular filtration rate calculation.13 Baseline sUAlevel was defined as the sUA laboratory result on or pre-ceding and closest chronologically to the index date.Patient ethnicity and net worth information were cap-tured from linked socioeconomic status data, licensedfrom a commercial firm (KBM Group, Richardson,Texas, USA). Ethnicity was assigned based on imputationusing Census data specific to geographic location andname recognition algorithms incorporating the first,middle and last names (eg, certain names or prefixes orsuffixes of surnames are unique to a given ethnicity).Net worth data were determined using self-report, mod-elling, and census data. Use of urate-lowering medica-tions in the follow-up period and new initiation ofurate-lowering medications in the follow-up period wereassessed using claims data.
Identification of flaresFor patients included in the study, flares were countedduring the follow-up period (including the index date)using either of the two following algorithms. FlareAlgorithm 1: Presence of a flare was defined if a patienthad ≥1 medical claim with a diagnosis for gout in anyposition from a physician office, outpatient hospital oremergency department (ED) visit or inpatient hospitalstay followed within 7 days by one of the following: apharmacy claim for an oral or non-oral NSAID; a phar-macy claim for oral or injected colchicine (excludingprobenecid/colchicine combination therapy, which isindicated for chronic gout); a pharmacy claim for anoral or non-oral corticosteroid; a medical claim with aprocedure code for NSAIDs, colchicine, or a corticoster-oid; or a medical claim with a procedure code for jointaspiration/drainage. Flare Algorithm 2: Presence of a flarewas defined if a patient had ≥1 medical claim with anICD-9-CM diagnosis code for joint pain (719.4×) in anyposition from a physician office, outpatient hospital, orED visit or inpatient hospital stay, followed within 7 daysby a prescription drug claim or medical claim with aprocedure code for oral or injected colchicine (exclud-ing probenecid/colchicine combination therapy). Oncea gout flare was established it was assumed that it couldlast for up to 30 days and thus, no other flares werecounted during this 30-day period.14 The total count offlares in the 12-month follow-up period was calculatedfor each patient.
2 Jackson R, et al. BMJ Open 2015;5:e007214. doi:10.1136/bmjopen-2014-007214
Open Access
on 17 July 2018 by guest. Protected by copyright.
http://bmjopen.bm
j.com/
BM
J Open: first published as 10.1136/bm
jopen-2014-007214 on 24 June 2015. Dow
nloaded from

Healthcare costs and resource useHealthcare costs were computed using medical andpharmacy claims data as the combined health plan andpatient paid amounts during the baseline and follow-upperiods. Additionally, payments from Medicare (andother payers) were estimated based on coordination ofbenefits information obtained by the health plan andincorporated into the study. Costs were adjusted usingthe annual medical care component of the ConsumerPrice Index to reflect inflation. Healthcare resource util-isation was calculated for ambulatory visits (office andoutpatient), emergency room visits, and inpatient admis-sions. Costs and resource utilisation were defined as‘gout-related’ if the claim had a diagnosis for gout inany position, or (in the calculation of costs) if a phar-macy claim was for allopurinol, febuxostat, probenecid,pegloticase, colchicine, probenecid/colchicine, sulfin-pyrazone, corticosteroids or NSAIDS.
Statistical analysisData extraction and statistical analysis were performedusing SAS V.9.2 (SAS Institute Inc., Cary, NorthCarolina, USA). All patient characteristics and study out-comes were compared descriptively between a cohort ofpatients with 0–1 gout flares, and cohorts of patientswith 2 gout flares or 3 or more gout flares using t testsor χ2 tests.15 The relationship between patient character-istics and the count of gout flares was assessed using anegative binomial regression model. Total all-cause andgout-related follow-up costs were assessed using general-ised linear models with a γ distribution and a log link,which avoids potential difficulties introduced by trans-formation and retransformation of the dependent vari-able.16 17 For ease of interpretation, the averagepredicted costs were calculated for each cohort.
RESULTSOf the 23 619 150 commercial and Medicare enrolleesin the database from 1 January 2009 to 30 April 2012,280 555 met the gout identification criteria. Of these,127 296 had continuous health plan enrolment duringthe baseline and follow-up periods. Another 24 593patients were lost due to incomplete demographic infor-mation or evidence of cancer or transplant during thebaseline or follow-up periods, resulting in a final sampleof 102 703 gout patients, who were selected for studyinclusion. The mean age of patients was 58 years, and77% of patients were male (table 1). In total, 55.1% ofthe population had flares during the follow-up period.The number of flares per patient during the 1 yearfollow-up period ranged from 0 flares to 9 flares, and onaverage patients had 0.73 flares. Patients were groupedinto three cohorts based on the number of flares theyexperienced during the follow-up period: 0–1 flares(89 201 patients); 2 flares (9714 patients); and 3 ormore flares (3788 patients). For patients with more thanone flare, the average time between flares was 115 days.
Table 1 displays the distribution of demographics andcharacteristics according to the frequency of flares inthe follow-up period. In a negative binomial regressionmodel, several characteristics were independently asso-ciated with higher flare frequency in the follow-upperiod, including residing in the South region (vs theWest or Other geographic regions); Black ethnicity (vsall other races); a net worth of less than $250 000; base-line sUA≥6.0 mg/dL; initiation of urate-loweringtherapy during the follow-up period; and frequent all-cause ambulatory visits (over 8) during the baselineperiod (figure 1). However, presence of renal impair-ment, cardiovascular disease (other than hypertension)or diabetes during the baseline period was associatedwith a lower number of follow-up flares (figure 1).All-cause healthcare resource utilisation and costs were
calculated for the cohorts during the follow-up period.Proportions of patients with all-cause inpatient stays,emergency room (ER) visits and ambulatory visits, andaverage counts of stays and visits per patient were all sig-nificantly higher among patients in the 3+ flares cohortor 2 flares cohort than in the 0–1 flares cohort(table 2). Average follow-up all-cause total costs amongpatients in the 3+ flares, 2 flares, and 0–1 flares cohortswere $14 824, $12 101 and $11 839, respectively(table 2). The cost difference was significant for patientsin the 3+ flares cohort versus the 0–1 flares cohort(p<0.001).Gout-related healthcare resource utilisation and costs
were compared among the cohorts during the follow-upperiod. Measures of follow-up gout-related healthcareutilisation for inpatient stays, ER visits and ambulatoryvisits were all significantly higher among patients in the3+ flares cohort or 2 flares cohort versus the 0–1 flarescohort (all p<0.001) (table 3). Average follow-upgout-related total costs were significantly higher amongpatients with 3+ flares versus those with 0–1 flares($4490 vs $1792, p<0.001), and among patients with 2flares versus those with 0–1 flares ($2939 vs $1792,p<0.001) (table 3). Most subcategories of costs (ambula-tory, ER, inpatient and pharmacy costs) were also higheramong patients with 3+ flares or 2 flares versus thosewith 0–1 flares (table 3). In a subgroup analysis, wefound that average follow-up gout-related total costswere slightly higher among patients with 0 flares com-pared to patients with 1 flare ($2022 vs $1545, p<0.001),but median follow-up gout-related total costs were loweramong patients with 0 vs 1 flare ($175 vs $242, p<0.001).In comparisons to patients with frequent flares (2 ormore), patients with either 0 flares or 1 flare had signifi-cantly lower average and median follow-up gout-relatedtotal costs (all p values<0.001).In a generalised linear model, patients with 3+ flares
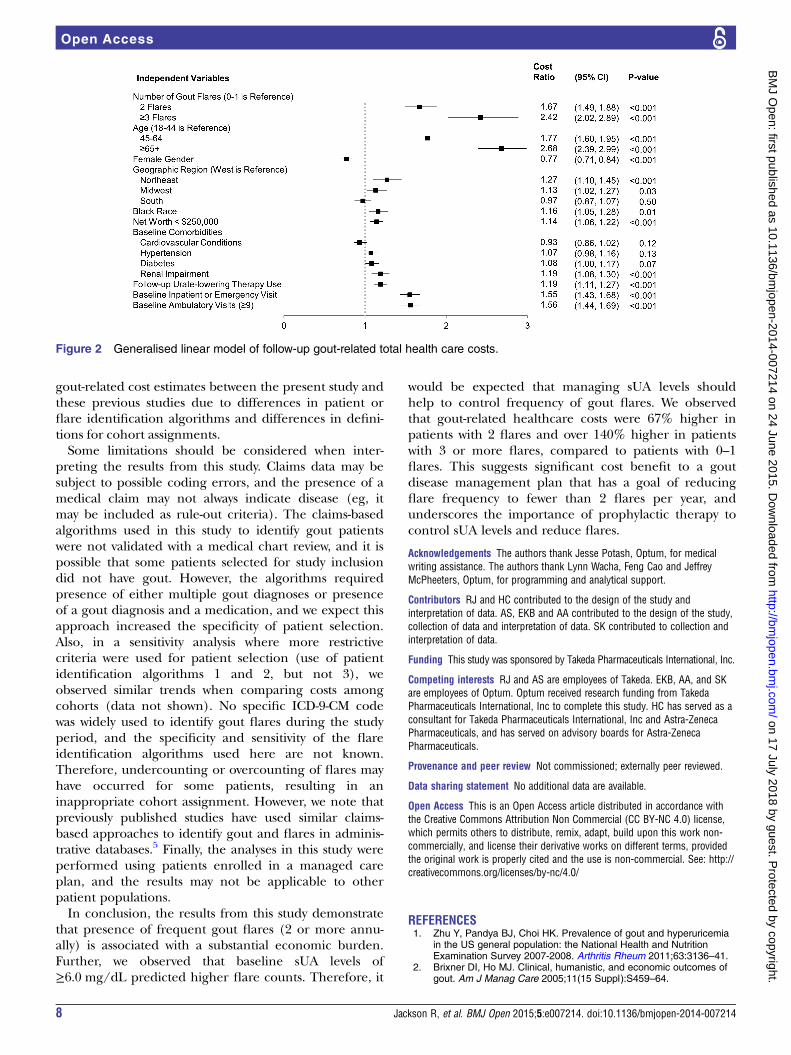
(cost ratio=2.418, p<0.001) and 2 flares (cost ratio=1.671,p<0.001) had significantly higher follow-up gout-relatedtotal healthcare costs than patients with 0–1 flares(figure 2). Characteristics associated with significantlyhigher follow-up gout-related total healthcare costs were
Jackson R, et al. BMJ Open 2015;5:e007214. doi:10.1136/bmjopen-2014-007214 3
Open Access
on 17 July 2018 by guest. Protected by copyright.
http://bmjopen.bm
j.com/
BM
J Open: first published as 10.1136/bm
jopen-2014-007214 on 24 June 2015. Dow
nloaded from

older age; male gender; residing in the Northeast orMidwest regions (vs the West or Other geographicregions); Black ethnicity (vs all other races); a net worthof less than $250 000; baseline renal impairment; use ofurate-lowering therapy during the follow-up period; anybaseline occurrence of all-cause inpatient or ER visits;and frequent ambulatory visits (over 8) during the base-line period (figure 2). Mean adjusted gout-related costswere $1804, $3014 and $4363 in patients with 0–1, 2 or 3+ flares, respectively (p<0.001 comparing 0–1 flares to 2or 3+ flares). Adjusted gout-related healthcare costs were67% higher in those with 2 flares and over 140% higherin those with 3 or more flares compared to those withinfrequent flares (0–1).
DISCUSSIONIn this study, we examined the relationship between fre-quent gout flares and healthcare costs/resource utilisa-tion in a commercially insured and Medicare Advantage
population. Although it might be assumed that patientswith frequent flares would have higher costs, our studysought to quantify the healthcare costs and comparethese among different cohorts to understand the magni-tude of the difference. We found that average annualgout-related total healthcare costs (unadjusted) werehigher among patients with either 3+ flares ($4490) or 2flares ($2939) versus those with 0–1 flares ($1792, bothcomparisons p<0.001). Also, as expected, counts ofgout-related inpatient stays, ER visits and ambulatoryvisits were significantly higher among patients in the 3+flares and 2 flares cohort versus the 0–1 flares cohort. Ina subgroup analysis, average annual gout-related totalhealthcare costs were slightly higher among patientswith 0 flares compared to patients with 1 flare ($2022 vs$1545, p<0.001), but median costs were lower ($175 vs$242, p<0.001). However, average costs for each of thesegroups (0 or 1) were significantly lower than costs forpatients with frequent flares. These findings suggest thatthe cost of gout disease management for patients who
Table 1 Baseline characteristics of 102 703 patients with gout
Total (N=102 703) 0–1 Flares (N=89 201) 2 Flares (N=9714) 3+ Flares (N=3788)
Age (mean, SD) 58.1 (13.9) 58.3 (13.9) 56.6 (13.8)* 57.0 (13.9)*
Gender (% male) 77.4 77.0 79.6* 79.3*
Insurance type (%)
Commercial 76.9 76.9 77.6 75.9
Medicare advantage 23.1 23.1 22.5 24.1
Geographic region (%)
Northeast 10.2 10.3 9.5* 9.5
Midwest 25.9 26.2 24.5* 23.2*
South 49.5 48.8 53.1* 55.6*
West 14.4 14.7 12.9* 11.7*
Other 0.02 0.02 0.0 0.0
Race (%)
White 71.8 72.2 69.8* 68.0*
Black 13.8 13.4 16.4* 17.9*
Hispanic 6.3 6.3 6.1 6.5
Asian 2.9 2.9 3.1 2.6
Other 1.1 1.1 1.0 1.0
Missing/unknown 4.1 4.1 3.6* 4.0
Net worth (%)
<$25 000 8.0 7.8 9.1* 10.4*
$25 000–$149 999 19.3 18.8 22.3* 22.0*
$150 000–$249 999 15.4 15.3 15.4 15.6
$250 000–$499 999 25.6 25.8 24.7* 23.8*
≥$500 000 22.4 22.9 19.6* 18.3*
Missing/unknown 9.4 9.4 9.0 10.0
Quan-Charlson comorbidity score
(mean, SD)
0.6 (1.2) 0.6 (1.2) 0.6 (1.1) 0.7 (1.2)*
Comorbidities of interest (%)
Renal impairment 20.4 20.2 21.2* 23.4*
Overweight/obese 9.6 9.5 10.1 11.0*
Diabetes 28.9 29.2 26.9* 26.5*
Cardiovascular conditions 75.9 76.2 72.9* 75.8
Baseline sUA level
Patients with data (n) 14 641 12 741 1358 542
sUA level (mean, SD) 7.5 (2.0) 7.4 (2.0) 8.3 (1.8)* 8.7 (1.9)*
*p<0.05 vs 0–1 flares cohort.
4 Jackson R, et al. BMJ Open 2015;5:e007214. doi:10.1136/bmjopen-2014-007214
Open Access
on 17 July 2018 by guest. Protected by copyright.
http://bmjopen.bm
j.com/
BM
J Open: first published as 10.1136/bm
jopen-2014-007214 on 24 June 2015. Dow
nloaded from

experience just 1 flare annually is similar to those whodo not experience a flare. In comparison, averageannual gout-related total healthcare costs were abouttwofold to threefold higher among those with 3+ flarescompared to those with 0 or 1 flares, demonstrating thatthe economic burden of disease for patients with fre-quent flares is substantially higher than for those withinfrequent flares.We observed a high flare count (three or more during
the follow-up period) among 3.7% of patients in the studypopulation. This is consistent with previous studies thatused claims-based algorithms to identify gout patients andflares, which found that only 2–3% of patients with gouthad 3 or more flares over a 1-year period.18 19 Thus,although the proportion of patients with frequent goutflares (3 or more per year) was small in this population,these patients have a high burden in terms of healthcarecosts and resource use. In this study, average all-causehealthcare costs among patients in the 3+ flares cohort was$14 824 during the 1 year follow-up period. In compari-son, prior studies using claims data have reported averageannual all-cause healthcare costs of $11 182 for patientswith irritable bowel syndrome,20 $13 548 among type 2 dia-betes patients,21 and $15 487 for patients with prevalentadult systemic lupus erythematosus.22Therefore, we foundthat all-cause healthcare costs for gout patients with fre-quent flares were within the vicinity of other majorchronic conditions.Importantly, we observed some differences in
characteristics among cohorts (eg, for age, gender,ethnicity, geographic distribution and comorbidities).To adjust for differences in patient characteristics, therelationship between flare frequency and healthcarecosts was examined using a multivariate regressionmodel. In the multivariate analysis, gout-related costs
for patients in the 3+ flares cohort and the 2 flarescohort remained higher than costs for patients in the0–1 flares cohort. Mean adjusted gout-related total costswere $1804, $3014 and $4363 in patients with 0–1, 2 or3+ flares, respectively (p<0.001 comparing 0–1 flares to2 or 3+ flares). A number of patient characteristicswere associated with higher gout-related costs in themultivariate analysis, including older age; baseline renalimpairment; baseline inpatient, ER, or ambulatoryvisits; and follow-up use of urate-lowering therapy. It islikely some of these characteristics are markers formore severe disease or challenging cases with worsehealth status, and thus are unsurprisingly associatedwith higher healthcare costs.Additionally, a number of factors associated with
increased flare count were identified in a separate multi-variate analysis. Some of these associations wereexpected. For example, baseline sUA levels predicted ahigher risk of flares, and it may be expected that patientswith higher baseline sUA have more poorly controlledgout.5 The observation that a baseline sUA level of ≥6 orhigher was predictive for an increased risk of flaresunderscores the importance of an sUA goal of<6.0 mg/dL. However, the reasons for some associationswere not entirely clear, such as the finding thatcardiovascular-renal impairment and diabetes had a pro-tective effect against future gout flares. This finding maybe related to the identification of flares in the claimsusing medications (NSAIDs, steroids) that are oftencontraindicated with these conditions, respectively.Additional research is needed to further validate the pre-dictive value of this model and to better understand theobserved associations.Some previous studies have examined the relationship
between frequency of gout flares and healthcare
Figure 1 Generalised linear model of follow-up flare count.
Jackson R, et al. BMJ Open 2015;5:e007214. doi:10.1136/bmjopen-2014-007214 5
Open Access
on 17 July 2018 by guest. Protected by copyright.
http://bmjopen.bm
j.com/
BM
J Open: first published as 10.1136/bm
jopen-2014-007214 on 24 June 2015. Dow
nloaded from

utilisation/costs using medical claims data. Lynch et al18
found that although annual medical costs were higheramong gout patients with 3 or more flares versus thosewith fewer than 3 flares over a 1 year period, this differ-ence was not statistically significant ($8640 vs $7332,p=0.2037). Unlike the present study, Lynch et almeasuredonly annual all-cause costs, not gout-related costs.
However, when measuring medical costs during the timeof the gout attack (defined as the 14 days before to14 days after the start of the attack), Lynch et al18 foundthat medical costs during an episode were on averagehigher for patients with 3 or more flares versus those withunder 3 flares ($707 vs $570, as measured over a 28-daygout attack timeframe). Another claims-based study by
Table 2 Follow-up all-cause health care resource utilisation and costs
Total 0–1 Flares 2 Flares 3+ Flares
Resource utilisation (N=102 703) (N=89 201) (N=9714) (N=3788)
Inpatient stay
n 14 268 12 106 1432 730
% 13.9 13.6 14.7* 19.3*
ER visit
n 31 670 26 435 3555 1680
% 30.8 29.6 36.6* 44.4*
Ambulatory visits
n 102 002 88 511 9707 3784
% 99.3 99.2 99.9* 99.9*
Count of inpatient stays
Mean 0.20 0.20 0.22* 0.29*
SD 0.62 0.60 0.67 0.75
Count of ER visits
Mean 0.83 0.80 0.92* 1.31*
SD 2.92 2.93 2.48 3.58
Count of ambulatory visits
Mean 15.65 15.18 17.37* 22.36*
SD 15.49 15.31 15.50 17.81
Costs (N=102 703) (N=89 201) (N=9714) (N=3788)
Total costs
Mean 11 974 11 839 12 101 14 824 *
SD 30 349 30 866 26 957 25 819
Median 4339 4235 4625 6565
Medical costs
Mean 9754 96 340 9896 12 069*
SD 29 501 30 055 25 963 24 319
Median 2356 2262 2644 4022
Inpatient costs
Mean 3832 3764 4027 4918*
SD 19 396 19 513 18 751 18 175
Median 0 0 0 0
ER costs
Mean 414 394 505* 670*
SD 1542 1550 1425 1627
Median 0 0 0 0
Ambulatory costs
Mean 4806 4780 4709 5662*
SD 16 917 17 515 13 071 9814
Median 1666 1601 1872 2728
Other medical costs
Mean 702 702 656 819
SD 4575 4752 2990 3576
Median 79 77 83 124
Pharmacy costs
Mean 2220 2199 2205 2756*
SD 3973 3849 4418 5352
Median 1065 1042 1098 1535
*p<0.001 vs 0–1 flares cohort; comparisons performed for means and percentages.ER, emergency room.
6 Jackson R, et al. BMJ Open 2015;5:e007214. doi:10.1136/bmjopen-2014-007214
Open Access
on 17 July 2018 by guest. Protected by copyright.
http://bmjopen.bm
j.com/
BM
J Open: first published as 10.1136/bm
jopen-2014-007214 on 24 June 2015. Dow
nloaded from

Saseen et al19 compared costs of patients with ≥3 goutattacks to costs of patients with <3 gout attacks. Costs andflares were both counted during a 1 year follow-upperiod. Consistent with the present study, Saseen et al19
found higher gout-related medical costs for the ≥3 goutattacks group versus the <3 gout attacks group ($834 vs$176, p<0.0001). They also found significantly higher
rates of gout-related inpatient visits, outpatient visits andEM visits for the ≥3 gout attacks group versus the <3 goutattacks group (all p<0.0001), which is consistent with thetrend we observed in the present study.19 Our resultsserve as a valuable confirmation of these previous obser-vations using a different study population, but we notethat it may be difficult to make direct comparisons for
Table 3 Follow-up gout-related health care resource utilisation and costs
Total 0–1 Flares 2 Flares 3+ Flares
Resource utilisation (N=102 703) (N=89 201) (N=9714) (N=3788)
Inpatient stay
n 6245 4972 780 493
% 6.1 5.6 8.0* 13.0*
ER visit
n 7728 5441 1471 816
% 7.5 6.1 15.1* 21.5*
Ambulatory visits
n 85 238 71 839 9632 3767
% 83.0 80.5 99.2* 99.5*
Count of inpatient stays
Mean 0.07 0.06 0.10* 0.17*
SD 0.31 0.28 0.41 0.50
Count of ER visits
Mean 0.09 0.07 0.19* 0.34*
SD 0.35 0.28 0.52 0.83
Count of ambulatory visits
Mean 2.03 1.64 3.87* 6.38*
SD 2.12 1.63 2.43 3.66
Costs (N=102 703) (N=89 201) (N=9714) (N=3788)
Total costs
Mean 2000 1792 2939* 4490*
SD 10 177 9479 13 766 14 033
Median 245 209 533 1003
Medical costs
Mean 1940 1739 2847* 4361*
SD 10 173 9476 13 764 14 023
Median 201 170 449 864
Inpatient costs
Mean 1386 1268 1897* 2874*
SD 9794 9122 13 358 13 441
Median 0 0 0 0
ER costs
Mean 54 42 114* 195*
SD 299 261 415 577
Median 0 0 0 0
Ambulatory costs
Mean 446 377 782* 1201*
SD 2035 1892 2780 2699
Median 151 128 354 638
Other medical costs
Mean 54 52 54 90*
SD 816 861 363 532
Median 0 0 0 3
Pharmacy costs
Mean 60 53 92* 130*
SD 208 201 226 273
Median 11 9 33 55
*p<0.001 vs 0–1 flares cohort; comparisons performed for means and percentages.ER, emergency room.
Jackson R, et al. BMJ Open 2015;5:e007214. doi:10.1136/bmjopen-2014-007214 7
Open Access
on 17 July 2018 by guest. Protected by copyright.
http://bmjopen.bm
j.com/
BM
J Open: first published as 10.1136/bm
jopen-2014-007214 on 24 June 2015. Dow
nloaded from
gout-related cost estimates between the present study andthese previous studies due to differences in patient orflare identification algorithms and differences in defini-tions for cohort assignments.Some limitations should be considered when inter-
preting the results from this study. Claims data may besubject to possible coding errors, and the presence of amedical claim may not always indicate disease (eg, itmay be included as rule-out criteria). The claims-basedalgorithms used in this study to identify gout patientswere not validated with a medical chart review, and it ispossible that some patients selected for study inclusiondid not have gout. However, the algorithms requiredpresence of either multiple gout diagnoses or presenceof a gout diagnosis and a medication, and we expect thisapproach increased the specificity of patient selection.Also, in a sensitivity analysis where more restrictivecriteria were used for patient selection (use of patientidentification algorithms 1 and 2, but not 3), weobserved similar trends when comparing costs amongcohorts (data not shown). No specific ICD-9-CM codewas widely used to identify gout flares during the studyperiod, and the specificity and sensitivity of the flareidentification algorithms used here are not known.Therefore, undercounting or overcounting of flares mayhave occurred for some patients, resulting in aninappropriate cohort assignment. However, we note thatpreviously published studies have used similar claims-based approaches to identify gout and flares in adminis-trative databases.5 Finally, the analyses in this study wereperformed using patients enrolled in a managed careplan, and the results may not be applicable to otherpatient populations.In conclusion, the results from this study demonstrate
that presence of frequent gout flares (2 or more annu-ally) is associated with a substantial economic burden.Further, we observed that baseline sUA levels of≥6.0 mg/dL predicted higher flare counts. Therefore, it
would be expected that managing sUA levels shouldhelp to control frequency of gout flares. We observedthat gout-related healthcare costs were 67% higher inpatients with 2 flares and over 140% higher in patientswith 3 or more flares, compared to patients with 0–1flares. This suggests significant cost benefit to a goutdisease management plan that has a goal of reducingflare frequency to fewer than 2 flares per year, andunderscores the importance of prophylactic therapy tocontrol sUA levels and reduce flares.
Acknowledgements The authors thank Jesse Potash, Optum, for medicalwriting assistance. The authors thank Lynn Wacha, Feng Cao and JeffreyMcPheeters, Optum, for programming and analytical support.
Contributors RJ and HC contributed to the design of the study andinterpretation of data. AS, EKB and AA contributed to the design of the study,collection of data and interpretation of data. SK contributed to collection andinterpretation of data.
Funding This study was sponsored by Takeda Pharmaceuticals International, Inc.
Competing interests RJ and AS are employees of Takeda. EKB, AA, and SKare employees of Optum. Optum received research funding from TakedaPharmaceuticals International, Inc to complete this study. HC has served as aconsultant for Takeda Pharmaceuticals International, Inc and Astra-ZenecaPharmaceuticals, and has served on advisory boards for Astra-ZenecaPharmaceuticals.
Provenance and peer review Not commissioned; externally peer reviewed.
Data sharing statement No additional data are available.
Open Access This is an Open Access article distributed in accordance withthe Creative Commons Attribution Non Commercial (CC BY-NC 4.0) license,which permits others to distribute, remix, adapt, build upon this work non-commercially, and license their derivative works on different terms, providedthe original work is properly cited and the use is non-commercial. See: http://creativecommons.org/licenses/by-nc/4.0/
REFERENCES1. Zhu Y, Pandya BJ, Choi HK. Prevalence of gout and hyperuricemia
in the US general population: the National Health and NutritionExamination Survey 2007-2008. Arthritis Rheum 2011;63:3136–41.
2. Brixner DI, Ho MJ. Clinical, humanistic, and economic outcomes ofgout. Am J Manag Care 2005;11(15 Suppl):S459–64.
Figure 2 Generalised linear model of follow-up gout-related total health care costs.
8 Jackson R, et al. BMJ Open 2015;5:e007214. doi:10.1136/bmjopen-2014-007214
Open Access
on 17 July 2018 by guest. Protected by copyright.
http://bmjopen.bm
j.com/
BM
J Open: first published as 10.1136/bm
jopen-2014-007214 on 24 June 2015. Dow
nloaded from

3. Shoji A, Yamanaka H, Kamatani N. A retrospective study of therelationship between serum urate level and recurrent attacks ofgouty arthritis: evidence for reduction of recurrent gouty arthritis withantihyperuricemic therapy. Arthritis Rheum 2004;51:321–5.
4. Zhang W, Doherty M, Bardin T, et al. EULAR evidence basedrecommendations for gout. Part II: management. Report of a task forceof the EULAR Standing Committee for International Clinical StudiesIncluding Therapeutics (ESCISIT). Ann Rheum Dis 2006;65:1312–24.
5. Halpern R, Fuldeore MJ, Mody RR, et al. The effect of serum urateon gout flares and their associated costs: an administrative claimsanalysis. J Clin Rheumatol 2009;15:3–7.
6. Halpern R, Mody RR, Fuldeore MJ, et al. Impact of noncompliancewith urate-lowering drug on serum urate and gout-related healthcarecosts: administrative claims analysis. Curr Med Res Opin2009;25:1711–19.
7. Wertheimer A, Morlock R, Becker MA. A revised estimate of theburden of illness of gout. Curr Ther Res Clin Exp 2013;75:1–4.
8. Brook RA, Kleinman NL, Patel PA, et al. The economic burden ofgout on an employed population. Curr Med Res Opin2006;22:1381–9.
9. Singh JA, Strand V. Gout is associated with more comorbidities,poorer health-related quality of life and higher healthcare utilisationin US veterans. Ann Rheum Dis 2008;67:1310–16.
10. Park H, Rascati KL, Prasla K, et al. Evaluation of health care costsand utilization patterns for patients with gout. Clin Ther2012;34:640–52.
11. Quan H, Li B, Couris CM, et al. Updating and validating theCharlson comorbidity index and score for risk adjustment in hospitaldischarge abstracts using data from 6 countries. Am J Epidemiol2011;173:676–82.
12. Bayliss EA, Ellis JL, Shoup JA, et al. Association of patient-centeredoutcomes with patient-reported and ICD-9-based morbiditymeasures. Ann Fam Med 2012;10:126–33.
13. Rule AD, Larson TS, Berstralh EJ, et al. Using serum creatinineto estimate glomerular filtration rate: accuracy in good health and inchronic kidney disease. Ann Intern Med 2004;141:929–37.
14. Rothenbacher D, Primatesta P, Ferreira A, et al. Frequency and riskfactors of gout flares in a large population-based cohort of incidentgout. Rheumatology (Oxford) 2011;50:973–81.
15. Khanna D, Fitzgerald JD, Khanna PP, et al. 2012 American Collegeof Rheumatology guidelines for management of gout. Part 1:systematic nonpharmacologic and pharmacologic therapeuticapproaches to hyperuricemia. Arthritis Care Res (Hoboken)2012;64:1431–46.
16. Manning WG. The logged dependentvariable, heteroscedasticity,and the retransformation problem. J Health Econ 1998;17:283–95.
17. Manning WG, Mullahy J. Estimating log models: to transform or notto transform? J Health Econ 2001;20:461–94.
18. Lynch W, Chan W, Kleinman N, et al. Economic burden of goutyarthritis attacks for employees with frequent and infrequent attacks.Popul Health Manag 2013;16:138–45.
19. Saseen JJ, Agashivala N, Allen RR, et al. Comparison of patientcharacteristics and gout-related health-care resource utilization andcosts in patients with frequent versus infrequent gouty arthritisattacks. Rheumatology (Oxford) 2012;51:2004–12.
20. Doshi JA, Cai Q, Buono JL, et al. Economic burden of irritable bowelsyndrome with constipation: a retrospective analysis of health carecosts in a commercially insured population. J Manag Care SpecPharm 2014;20:382–90.
21. Bron M, Guerin A, Latremouille-Viau D, et al. Distribution and driversof costs in type 2 diabetes mellitus treated with oral hypoglycemicagents: a retrospective claims data analysis. J Med Econ2014;17:646–57.
22. Furst DE, Clarke A, Fernandes AW, et al. Resource utilization anddirect medical costs in adult systemic lupus erythematosus patientsfrom a commercially insured population. Lupus 2013;22:268–78.
Jackson R, et al. BMJ Open 2015;5:e007214. doi:10.1136/bmjopen-2014-007214 9
Open Access
on 17 July 2018 by guest. Protected by copyright.
http://bmjopen.bm
j.com/
BM
J Open: first published as 10.1136/bm
jopen-2014-007214 on 24 June 2015. Dow
nloaded from