open and run a virtual instrument - university of new...
TRANSCRIPT

Exercise 0 - Open and Run a Virtual Instrument (Slide 12)
Examine the Signal Generation and Processing VI and run it. Change the frequencies and types of the input signals and notice how the display on the graph changes. Change the Signal Processing Window and Filter options. After you have examined the VI and the different options you can change, stop the VI by pressing the Stop button.
1. Select Start»Programs»National Instruments»LabVIEW 7.0»LabVIEW to launch LabVIEW. The LabVIEW dialog box appears.
2. Select Help»Find Examples. The dialog box that appears lists and links to all available LabVIEW example VIs.
3. On the Browse Tab, select browse according to task. Choose Analyzing and Processing Signals, then Signal Processing, then Signal Generation and Processing.vi.This will open the Signal Generation and Processing VI Front Panel.
Note You also can open the VI by clicking the Open VI button and navigating tolabview\examples\apps\demos.llb\Signal Generation and Processing.vi.
Front Panel4. Click the Run button on the toolbar, shown at left, to run this
VI.This VI determines the result of filtering and windowing a generated signal. This example also displays the power spectrum for the generated signal. The resulting signals are displayed in the graphs on the front panel, as shown in thefollowing figure.
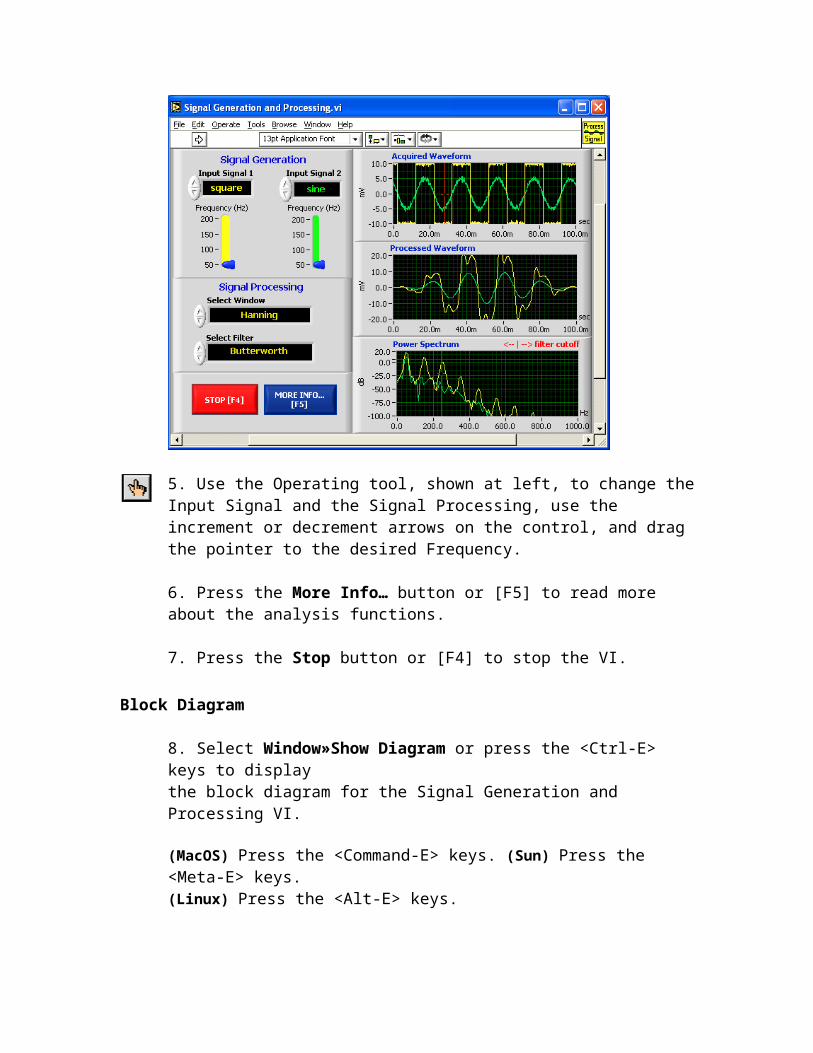
5. Use the Operating tool, shown at left, to change the Input Signal and the Signal Processing, use the increment or decrement arrows on the control, and drag the pointer to the desired Frequency.
6. Press the More Info… button or [F5] to read more about the analysis functions.
7. Press the Stop button or [F4] to stop the VI.
Block Diagram
8. Select Window»Show Diagram or press the <Ctrl-E> keys to displaythe block diagram for the Signal Generation and Processing VI.
(MacOS) Press the <Command-E> keys. (Sun) Press the <Meta-E> keys.(Linux) Press the <Alt-E> keys.
This block diagram contains several of the basic block diagram elements, including subVIs, functions, and structures, which you will learn about later in this course.
9. Select Window»Show Panel or press the <Ctrl-E> keys to return to the Front Panel.

10. Close the VI and do not save changes.
End of Exercise

Exercise 1 – Convert C to F
Build a VI
Complete the following steps to create a VI that takes a number representing degrees Celsius and converts it to a number representing degrees Fahrenheit.
In wiring illustrations, the arrow at the end of this mouse icon shows where to click and the number on the arrow indicates how many times to click.
Front Panel1. Select File»New to open a new front panel.
2. (Optional) Select Window»Tile Left and Right to display the front panel and block diagram side by side.
3. Create a numeric digital control. You will use this control to enter the value for degrees Centigrade.
a. Select the digital control on the Controls»Numeric Controls palette. If the Controls palette is not visible, right-click an open area on the front panel to display it.
b. Move the control to the front panel and click to place the control.
c. Type deg C inside the label and click outside the label or click the Enter button on the toolbar. If you do not type the name immediately, LabVIEW uses a default label. You can edit a label at any time by using the Labeling tool.
4. Create a numeric digital indicator. You will use this indicator to display the value for degrees Fahrenheit.
a. Select the digital indicator on the Controls»Numeric Indicators palette.
b. Move the indicator to the front panel and click to place the indicator.
c. Type deg F inside the label and click outside the label or click the Enter button.
LabVIEW creates corresponding control and indicator terminals on the block diagram. The terminals represent the data type of the control or indicator. For example, a DBL
terminal represents a double-precision, floating-point numeric control or indicator.
Note Control terminals have a thicker border than indicator terminals.
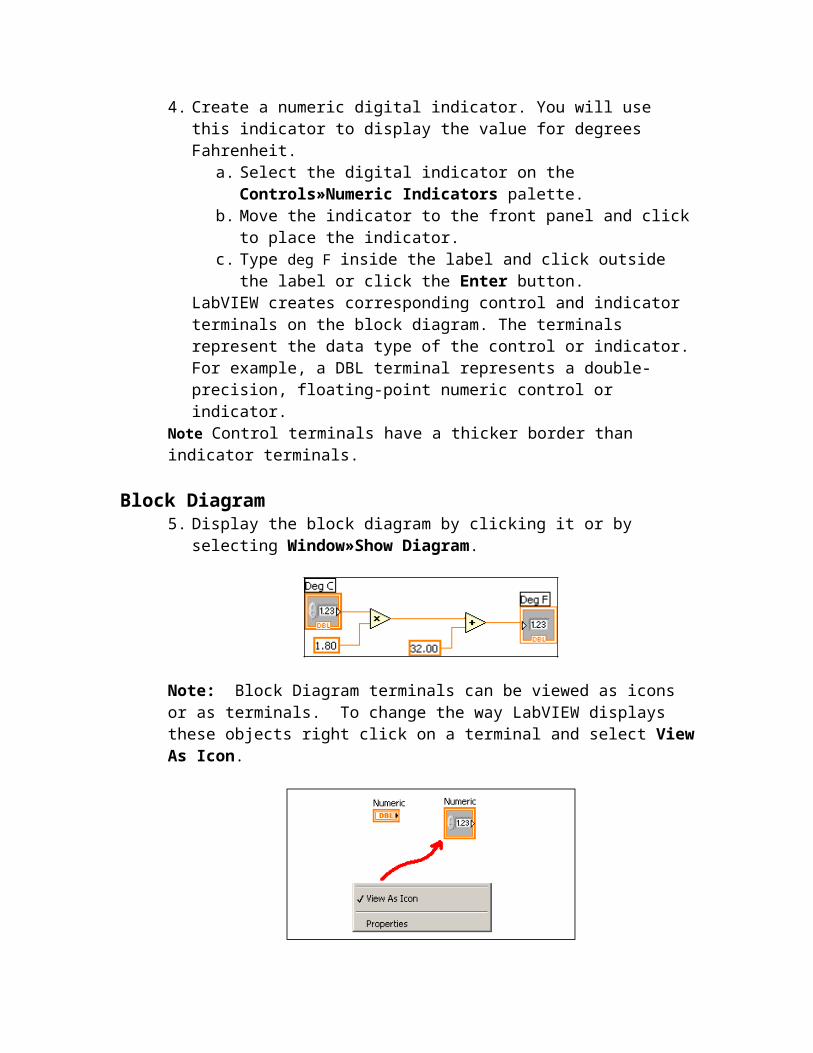
Block Diagram5. Display the block diagram by clicking it or by selecting
Window»Show Diagram.
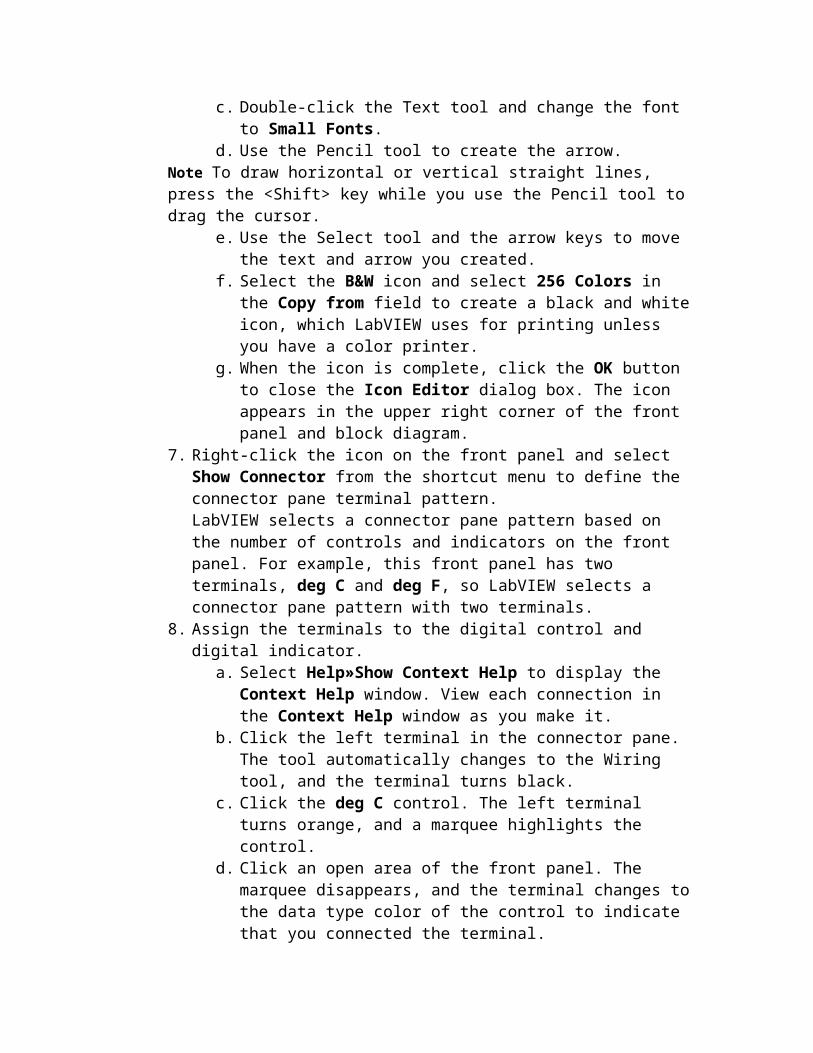
Note: Block Diagram terminals can be viewed as icons or as terminals. To change the way LabVIEW displays these objects right click on a terminal and select View As Icon.
6. Select the Multiply and Add functions on the Functions»Numeric palette and place them on the block diagram. If the Functions palette is not visible, right-click an open area on the block diagram to display it.
7. Select the numeric constant on the Functions»Numeric palette and place two of them on the block diagram. When you first place the numeric constant, it is highlighted so you can type a value.
8. Type 1.8 in one constant and 32.0 in the other.If you moved the constants before you typed a value, use the Labeling tool to enter the values.
9. Use the Wiring tool to wire the icons as shown in the previous block diagram.
To wire from one terminal to another, use the Wiring tool to click the first terminal, move the tool to the second terminal, and click the second terminal, as
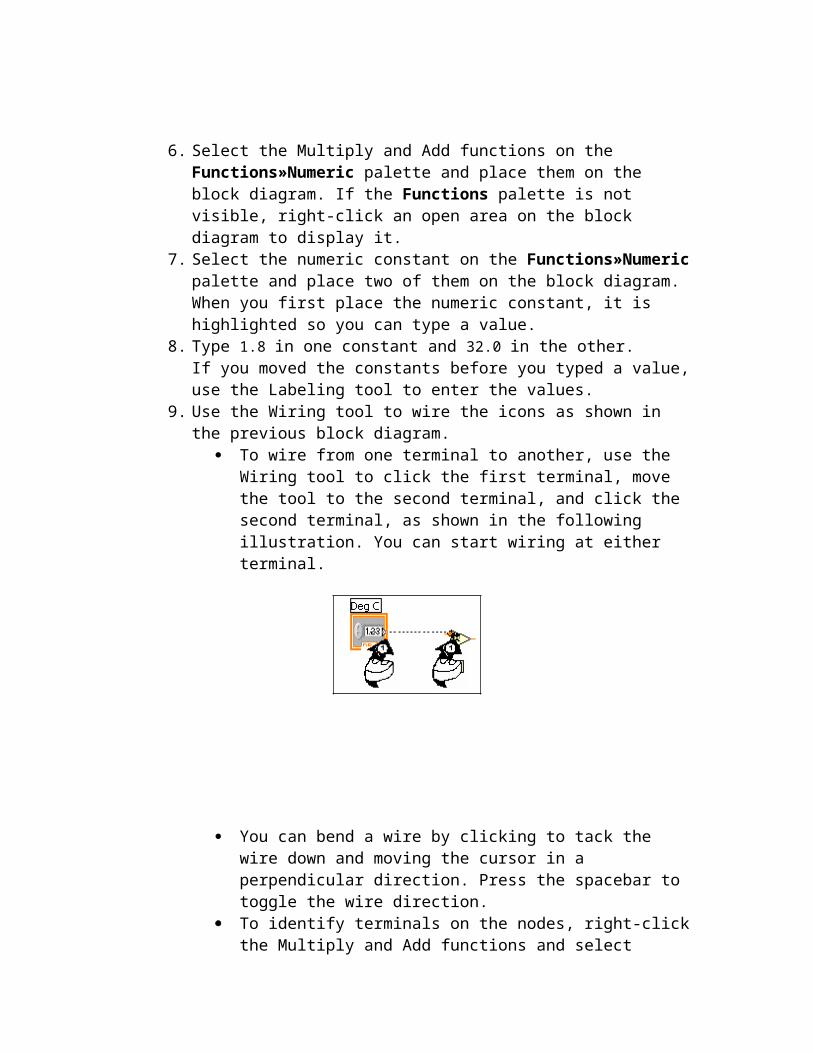
shown in the following illustration. You can start wiring at either terminal.
You can bend a wire by clicking to tack the wire down and moving the cursor in a perpendicular direction. Press the spacebar to toggle the wire direction.
To identify terminals on the nodes, right-click the Multiply and Add functions and select Visible Items»Terminals from the shortcut menu to display the connector pane. Return to the icons after wiring by right-clicking the functions and selecting Visible Items»
Terminals from the shortcut menu to remove the checkmark.
When you move the Wiring tool over a terminal, the terminal area blinks, indicating that clicking will connect the wire to that terminal and a tip strip appears, listing the name of the terminal.
To cancel a wire you started, press the <Esc> key, right-click, or click the source terminal.
10. Display the front panel by clicking it or by selecting Window»Show Panel.
11. Save the VI because you will use this VI later in the course.a. Select File»Save.b. Navigate to c:\exercises\LV Intro.
Note Save all the VIs you edit in this course in c:\exercises\LV Intro.
c. Type Convert C to F.vi in the dialog box.d. Click the Save button.
12. Enter a number in the digital control and run the VI.a. Use the Operating tool or the Labeling tool to double-
click the digital control and type a new number.b. Click the Run button to run the VI.c. Try several different numbers and run the VI again.

13. Select File»Close to close the Convert C to F VI.
End of Exercise

Exercise 2a – Create a SubVI
Front Panel1. Select File»Open and navigate to c:\exercises\LV Intro to
open the Convert C to F VI.If you closed all open VIs, click the Open… button on the LabVIEW dialog box.
Tip Click the arrow next to Open… button on the LabVIEW dialog box to open recently opened files, such as Convert C to F.vi.
The following front panel appears.
2. Right-click the icon in the upper right corner of the front panel and select Edit Icon from the shortcut menu. The Icon Editor dialog box appears.
3. Double-click the Select tool on the left side of the Icon Editor dialog box to select the default icon.
4. Press the <Delete> key to remove the default icon.5. Double-click the Rectangle tool to redraw the border.6. Create the following icon.
a. Use the Text tool to click the editing area.b. Type C and F.c. Double-click the Text tool and change the font to Small
Fonts.d. Use the Pencil tool to create the arrow.
Note To draw horizontal or vertical straight lines, press the <Shift> key while you use the Pencil tool to drag the cursor.
e. Use the Select tool and the arrow keys to move the text and arrow you created.
f. Select the B&W icon and select 256 Colors in the Copy from field to create a black and white icon, which LabVIEW uses for printing unless you have a color printer.
g. When the icon is complete, click the OK button to close the Icon Editor dialog box. The icon appears in the upper right corner of the front panel and block diagram.
7. Right-click the icon on the front panel and select Show Connector from the shortcut menu to define the connector pane terminal pattern.LabVIEW selects a connector pane pattern based on the number of controls and indicators on the front panel. For example, this front panel has two terminals, deg C and deg F, so LabVIEW selects a connector pane pattern with two terminals.
8. Assign the terminals to the digital control and digital indicator.a. Select Help»Show Context Help to display the
Context Help window. View each connection in the Context Help window as you make it.
b. Click the left terminal in the connector pane. The tool automatically changes to the Wiring tool, and the terminal turns black.
c. Click the deg C control. The left terminal turns orange, and a marquee highlights the control.
d. Click an open area of the front panel. The marquee disappears, and the terminal changes to the data type color of the control to indicate that you connected the terminal.
e. Click the right terminal in the connector pane and click the deg F indicator. The right terminal turns orange.
f. Click an open area on the front panel. Both terminals are orange.
g. Move the cursor over the connector pane. The Context Help window shows that both terminals are connected to floating-point values.
9. Select File»Save to save the VI because you will use this VI later in the course.
10. Select File»Close to close the Convert C to F VI.
End of Exercise

Exercise 2b - Data Acquisition
To complete this exercise, you will need the IC temperature sensor available on either the BNC-2120, SCB-68, or DAQ Signal Accessory.
Front Panel1. Select File»New to open a new front panel.2. Create the thermometer indicator, as shown on the following
front panel.
a. Select the thermometer on the Controls»Numeric Indicators palette and place it on the front panel.
b. Type Temperature inside the label and click outside the label or click the Enter button on the toolbar.
c. Right-click the thermometer and select Visible Items»Digital Display from the shortcut menu to display the digital display for the thermometer.
3. Create the vertical switch control.a. Select the vertical toggle switch on the
Controls»Buttons palette.b. Type Temp Scale inside the label and click outside the
label or click the Enter button.c. Use the Labeling tool to place a free label, deg C, next to
the TRUE position of the switch, as shown in the previous front panel.
d. Place a free label, deg F, next to the FALSE position of the switch.
Block Diagram4. Select Window»Show Diagram to display the block
diagram.5. Build the following block diagram.

a. Place the DAQ Assistant Express VI located on the Functions»Input palette. Make the following configurations in the DAQ Assistant configuration wizard.
i. Select Analog Input as the measurement type.ii. Select Voltage.iii. Select ai0 as the channel from your data
acquisition device.iv. In the Task Timing section, select Acquire 1
sample.
b. Place the Convert from Dynamic Data function located on the Functions»Signal Manipulation and select Single Scalar as the Resulting data type.
c. Place the Multiply function located on the Functions»Numeric palette. This function multiplies the voltage that the AI Sample Channel VI returns by 100.0 to obtain the Celsius temperature.
d. Select Functions»Select a VI, navigate to the Convert C to F VI, which you built in Exercise 2a, and place the VI on the block diagram. This VI converts the Celsius readings to Fahrenheit.
e. Place the Select function located on the Functions»Comparison palette. This function returns either the Fahrenheit (FALSE) or Celsius (TRUE) temperature value, depending on the value of Temp Scale.
f. Right-click the y terminal of the Multiply function, select Create»Constant, type 100, and press the <Enter> key to create another numeric constant.
g. Use the Positioning tool to place the icons as shown in the previous block diagram and use the Wiring tool to wire them together.
Tip To identify terminals on the nodes, right-click the icon and selectVisible Items»Terminal from the shortcut menu to display the connector pane.

6. Display the front panel by clicking it or by selecting Window»Show Panel.
7. Click the Continuous Run button, shown at left, to run the VI continuously.
8. Put your finger on the temperature sensor and notice the temperature increase.
9. Click the Continuous Run button again to stop the VI.10. Create the following icon, so you can use the Temperature
VI as a subVI.
a. Right-click the icon in the upper right corner of the front panel and select Edit Icon from the shortcut menu. The Icon Editor dialog box appears.
b. Double-click the Select tool on the left side of the Icon Editor dialog box to select the default icon.
c. Press the <Delete> key to remove the default icon.d. Double-click the Rectangle tool to redraw the border.e. Use the Pencil tool to draw an icon that represents the
thermometer.f. Use the Foreground and Fill tools to color the
thermometer red.Note To draw horizontal or vertical straight lines, press the <Shift> key while you use the Pencil tool to drag the cursor.
a. Double-click the Text tool, shown at left, and change the font to Small Fonts.
b. Select the B&W icon and select 256 Colors in the Copy from field to create a black and white icon, which LabVIEW uses for printing unless you have a color printer.
c. When the icon is complete, click the OK button. The icon appears in the upper right corner of the front panel.
11. Select File»Save to save the VI. Choose a location on your hard drive and save the VI as Thermometer.vi.
12. Select File»Close to close the VI.

End of Exercise

Exercise 3 – Using Loops
Use a while loop and a waveform chart to build a VI that demonstrates software timing.
Front Panel1. Open a new VI.2. Build the following front panel.
a. Select the horizontal pointer slide on the Controls»Numeric Controls palette and place it on the front panel. You will use the slide to change the software timing.
b. Type millisecond delay inside the label and click outside the label or click the Enter button on the toolbar, shown at left.
c. Place a Stop Button from the Controls»Buttons palette.d. Select a waveform chart on the Controls»Graph
Indicators palette and place it on the front panel. The waveform chart will display the data in real time.
e. Type Value History inside the label and click outside the label or click the Enter button.
f. The waveform chart legend labels the plot Plot 0. Use the Labeling tool to triple-click Plot 0 in the chart legend, type Value, and click outside the label or click the Enter button to relabel the legend.
g. The random number generator generates numbers between 0 and 1, in a classroom setting you could replace this with a data acquisition VI. Use the Labeling tool to double-click 10.0 in the y-axis, type 1, and click outside the label or click the Enter button to rescale the chart.
h. Change –10.0 in the y-axis to 0.i. Label the y-axis Value and the x-axis Time (sec).

Block Diagram
3. Select Window»Show Diagram to display the block diagram.
4. Enclose the two terminals in a While Loop, as shown in the following block diagram.
a. Select the While Loop on the Functions»Execution Control palette.
b. Click and drag a selection rectangle around the two terminals.
c. Use the Positioning tool to resize the loop, if necessary.
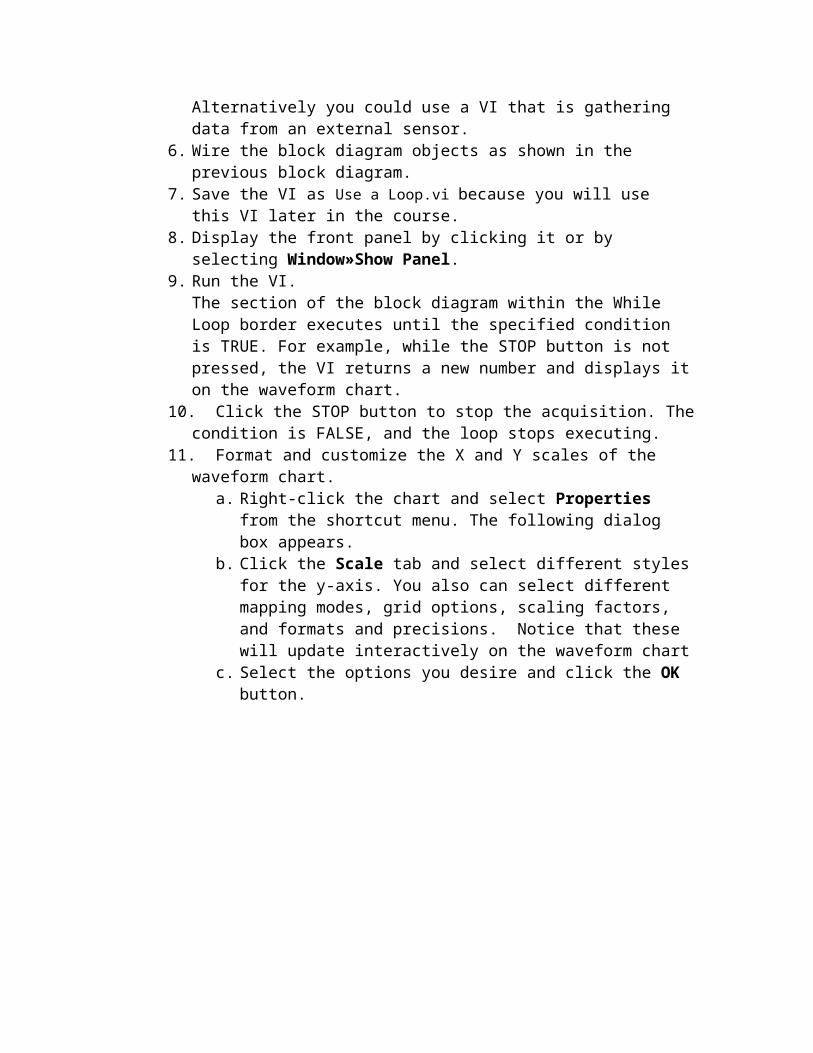
5. Select the Random Number (0-1) on the Functions»Arithmetic and Comparison»Numeric palette. Alternatively you could use a VI that is gathering data from an external sensor.
6. Wire the block diagram objects as shown in the previous block diagram.
7. Save the VI as Use a Loop.vi because you will use this VI later in the course.
8. Display the front panel by clicking it or by selecting Window»Show Panel.
9. Run the VI.The section of the block diagram within the While Loop border executes until the specified condition is TRUE. For example, while the STOP button is not pressed, the VI returns a new number and displays it on the waveform chart.
10. Click the STOP button to stop the acquisition. The condition is FALSE, and the loop stops executing.
11. Format and customize the X and Y scales of the waveform chart.

a. Right-click the chart and select Properties from the shortcut menu. The following dialog box appears.
b. Click the Scale tab and select different styles for the y-axis. You also can select different mapping modes, grid options, scaling factors, and formats and precisions. Notice that these will update interactively on the waveform chart
c. Select the options you desire and click the OK button.
12. Right-click the waveform chart and select Data Operations»Clear Chart from the shortcut menu to clear the display buffer and reset the waveform chart. If the VI is running, you can select Clear Chart from the shortcut menu.
Adding TimingWhen this VI runs, the While Loop executes as quickly as possible. Complete the following steps to take data at certain intervals, such as once every half-second, as shown in the following block diagram.
a. Place the Time Delay Express VI located on the Functions»Execution Control palette. In the dialog box that appears, insert 0.5. This function would make sure that each iteration occurs every half-second (500 ms).
b. Divide the millisecond delay by 1000 to get time in seconds. Connect the output of the divide function to the Delay Time (s) input of the Time Delay Express VI. This will allow you to adjust the speed of the execution from the pointer slide on the front panel.
13. Save the VI, because you will use this VI later in the course.14. Run the VI.15. Try different values for the millisecond delay and run the VI
again. Notice how this effects the speed of the number generation and display.
16. Close the VI.
End of Exercise

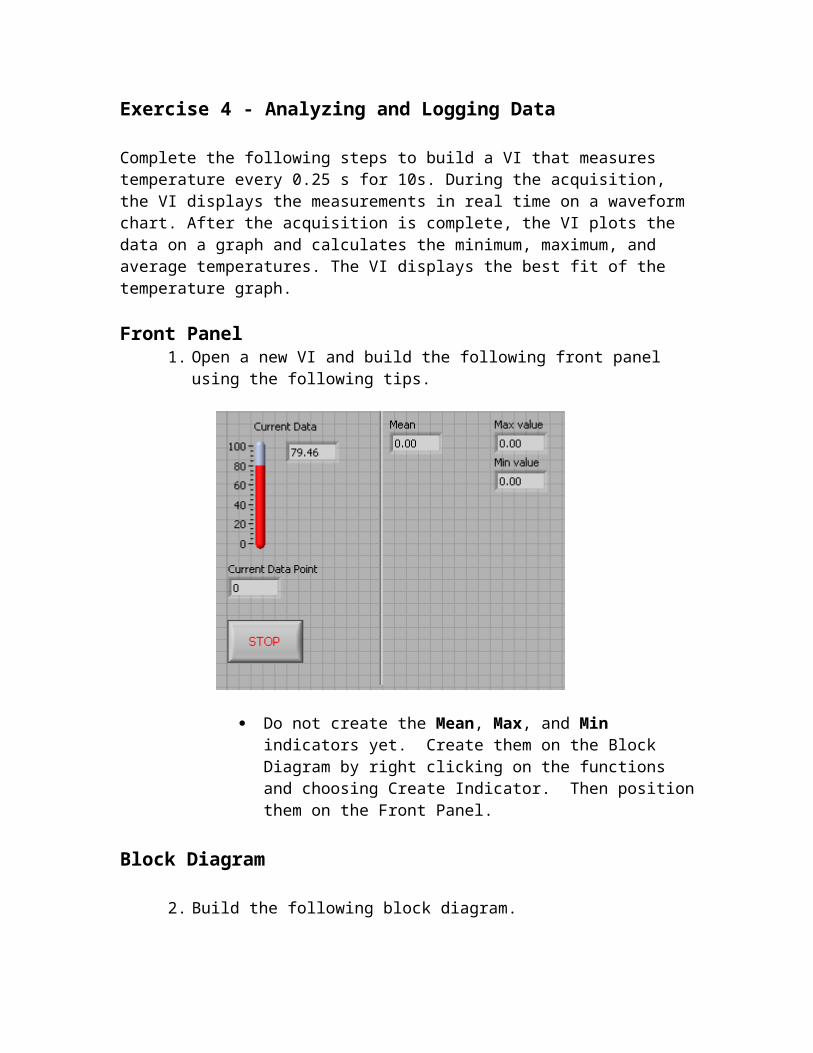
Exercise 4 - Analyzing and Logging Data
Complete the following steps to build a VI that measures temperature every 0.25 s for 10s. During the acquisition, the VI displays the measurements in real time on a waveform chart. After the acquisition is complete, the VI plots the data on a graph and calculates the minimum, maximum, and average temperatures. The VI displays the best fit of the temperature graph.
Front Panel1. Open a new VI and build the following front panel using the
following tips.
Do not create the Mean, Max, and Min indicators yet. Create them on the Block Diagram by right clicking on the functions and choosing Create Indicator. Then position them on the Front Panel.
Block Diagram
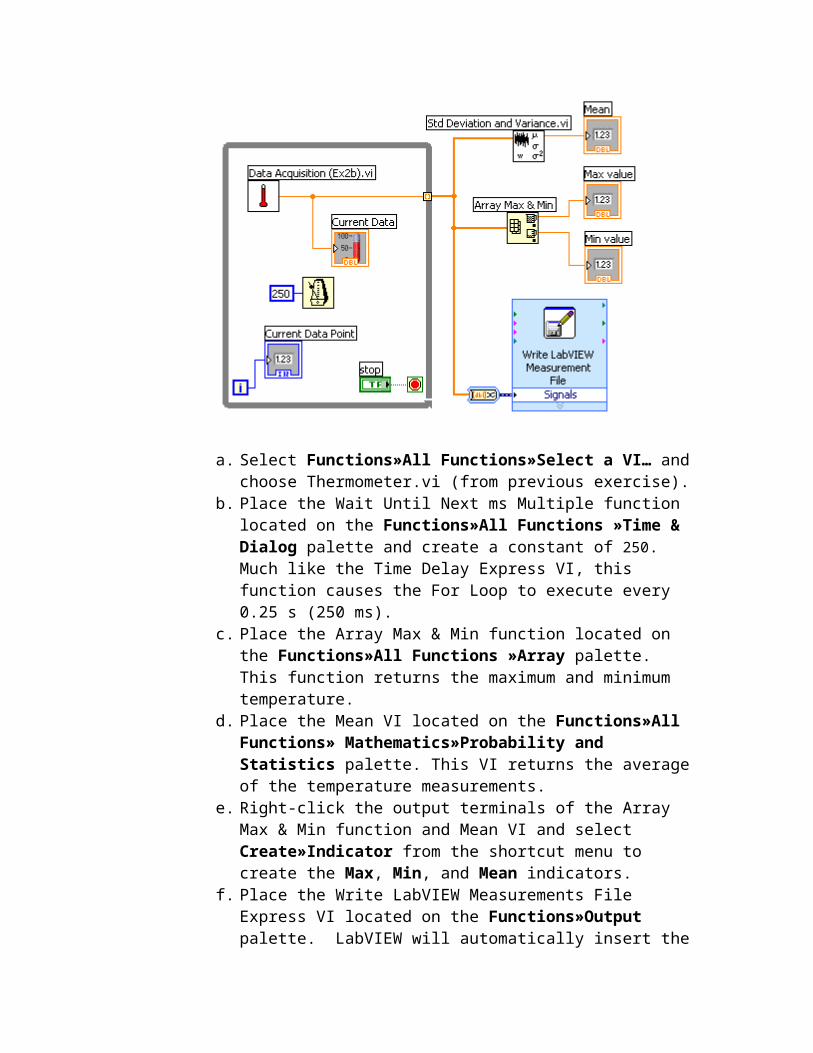
2. Build the following block diagram.

a. Select Functions»All Functions»Select a VI… and choose Thermometer.vi (from previous exercise).
b. Place the Wait Until Next ms Multiple function located on the Functions»All Functions »Time & Dialog palette and create a constant of 250. Much like the Time Delay Express VI, this function causes the For Loop to execute every 0.25 s (250 ms).
c. Place the Array Max & Min function located on the Functions»All Functions »Array palette. This function returns the maximum and minimum temperature.
d. Place the Mean VI located on the Functions»All Functions» Mathematics»Probability and Statistics palette. This VI returns the average of the temperature measurements.
e. Right-click the output terminals of the Array Max & Min function and Mean VI and select Create»Indicator from the shortcut menu to create the Max, Min, and Mean indicators.
f. Place the Write LabVIEW Measurements File Express VI located on the Functions»Output palette. LabVIEW will automatically insert the From DDT function into the wire you connect to the Signals input.
3. Save the VI as Temperature Logger.vi.4. Display the front panel and run the VI.5. After pressing STOP a dialog box will appear. Enter the name of the file to save the spreadsheet.
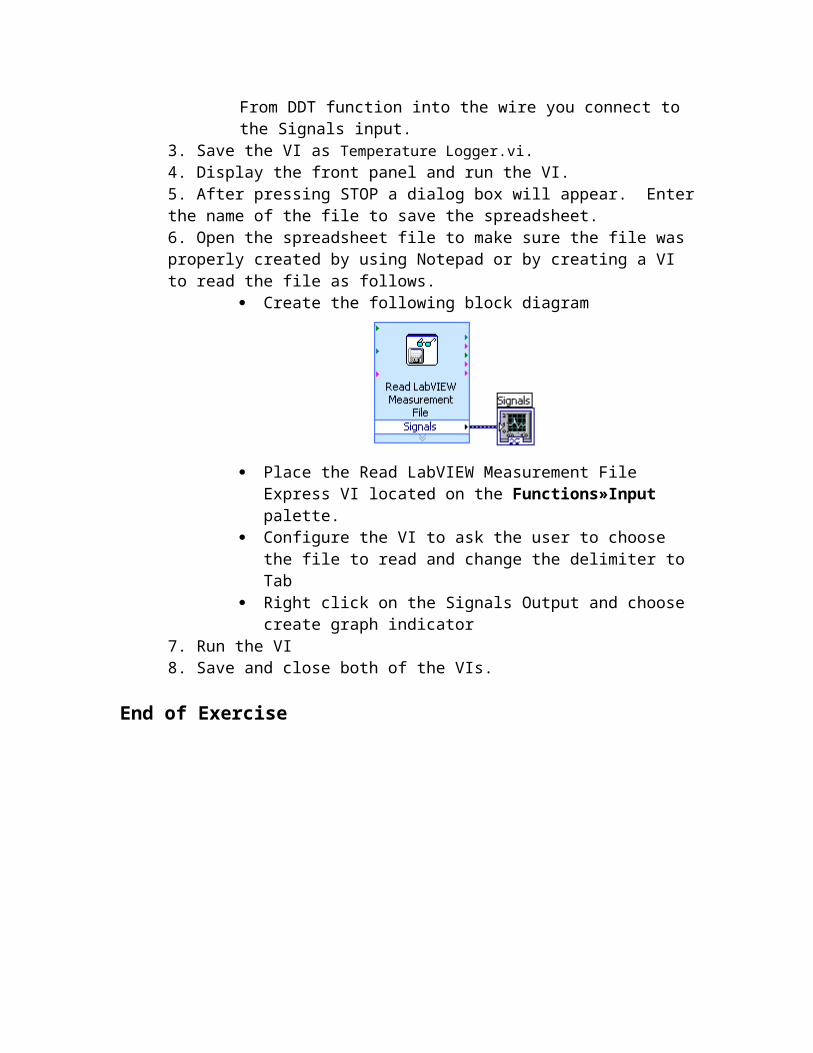
6. Open the spreadsheet file to make sure the file was properly created by using Notepad or by creating a VI to read the file as follows.
Create the following block diagram
Place the Read LabVIEW Measurement File Express VI located on the Functions»Input palette.
Configure the VI to ask the user to choose the file to read and change the delimiter to Tab
Right click on the Signals Output and choose create graph indicator
7. Run the VI8. Save and close both of the VIs.
End of Exercise
Exercise 5 - Using Waveform Graphs
Front Panel1. Open a new VI and build the following front panel using the following tips.
a. Create a waveform graph indicator from the Controls»Graph Indicators palette. Use the position/size/select tool to move the plot legend to the side, and expand it to display two plots. Use the labeling tool to change the plot names and the properties page to choose different colors for your plots.
b. Place a Stop button on the front panel.c. Place two vertical pointer slides from the Controls»Numeric
Controls palette. Use the properties page again to change the slide fill color.
Block Diagram
2. Build the following block diagram.
a. Place a While Loop from Functions»Execution Control palette.
b. Place a Wait Until Next ms Multiple from Functions»All Functions »Time & Dialog and create a constant with a value of 100.
c. Place two Simulate Signal Express VIs from the Functions»Input and leave the Signal type as Sine for the first Simulate Signal VI and change the Signal Type to Square for the second VI. Wire both of the outputs into the waveform graph. A Merge Signals function will automatically be inserted.
d. Expand the Simulate Signal Express VIs to show another Input/Output. By default, error out should appear. Change this to Frequency by clicking on error out and choosing Frequency.
3. Save the VI as Multiplot Graph.vi.
4. Display the front panel and run the VI.
5. Save and close the VI.
End of Exercise

Exercise 6 - Error Clusters & Handling
Front Panel1. Open a new VI and build the following front panel using the
following tips.
a. Create a numeric control and change the Label to Square Root Input. Create a numeric indicator for Square Root.
b. Place Error In 3D.ctl from Controls»All Controls»Arrays & Clusters.
c. Place Error Out 3D.ctl from Controls» All Controls»Arrays & Clusters.
Block Diagram
2. Build the following block diagram.
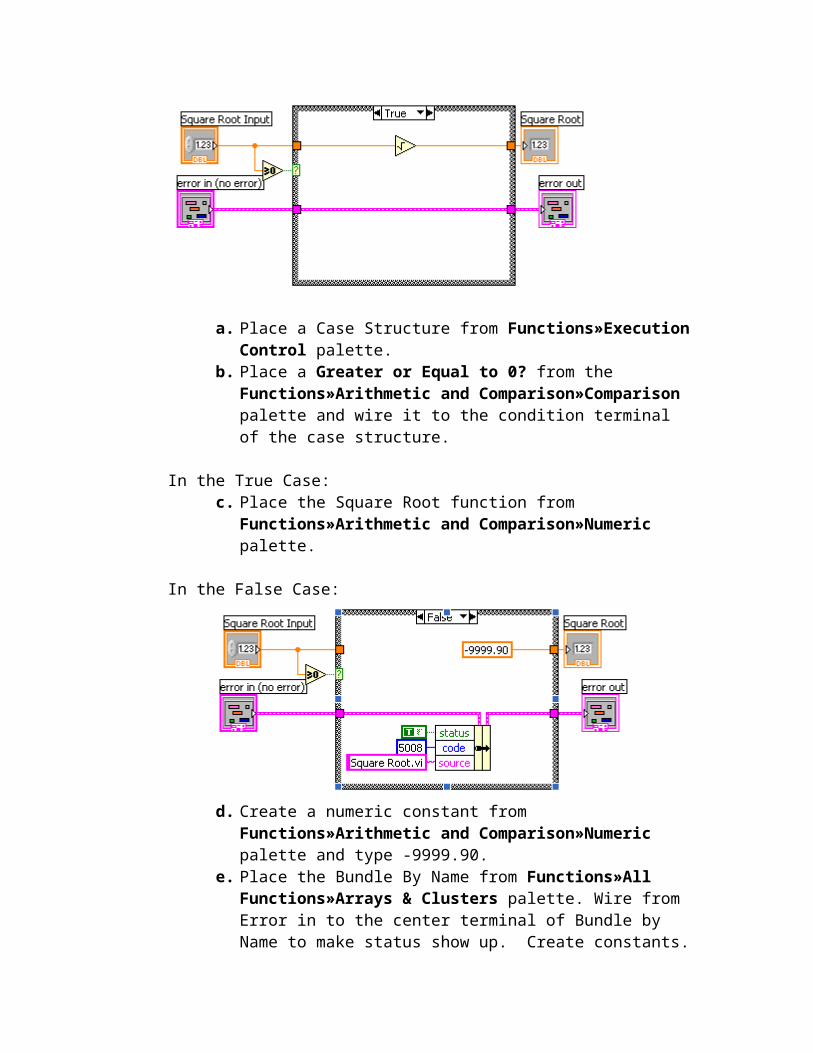
a. Place a Case Structure from Functions»Execution Control palette.

b. Place a Greater or Equal to 0? from the Functions»Arithmetic and Comparison»Comparison palette and wire it to the condition terminal of the case structure.
In the True Case:c. Place the Square Root function from
Functions»Arithmetic and Comparison»Numeric palette.
In the False Case:
d. Create a numeric constant from Functions»Arithmetic and Comparison»Numeric palette and type -9999.90.
e. Place the Bundle By Name from Functions»All Functions»Arrays & Clusters palette. Wire from Error in to the center terminal of Bundle by Name to make status show up. Create constants. Wire from the Error Out indicator to the output of Bundle By name.
3. Save the VI as Square Root.vi.4. Display the front panel and run the VI.5. Save and close the VI.
End of Exercise

Exercise 7 - Simple State Machine
Create a VI using state machine architecture that simulates a simple test sequence. The VI will have an initial state, where it will display a pop-up message indicating that it is starting the test. Then it will proceed to the next case and then to the final state where it will ask the user whether to start over or end the test.
Front PanelRather than start from scratch, we will use a VI template to create our state machine.
1. From the initial LabVIEW screen click on New…, and choose Standard State Machine, which is located under the VI from Template » Frameworks » Design Patterns heading.
2. Examine the template, and then save it in another directory before you begin working on it.
Block Diagram
3. Right click on the enum constant labeled Next State and select Open Type Def.
4. On the front panel of the StateMachinesStates.ctl Type Def VI, right click on the States enum control and choose Edit Items.
5. Add two more states. Call them “State 1” and “State 2”
6. Close the State Machines.ctl Type Def Front panel and save the control with the default name when prompted.
7. Right click on the Case Selector Label of the case structure and choose Duplicate case. Do this one additional time so that there are four cases: Initialize, State 1, State 2, and Stop.
8. Change the value connected to the Wait function to 2000.
9. Right click on the shift register on the left side of the while loop and create an indicator. Change it’s name to “Current State”.

10. In the “Initialize”, Default case place a One Button Dialog function and wire a string constant into the Message input. Type “Now beginning test…” into the string constant.
11. Change the enum constant labled Next State to “State 1”.12. Change to the next state in the case structure (“State 1”)
and change the enum constant labled Next State to “State 2”.13. Change to the next state (“State2”) and add the following
code.a. Place a Select function and connect two enum constants(Tip: Copy the enum constants from one of the previous cases)b. Place a Two Button Dialog and wire create the constants
as illustrated below.
14. Run the VI.15. Save and close the VI.
End of Exercise
