open capstone poster template - college of … · brigitte marshall-pérez & dhania...
TRANSCRIPT
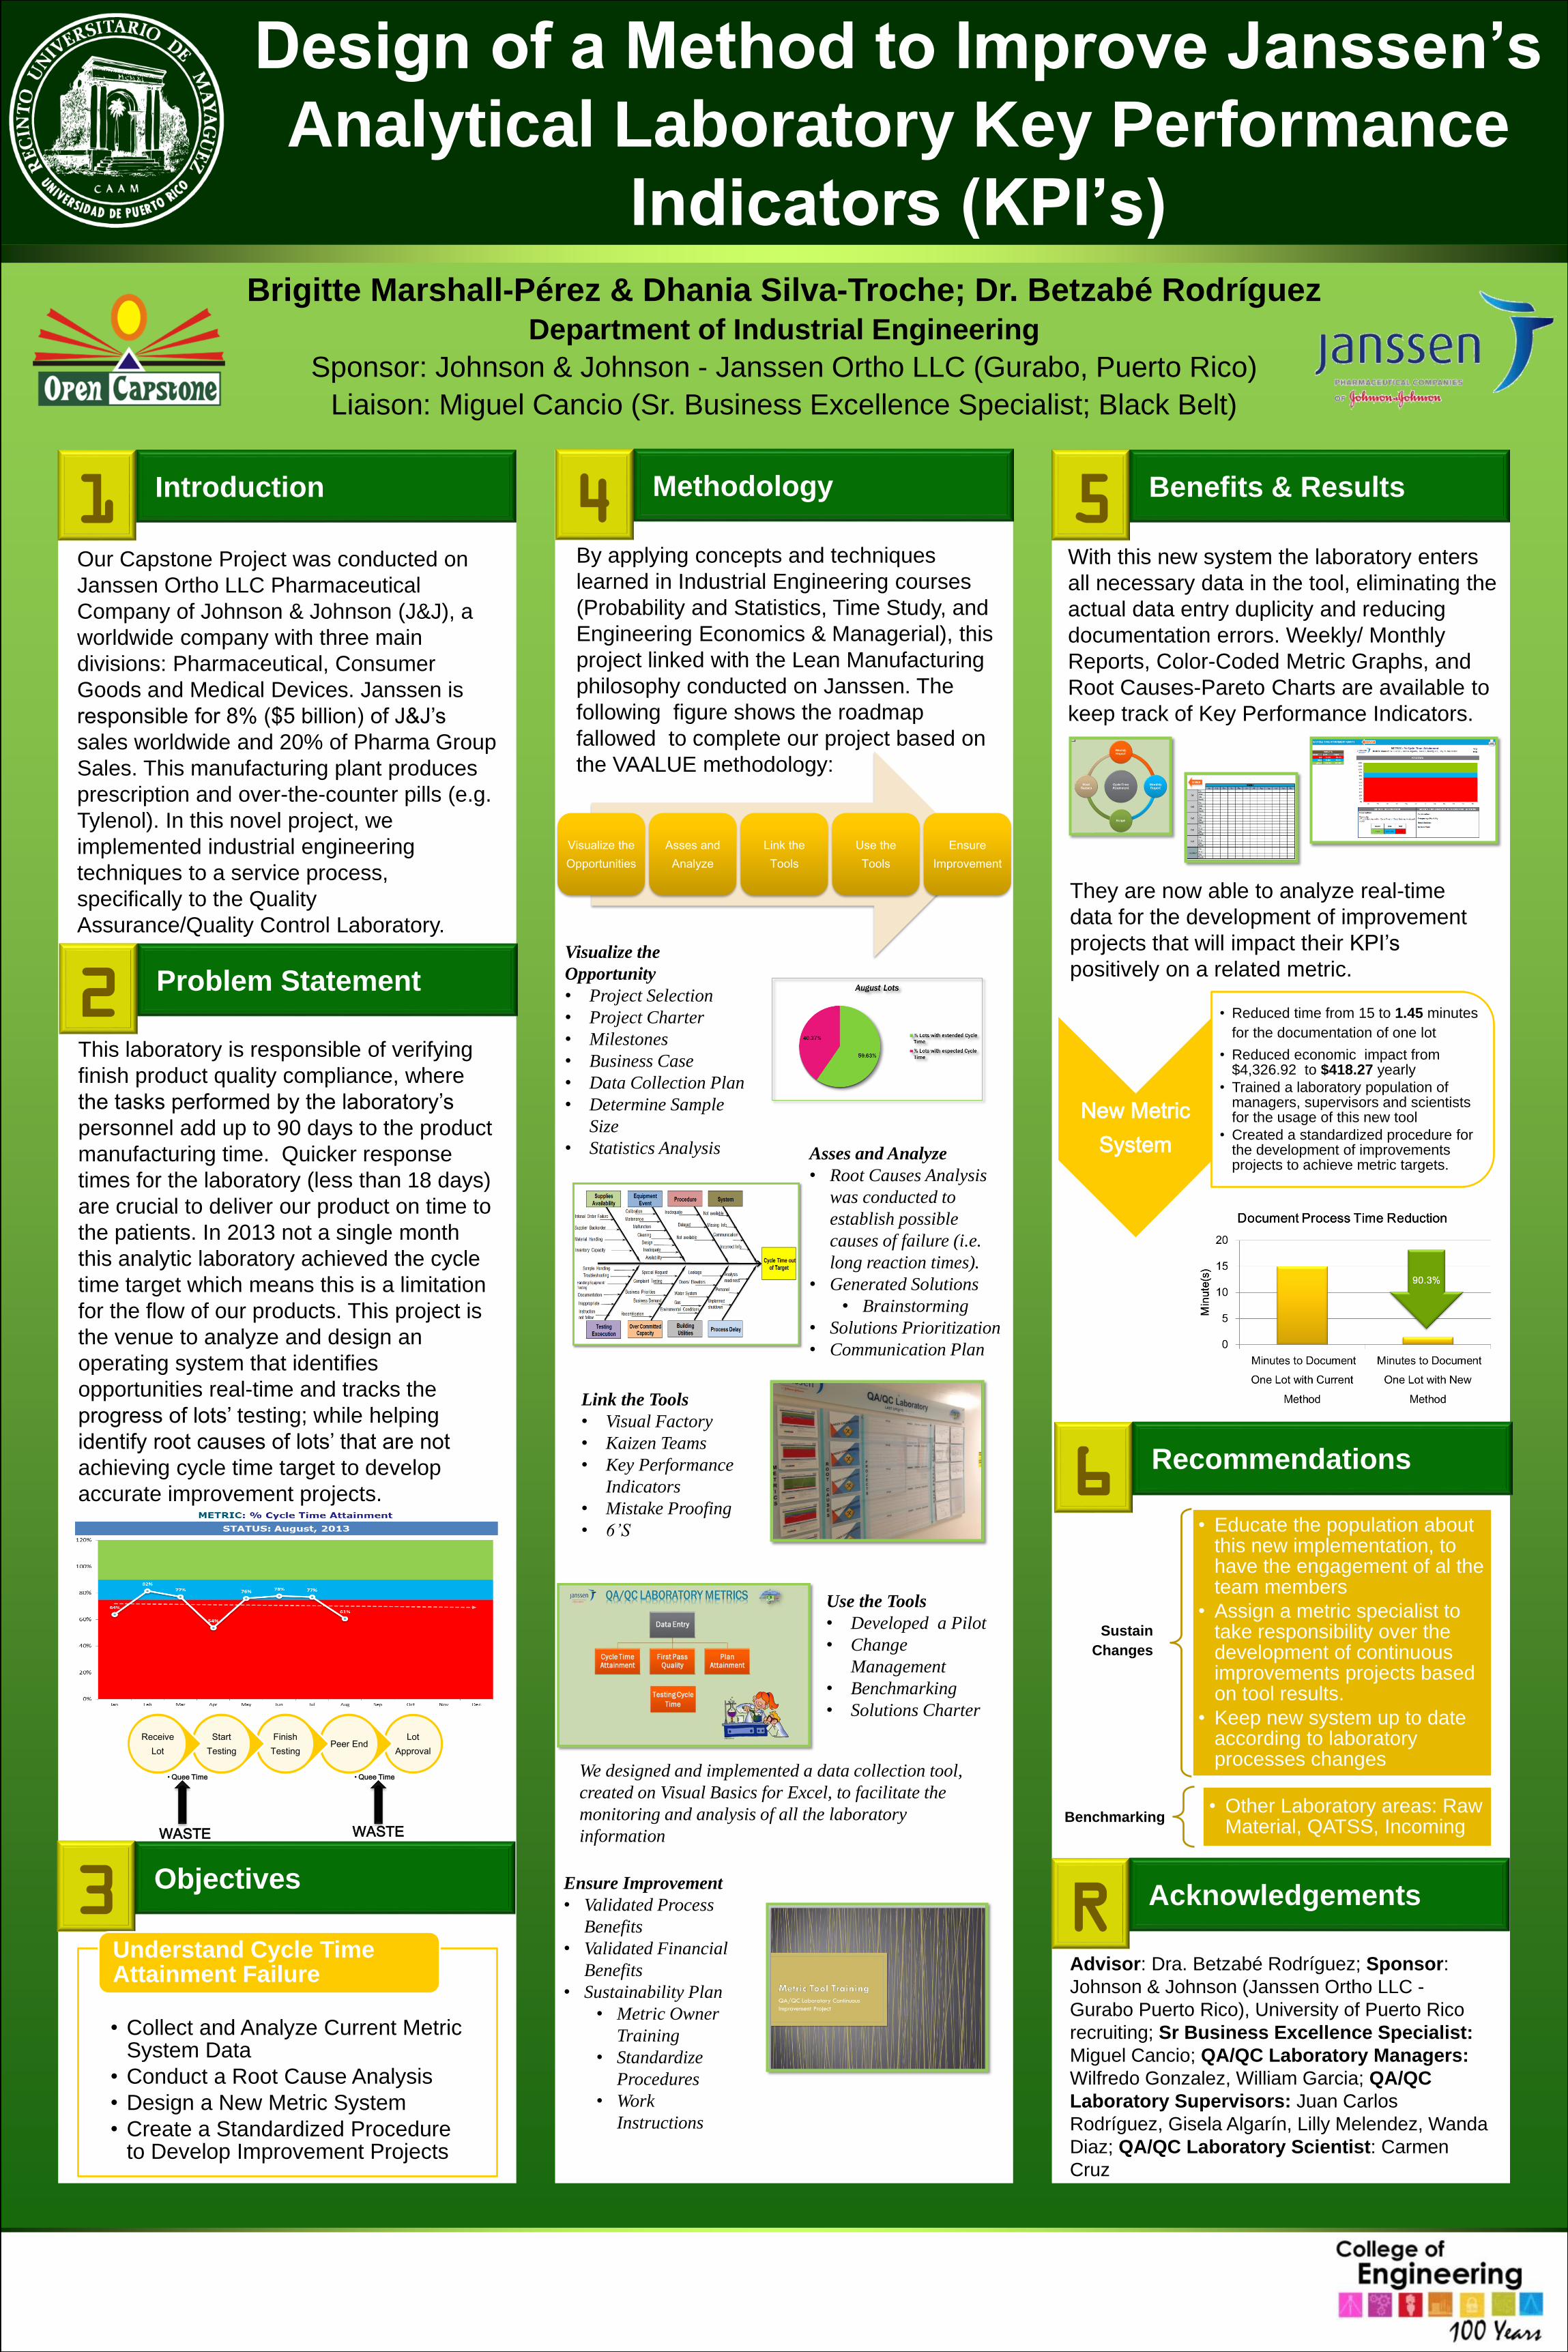
Brigitte Marshall-Pérez & Dhania Silva-Troche; Dr. Betzabé Rodríguez
Department of Industrial Engineering
Sponsor: Johnson & Johnson - Janssen Ortho LLC (Gurabo, Puerto Rico)
Liaison: Miguel Cancio (Sr. Business Excellence Specialist; Black Belt)
Our Capstone Project was conducted on
Janssen Ortho LLC Pharmaceutical
Company of Johnson & Johnson (J&J), a
worldwide company with three main
divisions: Pharmaceutical, Consumer
Goods and Medical Devices. Janssen is
responsible for 8% ($5 billion) of J&J’s
sales worldwide and 20% of Pharma Group
Sales. This manufacturing plant produces
prescription and over-the-counter pills (e.g.
Tylenol). In this novel project, we
implemented industrial engineering
techniques to a service process,
specifically to the Quality
Assurance/Quality Control Laboratory.
This laboratory is responsible of verifying
finish product quality compliance, where
the tasks performed by the laboratory’s
personnel add up to 90 days to the product
manufacturing time. Quicker response
times for the laboratory (less than 18 days)
are crucial to deliver our product on time to
the patients. In 2013 not a single month
this analytic laboratory achieved the cycle
time target which means this is a limitation
for the flow of our products. This project is
the venue to analyze and design an
operating system that identifies
opportunities real-time and tracks the
progress of lots’ testing; while helping
identify root causes of lots’ that are not
achieving cycle time target to develop
accurate improvement projects.
We designed and implemented a data collection tool,
created on Visual Basics for Excel, to facilitate the
monitoring and analysis of all the laboratory
information
Asses and Analyze
• Root Causes Analysis
was conducted to
establish possible
causes of failure (i.e.
long reaction times).
• Generated Solutions
• Brainstorming
• Solutions Prioritization
• Communication Plan
With this new system the laboratory enters
all necessary data in the tool, eliminating the
actual data entry duplicity and reducing
documentation errors. Weekly/ Monthly
Reports, Color-Coded Metric Graphs, and
Root Causes-Pareto Charts are available to
keep track of Key Performance Indicators.
Introduction1 Benefits & Results5
Design of a Method to Improve Janssen’s
Analytical Laboratory Key Performance
Indicators (KPI’s)
Problem Statement2
Objectives3
Methodology4
Recommendations6
AcknowledgementsR
• Collect and Analyze Current Metric System Data
• Conduct a Root Cause Analysis
• Design a New Metric System
• Create a Standardized Procedure to Develop Improvement Projects
Understand Cycle Time Attainment Failure
Lot
ApprovalPeer End
• Quee Time
Finish
Testing
Start
Testing
Receive
Lot
• Quee Time
WASTE WASTE
By applying concepts and techniques
learned in Industrial Engineering courses
(Probability and Statistics, Time Study, and
Engineering Economics & Managerial), this
project linked with the Lean Manufacturing
philosophy conducted on Janssen. The
following figure shows the roadmap
fallowed to complete our project based on
the VAALUE methodology:
Visualize the
Opportunities
Asses and
Analyze
Link the
Tools
Use the
Tools
Ensure
Improvement
They are now able to analyze real-time
data for the development of improvement
projects that will impact their KPI’s
positively on a related metric.
New Metric
System
• Reduced time from 15 to 1.45 minutes
for the documentation of one lot
• Reduced economic impact from $4,326.92 to $418.27 yearly
• Trained a laboratory population of managers, supervisors and scientists for the usage of this new tool
• Created a standardized procedure for the development of improvements projects to achieve metric targets.
Advisor: Dra. Betzabé Rodríguez; Sponsor:
Johnson & Johnson (Janssen Ortho LLC -
Gurabo Puerto Rico), University of Puerto Rico
recruiting; Sr Business Excellence Specialist:
Miguel Cancio; QA/QC Laboratory Managers:
Wilfredo Gonzalez, William Garcia; QA/QC
Laboratory Supervisors: Juan Carlos
Rodríguez, Gisela Algarín, Lilly Melendez, Wanda
Diaz; QA/QC Laboratory Scientist: Carmen
Cruz
Sustain
Changes
• Educate the population about this new implementation, to have the engagement of al the team members
• Assign a metric specialist to take responsibility over the development of continuous improvements projects based on tool results.
• Keep new system up to date according to laboratory processes changes
Benchmarking• Other Laboratory areas: Raw
Material, QATSS, Incoming
Visualize the
Opportunity
• Project Selection
• Project Charter
• Milestones
• Business Case
• Data Collection Plan
• Determine Sample
Size
• Statistics Analysis
Link the Tools
• Visual Factory
• Kaizen Teams
• Key Performance
Indicators
• Mistake Proofing
• 6’S
Use the Tools
• Developed a Pilot
• Change
Management
• Benchmarking
• Solutions Charter
Ensure Improvement
• Validated Process
Benefits
• Validated Financial
Benefits
• Sustainability Plan
• Metric Owner
Training
• Standardize
Procedures
• Work
Instructions