open research onlineoro.open.ac.uk/18537/1/aa12398-09.pdf · 6 macquarie university, sydney,...
TRANSCRIPT

Open Research OnlineThe Open University’s repository of research publicationsand other research outputs
RAVE spectroscopy of luminous blue variables in theLarge Magellanic CloudJournal ItemHow to cite:
Munari, U.; Siviero, A.; Bienayme, O.; Binney, J.; Bland-Hawthorn, J.; Campbell, R.; Freeman, K. C.; Gibson,B.; Gilmore, G.; Grebel, E.; Helmi, A.; Navarro, J.; Parker, Q.; Reid, W.; Seabroke, G.; Siebert, A.; Steinmetz, M.;Watson, F.; Williams, M.; Wyse, R. and Zwitter, T. (2009). RAVE spectroscopy of luminous blue variables in theLarge Magellanic Cloud. Astronomy & Astrophysics, 503 pp. 511–520.
For guidance on citations see FAQs.
c© 2009 ESO
Version: Version of Record
Link(s) to article on publisher’s website:http://dx.doi.org/doi:10.1051/0004-6361/200912398
Copyright and Moral Rights for the articles on this site are retained by the individual authors and/or other copyrightowners. For more information on Open Research Online’s data policy on reuse of materials please consult the policiespage.
oro.open.ac.uk

A&A 503, 511–520 (2009)DOI: 10.1051/0004-6361/200912398c! ESO 2009
Astronomy&
Astrophysics
RAVE spectroscopy of luminous blue variables in the LargeMagellanic Cloud
U. Munari1, A. Siviero1 ,5, O. Bienaymé2, J. Binney3, J. Bland-Hawthorn4, R. Campbell5,6, K. C. Freeman7,J. P. Fulbright8, B. K. Gibson9, G. Gilmore10, E. K. Grebel11, A. Helmi12, J. F. Navarro13, Q. A. Parker6, W. Reid6,G. M. Seabroke10 ,14, A. Siebert2 ,5, M. Steinmetz5, F. G. Watson15, M. Williams5,7, R. F. G. Wyse8, and T. Zwitter16
1 INAF Osservatorio Astronomico di Padova, Asiago, Italye-mail: [email protected]
2 Observatoire de Strasbourg, Strasbourg, France3 Rudolf Pierls Center for Theoretical Physics, University of Oxford, UK4 Institute of Astronomy, School of Physics, University of Sydney, Australia5 Astrophysikalisches Institut Potsdam, Potsdam, Germany6 Macquarie University, Sydney, Australia7 RSAA Australian National University, Camberra, Australia8 Johns Hopkins University, Baltimore, Maryland, USA9 Jeremiah Horrocks Institute for Astrophysics & Super-computing, University of Central Lancashire, Preston, UK
10 Institute of Astronomy, University of Cambridge, UK11 Astronomisches Rechen-Institut, Zentrum für Astronomie der Universität Heidelberg, Heidelberg, Germany12 Kapteyn Astronomical Institute, University of Groningen, Groningen, The Netherlands13 University of Victoria, Victoria, Canada14 e2v Centre for Electronic Imaging, Planetary and Space Sciences Research Institute, The Open University, Milton Keynes, UK15 Anglo-Australian Observatory, Sydney, Australia16 Faculty of Mathematics and Physics, University of Ljubljana, Ljubljana, Slovenia
Received 28 April 2009 / Accepted 2 June 2009
ABSTRACT
Context. The RAVE spectroscopic survey for galactic structure and evolution obtains 8400–8800 Å spectra at 7500 resolving powerat the UK Schmidt Telescope using the 6dF multi-fiber positioner. More than 300 000 9 " IC " 12 and |b| # 25$ southern stars havebeen observed to date.Aims. This paper presents the first intrinsic examination of stellar spectra from the RAVE survey, aimed at evaluating their diagnosticpotential for peculiar stars and at contributing to the general understanding of luminous blue variables (LBVs).Methods. We used the multi-epoch spectra for all seven LBVs observed, between 2005 and 2008, in the Large Magellanic Cloud(LMC) by the RAVE survey.Results. We demonstrate that RAVE spectra possess significant diagnostic potential when applied to peculiar stars and, in particular,LBVs. The behaviour of the radial velocities for both emission and absorption lines, and the spectral changes between outburst andquiescence states are described and found to agree with evidence gathered at more conventional wavelengths. The wind outflowsignatures and their variability are investigated, with multi-components detected in S Doradus. Photoionisation modelling of the richemission line spectrum of R 127 shows evidence of a massive detached ionised shell that was ejected during the 1982–2000 outburst.Surface inhomogeneities in the nuclear-processed material, brought to the surface by heavy mass loss, could have been observedin S Doradus, even if alternative explanations are possible. We also detect the transition from quiescence to outburst state in R 71.Finally, our spectrum of R 84 o!ers one of the clearest views of its cool companion.
Key words. stars: emission-line, Be – stars: winds, outflows – stars: Wolf-Rayet – galaxies: Magellanic Clouds – surveys
1. Introduction
RAVE (RAdial Velocity Experiment) is an ongoing digital spec-troscopic survey of stars in the magnitude interval 9 " IC " 12,distributed over the whole southern sky at galactic latitudes|b| # 25$. Spectra are recorded over the 8400–8800 Å range, at aresolving power %7500, with the UK Schmidt telescope feedinglight to a spectrograph via the 6-degree Field (6dF) 150 fiber po-sitioner. Via the determination of radial velocities, chemistries,temperatures, and gravities for a large number of high-latitudestars, the overarching science driver for the survey is the inves-tigation of the structure and evolution of the Milky Way. At the
time of writing, RAVE has observed over 300 000 stars, DataReleases 1 and 2 have been published (Steinmetz et al. 2006;Zwitter et al. 2008), the third is coming (Siebert et al. 2008), andscientific exploitation of the data has begun (e.g. Smith et al.2007; Siebert et al. 2008; Seabroke et al. 2008; Munari et al.2008; Veltz et al. 2008).
The essentially unbiased selection of targets guarantees thatin addition to normal stars, peculiar ones are also observed. Thetype of peculiarities most easy to recognise with RAVE spec-tra are the presence of emission lines, absorption line splittingin double-line binaries, signatures of stellar winds, and com-bination spectra. The present paper is the first to explore the
Article published by EDP Sciences
512 U. Munari et al.: RAVE spectroscopy of LBVs in LMC
Table 1. List of the LBVs observed by RAVE in the LMC, their date ofobservation and optical brightness at that time, and the radial velocitiesof the associated emission and absorption lines.
HD name obs. date V RV em. RV abs.(km s&1) (km s&1)
35343 S Dor 2005 03 20 9.55 293.0 ± 1.4 299.0 ± 0.22006 03 23 9.45 297.4 ± 1.0 266.5 ± 2.72006 09 27 9.60 298.2 ± 1.9 253.0 ± 0.5
269006 R 71 2006 03 23 10.70 199 ± 11 186.7 ± 2.12006 09 27 10.65 193.4 ± 2.4 205.4 ± 2.22008 02 04 9.95 197.5 ± 5.9 157.7 ± 2.6
269445 R 99 2006 03 23 11.50 289.6 ± 5.12006 09 27 11.55 288.4 ± 3.42008 02 04 11.60 289.1 ± 4.0
269929 R 143 2006 09 27 11.15 286.6 ± 2.42008 02 04 249.1 ± 2.6
269216 S 88 2005 03 20 10.40 233.8 ± 3.4269227 R 84 2006 09 27 11.80 254.2 ± 1.2269858 R 127 2006 09 27 10.40 276.5 ± 0.4
performance of RAVE in relation to the physics of peculiar stars,in particular, the Luminous Blue Variables (LBVs) of the LargeMagellanic Cloud (LMC). As part of its tiling strategy, RAVEobserved the region of sky occupied by the LMC in March 2005,March 2006, September 2006, and February 2008. As LBVs areintrinsically very luminous, and those belonging to the LMC arebrighter than the IC " 12 survey limit (indeed, many possess anHD identifier), they naturally enter the RAVE target set. A list ofthe LBVs observed by RAVE in the LMC is given in Table 1.
LBVs were first identified in M31 and M33 by Hubble &Sandage (1953) as extremely luminous hot stars that underwentirregular photometric variability of modest amplitude (a fewmag) over timescales of years. Their bolometric magnitude gen-erally exceeds &9.5, corresponding to a luminosity of the order%106 L', close to their Eddington Limit. During quiescence, theLBVs obey a tight temperature-luminosity relation, calibratedas log L/L' = 1.37 log Te!&0.03 by van Genderen (2001). Theexistence of such a relation, their extreme intrinsic brightnessand easy identification (the latter provided by their variability),make LBVs important players in the cosmic distance laddergame (e.g. Davidson et al. 1989). The LBVs are sometimes alsocalled Hubble-Sandage variables or S Dor variables from thearchetype of the class, and are believed to be the immediate pro-genitor of Wolf-Rayet stars of the classic N-type (nitrogen richand hydrogen poor). The LBV phase is not particularly long-lasting (%0.025 Myr) and, together with the paucity of massivestars, accounts for the relative rarity of LBVs (Crowther 2007).The number of recognised LBVs di!ers from author-to-author,ranging from 20 to 50 throughout the entire Local Group (e.g.van Genderen 2001; Weis 2003). The most famous LBVs in-clude ! Car and P Cyg, in the Galaxy, and S Dor in the LMC.
After the main sequence phase, the most massive stars do notevolve all the way to the reddest part of the HR diagram but in-stead enter a phase of very high mass loss (10&4&10&5 M' yr&1)and reverse their evolution back toward hotter e!ective tem-peratures, becoming LBVs. The position of this turning pointdepends upon the star’s luminosity and sets what is called theHumphreys-Davidson Limit (cf. Humphreys & Davidson 1994).The LBVs lay to the hotter side of this Te! limit, which maybe crossed during eruptive events of the most massive objects.
The evolutionary sequence leading to the formation of LBVs de-pends on the mass of the progenitor. For stars more massive than75 M' it is O ( WN(H-rich)( LBV ( WN(H-poor)( WC( SNIc, while for those of initial mass 40 " M " 75 M' itis O ( LBV ( WN(H-poor) ( WC ( SNIc (cf. Crowther2007, and references therein). Direct spectroscopic evidencefor LBV progenitors transitioning to supernovae is being ob-tained (eg. SN 2005gj – Trundle et al. 2008). Only lower-massO-type stars can experience a red supergiant phase just be-fore or after the LBV phase (Szeifert et al. 1996; Smith et al.2004), their evolutionary sequence being O ( LBV/RSG (WN(H-poor) ( SNIb (where RSG = Red Supergiant). This issupported by the simultaneous presence of LBVs and RSGs ob-served in Westerlund 1, the most massive young open cluster ofour Galaxy, with 1 ) 105 M' total mass and "25 M' turn-o!mass (Clark et al. 2005). To the best of our knowledge, this si-multaneity is not known to occur elsewhere.
The large amount of mass lost during the LBV phase is thecritical stage that a very massive star must pass through beforebecoming a WR star. Mass ejection via major outbursts is farmore e"cient than that via steady winds, as most notably un-dergone by ! Car during the 19th century when the star shedseveral M' in less than a decade (Smith & Owocki 2006). Themass lost by the central LBV star frequently gives rise to cir-cumstellar nebulae (e.g. Langer et al. 1999; Weis 2003) that turnout to be enriched in processed material, such as nitrogen andhelium, coming from the stellar interior.
During the quiescent phase, the optical spectra of LBVs arecharacterised by e!ective temperatures ranging from 12 000 to30 000 K (B-spectral types) and strong emission lines of hydro-gen, HeI, FeII, CaII and other singly ionised metals, often withP-Cygni profiles when observed at su"ciently high resolution(cf. Kenyon & Gallagher 1985). The mass loss rate in quies-cence is smaller and the wind faster. While not well-understoodan LBV occasionally passes through an “outburst” phase, dur-ing which the luminosity remains the same as in quiescence,while in tandem the mass loss rate increases and the wind ve-locity decreases. This pushes outward the pseudo-photosphere,with a consequent increase in the e!ective radius and decreasein the surface temperature (whose Wien peak moves from theultraviolet toward the optical region). At outburst maximum,the e!ective temperature is %7500–8500 K regardless of theLBV luminosity and temperature in quiescence, and the spec-trum turns to that of A-type supergiants, while [FeII], HeI emis-sion lines, and P-Cygni absorptions weaken or disappear. Wolf(1989; see Vink 2008, for an update) pointed out the existence ofan amplitude-luminosity relation for LBV eruptions and calledS Doradus instability strip the region of the HR diagram oc-cupied by LBVs in quiescence. Stothers & Chin (1995) sug-gested the existence of a period-luminosity relation of the formMbol = &12.5(±0.5)+2.4(±0.5) logP where P, expressed in yrs,is the typical interval from one eruption to the next.
2. RAVE Spectra of the LBVs
The spectra that RAVE collected for the LBVs in the LMC arepresented in Figs. 1–3, where the ordinate scale is kept constantfor an easier inter-comparison. Di!erences in S/N among themulti-epoch spectra of the same star are mainly due to di!er-ences in the throughputs of di!erent fibers and in the sky condi-tions. The radial velocities derived from the absorption and emis-sion lines are given in Table 1 (for comparison, the heliocentricbarycentric velocity of the LMC is +278 km s&1, Mateo 1998,

U. Munari et al.: RAVE spectroscopy of LBVs in LMC 513
Fig. 1. Multi-epoch RAVE spectra of S Doradus. Paschen and NI (multiplets 1 and 8) absorption lines are indicated by comb markings.
Fig. 2. Multi-epoch RAVE spectra of R 99 and R 71.
although significantly variable across the face of the galaxy).Table 1 also lists the V-magnitude at the time of the RAVE ob-servation as estimated by consulting various databases of vari-able star amateur observers (AAVSO, VSNET, VSOLJ) and theASAS Survey database (Pojmanski 2002).
These observations indicate that the RAVE spectra are wellsuited to detect and study peculiar stars, and LBVs in particu-lar, confirming early investigations in this wavelength interval by
Munari (1999, 2002, 2003). The peculiarities stands out well interms of absorption features, wind outflow signatures, and emis-sion lines, and will now be considered in turn.
2.1. Emission lines
The ionised circumstellar gas is easily revealed by the richemission line spectrum observable over the RAVE wavelength
514 U. Munari et al.: RAVE spectroscopy of LBVs in LMC
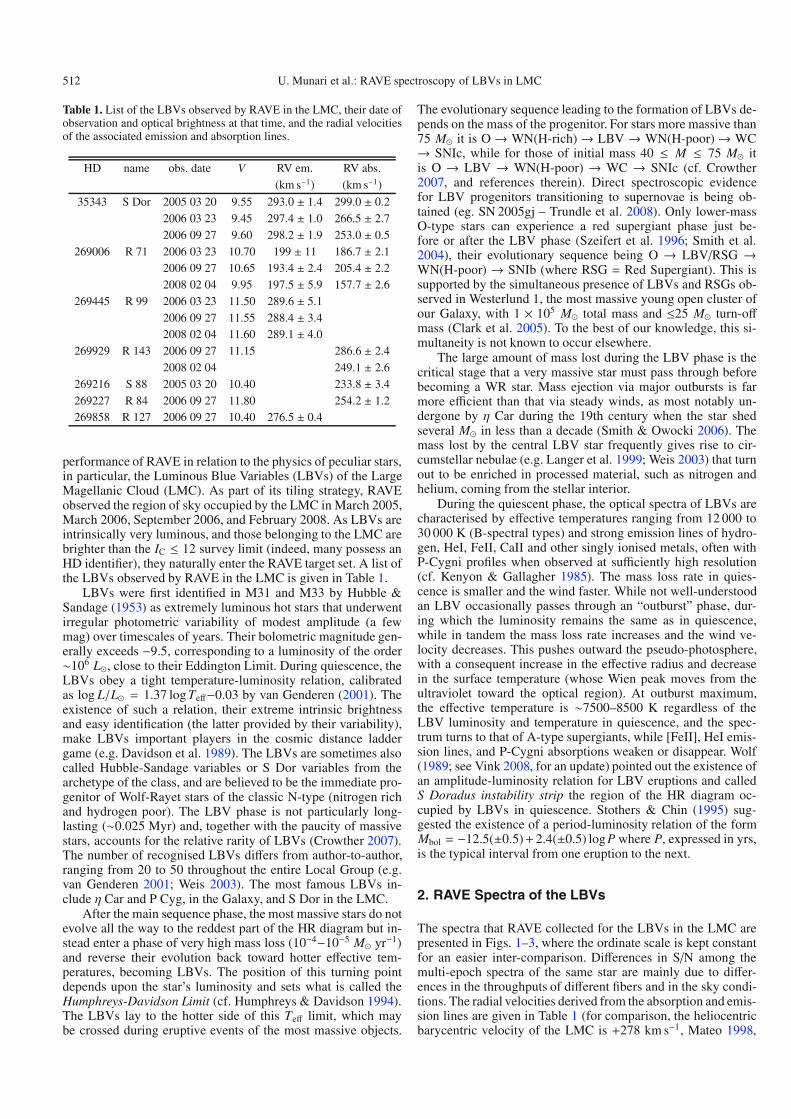
Fig. 3. RAVE spectra of R 127, S 88, R 84, and R 143.
regime. The principal ions contributing emission lines at thesewavelengths are HI, HeI, CaII, NI, CII, CIII, OI, SI, [FeII], FeII,FeIII, [ClII], and [ClIII]. The emission lines identified and mea-sured in the LBV RAVE spectra of Figs. 1–3 are listed in Table 2.They all belong either to OI, NI, [FeII], HeI, CaII or to thePaschen series of hydrogen.
The emission lines in RAVE spectra of LBVs are fairly“sharp”. The expansion velocity derived from the width of theprofiles (corrected for the FWHM(PSF) = 40 km s&1 instru-mental resolution) is on average 25 km s&1, which is the sameas obtained from observations at more classical optical wave-lengths (Weis 2003). The only exception is R 99 (cf. Fig. 2),whose expansion velocity from Paschen lines in RAVE spectrais %90 km s&1, comparable to the Balmer line-based results ofNota et al. (1996).
The intensity of the OI 8446 emission line can be boostedby fluorescence pumping from absorption of hydrogen Lyman-" photons by OI in its ground state, as first pointed out byBowen (1947). For the Lyman-" fluorescence to be e!ective,the optical depth in H# should be large, owing to the popula-tion of the n = 2 level by trapped Lyman-# photons. Such afluorescence pumping is at work in R 127 (cf. Fig. 3), but notin R 99 (cf. Fig. 2), as derived by comparing the intensity ofOI 8446 emission with that of the Paschen series of hydrogen,following Strittmatter et al. (1977) analytical modelling of thepumping mechanism.
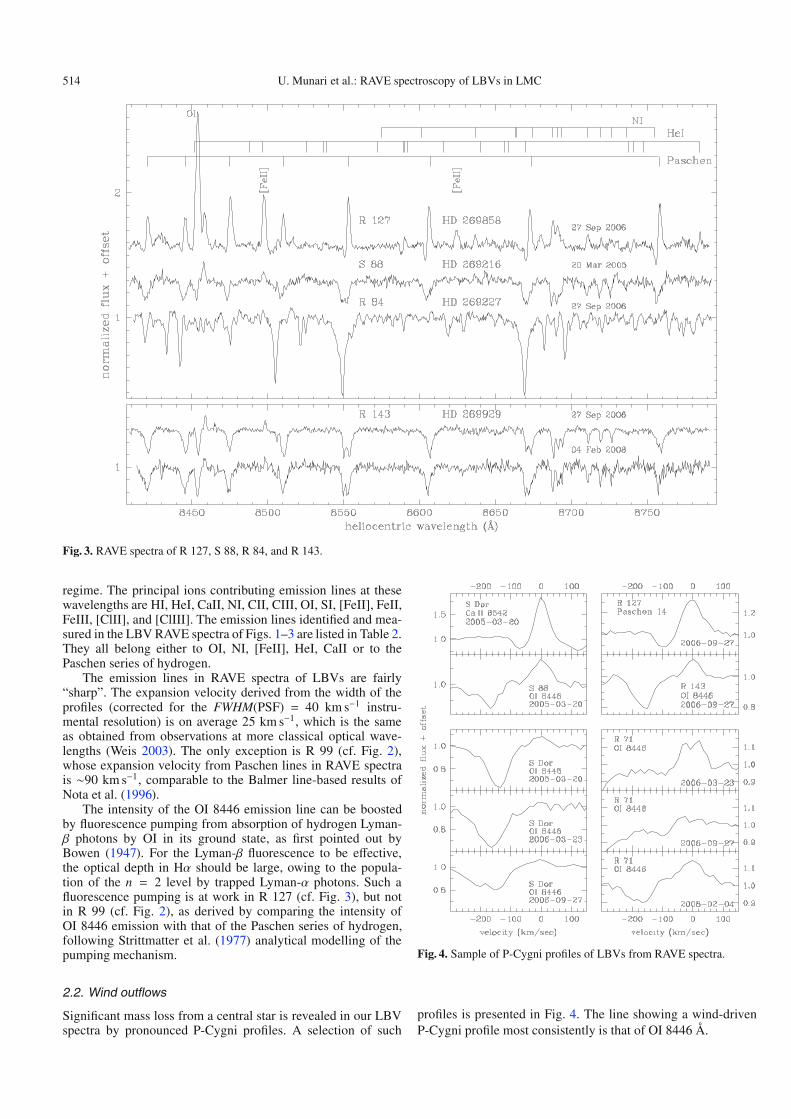
2.2. Wind outflows
Significant mass loss from a central star is revealed in our LBVspectra by pronounced P-Cygni profiles. A selection of such
Fig. 4. Sample of P-Cygni profiles of LBVs from RAVE spectra.
profiles is presented in Fig. 4. The line showing a wind-drivenP-Cygni profile most consistently is that of OI 8446 Å.

U. Munari et al.: RAVE spectroscopy of LBVs in LMC 515
Table 2. Equivalent width of the emission lines identified and measuredin the RAVE spectra of LBVs in the LMC.
$o(Å) Ion Equivalent width (Å)R 99 R 127 S Dor
(27-09-06) (27-09-06) (20-03-05)
8413 P-19 0.974 0.5568438 P-18 1.167 0.6068446 [OI] 0.216 3.445 0.1488451 ? 0.8258467 P-17 1.270 1.0578490 [FeII] 0.156 1.0238498 CaII 0.7348502 P-16
!"#"$1.613 0.460
8518 HeI 0.0808531 HeI 0.098 0.1078542 CaII 1.1388545 P-15
!"#"$2.065 0.875
8583 HeI 0.269 0.1438598 P-14 1.640 0.7258615 HeI 0.3268617 [FeII] 0.0688629 NI 0.573 0.1888636 ? 0.1018662 CaII 0.9688665 P-13
!"#"$2.851 0.642
8671 HeI 0.2908680 NI 0.3928683 NI
!"""#"""$
1.377 0.4718686 NI 0.1328703 NI 0.2408712 NI 0.1268719 NI 0.0908729 NI 0.0638734 HeI 0.394 0.1228750 P-12 1.232 0.8458777 HeI 0.300 0.177
R 71 S 88 R 143(23-03-06) (20-03-05) (27-09-06)
8446 [OI] 0.369 0.242 0.1628490 [FeII] 0.160 0.1428617 [FeII] 0.743 0.053
In a P-Cygni profile, the emission component traces the sys-temic velocity (e.g. Castor & Lamers 1979), so that the blue-ward displacement of the absorption component relates to thevelocity of the wind at the position in the expanding mediumwhere the given line forms (Lamers & Cassinelli 1999). TheRAVE spectra in Fig. 4 show that the wind velocity from OIlines is slow and quite similar in each of the surveyed LBVs,ranging from 130 to 210 km s&1. These velocities closely matchthose derived from high resolution optical and ultraviolet spec-tra (e.g. Leitherer et al. 1985; Crowther & Willis 1994; Garcia-Lario et al. 1998). The RAVE spectra demonstrate that the ve-locity, intensity, and shape of the wind absorption component is
highly variable for any given object, as illustrated in Fig. 4 bythe OI profiles of S Dor and R 71 at three distinct epochs. ForR 71, the wind absorption emerged only in the outburst spectrumof 4 February 2008, contrary to the normal behaviour of LBVs.S Dor showed significant variability of the OI absorption compo-nent during a period of constant brightness. The S Dor spectrumof 27 September 2006 shows two distinct wind components, at140 and 210 km s&1. Wind absorption profiles characterised bymulti-components (variable with time) have been previously ob-served in high-resolution optical spectra of R 127 (Stahl et al.1983) and AG Car (Stahl et al. 2001), extending over the samerange of velocities detected in the RAVE spectra of S Dor.
The high variability of the absorption components ofP-Cygni profiles reflects the complexity of wind condition andstructure in massive and LBV stars. The winds of LBVs areboth aspherical and inhomogeneous, as revealed by the highlyvariable polarisation measured by Davies et al. (2005). Theamount of mass loss (in M' yr&1) in such stars relates to bothluminosity (in L') and e!ective temperatures (K) as log M =1.738 log L & 1.352 log Te! & 9.547, following the calibration ofLamers & Leitherer (1993). The wind velocity field is usuallyassumed to follow a "-type velocity law v(r) = v*(1 & R%/r)"(cf. Schmutz et al. 1991). The smaller the ", the shorter the dis-tance the wind needs to travel before reaching the terminal ve-locity. Guo & Li (2007) found that 0.5 " " " 0.7 fits the ob-servations of LBVs in quiescence, while " # 1.5 is required forbright states. Thus, in quiescent LBVs, v* is reached within avery few stellar radii, beyond which the gas density declines as&(r) = &(r$)[r$/r]2, while during bright states v* is reached onlyat a much greater distance.
A cursory inspection of the spectra of S Dor in Fig. 1 either(i) could suggest the presence of weak and variable emissioncores within Paschen absorption lines; or (ii) could indicatethat CaII emission lines appear in emission within the adjacentPaschen 13, 15, and 16 lines, with no associated true P-Cygniabsorption component. That this is not the case is illustrated byFig. 5, where a “zoomed” view is provided for one of the S Dorspectra in Fig. 1. Figure 5 clearly illustrates how the the pres-ence of weak emission cores within Paschen absorption lines isactually due to the interplay with nearby NI absorption lines,and how CaII lines do really present a P-Cygni absorption com-ponent not associated with the wings of adjacent Paschen lines.
2.3. Absorption spectrum and chemical abundances
The classification of the absorption spectrum of B-A-F stars atthe RAVE wavelengths is straightforward, as illustrated by theobserved MK spectral atlases of Munari & Tomasella (1999),Cenarro et al. (2001), le Borgne et al. (2003), Marrese et al.(2003), and Andrillat et al. (1995), as well as the LTE syntheticspectral atlas by Castelli & Munari (2001) and the atlas of non-LTE synthetic spectra of OB super-giants by Clark et al. (2005).The absorption spectra of LBVs can be classified using theseatlases, with the caveat that both markedly non-solar surfaceabundance patterns and the pseudo-photosphere being placed ina moving, partially ionised wind, can confuse the picture (seeJaschek & Jaschek 1987, for a self-consistent definition of clas-sification criteria attributes). Nevertheless, the distinction be-tween quiescent (B-type absorption spectra) and outburst states(A-type absorption spectra), as well as the signatures of type Ialuminosity class are straightforward to recognise.
Significant mass loss removes the external layers of massivestars, exposing progressively deeper internal regions and revealsthe mixing with nuclearly processed material, which manifests

516 U. Munari et al.: RAVE spectroscopy of LBVs in LMC
Fig. 5. Expanded view of the S Doradus spectrum of Fig. 1 near thePaschen 12 + NI 8747, Paschen 13 + CaII 8662, and Paschen 15 + CaII8542 features. The arrow points to the absorption component of the CaIIP-Cygni profiles.
as a depletion of hydrogen, oxygen, and carbon, and an en-hancement of helium and (especially) nitrogen (cf. Meynet &Maeder 2005). Hydrogen, helium, nitrogen, and oxygen possessstrong lines within the RAVE wavelength interval, at the e!ec-tive temperatures and gravities characterizing LBVs. Actually,multiplets 1 and 8 over the RAVE range are the strongest NIfeatures observable over the whole optical range (cf. Jaschek& Jaschek 1995). The hydrogen deficiency and nitrogen enrich-ment is quite obvious in the RAVE spectra of LBVs presented inthis paper. There is no temperature, luminosity, and metallicitycombination, for which a normal stellar atmosphere with a so-lar abundance pattern can display NI lines stronger than Paschenones as, for example, seen in the S Dor spectra of Fig. 1. Thisis both true for LTE and non-LTE synthetic spectra (Castelli &Munari 2001; Clark et al. 2005); for this to occur, it would re-quire, at the same time, both an enhancement in nitrogen anddepletion in hydrogen.
2.4. Radial velocities
Table 2 presents the radial velocities of the LBVs measuredfrom the RAVE spectra. The accuracy of the wavelength scaleof RAVE spectra is %1.0 km s&1 (Zwitter et al. 2008). The radialvelocities of emission lines for the objects with multi-epoch ob-servations are stable within a dispersion of 2.3 km s&1 for S Dor,2.4 km s&1 for R 71, and 0.5 km s&1 for R 99. This is consistentwith the long-term stability seen by Thackeray (1974) in LBVemission line radial velocities (within a few km s&1), regardlessof the phase (quiescent or outburst). Note that the observationsof R 71 in Table 2 cover both the quiescent and outburst phases.
The radial velocity of the emission lines in Table 2 are com-parable to those derived from high-resolution optical spectra
at various epochs. Wasselink (1956) derived +295 km s&1 forS Dor, Thackeray (1974) found +195 km s&1 for R 71, and Weisreported +286 km s&1 for R 99. The situation for R 127 is lessclear with a low accuracy value of +284 km s&1 claimed by Feastet al. (1960), +292±9 km s&1 by Stahl et al. (1983), +267 km s&1
by Weis (2003), and +274 ± 1 km s&1 by Stahl & Wolf (1986).The RAVE value of +276.5 ± 0.4 km s&1 lies within 2.5 km s&1
of both the mean of these four determinations (+279± 5 km s&1)and the most accurate value amongst them (+274 ± 1), againconsistent with a long-term constant value. Small di!erences invelocity of the emission component of a P Cygni profile are ex-pected when the line strength is variable.
On the contrary, the radial velocities of the absorption linesgiven in Table 2 are highly variable from epoch-to-epoch, byseveral tens of km s&1. This relates to the variable positioningof the pseudo-photosphere within the accelerating portion of theout-flowing wind, driven at least in part by instability and in-homogeneities in the mass loss rate (Davies et al. 2005). This“breathing” pseudo-photosphere is also responsible for the lowamplitude, irregular photometric variability (with timescales ofmonths to a few years) which is persistent in LBVs both in quies-cence and outburst phases. The light-curves presented by Sharov(1975), Stahl et al. (1984), Humphreys & Davidson (1994), andLamers (1995), amongst others, provide clear examples of thisrestless variability. This variability can be further appreciated bycomparing the RAVE values in Table 2 with the velocities givenby Feast et al. (1960) for S Dor (+213 km s&1), R 71 (+198),R 143 (+263) and R 84 (+262).
2.5. Photoionisation analysis
The RAVE spectrum of R 127 provides a su"cient number ofemission lines (cf. Table 2) to attempt modelling of its photoion-isation structure. To this aim, we have used the CLOUDY code(Ferland et al. 1998) to evaluate the prevailing physical condi-tions in R 127 at the time of the RAVE observations, and to as-sess the diagnostic potential of emission lines observable in theRAVE wavelength regime. Even though this exercise did provideconsistent results (as outlined below), some degree of cautionmust be exercised, as the number of emission lines observableover the restricted wavelength range of RAVE is somewhat lim-ited, and only a fraction of them is currently treated by CLOUDY(most notably, the NI and HeI lines are ignored). This type ofmodelling is best carried out by combining emission lines fromthe entire optical, ultraviolet, and infrared regimes, which pro-vides access to a larger set of emission lines from more ions andfrom a wider range of excitation conditions. Such an expandedset of input data could also allow exploration of more complex,multi-component emission environments, than the simple one-component geometry adopted here.
RAVE optical fibers have an aperture of 7 arcsec, whichcorresponds to 1.7 pc at distance of the LMC. This is largeenough to include a contribution (by unknown relative propor-tion) to the observed spectrum from the central star, its wind, theextended circumstellar nebula, any parent H II region, and anyclose optical companion (many LBVs are members of massiveand dense young stellar clusters). Concerning R 127, it is sur-rounded by a faint nebula 5 arcsec in diameter. Judging fromspatially-resolved long slit spectra presented by Weis (2003),the light from this nebula (clearly visible on HST images ob-tained through an H#+[NII] narrow-band filter) contributes anegligible fraction of the light compared with the unresolvedcentral source. Similarly, there is is no parent HII region in which

U. Munari et al.: RAVE spectroscopy of LBVs in LMC 517
Table 3. Comparison between computed and observed emission lines.Intensities are scaled to Paschen 14.
$o(Å) Ion Relative fluxobserved computed
8446 [OI] 4.75 4.738498 CaII %0 <0.018542 CaII %0 <0.018545 P-15 1.21 1.618598 P-14 1.00 1.008617 [FeII] 0.09 0.088662 CaII %0 <0.018665 P-13 0.89 1.148750 P-12 1.17 1.29
R 127 is embedded, so this is also not likely to be a problem. Theadaptive optic observations by Heydary-Malayeri et al. (2003)resolved R 127 into a dense cluster of stars, with two close op-tical companions to the LBV: one is 1 arcsec away and 5 magfainter, and the other is 3 arcsec away and 2.7 mag fainter. Thespectrum of the latter star (as presented by Heydary-Malayeriet al. 2003) is deficient in emission lines, and consequently, isnot contaminating the LBV emission line spectrum. In conclu-sion, only the ionised mass outflow from the LBV is contributingto the emission lines observed in the RAVE spectra.
Walborn et al. (1982) have reviewed the recent photomet-ric and spectroscopic history of R 127, and found it entered along-lasting outburst phase in the early-1980s, peaking in theV-band at 8.9 mag during 1988–1991, and then slowly declin-ing toward quiescence (by the time of the RAVE observationsin 2006, R 127 had reached this quiescent state). According tothe analysis of Guo & Li (2007), the wind of LBVs in quies-cence is accelerated to its terminal velocity within a few stellarradii. Therefore, the vast majority of its mass is located exter-nal to the acceleration zone and is expanding at constant ve-locity. In our modelling, we thus adopted &(r) = &(r$)[r$/r]2
for the dependence of density on distance from the central star.To be conservative, we also explored other density dependen-cies (e.g. wind accelerated to terminal velocity over significantdistances, density independent of distance from the central star),but abandoned them ultimately due to the resulting inferior re-sults. We assumed Case B nebular conditions (Osterbrock &Ferland 2006), spherical geometry with the photoionising star atthe center, and chemical homogeneity throughout the gas. Thestellar photosphere was assumed to emit as a black body. Thechemical partition was taken to be solar for all elements exceptthose allowed to vary. The initial value for the overall metallic-ity was taken to be [M/H] = –0.5. Having no observed emis-sion line from carbon, and CLOUDY not treating the He and Nlines recorded over the RAVE spectral range, we assumed (andkept fixed) their abundance to the average value found in otherLBVs – i.e., a 10) enhancement for N and 2.5) for He, and a0.2) depletion for C (cf. Crowther & Willis 1994, and referencestherein). These fixed values for He, N, and C are close to thosefound by Lamers et al. (2001) for the external, spatially resolved,nebula around R 127.
The emission lines that we used in the modelling, along withtheir observed and computed flux ratios, are shown in Table 3.The di!erence between computed and observed fluxes is %10%.This can be regarded as an excellent match, reflecting the limita-tions/capabilities of such photoionisation modelling, regardless
Table 4. Basic parameters for the central star and ionised circumstel-lar material derived by photoionisation modelling of the emission linespectrum of R 127.
T e!BB 15 000 K
RBB 140 R'LBB 9 ) 105 L' (Mbol = &10.1)rneb
in 19 R+ (13.4 AU)rneb
out 27 R+ (17.6 AU)&H
in 1.7 ) 1010 cm&3
&Hout 8.5 ) 109 cm&3
Nein 2.1 ) 1010 cm&3
Neout 8.1 ) 105 cm&3
T ein 10 750 K
T eout 2 200 K' 0.92[M/H] –0.4H/H' 0.50O/O' 0.39Fe/Fe' 1.88Ca/Ca' 2.21He/He' (2.5)N/N' (10)C/C' (0.2)
of the object under analysis (e.g. novae, planetary nebulae,galactic nuclei, etc.)
The output parameters of the modelling are given in Table 4,where ' is the filling factor (the ratio of filled-to-total volume inthe ejecta). The derived temperature, radius, and luminosity areconsistent with other modelling attempts in the literature, despitebeing based on completely di!erent sets of input data. For exam-ple, Stahl et al. (1983) derived from optical and IUE high reso-lution observations of R 127 (during the quiescence phase of theearly-1980s), Te! = 16 000 K, R = 150 R', and Mbol = &10.6.The hydrogen and oxygen under-abundances we have obtainedare similar to those found in other LBVs (Lennon et al. 1993;Crowther & Willis 1994; Venn 1997; Smith 1997), in R 127 it-self (Lamers et al. 2001), and expected by theoretical evolutionmodels of massive stars that include rotation (Meynet & Maeder2005).
The results in Table 4 indicate that the emission lines ofR 127 originate in an ionised shell detached from the centralstar, extending from 19 to 27 stellar radii. The mass within thisionised shell is:
Mshell ='
X
% rout
rin
4(r2&H(r)dr = 1.33 ) 10&3 M' (1)
where X is the hydrogen mass fraction, and &H(r) = &Hin(rin/r)2.
The existence and meaning of such a detached shell deservescomment, as fits squarely into the coherent picture emerging asa result of the full suite of data associated with R 127.
Weis (2003) and Smith et al. (1998) determined from highresolution spectra that the bulk velocity of the mass outflow dur-ing the recent outburst was %10 km s&1. Material expanding withthis velocity should have left R 127 during 2000, in order to havereached (by the time of our RAVE observations) a distance fromthe central star equal to that of the inner border of the ionisedshell in our model. It is interesting to note that the lightcurve

518 U. Munari et al.: RAVE spectroscopy of LBVs in LMC
of Walborn et al. (1982) shows R 127 started a rapid declinein brightness in 1999 that ended in 2000 when the star reachedits “stable” quiescent brightness. Thus, we argue that the end ofthe outburst in 2000 brought with it also the cessation of an en-hanced mass loss phase, producing a cavity around the star thatwas only tenuously filled by the much lighter wind characteriz-ing the subsequent quiescence conditions.
The material at the external ionisation boundary of the shell(17.6 AU), expanding at 10 km s&1, should have left R 127 2.5 yrbefore the material at the inner edge. The mass loss rate neces-sary to produce the observed shell is therefore
M =Mshell
#t= 5 ) 10&4 M'/yr (2)
This is a magnitude larger than the mass loss rate derived byStahl et al. (1983) for R 127 before the outburst. A large increasein the mass loss is a characteristic feature of LBVs during out-burst phases (Humphreys & Davidson 1994). The material lostearlier in the outburst had, by the time of the RAVE observations,moved exterior to the ionisation boundary, where the irradiationfrom the central star is no longer e!ective in ionising the gas,and therefore it was no longer contributing to the emission linespectrum.
This scenario is well matched by the spectroscopic evolutionthat Walborn et al. (1982) presents for R 127. The 1999–2000timeframe, during which the star ejected the material comprisingthe ionised shell seen in the RAVE spectra, was characterised bythe disappearance of P-Cygni absorption profiles and by the ap-pearance of very sharp emission line profiles. These are indica-tive an extended atmosphere moving outward at low velocity.Later spectra, when the significant mass loss had finished andthe detaching of the massive shell had initiated, started showinga progressive broadening of the emission lines and re-emergenceof P-Cygni profiles characteristic of a less-significant and fastermass loss regime. The winds of LBVs are line-driven, and thedrop in outward velocity and large increase in mass loss rateduring outburst phases is caused by the driving e!ect of FeIIIlines below the sonic point as the e!ective temperature decreases(Vink et al. 1999). The bifurcated wind regimes between quies-cence and outburst phases, referred to as the “bi-stability” jump(Pauldrach & Puls 1990), is a defining characteristic of the S Dorinstability strip (Vink & de Koter 2002).
3. Remarks on individual objects
3.1. S Doradus
The three RAVE spectra presented in Fig. 1 were obtained whileS Dor was stable during its outburst, at V % 9.5 mag. Muchlike the Thackeray (1965) analysis, the continuum of the RAVEspectra of S Dor can be readily classified as A2/3 Ia+e, by com-parison with the Munari & Tomasella (1999) atlas.
Quite interesting is the reversal in the ratio of equivalentwidth (REW) of hydrogen and NI absorption lines that occurredbetween 20 March 2005 and 27 September 2006 spectra (cf.Fig. 1). The ratio changed from REW = 0.7 to REW = 3.0. Thishappened at stable brightness, surface temperature, and windoutflow velocity, while the intensity of the CaII emission com-ponents increased by 1.6) between the two dates. It would betempting to interpret the reversal of REW as an indication ofchemical inhomogeneities in the nuclearly processed materialprogressively exposed at the stellar surface by the on-going sig-nificant mass loss. To support this interpretation additional and
higher resolution observations are however necessary. In fact,the observed variation in the intensity of the CaII emission linescould suggest the presence of unresolved and variable emissioncores as a (contributing) reason for the observed changes in theequivalent widths of nitrogen and hydrogen lines.
3.2. R 71
The LBV nature of R 71 was discovered by Thackeray (1974),who reported that the star oscillates between 9.8 and 10.9 mag(see also Lamers 1995) and that the corresponding spectral typesranged from A1eq to B2.5Iaep. During bright optical phases,Balmer lines show deep P-Cygni profiles and the [FeII] emis-sion lines disappear.
The first two RAVE observations of R 71 were obtainedwhen the star was in quiescence at V % 10.7, while the thirdwas during outburst, at V = 9.95. The corresponding spectralchanges in Fig. 2 bear a striking resemblance to the behaviordescribed by Thackeray (1974). The RAVE quiescence spectraare clearly those of an early B super-giant (strong HeI absorp-tion lines, no OI, and broader Paschen lines) with superimposedstrong [FeII] emission lines. The outburst spectrum is that of anearly A super-giant, where the HeI lines have disappeared andCaII and OI have appeared, along with the reinforcement of NIand the sharpening of Paschen lines. Similar to the optical spec-tra, in the outburst spectrum recorded by RAVE, the [FeII] hasnearly disappeared and OI has developed a strong P-Cygni ab-sorption component.
3.3. R 84
R 84 is an enigmatic object, suggested to be a dormant LBV byCrowther et al. (1995). Walborn (1977) classified the blue opticalspectrum as OIafpe, with many strong emission lines (includingHeII 4686) and P-Cygni profiles. Higher resolution blue opticalspectroscopy by Stahl et al. (1985) show the same characteris-tics. Breysacher et al. (1999, and references therein) summarisedthe determinations of the physical parameters obtained by vari-ous authors, which cluster around a temperature of 30 000 K, aradius of 30 R', a luminosity 6 ) 105 L' and a mass loss rate3 ) 10&4 M'/yr.
The spectral appearance at longer wavelengths is however inconflict with that at the bluest end of the optical range. TiO ab-sorption bands were observed shortward of 6000 Å by Sanduleak& Philip (1977) on objective prism plates, and by Cowley &Hutchings (1978) in slit spectra. Allen & Glass (1976) found noevidence of them in far red spectra, but reported that the MgI-btriplet could be present weakly in absorption and that the IR col-ors implied the presence of a cool super-giant. Stahl et al. (1984)noted that the IR colour excess was too large to result only froma late-type companion, and suggested the presence of dust inR 84, which was confirmed by the mid-IR observations of Glass(1984).
These apparently contradicting reports on the spectral ap-pearance support a binary or optical pair nature of R 84. Somephotometric variability of one or both component stars is theprobable cause of their brightness ratio to change with time.Schmutz et al. (1991) argued strongly in favor of the LBV andthe cool star being merely along the same line of sight and notmembers of a binary system. It should be noted that adaptiveoptic observations by Heydari-Malayeri et al. (2003), whichhave a resolution limit of 0.12 arcsec (corresponding to 6000 AU

U. Munari et al.: RAVE spectroscopy of LBVs in LMC 519
at the distance of the LMC), did not resolve the central star. Stahlet al. (1984) found a good fit to the IUE-optical-IR spectral en-ergy distribution by combining an M4Ia spectrum with a B0Iaspectrum, and with the addition of a circumstellar dust compo-nent. The spectral type of the cool super-giant was given as%M2by Cowley & Hutchings (1978).
The RAVE spectrum of R 84 in Fig. 3 presents the clearestview so far published of the cool super-giant. It has no emis-sion lines superimposed and a )2 fitting to the same Munariet al. (2005) synthetic spectral library used in the automaticanalysis of RAVE spectra suggests atmospheric parameters ofTe! = 3925 ± 155, [M/H] = &0.39 ± 0.26, log g = 2.87 ± 0.91,and a heliocentric radial velocity of 254.2 ± 1.2 km s&1. The ra-dial velocity reported by Schnurr et al. (2008) is 255 km s&1. Therelatively large errors of the )2 fitting are due to the contami-nation from the superimposed hot super-giant spectrum, whosemain e!ect is to provide an overall veiling of the absorptionlines. This has a particularly adverse e!ect on the wings of theCaII lines (most sensitive to log g), amplified by the perturbationof the shape of the adjacent continuum by the wide underlyingPaschen absorption lines of the hot component. The )2 tempera-ture would suggest a spectral type around K7, with the metallic-ity being appropriate for massive stars in the LMC.
4. Conclusions
The primary science driver for the RAVE survey is the in-vestigation of the structure and evolution of the Milky Way.Nevertheless, as a natural byproduct of the survey, the resolutionand diagnostic potential of the associated stellar spectra ensuresa valuable resource for the stellar astrophysics community.
The present paper is the first in our series to explore theperformance of RAVE in relation to the physics of peculiarstars, in particular, the Luminous Blue Variables of the LargeMagellanic Cloud. The RAVE spectra provide a clear and com-prehensive view of the LBVs, highlighting their temporal evo-lution and star-by-star di!erences. In particular, these have: (i)extended the temporal baseline and wavelength domain overwhich the radial velocities of emission lines have been observedto remain constant, which reinforces the notion of an originin a spherically symmetric component of the circumstellar en-vironment, dynamically de-coupled from the central star; (ii)mapped the large variability of the absorption lines (both inradial velocity and profiles) in response to the “breathing” ofthe pseudo-photosphere forming in the heavy, out-flowing wind;(iii) documented the high variability and multi-shell nature of thewind P-Cyg absorption profiles; (iv) provided a clear recipe ofthe spectroscopic changes characterising the transition of LBVsfrom quiescence to outburst phases and vice-versa, in a closematch to evidence gathered at more conventional (blue) opticalwavelengths; (v) o!ered the opportunity to test quantitatively thesoundness of photoionisation modelling of the rich emission linespectrum observable over the RAVE range; (vii) discovered inR 127 the presence, and quantified the physical properties of,a massive detached ionised shell which was ejected during the1982–2000 outburst.
Acknowledgements. The data were obtained as part of the RAVE survey us-ing the UK Schmidt Telescope operated by the Anglo-Australian Observatory.Funding for RAVE has been provided by: the Anglo-Australian Observatory;the Astrophysical Institute Potsdam; the Australian National University; theAustralian Research Council; the French National Research Agency; the GermanResearch foundation; the Istituto Nazionale di Astrofisica at Padova; The JohnsHopkins University; the W. M. Keck foundation; the Macquarie University;
the Netherlands Research School for Astronomy; the Natural Sciences andEngineering Research Council of Canada; the Slovenian Research Agency; theSwiss National Science Foundation; the Science & Technoeached logy FacilitiesCouncil of the UK; Opticon; Strasbourg Observatory; and the Universities ofGroningen, Heidelberg and Sydney. The RAVE web-site and associate databaseis accessible from www.rave-survey.org.
References
Allen, D. A., & Glass, I. S. 1976, ApJ, 210, 666Andrillat, Y., Jaschek, C., & Jaschek, M. 1995, A&AS, 112, 475le Borgne, J.-F., Bruzual, G., Pelló, R., et al. 2003, A&A, 402, 433Breysacher, J., Azzopardi, M., & Testor, J. 1999, A&AS, 137, 117Bowen, I. 1947, PASP, 59, 196Castelli, F., & Munari U. 2001, A&A, 366, 1003Castor, J. P., & Lamers, H. J. G. L. M. 1979, ApJS, 39, 481Cenarro, A. J., Cardiel, N., Gorgas, J., et al. 2001, MNRAS, 326, 959Clark, J. S., Negueruela, I., Crowther, P. A., Goodwin, S. P., et al. 2005, A&A,
434, 949Cowley, A. P., & Hutchings, J. B. 1978, PASP, 90, 636Crowther, P. A. 2007, ARA&A, 45, 177Crowther, P. A., & Willis, A. J. 1994, Sp. Sc. Rev., 66, 85Crowther, P. A., Hillier, D. J., & Smith, L. J. 1995, A&A, 293, 172Davidson K., Mo!at, A. F. J., & Lamers, H. J. G. L. M. 1989, ed. The Physics
of Luminous Blue Variables, IAU Coll. 113 (Kluwer)Davies, B., Oudmaijer, R. D., & Vink, J. S. 2005, A&A, 439, 1107Feast, M. W., Thackeray, A. D., Wesselink, A. J. 1960, MNRAS, 121, 337Ferland, G. J., Korista, K. T., Verner, D. A., et al. 1998, PASP, 110, 761Garcia-Lario P., Riera A., & Manchado A. 1998, A&A, 334, 1007Glass, I. S. 1984, MNRAS, 209, 759Guo, J. H., & Li, Y. 2007, ApJ, 659, 1563Heydari-Malayeri, M., Meynadier, F., Walborn, N. R., et al. 2003, A&A, 400,
923Hubble, E., & Sandage, A. 1953, ApJ, 118, 353Humphreys, R. M., & Davidson, K. 1994, PASP, 106, 1025Jaschek, C., & Jaschek, M. 1987, The Classification of Stars Stars, (Cambridge
Univ. Press)Jaschek, C., & Jaschek, M. 1995, The Behaviour of Chemical Elements in Stars,
(Cambridge Univ. Press)Kenyon, S. J., & Gallagher, J. S.-III 1985, ApJ, 290, 542Lamers, H. J. G. L. M. 1995, in Astrophysical Application of Stellar Pulsation,
ed. R. S. Stobie & P. A. Whitelock, ASPC, 83, 176Lamers, H. J. G. L. M., & Cassinelli J. P. 1999, Introduction to Stellar Winds,
Cambridge University PressLamers, H. J. G. L. M., & Leitherer, C. 1993, ApJ, 412, 771Lamers, H. J. G. L. M., Nota, A., Panagia, N., et al. 2001, ApJ, 551, 764Langer, N., Garca-Segura, G., & Mac Low, M.-M. 1999, ApJ, 520, L49Leitherer, C., Damineli Neto, A., & Schmutz, W. 1992, in Nonisotropic and
Variable Outflows from Stars, L. Drissen, C. Leitherer and A. Nota eds.,ASPC, 22, 1992
Lennon, D. J., Wobig, D., Kudritzki, R.-P., Stahl, O. 1993, Sp. Sci. Rev., 66, 207Marrese, P. M., Boschi, F., & Munari U. 2003, A&A, 406, 995Mateo, M. L. 1998, ARA&A, 36, 435Meynet, G., & Maeder, A. 2005, A&A, 429, 581Munari, U. 1998, in Proccedings of the Gaia Workshop, V. Straizys ed., BalA, 8,
73Munari, U. 2002, in Exotic Stars as Challenges to Evolution, IAU Coll. 187, ed.
C. A. Tout & W. Van Hamme, ASPC, 279, 25Munari, U. 2003, in Gaia Spectroscopy, Science and Technology, ed. U. Munari,
ASPC, 298, 227Munari, U., & Tomasella, L. 1999, A&AS, 137, 521Munari, U., Sordo, R., Castelli, F., & Zwitter, T. 2005, A&A, 442, 1127Munari, U., Tomasella, L., Fiorucci, M., et al. 2008, A&A, 488, 969Nota, A., Pasquali, A., Drissen, L., et al. 1996, ApJS, 102, 383Osterbrock, D. E., & Ferland, G. J. 2006, Astrophysics of Gaseous Nebulae and
Active Galactic Nuclei, 2nd edn., (Univ. Science Book)Pauldrach, A. W. A., & Puls, J. 1990, A&A, 237, 409Pojmanski, G. 2002, Acta Astron., 52, 397Sanduleak, N., & Philip, A. G. D. 1977, PASP, 89, 792Schmutz, W., Leitherer, C., Hubeny, I., et al. 1991, ApJ, 372, 664Schnurr, O., Mo!at, A. F. J., St-Louis, N., Morrell, N. L., Guerrero, M. A., et al.
2008, MNRAS, 389, 806Seabroke, G., Gilmore, G., Siebert, A., et al. 2008, MNRAS, 384, 11Siebert, A., Bienaymé, O., Binney, J., et al. 2008, MNRAS, 391, 793Siebert, A., et al. 2009, AJ, submittedSharov, A. S. 1975, in Variable stars and stellar evolution, (Reidel) IAU Symp,
67, 275

520 U. Munari et al.: RAVE spectroscopy of LBVs in LMC
Smith, L. 1997, in Luminous Blue Variables: Massive Stars in Transition, ed. A.Nota & H. J. G. L. M. Lamers, ASPC, 120, 310
Smith, L. J., Nota, A., Pasquali, A., et al. 1998, ApJ, 503, 278Smith, M. C., Ruchti, G. R., Helmi, A., et al. 2007, MNRAS, 379, 755Smith, N., & Owocki, S. P. 2006, ApJ, 645, L45Smith, N., Vink, J. S., & de Koter, A. 2004, ApJ, 615, 475Stahl, O., & Wolf, B. 1986, A&A, 154, 243Stahl, O., Wolf, B., Klare, G., et al. 1983, A&A, 127, 49Stahl, O., Wolf, B., Leitherer, C., et al. 1984, A&A, 140, 459Stahl, O., Wolf, B., Leitherer, C., et al. 1985, A&AS, 61, 237Stahl, O., Jankovics, I., Kovács, J., et al. 2001, A&A, 375, 54Steinmetz, M., Zwitter, T., Siebert, A., et al. 2006, AJ, 132, 1645Stothers, R. B., & Chin, C.-W. 1995, ApJ, 451, L61Strittmatter, P. A., Woolf, N. J., Thompson, R. I., et al. 1977, ApJ, 216, 23Szeifert, Th., Humphreys, R. M., Davidson, K., et al. 1996, A&A, 314, 131Thackeray, A. D. 1965, MNRAS, 129, 169
Thackeray, A. D. 1974, MNRAS, 168, 221Trundle, C., Kotak, R., Vink, J. S., et al. 2008, A&A, 483, L47van Genderen, A. M. 2001, A&A, 366, 508Veltz, L., Bienaymé, O., Freeman, K. C., et al. 2008, A&A, 480, 753Venn, K. A. 1997, in Luminous Blue Variables: Massive Stars in Transition, ed.
A. Nota & H. J. G. L. M. Lamers, ASPC, 120, 95Vink, S. J. 2008, NewAR, 52, 419Vink, J. S., & de Koter, A. 2002, A&A, 393, 543Vink, J. S., de Koter, & A., Lamers, H. J. G. L. M. 1999, A&A, 350, 181Walborn, N. R. 1977, ApJ, 215, 53Walborn, N. R., Stahl, O., Gamen, R. C., et al. 2008, ApJ, 683, L33Weis, K. 2003, A&A, 408, 205Wesselink, A. J. 1956, MNRAS, 116, 3Wolf, B. 1989, A&A, 217, 87Zwitter, T., Siebert, A., Munari, U., et al. 2008, AJ, 136, 421