open source intelligence from online social networks ... osint osn.pdf · open source intelligence...
TRANSCRIPT

Open Source Intelligence from Online Social Networks:
Identifying Insiders
Miltos Kandias, Vasilis Stavrou
September 2014
1

Open Source Intelligence from Online Social Networks:
Identifying Insiders
Miltos Kandias, Vasilis Stavrou
Information Security & Critical Infrastructure Protection LaboratoryDept. of Informatics, Athens University of Economics & Business, Greece
2
Technical Report AUEB/INFOSEC/Rev-0914/v.1.1INFOSEC Laboratory, Dept. of InformaticsAthens University of Economics & BusinessSeptember 2014

Outline
• Online Social Networks (OSN)
• Open Source Intelligence (OSINT)
• The insider threat
• Collecting and analyzing data from OSN
• Behavior prediction capabilities
Case 1: Success story - Insider detection and narcissism
Case 2: Success story - Predicting delinquent behavior
Case 3: Success story - Detecting stress levels
Case 4: Horror story - Revealing political beliefs
• Ethical and legal issues
• Conclusions3

Online Social Networks
• OSN and Web 2.0 enable users add online content.
• Content can be crawled and utilized for:
- personalized advertising,
- personalized content promotion and
- user/usage profiling
• Can content be crawled and utilized for:
- User behavior prediction?
- User psychosocial characteristics extraction?
- Proactive cyber defense?
4

Source: http://socialmediatoday.com/ 5
What happens online in 60 sec
Open Source Intelligence (OSINT)
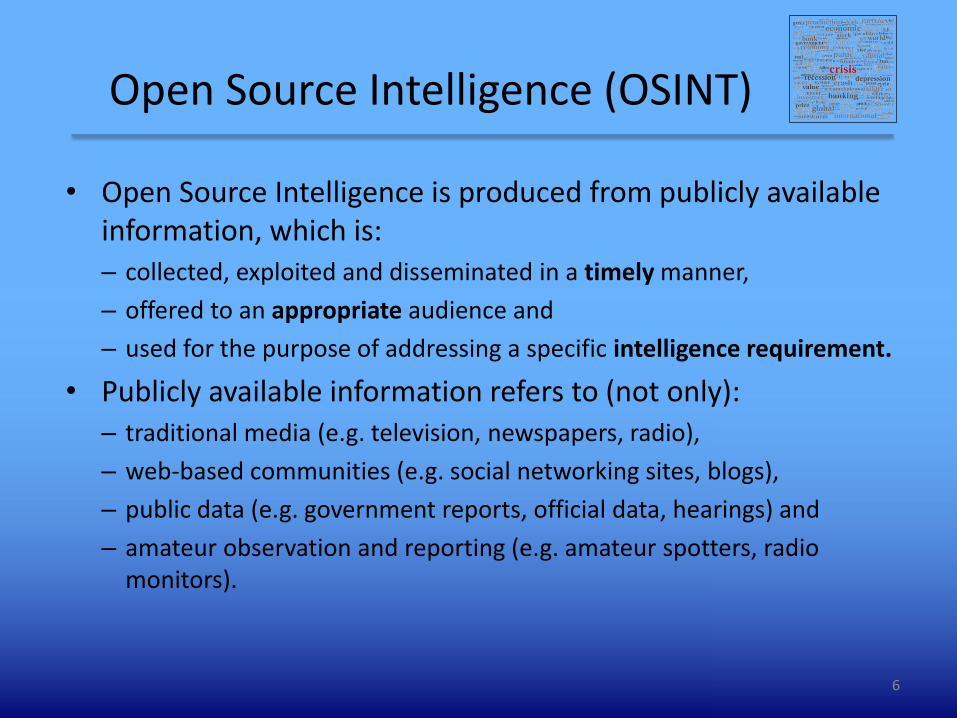
• Open Source Intelligence is produced from publicly available information, which is:– collected, exploited and disseminated in a timely manner,
– offered to an appropriate audience and
– used for the purpose of addressing a specific intelligence requirement.
• Publicly available information refers to (not only):– traditional media (e.g. television, newspapers, radio),
– web-based communities (e.g. social networking sites, blogs),
– public data (e.g. government reports, official data, hearings) and
– amateur observation and reporting (e.g. amateur spotters, radio monitors).
6
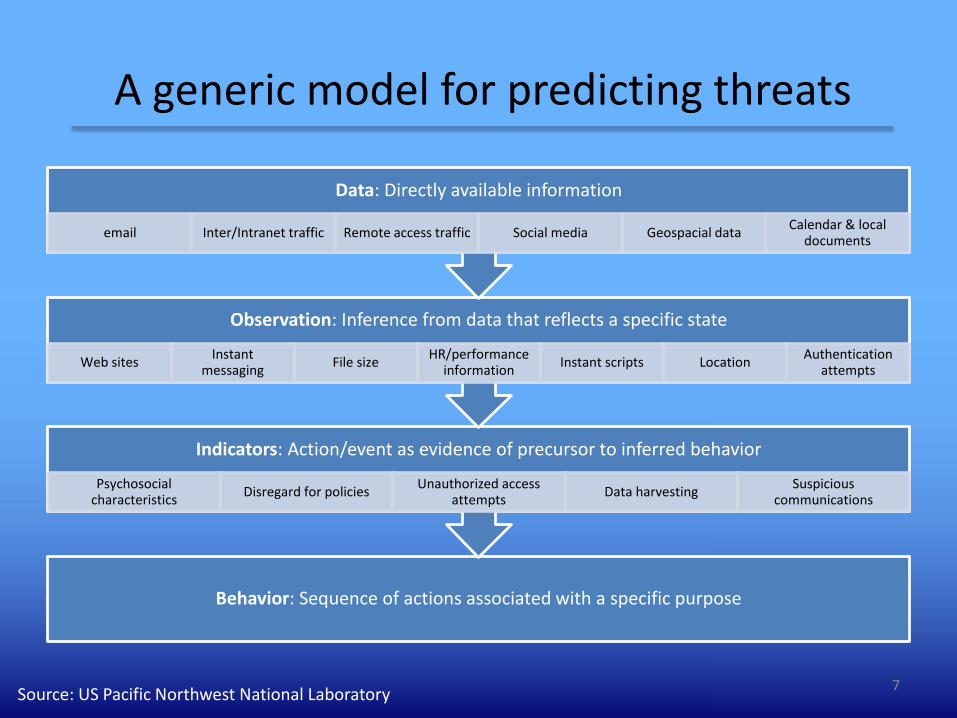
A generic model for predicting threats
Behavior: Sequence of actions associated with a specific purpose
Indicators: Action/event as evidence of precursor to inferred behavior
Psychosocial characteristics
Disregard for policiesUnauthorized access
attemptsData harvesting
Suspicious communications
Observation: Inference from data that reflects a specific state
Web sitesInstant
messagingFile size
HR/performance information
Instant scripts LocationAuthentication
attempts
Data: Directly available information
email Inter/Intranet traffic Remote access traffic Social media Geospacial dataCalendar & local
documents
Source: US Pacific Northwest National Laboratory7

Insider Threat
• Trade secrets
• Account numbers
• Social Security Numbers
• Intellectual property
Data
• Network storage
• Shared folders
• Removable devices
• Transmitted data
can leak •Competitor
•Regulator
•Unauthorized personnel
•Press or media
to outsider
•Company defamation
•Monetary expenses
•Legal liabilities
•Asset loss
•Customer relations
•End business
impact
• The insider threat is a severe problem in cyber/corparatesecurity, which originates from persons who:
- are legitimately given access rights to information systems,
- misuse privileges and
- violate security policy.
8

Insider Threat: When is its impact high?
Internal processknowledge
Technical literacy
High Low
High Highest impactInsignificant (though demonized) impact
LowPotentially significant
impactInsignificant impact
Source: Gartner Group, Report 5605 9
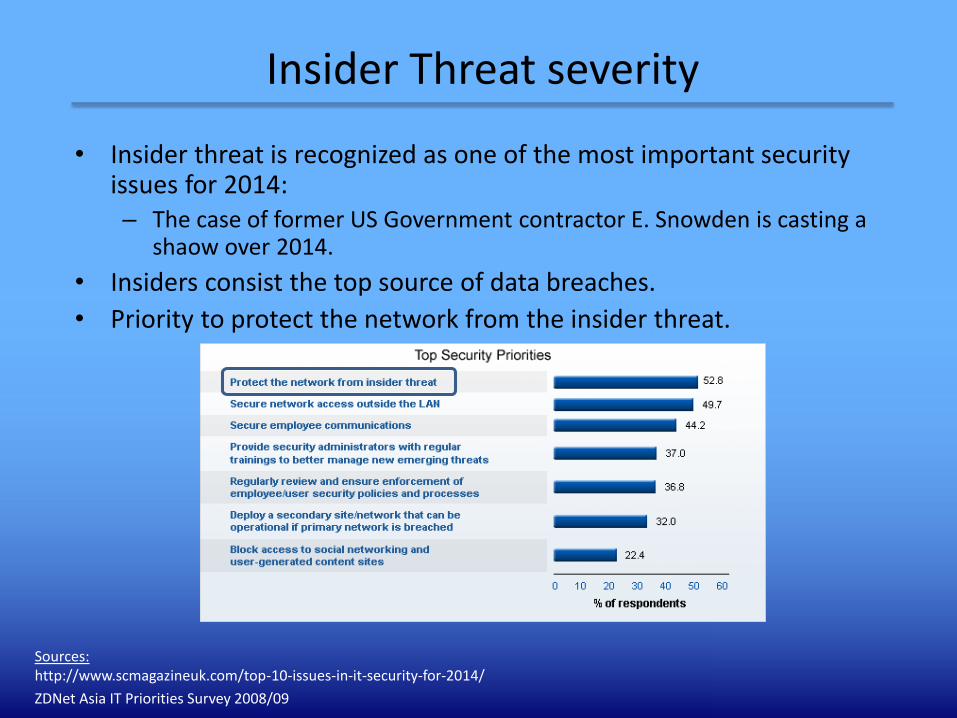
Insider Threat severity
Sources: http://www.scmagazineuk.com/top-10-issues-in-it-security-for-2014/
ZDNet Asia IT Priorities Survey 2008/09
• Insider threat is recognized as one of the most important security issues for 2014:– The case of former US Government contractor E. Snowden is casting a
shaow over 2014.
• Insiders consist the top source of data breaches.
• Priority to protect the network from the insider threat.
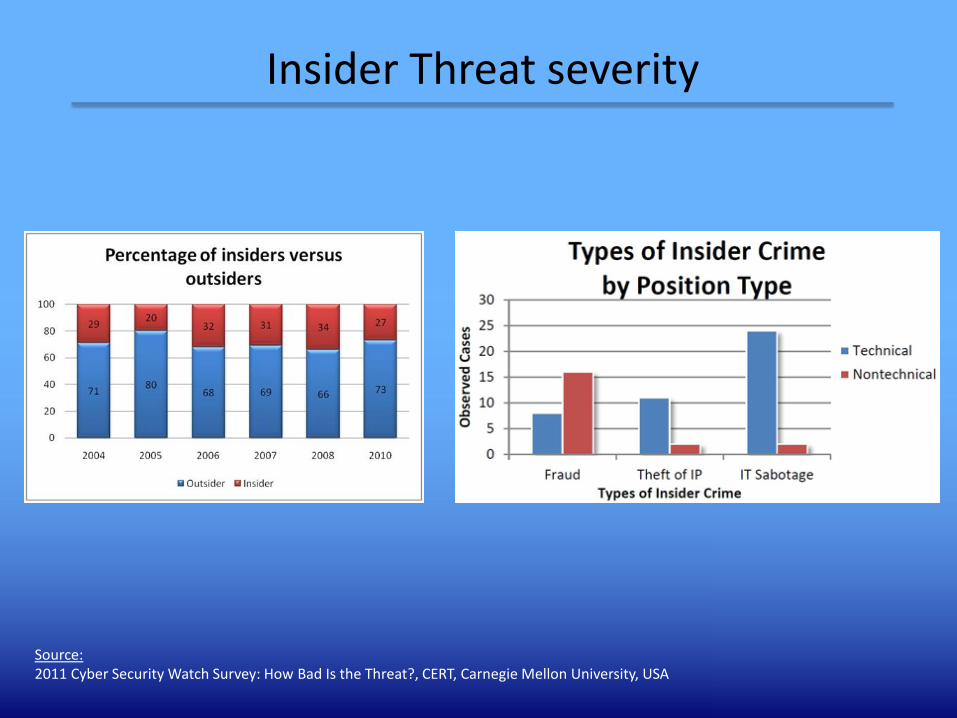
Insider Threat severity
Source: 2011 Cyber Security Watch Survey: How Bad Is the Threat?, CERT, Carnegie Mellon University, USA

Threat parameters
• We have a threat when:
– At least one attacker is adequately motivated.
–Opportunity to unleash attack exists.
– At least one vulnerability exists.
– Attacker is skilled enough.
• Given sufficient motive, time and budget every system is vulnerable.
12
Threat parameters
A threat consists of:
• Motive
• Opportunity
• Vulnerability
• Skills
13
• Malevolent user needs:
–Opportunity to unleash prepared attack.
–Motive to attack.
– Ability to overcome inhibitions.
– Appropriate stimulation and impulse.
• Under certain circumstances every user is vulnerable to diverge towards delinquency.
Malevolent user characteristics
14
Malevolent user characteristics
Malevolent user requirem’s:
• Opportunity
• Motive
• Ability to overcome inhibitions
• Stimulus/impulse
15

• Insiders’ characteristics:– Inward turning, – resistance to the fulfillment of individual will,– turn to ICT to change moods (anxiety, depression etc.), – lack a strong and stiff code of ethics,– lack faithful adherence to government, leader or cause,– narcissism,– lack capacity to recognize emotions and– negative predisposition towards authorities, laws,
government, state.
Source: Shaw E., Ruby K., Post J., “The insider threat to information systems: The psychology of the dangerous insider”, Security Awareness Bulletin, Vol. 98, No. 2, pp. 1-10, 1998.
Personal factors (Shaw)
16
Personal factors (Shaw)
Personal factors
• Introversion
• Social and personal frustrations
• Computer dependency
• Ethical “flexibility”
• Reduced loyalty
• Entitlement – Narcissism
• Lack of empathy
• Predisposition towards law enforcement
17

• According to the FBI most insiders share:– desire to possess wealth,– vanity and narcissism - anger and revenge syndrome,– problematic attitude towards coworkers, – divided loyalty,– urge to feel sudden quiver of excitement or emotion,– ability to overcome inhibitions,– narcissistic behavior,– Establishment in the favor or good graces of others, – self destructive tendencies and– problems with relatives.
Source: FBI, 2012. The Insider Threat: An introduction to detecting and deterring an insider spy.
Personal factors (FBI)
18
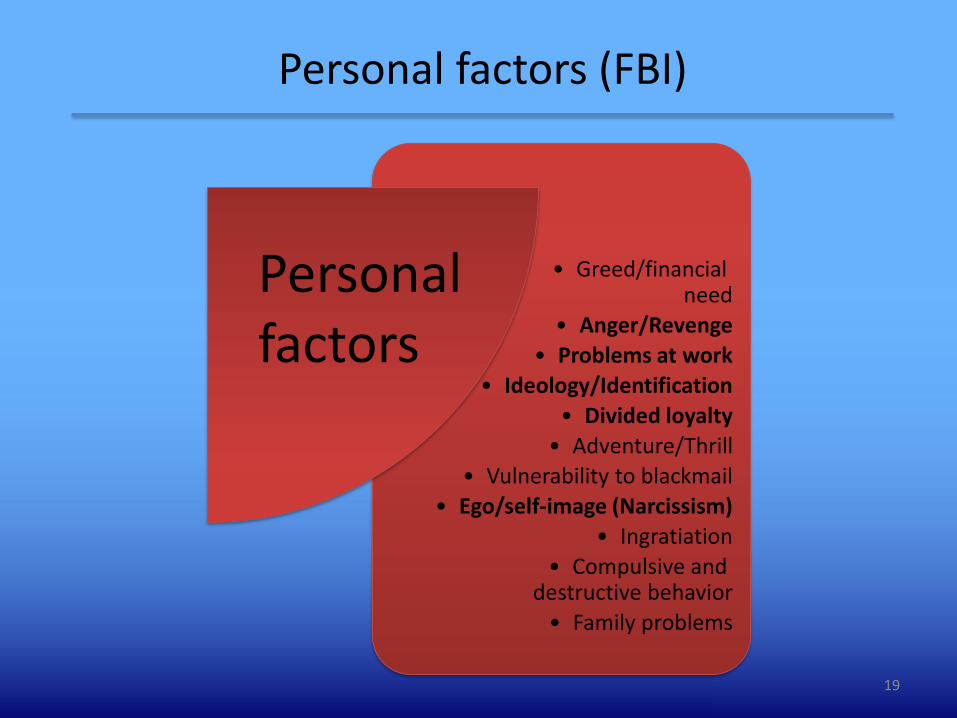
Personal factors (FBI)
Personal factors
• Greed/financial need
• Anger/Revenge
• Problems at work
• Ideology/Identification
• Divided loyalty
• Adventure/Thrill
• Vulnerability to blackmail
• Ego/self-image (Narcissism)
• Ingratiation
• Compulsive and destructive behavior
• Family problems
19
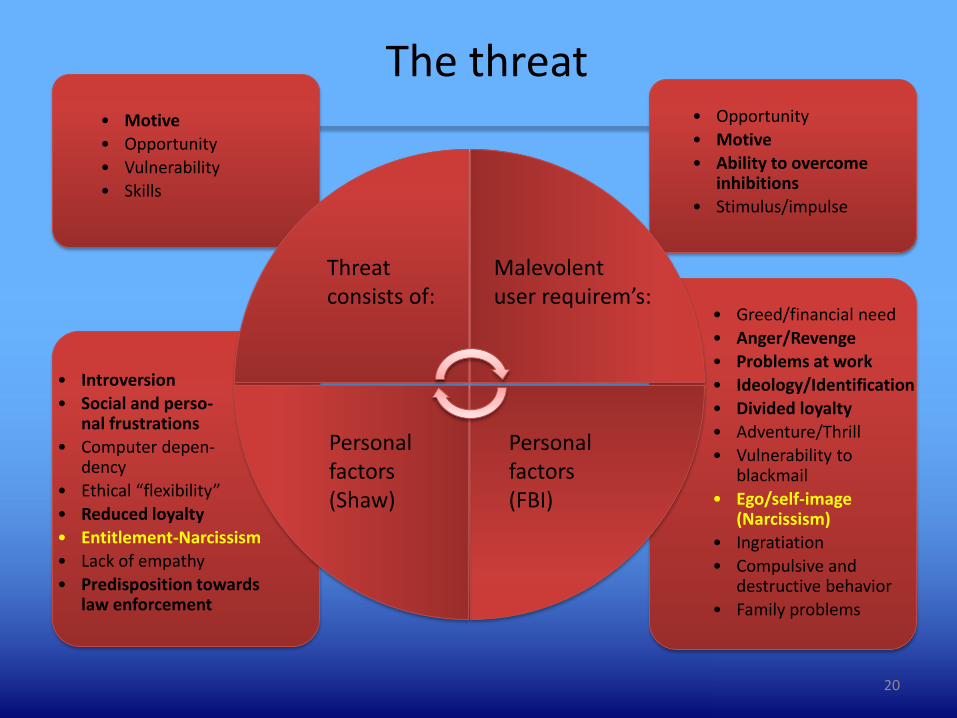
• Motive
• Opportunity
• Vulnerability
• Skills
Threat consists of:
Malevolent user requirem’s:
Personal factors(Shaw)
Personal factors(FBI)
• Opportunity
• Motive
• Ability to overcome inhibitions
• Stimulus/impulse
• Greed/financial need
• Anger/Revenge
• Problems at work
• Ideology/Identification
• Divided loyalty
• Adventure/Thrill
• Vulnerability to blackmail
• Ego/self-image (Narcissism)
• Ingratiation
• Compulsive and destructive behavior
• Family problems
• Introversion
• Social and perso-nal frustrations
• Computer depen-dency
• Ethical “flexibility”
• Reduced loyalty
• Entitlement-Narcissism
• Lack of empathy
• Predisposition towards law enforcement
The threat
20

Delinquent behavior prediction theories
Hu
man
beh
avio
r p
red
icti
on
–In
sid
er T
hre
at u
nd
erst
and
ing
augm
en
tati
on
General Deterrence Theory (GDT):
Person commits crime if expected benefit outweighs cost of action
Social Bond Theory (SBT): Person commits crime if social bonds of attachment, com-mitment, involvement and belief are weak
Social Learning Theory (SLT):
Person commits crime if associates with delinquent peers
Theory of Planned Behavior (TPB): Person’s intention (attitude, subjective norms,
perceived behavioral control) towards crime is a key factor in predicting his behavior
Situational Crime Prevention (SCP):
Crime occurs when both motive and opportunity exist
21
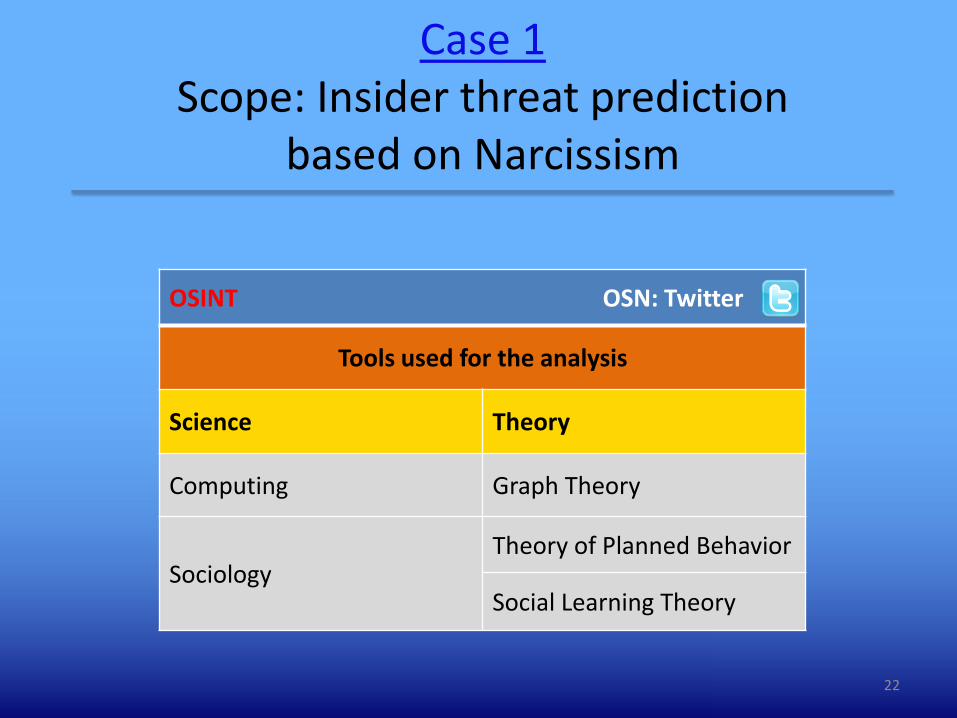
Case 1Scope: Insider threat prediction
based on Narcissism
22
OSINT OSN: Twitter
Tools used for the analysis
Science Theory
Computing Graph Theory
SociologyTheory of Planned Behavior
Social Learning Theory

Case 1: Insider threat prediction based on Narcissism
Narcissistic behavior detection
Study: Motive, ego/self-image, entitlement
Means: Usage Intensity, Influence valuation,
Klout score
• Individuals tend to transfer offline behavior online.
• Convicted insiders do share this personality trait (narcissism).
• Utilize graph theoretic tools to perform analysis.
• Detection via social media popularity and usage intensity.
• Trait of narcissism relates to delinquent behavior via :
– sense of entitlement,
– lack of empathy,
– anger and “revenge” syndrome and
– inflated self-image.23
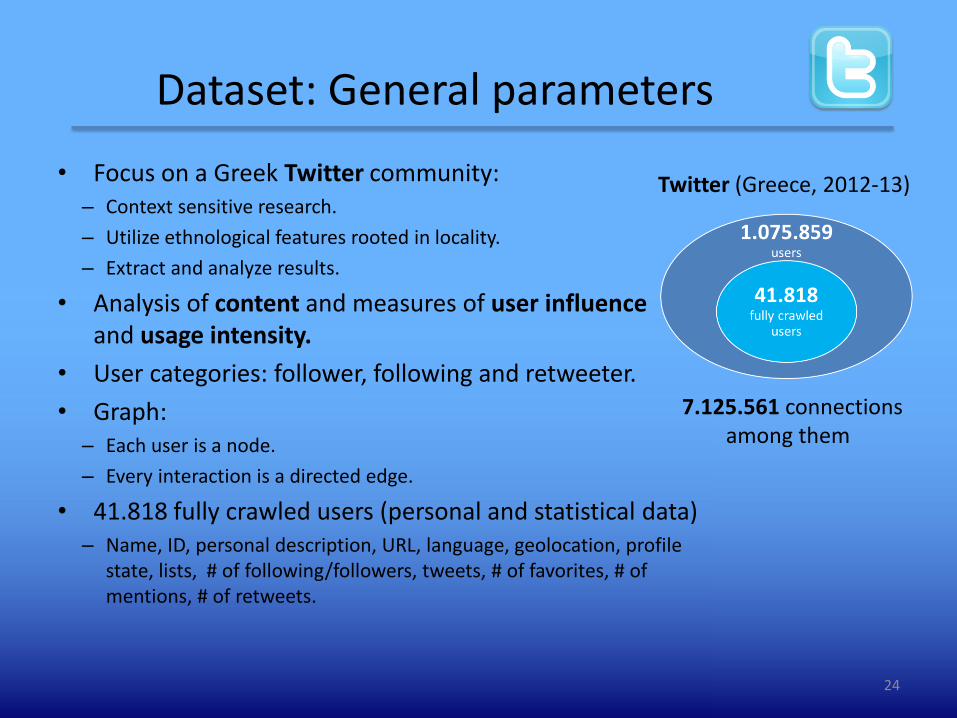
Dataset: General parameters
• Focus on a Greek Twitter community:– Context sensitive research.
– Utilize ethnological features rooted in locality.
– Extract and analyze results.
• Analysis of content and measures of user influence and usage intensity.
• User categories: follower, following and retweeter.
• Graph: – Each user is a node.
– Every interaction is a directed edge.
• 41.818 fully crawled users (personal and statistical data)– Name, ID, personal description, URL, language, geolocation, profile
state, lists, # of following/followers, tweets, # of favorites, # of mentions, # of retweets.
24
7.125.561 connections among them
Twitter (Greece, 2012-13)

• Strongly connected components:
– There exists 1 large component (153.121 nodes connected to each other) and several smaller ones
• Node Loneliness:
– 99% of users connected to someone
• Small World Phenomenon:
– Every user lies <6 hops away from anyone
Graph Theoretical approach
25
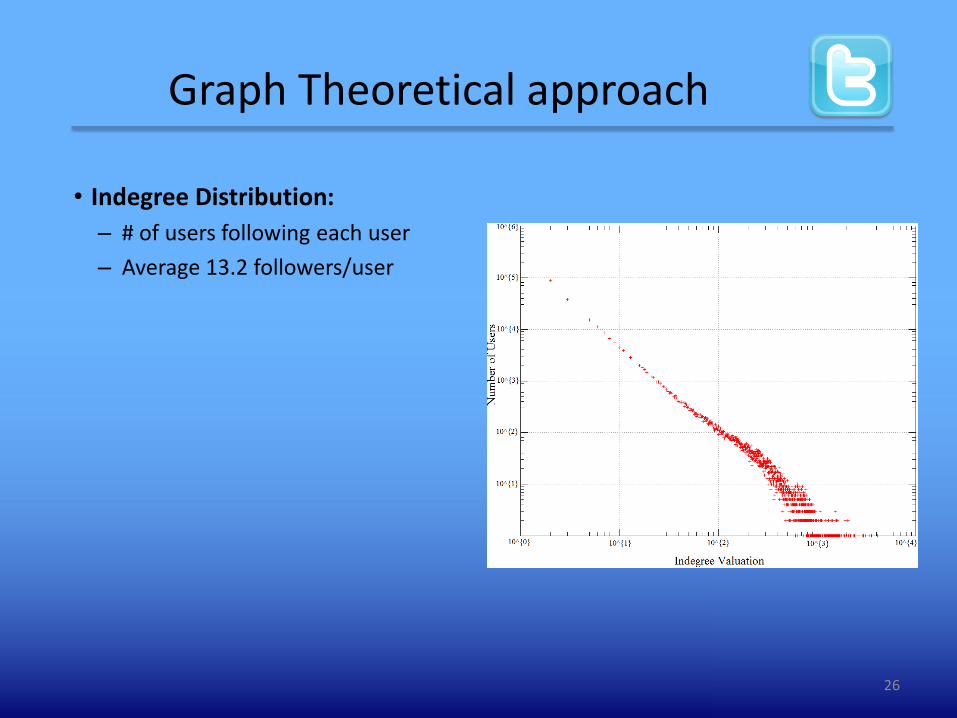
• Indegree Distribution:
– # of users following each user
– Average 13.2 followers/user
Graph Theoretical approach
26

• Outdegree Distribution:
– # of users each user follows
– Average 11 followers/user
Graph Theoretical approach
27
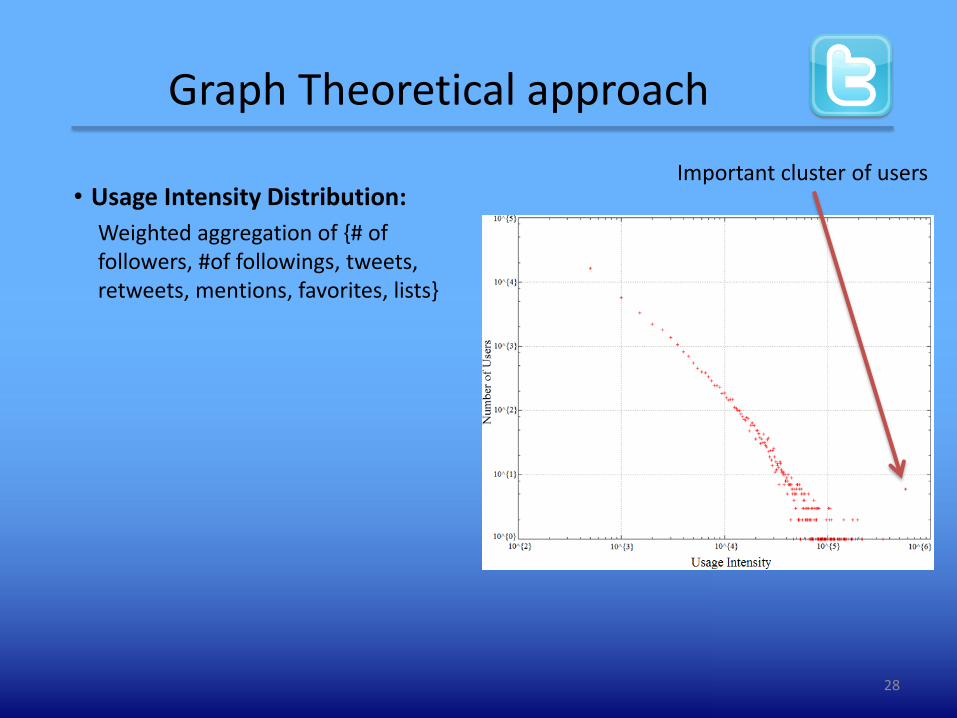
• Usage Intensity Distribution:
Weighted aggregation of {# of followers, #of followings, tweets, retweets, mentions, favorites, lists}
Graph Theoretical approach
28
Important cluster of users
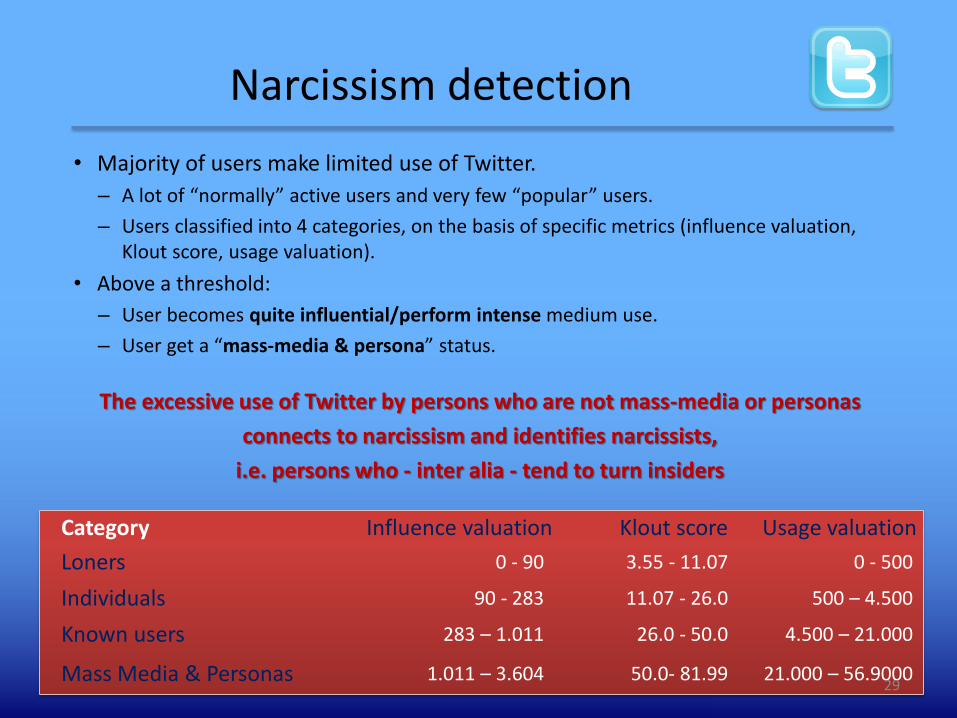
• Majority of users make limited use of Twitter.
– A lot of “normally” active users and very few “popular” users.
– Users classified into 4 categories, on the basis of specific metrics (influence valuation, Klout score, usage valuation).
• Above a threshold:
– User becomes quite influential/perform intense medium use.
– User get a “mass-media & persona” status.
The excessive use of Twitter by persons who are not mass-media or personas
connects to narcissism and identifies narcissists,
i.e. persons who - inter alia - tend to turn insiders
Narcissism detection
Category Influence valuation Klout score Usage valuation
Loners 0 - 90 3.55 - 11.07 0 - 500
Individuals 90 - 283 11.07 - 26.0 500 – 4.500
Known users 283 – 1.011 26.0 - 50.0 4.500 – 21.000
Mass Media & Personas 1.011 – 3.604 50.0- 81.99 21.000 – 56.900029
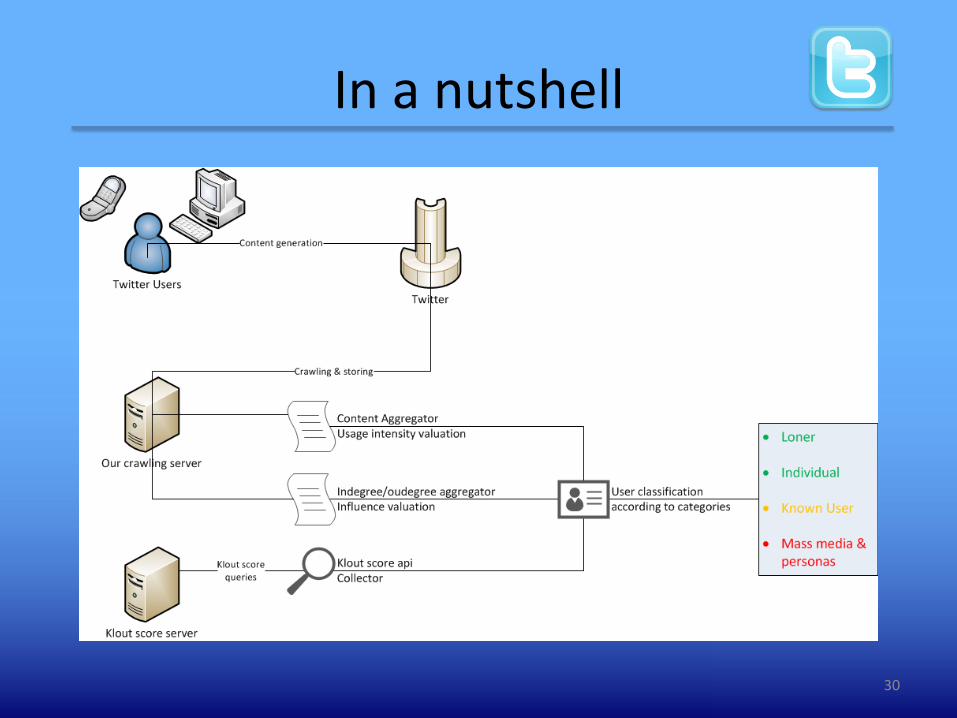
In a nutshell
30

Case 2Scope: Revealing negative attitude
towards law enforcement
31
OSINT OSN: YouTube
Tools used for the analysis
Science Theory
ComputingMachine Learning
Data Mining
Sociology Social Learning Theory

Case 2: Revealing negative attitude towards law enforcement
Law enforcement
predisposition
Study: Motive, anger, frustrations,
predisposition towards law enforcement
Means: Machine Learning, comment
classification, flat data classification.
• Individuals tend to transfer offline behavior online.
• Extract results about users’ negative attitude towards law enforcement and authorities.
• Trait of negative attitude towards law enforcement is connected to delinquent behavior via:
– sense of entitlement,
– lack of empathy,
– anger and revenge syndrome and
– inflated self-image.
32

Dataset: General parameters
• Crawled YouTube and created dataset consists solely of Greek users.
• Utilized YouTube REST-based API (developers.google.com/youtube/):– Only publicly available data collected.
– Quote limitations (posed by YouTube) were respected.
• Collected data were classified into three categories: – user-related information (profile, uploaded videos, subscriptions, favorite videos,
playlists),
– video-related information (license, # of likes, # of dislikes, category, tags) and
– comment-related information (comment content, # of likes, # of dislikes).
• Time span of collected data covered 7 years (Nov 2005 - Oct 2012).
• A basic anonymization layer added to the collected data:– MD5 hashes instead of usernames.
33
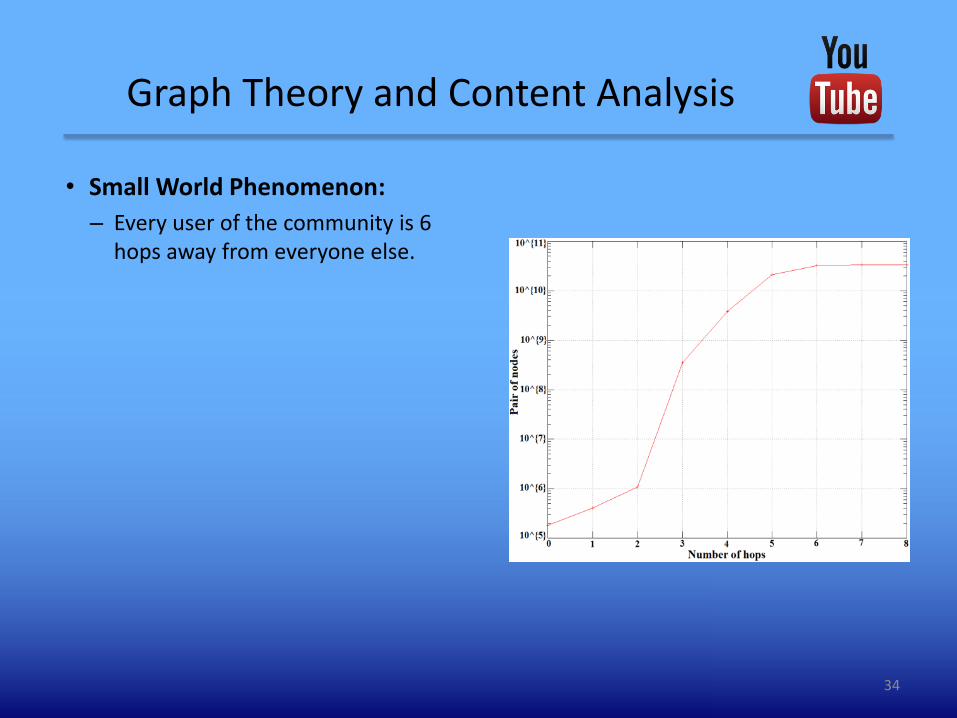
• Small World Phenomenon:
– Every user of the community is 6 hops away from everyone else.
Graph Theory and Content Analysis
34
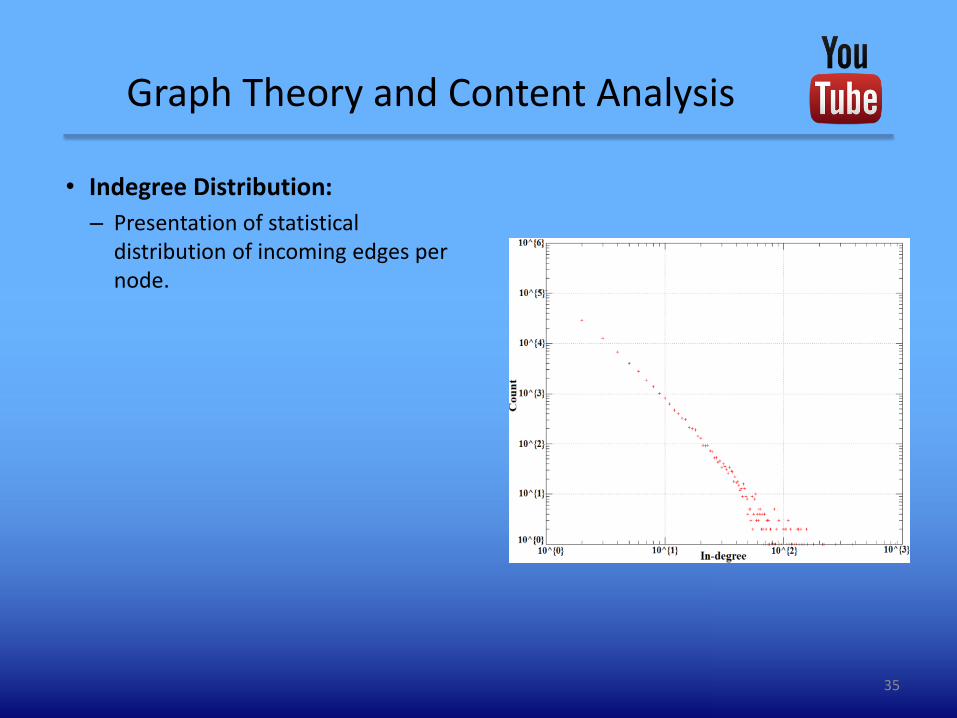
• Indegree Distribution:
– Presentation of statistical distribution of incoming edges per node.
Graph Theory and Content Analysis
35

• Outdegree Distribution:
– Presentation of statistical distribution of outgoing edges per node.
Graph Theory and Content Analysis
36

• Tag Cloud :
– Axis of content of the collected data via tag cloud analysis.
Graph Theory and Content Analysis
37
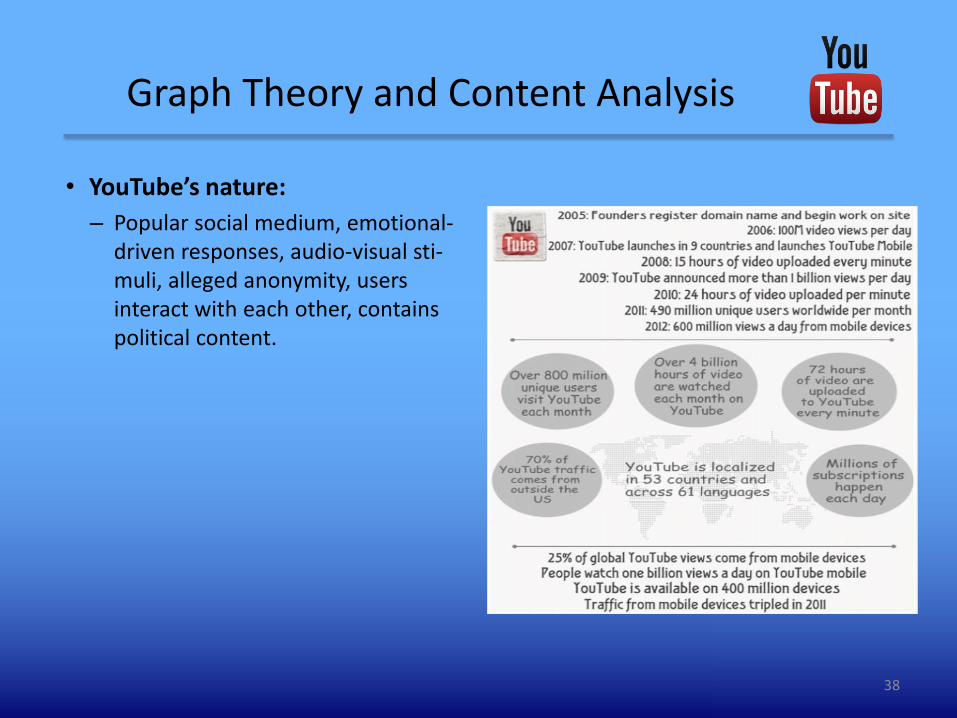
• YouTube’s nature:
– Popular social medium, emotional-driven responses, audio-visual sti-muli, alleged anonymity, users interact with each other, contains political content.
Graph Theory and Content Analysis
38
We assessed a YouTube user negative attitude towards law enforcement by classifying YouTube content using (a) Machine Learning and (b) Flat Data
• Machine Learning– Examined YouTube’s videos via their comments
– Performed comment classification as text classification
– Content analysis based on comments and videos (via their comments)
• Flat Data– An assumption-free method
– An easy-to-scale method
How was the analysis performed?
39
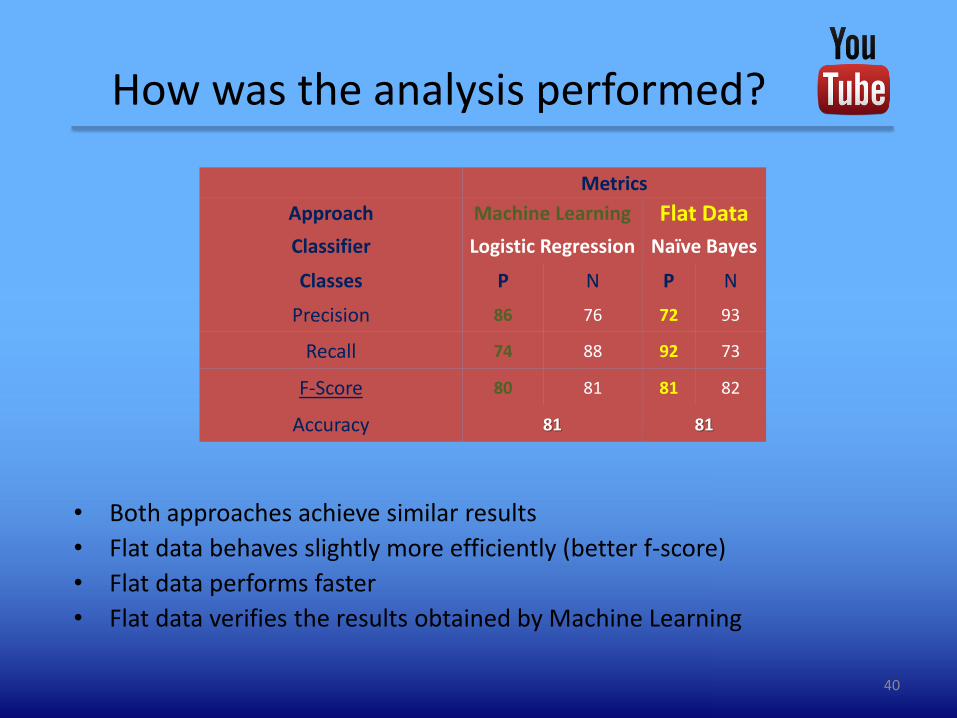
How was the analysis performed?
40
Metrics
Approach Machine Learning Flat Data
Classifier Logistic Regression Naïve Bayes
Classes P N P N
Precision 86 76 72 93
Recall 74 88 92 73
F-Score 80 81 81 82
Accuracy 81 81
• Both approaches achieve similar results
• Flat data behaves slightly more efficiently (better f-score)
• Flat data performs faster
• Flat data verifies the results obtained by Machine Learning
• Comment classified into categories of interest:– Process performed as text classification.
– Machine trained with text examples and the category each one belongs to.
– Excessive support by field expert (Sociologist).
• Test set used to evaluate efficiency of resulting classifier:– Contains pre-labeled data fed to machine, labeled by field expert.
– Check if initial assigned label is equal to predicted one.
– Testing set labels assigned by field expert.
• Most comments are written in Greek – greeklish comments exist.
• Training sets (greeklish, greek) were merged - One classifier was trained.
• Two categories of content were defined: – Users with a negative attitude (Predisposed negatively (P)).
– Users with a not negative attitude (Not-predisposed negatively (N)).
Machine Learning (1)
41
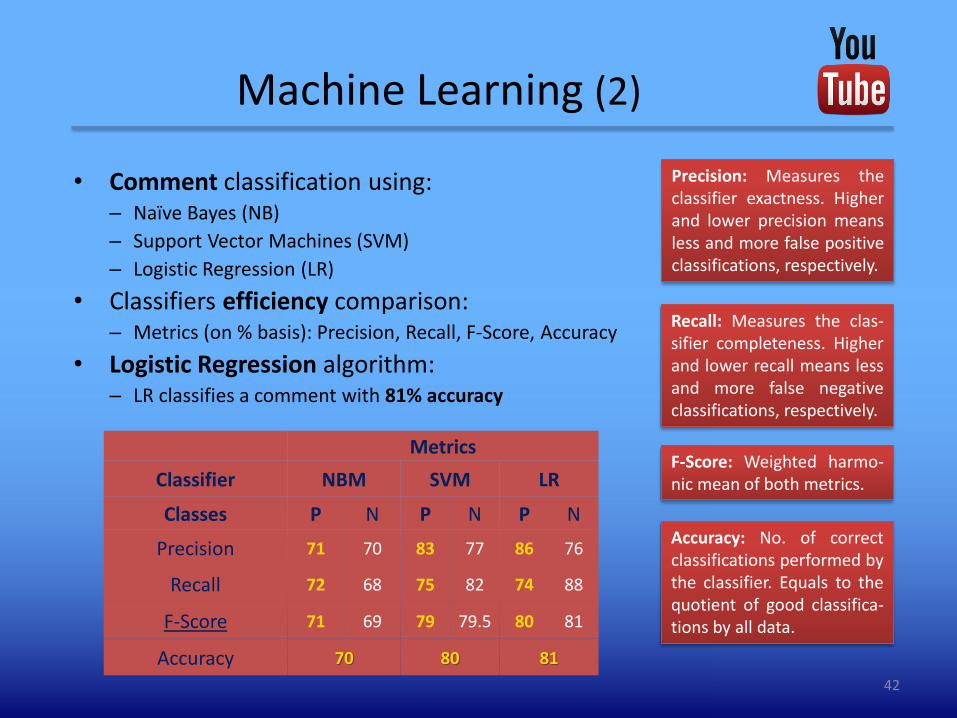
• Comment classification using:– Naïve Bayes (NB)
– Support Vector Machines (SVM)
– Logistic Regression (LR)
• Classifiers efficiency comparison: – Metrics (on % basis): Precision, Recall, F-Score, Accuracy
• Logistic Regression algorithm:– LR classifies a comment with 81% accuracy
Machine Learning (2)
Precision: Measures theclassifier exactness. Higherand lower precision meansless and more false positiveclassifications, respectively.
Recall: Measures the clas-sifier completeness. Higherand lower recall means lessand more false negativeclassifications, respectively.
F-Score: Weighted harmo-nic mean of both metrics.
Accuracy: No. of correctclassifications performed bythe classifier. Equals to thequotient of good classifica-tions by all data.
Metrics
Classifier NBM SVM LR
Classes P N P N P N
Precision 71 70 83 77 86 76
Recall 72 68 75 82 74 88
F-Score 71 69 79 79.5 80 81
Accuracy 70 80 81
42

• Video classification:– Examination of a video on the basis of its comments.
– Voter process to determine category classification.
• (Video) Lists classification:– Voter process to determine category classification (same threshold).
• Conclusions about user behavior:– If there is at least one category P attribute then the user is classified into
category P.
Machine Learning (3)
UserUploads
Comments Favorites
Playlists
43

Example of conclusion extraction (1/2)
44
• Each comment falls into a category (P or N) based on the classifier’s prediction.
• Each video falls into a category based on its comments.
• The voter decides on the basis of the number of P comments (category P).
• Comments with only dislikes and no likes are excluded.
• Same method applies to list of videos (instead of comments), i.e. user’s uploaded
videos, favourite videos, and playlists.
Video “Example”
Comment Classifier’s output Likes Dislikes
#1 P 0 2#2 P 9 1#3 N 0 5#4 P 5 2#5 N 4 13#6 P 0 3
Only comments #2 and #4 will be fed to the voter (if N, then ignore. If no likes and at least 1 dislike, then ignore).
Video contains (at least) 2 negatively Predisposed comments. Thus, it falls into category P.
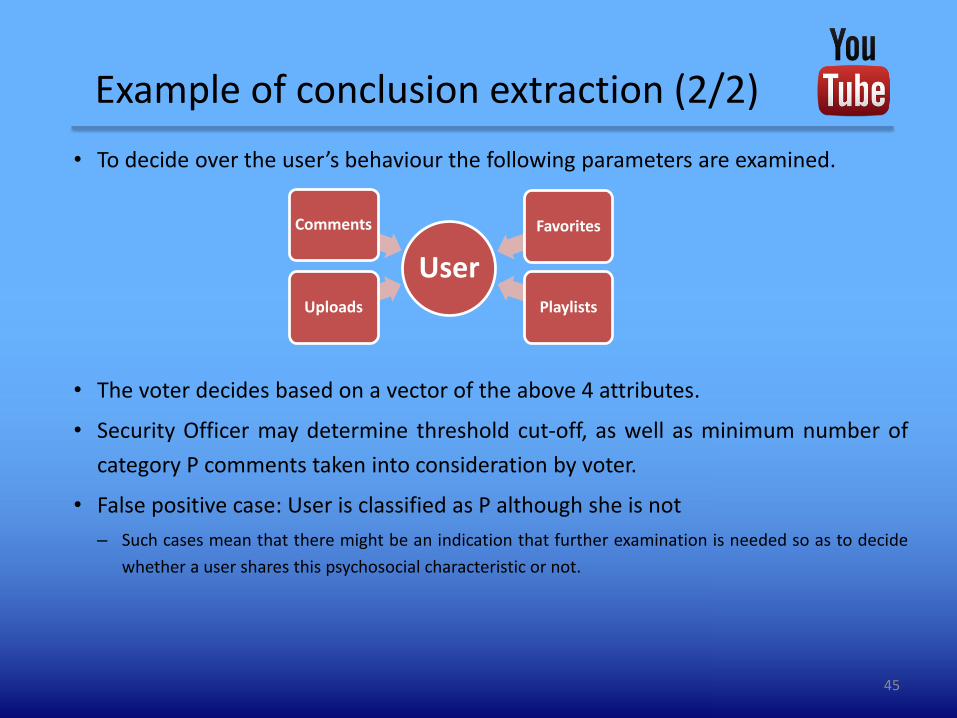
Example of conclusion extraction (2/2)
45
• To decide over the user’s behaviour the following parameters are examined.
• The voter decides based on a vector of the above 4 attributes.
• Security Officer may determine threshold cut-off, as well as minimum number of
category P comments taken into consideration by voter.
• False positive case: User is classified as P although she is not
– Such cases mean that there might be an indication that further examination is needed so as to decide
whether a user shares this psychosocial characteristic or not.
UserUploads
Comments Favorites
Playlists
Flat Data (1)
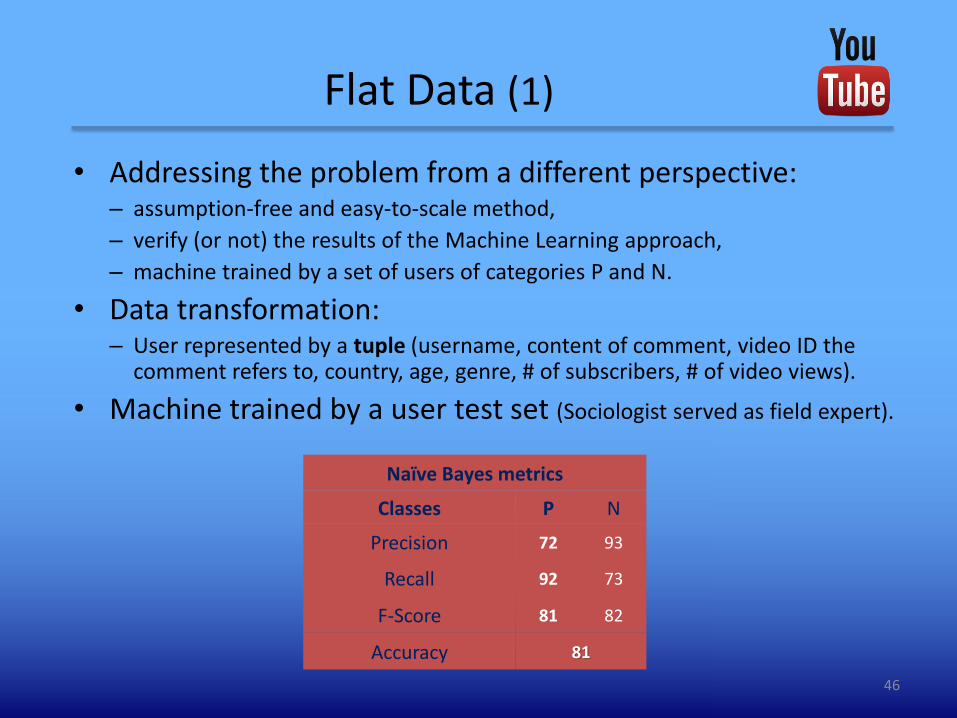
• Addressing the problem from a different perspective:– assumption-free and easy-to-scale method,
– verify (or not) the results of the Machine Learning approach,
– machine trained by a set of users of categories P and N.
• Data transformation:– User represented by a tuple (username, content of comment, video ID the
comment refers to, country, age, genre, # of subscribers, # of video views).
• Machine trained by a user test set (Sociologist served as field expert).
46
Naïve Bayes metrics
Classes P N
Precision 72 93
Recall 92 73
F-Score 81 82
Accuracy 81
Flat Data (2)
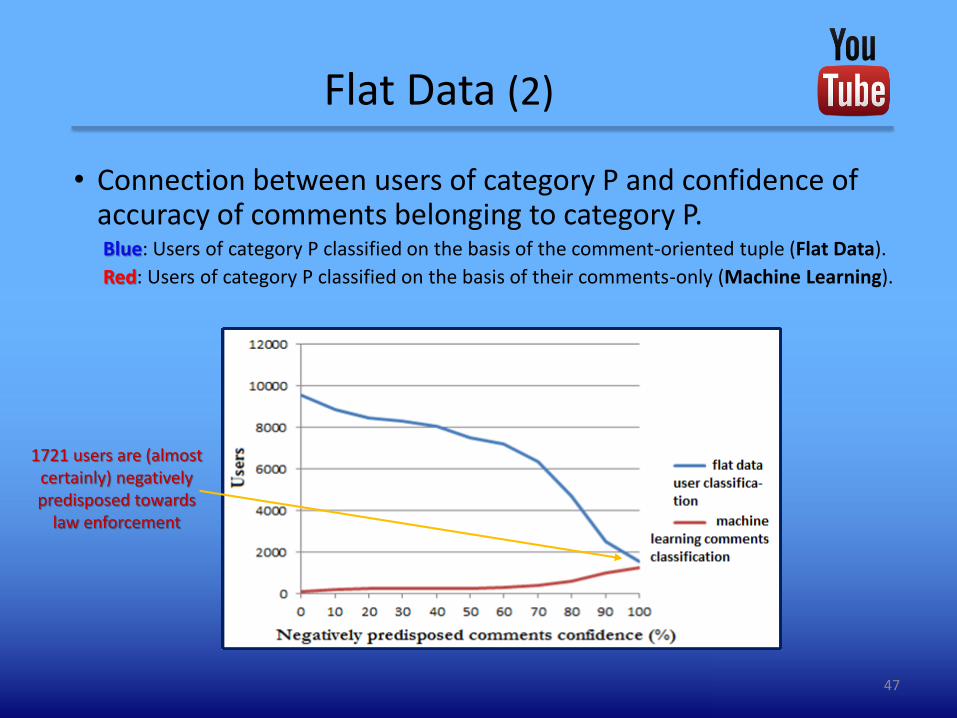
• Connection between users of category P and confidence of accuracy of comments belonging to category P. Blue: Users of category P classified on the basis of the comment-oriented tuple (Flat Data).
Red: Users of category P classified on the basis of their comments-only (Machine Learning).
47
1721 users are (almost certainly) negatively predisposed towards
law enforcement

Case 3Scope: Detecting stress level usage
patterns (overall and over time)
48
OSINT OSN: Facebook
Tools used for the analysis
Science Theory
ComputingMachine Learning
Data Mining
Sociology Social Learning Theory

Case 3: Detecting stress level usage pattern (overall and over time)
Stress level detection
Study: User’s overall and over time stress level
Means: Machine Learning, flat data
classification, chronicity analysis.
• Individuals tend to transfer offline behavior online.
• Extract results about usage pattern depicted stress level.
• Analyze each user under the prism of stress level both overall and over time (chronicity analysis).
• High stress has been found to:
– Make individuals vulnerable to fall prey to third parties.
– Overcome moral inhibitions.
• Analysis is based on Social Learning Theory and stress correlations are based on Beck’s Anxiety Inventory stress test.
49

Dataset: General parameters
• Crawled Facebook & created dataset solely by Greek users.• Users offered informed consent.• Utilized Facebook’s Graph API: – Only publicly available data collected.– De facto respect of users’ privacy settings.
• Collected data were classified into four categories: – User information (friends list and profile description),– user-generated content (statuses, comments and links),– groups of interest (communities, events and activities) and– interests (music, actors, sports, books etc.).
• A basic anonymization layer added to the collected data:– MD5 hashes instead of usernames.
• Opt-out ability integrated, delete all user data upon selection.• Dataset statistical analysis proved its efficiency and absence of bias.
50

405 users12.346 user
groups98.256 liked
objects171.054 statuses
250.027 comments
Dataset: General parameters
51
Flat classification (overall indicators)
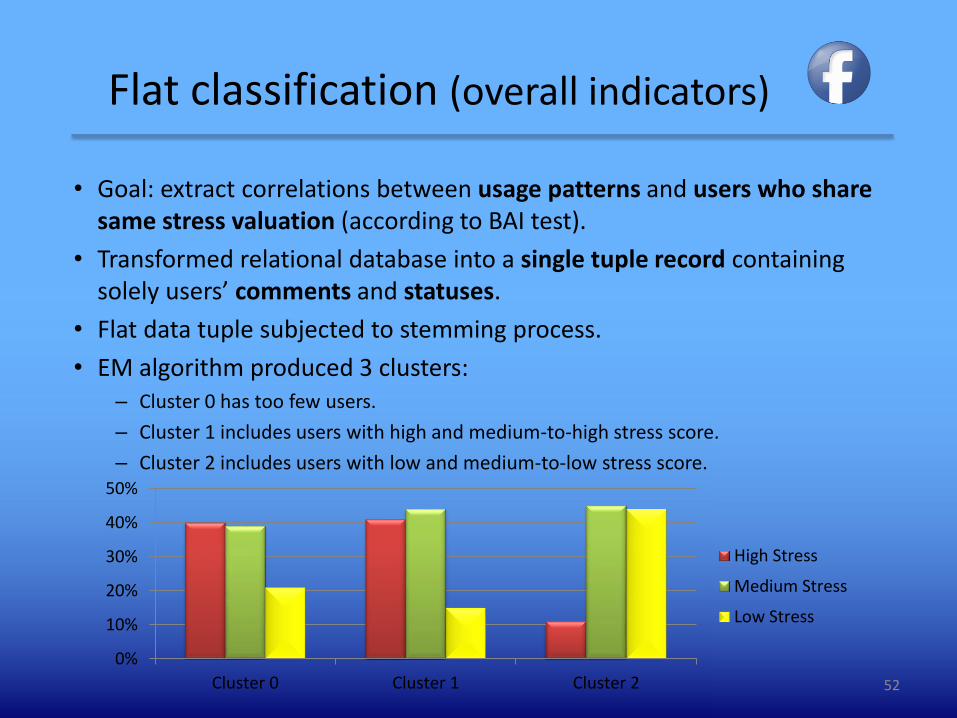
• Goal: extract correlations between usage patterns and users who share same stress valuation (according to BAI test).
• Transformed relational database into a single tuple record containing solely users’ comments and statuses.
• Flat data tuple subjected to stemming process.
• EM algorithm produced 3 clusters:– Cluster 0 has too few users.
– Cluster 1 includes users with high and medium-to-high stress score.
– Cluster 2 includes users with low and medium-to-low stress score.
52
0%
10%
20%
30%
40%
50%
Cluster 0 Cluster 1 Cluster 2
High Stress
Medium Stress
Low Stress

Chronicity analysis (indicators over time)
• Goal: detect differentiations of OSN usage patterns over time related to depicted stress level.
• Split users’ usage pattern into time periods (from one day to one month).– Time period of one week produced best results.
• Chronicity analysis system consists of 2 modules:– Preprocessing data module (responsible for the processing of input data).
– Usage pattern analysis module (responsible for analyzing usage patterns based on a set of metrics).
• Usage pattern fluctuations depict differentiated medium usage.
53

Chronicity analysis stepsStep 1: Classify user gene-rated content into 4 prede-fined categories (‘S’ standsfor sports, ‘M’ for music,‘P’ for politics and ‘Mi’ formis-cellaneous).
54
Classifier NBM SVM MLR
Classes S M P Mi S M P Mi S M P Mi
Precision 71 92 79 74 79 97 87 70 89 96 85 68
Recall 77 86 85 67 72 89 75 88 72 89 75 86
F-Score 74 89 81 70 75 93 81 78 79 93 80 76
Accuracy 79 81 80
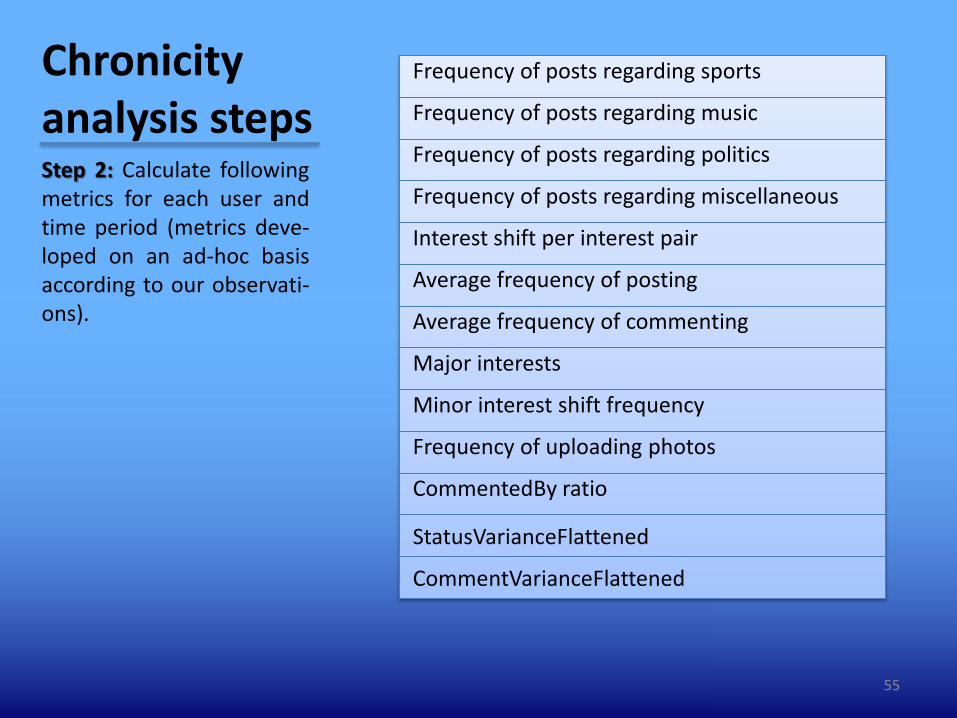
Chronicity analysis stepsStep 2: Calculate followingmetrics for each user andtime period (metrics deve-loped on an ad-hoc basisaccording to our observati-ons).
55
Frequency of posts regarding sports
Frequency of posts regarding music
Frequency of posts regarding politics
Frequency of posts regarding miscellaneous
Interest shift per interest pair
Average frequency of posting
Average frequency of commenting
Major interests
Minor interest shift frequency
Frequency of uploading photos
CommentedBy ratio
StatusVarianceFlattened
CommentVarianceFlattened

Chronicity analysis stepsStep 3: Transform metricsresults into arithmetic vec-tors and perform data min-ing on them using (a) K-means, (b) EM, and (c) Ca-nopy algorithms. Utilize vo-ter to decide fluctuations.
56
User Content
Data Processing Chronicity Analysis
SVM K-means
Canopi
EM
Cluster 1
Cluster n
.
.
Cluster 1
Cluster m
.
.
Cluster 1
Cluster k
.
.
Deviating period selection
process
Deviating period selection
process
Deviating period selection
process
Voter
Deviating usage pattern cluster
selection process
Deviating usage pattern cluster
selection process
Deviating usage pattern cluster
selection process
Final deviating
period selection process
Clustering Voter
Content Classification

Chronicity analysis results• Metrics results per
detected cluster.
57
Cluster id 1 2 3 4 5 6 7
Population 7% 16% 8% 3% 1% 7% 9%
TotalComments 3 78 93 5 79 410 44
TotalPosts 588 227 513 185 704 914 292
SportsFreq 0,00 0,01 0,00 0,00 0,00 0,02 0,03
MusicFreq 0,02 0,34 0,61 0,05 0,17 0,43 0,28
PoliticsFreq 0,00 0,06 0,02 0,00 0,04 0,05 0,15
MiscellaneousFreq 0,02 0,22 0,09 0,04 0,13 0,18 0,22
PhotosFreq 0,68 0,08 0,06 0,39 0,40 0,10 0,13
CommentsFreq 0,05 0,41 0,57 0,03 0,61 2,42 0,26
StatusesFreq 10,39 1,36 3,32 1,56 6,33 5,29 1,99
MinorInterestSift_Freq
0,01 0,18 0,13 0,02 0,12 0,16 0,24
CommentedBy ratio 0,08 1,25 0,73 0,27 0,65 1,52 0,88
StatusDispersalFlattened
34,89 3,01 4,93 7,85 15,20 7,98 6,28
CommentDispersalFlattened
0,01 1,52 0,95 0,06 1,08 5,95 0,60

Chronicity analysis results• Visual representation of users
belonging to each cluster. • Clusters 0 and 3 contain
mainly users classified in high stress category.
• Clusters 1 and 7 contain many users classified in medium or low stress category.
• In cluster 0, users post mainly photos.
• In cluster 3 users post photos, discuss about music, whereas a small fraction of the content is referring to miscellaneous information.
• Clusters 1 and 7 refer mainly to music and miscellaneous content and also contain limited content referring to sports.
58

Case 4Scope: Identifying Political Beliefs
59
OSINT OSN: YouTube
Tools used for the analysis
Science Theory
ComputingMachine Learning
Data Mining
Political Sociology
Horror story

Horror story
Case 4: Horror story –Identifying Political Beliefs
Divided loyalty
Study: Motive, ideology, divided/reduced loyalty, predisposition towards
law enforcement
Means: Machine Learning, Content Analysis, comment
classification
• Same YouTube dataset.
• Political beliefs profiling-clustering.
• Three (indicative, local context based) clusters: Radical - Neutral – Conservative.
• Machine Learning and Content Analysis methods used.
• Analysis also based on: – Social Learning Theory
– General Deterrence Theory
60

• Three (indicative) categories: Radical, Neutral, Conservative:
– Assumptions are local-context-dependent (Greece, 2007-12).
– Test case consists of an indicative subset of the local community.
– Analysis reflects the current local political scene.
• Defined (indicative) classes:
– Radical political affiliation: center-left, left, far-left.
– Neutral political affiliation: neutral or non-specified political affiliation disclosed.
– Conservative political affiliation: center-right, right, far-right.
• Comments classification:
– Comments classification performed as text classification.
– Machine trained with text examples and the category each one belongs to.
– Assistance of field expert (Sociologist).
Methodology
61

• Comment classification by: – Naïve Bayes Multinomial (NBM)
– Support Vector Machines (SVM)
– Multinomial Logistic Regression (MLR)
• Each classifier’s efficiency was compared by:– Metrics (%): Precision, Recall, F-Score, Accuracy
• Multinomial Logistic Regression was chosen:– MLR classifies appropriately a comment with 87% accuracy.
– Use of precision, recall and f-score to further examine classifiers' efficiency.
Precision: Measures theclassifier exactness. Higherand lower precision meansless and more false positiveclassifications, respectively.
Recall: Measures the clas-sifier completeness. Higher/lower recall means less/more false negative classify-cations, respectively.
F-Score: Weighted harmo-nic mean of both metrics.
Accuracy: No. of correctclassifications performed bythe classifier. Equals to thequotient of good classifica-tions by all the data.
Metrics
Classifier NBM SVM MLR
Classes R N C R N C R N C
Precision 65 93 55 75 91 74 83 91 77
Recall 83 56 85 80 89 73 77 93 78
F-Score 73 70 60 76 89 73 80 92 77
Accuracy 68 84 87
Analysis of results
62
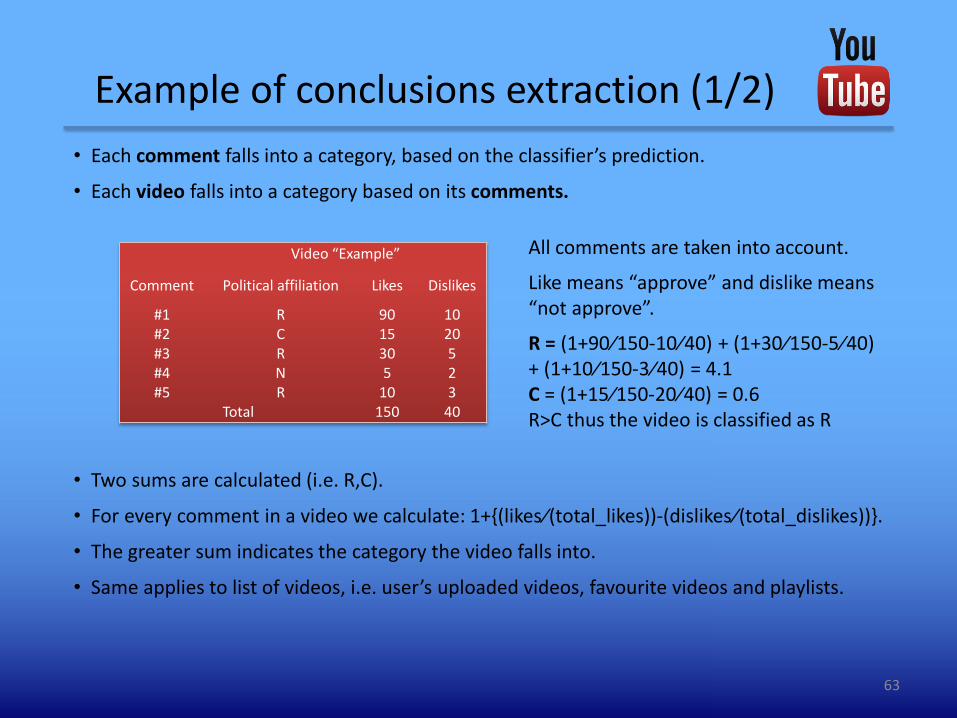
• Each comment falls into a category, based on the classifier’s prediction.
• Each video falls into a category based on its comments.
Example of conclusions extraction (1/2)
63
Video “Example”
Comment Political affiliation Likes Dislikes
#1 R 90 10#2 C 15 20#3 R 30 5#4 N 5 2#5 R 10 3
Total 150 40
• Two sums are calculated (i.e. R,C).
• For every comment in a video we calculate: 1+{(likes⁄(total_likes))-(dislikes⁄(total_dislikes))}.
• The greater sum indicates the category the video falls into.
• Same applies to list of videos, i.e. user’s uploaded videos, favourite videos and playlists.
All comments are taken into account.
Like means “approve” and dislike means “not approve”.
R = (1+90⁄150-10⁄40) + (1+30⁄150-5⁄40) + (1+10⁄150-3⁄40) = 4.1C = (1+15⁄150-20⁄40) = 0.6R>C thus the video is classified as R
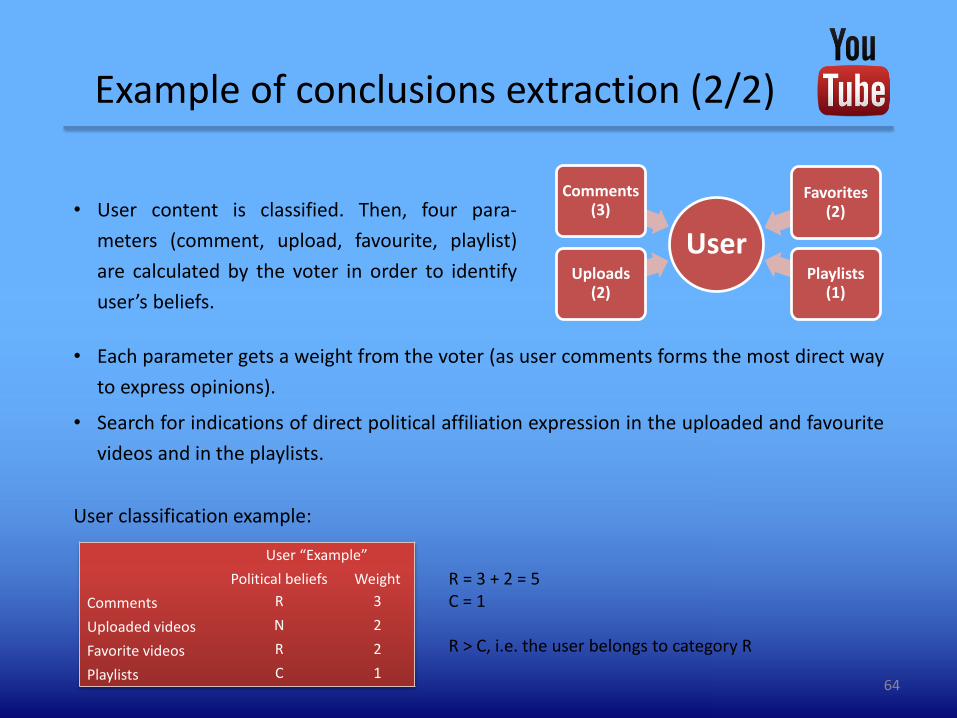
• User content is classified. Then, four para-
meters (comment, upload, favourite, playlist)
are calculated by the voter in order to identify
user’s beliefs.
Example of conclusions extraction (2/2)
64
UserUploads
(2)
Comments (3)
Favorites (2)
Playlists (1)
User “Example”
Political beliefs Weight
Comments R 3
Uploaded videos N 2
Favorite videos R 2
Playlists C 1
R = 3 + 2 = 5C = 1
R > C, i.e. the user belongs to category R
• Each parameter gets a weight from the voter (as user comments forms the most direct way
to express opinions).
• Search for indications of direct political affiliation expression in the uploaded and favourite
videos and in the playlists.
User classification example:

2% of comments demonstrate political affiliation (0.7% Radical, 1.3% Conservative)
– 2% means that almost 41.000 comments (of the 2.000.000 collected) include political
content.
7% of videos classified into a specific category (2% Radical, 5% Conservative)
- 7% means that almost 14.000 videos (of the 200.000 collected) include political content.
12% of users express Radical political affiliation and 40% Conservative affiliation
– 52% means that 6.760 users reveal - one way or another - their political beliefs.
Basic observations (1/2)
65
Radical12%
Conservative40%
Neutral48%
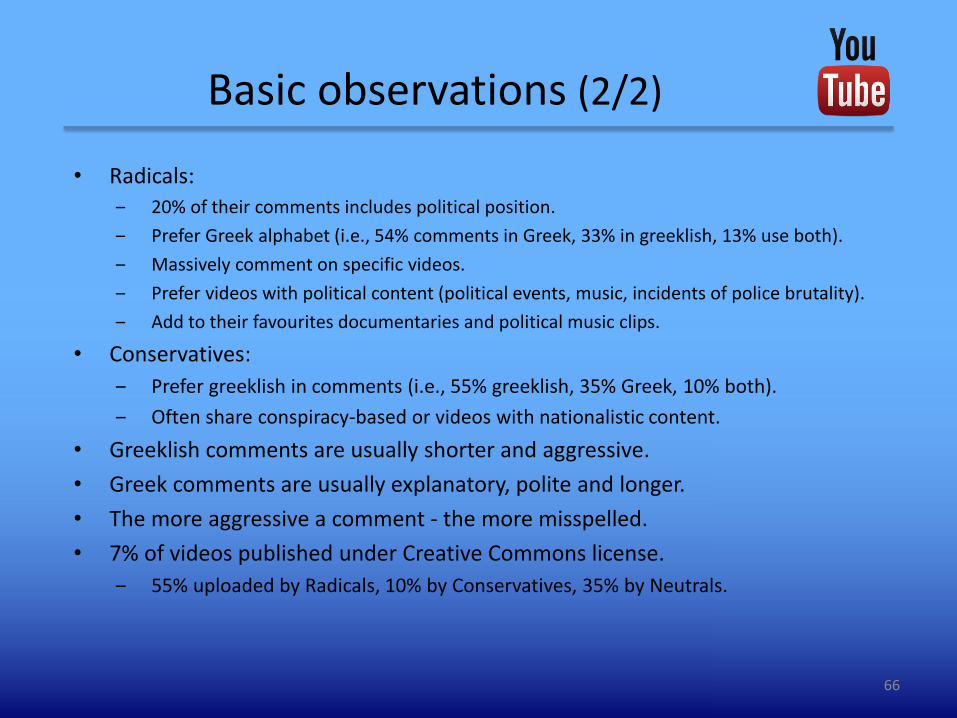
• Radicals:‒ 20% of their comments includes political position.
‒ Prefer Greek alphabet (i.e., 54% comments in Greek, 33% in greeklish, 13% use both).
‒ Massively comment on specific videos.
‒ Prefer videos with political content (political events, music, incidents of police brutality).
‒ Add to their favourites documentaries and political music clips.
• Conservatives:
‒ Prefer greeklish in comments (i.e., 55% greeklish, 35% Greek, 10% both).
‒ Often share conspiracy-based or videos with nationalistic content.
• Greeklish comments are usually shorter and aggressive.
• Greek comments are usually explanatory, polite and longer.
• The more aggressive a comment - the more misspelled.
• 7% of videos published under Creative Commons license.
‒ 55% uploaded by Radicals, 10% by Conservatives, 35% by Neutrals.
Basic observations (2/2)
66
OSN data exploitation paths
• Insider threat prediction:
– Adopting Shaw and FBI psychosocial indicators (narcissism, anger or revenge syndrome, etc.).
• Delinquent behavior prediction:
– Analysis of psychosocial characteristics (narcissism, anger or revenge syndromes, etc.).
– Predisposition analysis (graph theory and content analysis through social learning theory, etc.).
• Forensics analysis support:
– Suspect profiling and analysis (proactive prediction of delinquent behavior, etc.).
67

Ethical and legal issues
• Users are not aware of the actual reach of the information they reveal.
• Some methods used for OSINT may:– be associated with discrimination,
– infringe human rights (freedom of speech, conception of identity, privacy, etc.),
– cause self-censorship and self-oppression and
– pose a threat of marginalization (employers or rigid micro-societies).
• OSN often offer privacy options which do not really help.
• Private profiles are usually indirectly crawlable .
• Laws may not clearly prohibit the process of data revealing psychosocialcharacteristics.
• Derogations are often allowed:– On a legal manifest of public interest (e.g. critical infrastructures, security officers, etc.).
– If given an explicit, informed and written consent of the person concerned.
68
Some conclusions
OSN produce vast amounts of crawlable information and OSINT
may transform this information into intelligence.
OSINT can assist in detecting narcissistic behavior, predisposition
towards law enforcement, divided political loyalty, etc.
OSINT can be a proactive cyber-defense tool and predict insider
threat, predict delinquent behavior, assist in law enforcement.
OSINT may lead to unwanted horror stories.
OSINT intrusive nature dictates limited use, e.g. security officers
selection, critical infrastructure protection.
69

References1. Gritzalis D., Stavrou V., Kandias M., Stergiopoulos G., “Insider Threat: Εnhancing BPM through Social Media”, in Proc. of the 6th IFIP International Conference on New
Technologies, Mobility and Security (NMTS-2014), Springer, UAE, 2014.
2. Gritzalis D., “Insider threat prevention through Open Source Intelligence based on Online Social Networks”, Keynote address, 13th European Conference on Cyber Warfare and Security (ECCWS-2014), Greece, 2014.
3. Gritzalis D., Kandias M., Stavrou V., Mitrou L., "History of Information: The case of Privacy and Security in Social Media", in Proc. of the History of Information Conference, Law Library Publications, Athens, 2014.
4. Kandias M., Mitrou L., Stavrou V., Gritzalis D., “Which side are you on? A new Panopticon vs. privacy”, in Proc. of the 10th International Conference on Security and Cryptography (SECRYPT-2013), pp. 98-110, Iceland, 2013.
5. Kandias M., Galbogini K., Mitrou L., Gritzalis D., "Insiders trapped in the mirror reveal themselves in social media", in Proc. of the 7th International Conference on Network and System Security (NSS-2013), pp. 220-235, Springer (LNCS 7873), Spain, June 2013.
6. Kandias M., Virvilis N., Gritzalis D., "The Insider Threat in Cloud Computing", in Proc. of the 6th International Conference on Critical Infrastructure Security (CRITIS-2011), pp. 93-103, Springer (LNCS 6983), United Kingdom, 2013.
7. Kandias M., Stavrou V., Bozovic N., Mitrou L., Gritzalis D., "Can we trust this user? Predicting insider’s attitude via YouTube usage profiling", in Proc. of 10th IEEE International Conference on Autonomic and Trusted Computing (ATC-2013), pp. 347-354, IEEE Press, Italy, 2013.
8. Kandias M., Stavrou V., Bosovic N., Mitrou L., Gritzalis D., “Proactive insider threat detection through social media: The YouTube case”, in Proc. of the 12th
Workshop on Privacy in the Electronic Society (WPES-2013), pp. 261-266, ACM Press, Germany, 2013.
9. Kandias M., Virvilis N., Gritzalis D., “The Insider Threat in Cloud Computing”, in Proc. of the 6th International Workshop on Critical Infrastructure Security (CRITIS-2011), Bologna S., et al (Eds.), pp. 93-103, Springer (LNCS 6983), Switzerland, 2011.
10. Kandias M., Mylonas A., Virvilis N., Theoharidou M., Gritzalis D., “An Insider Threat Prediction Model”, in Proc. of the 7th International Conference on Trust, Privacy, and Security in Digital Business (TrustBus-2010), pp. 26-37, Springer (LNCS-6264), Spain, 2010.
11. Mitrou L., Kandias M., Stavrou V., Gritzalis D., "Social media profiling: A Panopticon or Omniopticon tool?", in Proc. of the 6th Conference of the Surveillance Studies Network, Spain, 2014.
12. Mylonas A., Meletiadis V., Tsoumas B., Mitrou L., Gritzalis D., “Smartphone forensics: A proactive investigation scheme for evidence acquisition”, in Proc. of the 27th
IFIP International Information Security and Privacy Conference, pp. 245-256, Springer (AICT 267), Greece, 2012.
13. Mylonas A., Dritsas S, Tsoumas V., Gritzalis D., “Smartphone Security Evaluation - The Malware Attack Case”, in Proc. of the 9th International Conference on Security and Cryptography (SECRYPT-2011), pp. 25-36, SciTeκPress, Spain, 2011.
14. Mylonas A., Meletiadis V., Mitrou L., Gritzalis D., “Smartphone sensor data as digital evidence”, Computers & Security, Vol. 38, pp. 51-75, October 2013.
15. Pierrakakis K., Kandias M., Gritzali C., Gritzalis D., “3D Printing and its regulation dynamics: The world in front of a paradigm shift”, in Proc. of the 6th International Conference on Information Law and Ethics (ICIL-2014), Law Library Publications, Greece, 2014.
16. Pipyros K., Mitrou L., Gritzalis D., Apostolopoulos T., "A Cyber Attack Evaluation Methodology", in Proc. of the 13th European Conference on Cyber Warfare and Security (ECCWS-2014), Greece, 2014.
17. Stavrou V., Kandias M., Karoulas G., Gritzalis D., "Business Process Modeling for Insider threat monitoring and handling", in Proc. of the 11th International Conference on Trust, Privacy & Security in Digital Business (TRUSTBUS-2014), Springer, Germany, 2014.
18. Theoharidou M., Kotzanikolaou P., Gritzalis D., "Towards a Criticality Analysis Methodology: Redefining Risk Analysis for Critical Infrastructure Protection", in Proc. of the 3rd IFIP International Conference on Critical Infrastructure Protection (CIP-2009), Springer, USA, 2009.
19. Theoharidou M., Kandias M., Gritzalis D., “Securing Transportation-Critical Infrastructures: Trends and Perspectives”, in Proc. of the 7th IEEE International Conference in Global Security, Safety and Sustainability (ICGS3-2011), pp. 171-178, Springer (LNICST 0099), Greece, 2012.
20. Theoharidou M., Mylonas A., Gritzalis D., “A risk assessment method for smartphones”, in Proc. of the 27th IFIP International Information Security and Privacy Conference, pp. 443-456, Springer (AICT 267), Greece, 2012.
70