open source platforms for big data analytics
TRANSCRIPT

Open Source Platforms for Big DataAnalytics
JORGE FILIPE CÂNDIDO NEREUOutubro de 2017

OPEN SOURCE PLATFORMS FOR BIG DATA
ANALYTICS
Jorge Filipe Cândido Nereu
Dissertação para obtenção do Grau de Mestre em
Engenharia Informática, Área de Especialização em
Sistemas de Informação e Conhecimento
Orientador: Ana Maria Neves de Almeida
Co-orientador: Jorge Fernandes Rodrigues Bernardino
Porto, outubro 2017

ii

iii
Resumo
O conceito de Big Data tem tido um grande impacto no campo da tecnologia, em particular na gestão e análise de enormes volumes de informação. Atualmente, as organizações consideram o Big Data como uma oportunidade para gerir e explorar os seus dados o máximo possível, com o objetivo de apoiar as suas decisões dentro das diferentes áreas operacionais.
Assim, é necessário analisar vários conceitos sobre o Big Data e o Big Data Analytics, incluindo definições, características, vantagens e desafios.
As ferramentas de Business Intelligence (BI), juntamente com a geração de conhecimento, são conceitos fundamentais para o processo de tomada de decisão e transformação da informação.
Ao investigar as plataformas de Big Data, as práticas industriais atuais e as tendências relacionadas com o mundo da investigação, é possível entender o impacto do Big Data Analytics nas pequenas organizações. Este trabalho pretende propor soluções para as micro, pequenas ou médias empresas (PME) que têm um grande impacto na economia portuguesa, dado que representam a maioria do tecido empresarial.
As plataformas de código aberto para o Big Data Analytics oferecem uma grande oportunidade de inovação nas PMEs. Este trabalho de pesquisa apresenta uma análise comparativa das funcionalidades e características das plataformas e os passos a serem tomados para uma análise mais profunda e comparativa.
Após a análise comparativa, apresentamos uma avaliação e seleção de plataformas Big Data Analytics (BDA) usando e adaptando a metodologia QSOS (Qualification and Selection of software Open Source) para qualificação e seleção de software open-source.
O resultado desta avaliação e seleção traduziu-se na eleição de duas plataformas para os testes experimentais. Nas plataformas de software livre de BDA foi usado o mesmo conjunto de dados assim como a mesma configuração de hardware e software. Na comparação das duas plataformas, demonstrou que a HPCC Systems Platform é mais eficiente e confiável que a Hortonworks Data Platform.
Em particular, as PME portuguesas devem considerar as plataformas BDA como uma oportunidade de obter vantagem competitiva e melhorar os seus processos e, consequentemente, definir uma estratégia de TI e de negócio.
Por fim, este é um trabalho sobre Big Data, que se espera que sirva como um convite e motivação para novos trabalhos de investigação.
Palavras-chave: Big Data, Big Data Analytics, BI, Big Data Platforms.

iv

v
Abstract
The concept of Big Data has been having a great impact in the field of technology, particularly in the management and analysis of huge volumes of information. Nowadays organizations look for Big Data as an opportunity to manage and explore their data the maximum they can, with the objective of support decisions within its different operational areas.
Thus, it is necessary to analyse several concepts about Big Data and Big Data Analytics, including definitions, features, advantages and disadvantages. Business intelligence along with the generation of knowledge are fundamental concepts for the
process of decision-making and transformation of information.
By investigate today's big data platforms, current industrial practices and related trends in the research world, it is possible to understand the impact of Big Data Analytics on small organizations. This research intends to propose solutions for micro, small or medium enterprises (SMEs) that have a great impact on the Portuguese economy since they represent approximately 90% of the companies in Portugal.
The open source platforms for Big Data Analytics offers a great opportunity for SMEs. This research work presents a comparative analysis of those platforms features and functionalities and the steps that will be taken for a more profound and comparative analysis.
After the comparative analysis, we present an evaluation and selection of Big Data Analytics (BDA) platforms using and adapting the Qualification and Selection of software Open Source (QSOS) method. The result of this evaluation and selection was the selection of two platforms for the empirical experiment and tests. The same testbed and dataset was used in the two Open Source Big Data Analytics platforms.
When comparing two BDA platforms, HPCC Systems Platform is found to be more efficient and reliable than Hortonworks Data Platform.
In particular, Portuguese SMEs should consider for BDA platforms an opportunity to obtain competitive advantage and improve their processes and consequently define an IT and business strategy.
Finally, this is a research work on Big Data; it is hoped that this will serve as an invitation and motivation for new research.
Keywords: Big Data, Big Data Analytics, BI, Big Data Platforms.

vi

vii

Table of Contents
1 Introduction ...............................................................................1
1.1 Problem ............................................................................................ 1
1.2 Objectives ......................................................................................... 2
1.3 Document structure .............................................................................. 2
2 Value Analysis .............................................................................3
2.1 Value Networks ................................................................................... 3
2.2 Value Proposition ................................................................................. 4
2.3 Canvas Model ...................................................................................... 4
3 Context .....................................................................................5
3.1 Context of the work .............................................................................. 5
3.2 SMEs ................................................................................................. 6 3.2.1 Definition of SMEs .......................................................................... 6 3.2.2 Portuguese SMEs ............................................................................ 6 3.2.3 SMEs Innovation as opportunity to grow ................................................ 7
3.3 Related Work ...................................................................................... 7
4 Big Data Concepts ...................................................................... 11
4.1 Big Data .......................................................................................... 11 4.1.1 Types of Big Data ......................................................................... 12 4.1.2 Big Data Characteristics ................................................................. 13
4.2 Big Data Storage and Management .......................................................... 17 4.2.1 Non-relational databases ............................................................... 18 4.2.2 In-Memory Databases .................................................................... 18
4.3 Big Data Analytics .............................................................................. 18 4.3.1 In-Memory analytics...................................................................... 20 4.3.2 Real Time analytics ...................................................................... 20 4.3.3 Big Data Analytical Methods and Decision Making .................................. 20
4.4 Big Data Ecosystems ........................................................................... 22
5 Open Source Big Data Platforms ..................................................... 25
5.1 Apache Hadoop ................................................................................. 26 5.1.1 MapReduce ................................................................................ 27 5.1.2 Hadoop Distributed File System (HDFS) .............................................. 28
5.2 Cloudera ......................................................................................... 29
5.3 Hortonworks Data Platform (HDP) ........................................................... 30
5.4 HPCC System .................................................................................... 31

ix
5.5 Apache Apex ..................................................................................... 32
5.6 Apache Storm .................................................................................... 33
5.7 Apache Drill ...................................................................................... 34
5.8 Apache Solr ....................................................................................... 34
5.9 Apache Spark ..................................................................................... 36
5.10 OS Big Data Platforms Comparison ........................................................... 37
5.11 Summary .......................................................................................... 38
6 Methodology ............................................................................. 41
6.1 Design Method ................................................................................... 41 6.1.1 Research Method .......................................................................... 41 6.1.2 Method for Selecting and Evaluation .................................................. 42 6.1.3 Testing Process ............................................................................ 46
6.2 Agenda for Selection, Evaluation, and Tests ............................................... 47 6.2.1 Platforms Selection ....................................................................... 47 6.2.2 Platforms Evaluation...................................................................... 47 6.2.3 Platforms Tests ............................................................................ 47
7 Evaluation and Selection of BDA Platforms ....................................... 49
7.1 QSOS Method ..................................................................................... 49 7.1.1 Definition ................................................................................... 50 7.1.2 Evaluation .................................................................................. 51 7.1.3 Qualification ............................................................................... 53 7.1.4 Selection .................................................................................... 54
7.2 Method Implementation ........................................................................ 54 7.2.1 Definition ................................................................................... 54 7.2.2 Evaluation .................................................................................. 56 7.2.3 Qualification ............................................................................... 58 7.2.4 Selection .................................................................................... 60
7.3 Summary .......................................................................................... 63
8 Tests and Experiment Comparison .................................................. 65
8.1 Testbed ........................................................................................... 65
8.2 Dataset ............................................................................................ 66
8.3 Queries ............................................................................................ 67
8.4 Experiment Organization ....................................................................... 68
8.5 Hortonworks ...................................................................................... 68 8.5.1 Cluster Manager ........................................................................... 68 8.5.2 Data Acquisition ........................................................................... 69 8.5.3 Data Integration/Representation ....................................................... 70 8.5.4 Analysis and Visual Representation .................................................... 73
8.6 HPCC ............................................................................................... 74

x
8.6.1 Cluster Manager .......................................................................... 74 8.6.2 Data Acquisition .......................................................................... 75 8.6.3 Data Integration/Representation ...................................................... 76 8.6.4 Analysis and Visual Representation ................................................... 77
8.7 Experimental Results and Discussion ........................................................ 80
8.8 Summary ......................................................................................... 84
9 Conclusions .............................................................................. 85

xi

xii
Table of Figures
Figure 1 – Business model canvas of Osterwalder for the present work ..................................... 4
Figure 2 – Big Data characteristics (3Vs) .................................................................................... 13
Figure 3 – Process flow diagram for Big Data Analytics (Prasad and Agarwal, 2016) ................ 19
Figure 4 – Big Data Ecosystem (Granville, 2013) ........................................................................ 23
Figure 5 – Hadoop Architecture (Saraladevi et al., 2015) .......................................................... 27
Figure 7 – Cloudera Impala Status in Hadoop Stack (Prasad and Agarwal, 2016) ..................... 29
Figure 8 – Hortonworks Distribution (Azarmi, 2015) ................................................................. 30
Figure 9 – HPPC environment system (adapted from Furht and Villanustre, 2016). ................. 31
Figure 10 – Apache Apex Architecture (“Apache Apex,” 2016) ................................................. 32
Figure 11 – Storm topology (Wingerath et al., 2016) ................................................................. 33
Figure 12 – Flow of Apache Drill query (“Architecture - Apache Drill,” 2017) ........................... 34
Figure 13 – Apache Solr Conceptual Architecture (Karambelkar, 2013) .................................... 35
Figure 14 – SPARK system overview (Inoubli et al., 2016) ......................................................... 36
Figure 15 – Design Science Research Process Model (Vaishnavi and Kuechler, 2012) .............. 42
Figure 16 – 2017 Gartner evaluation criteria (Gartner, 2017) ................................................... 43
Figure 17 – QSOS Steps (ATOS, Origin., 2013) ............................................................................ 44
Figure 18 – Maturity criteria of a project (ATOS, Origin., 2013) ................................................ 45
Figure 20 – General approach (ATOS, Origin., 2013) ................................................................. 50
Figure 22 – Functionality coverage ............................................................................................ 62
Figure 24 – Ambari Files View .................................................................................................... 70
Figure 25 – Pig script example .................................................................................................... 70
Figure 26 – Structure of the table Complaints in HiveQL ........................................................... 71
Figure 28 – The First row of the table complaints ..................................................................... 72
Figure 29 – Complaints in Wyoming by-product ........................................................................ 73
Figure 30 – Data Visualization in Hive ........................................................................................ 74
Figure 32 – Spray the Data File to your THOR Cluster ................................................................ 76
Figure 33 – Logical File in HPCC .................................................................................................. 77
Figure 34 – Logical File contents ................................................................................................ 77
Figure 35 – ECL Playground ........................................................................................................ 79
Figure 36 – Activities graph ........................................................................................................ 79
Figure 37 – US financial products and services complaints by State ......................................... 80

xiii

xiv
Tables
Table 1 – Big Data Platforms – comparative table ..................................................................... 37
Table 2 – Big Data Platforms – strong points ............................................................................. 38
Table 3 – QSOS Maturity criteria (ATOS, Origin., 2013) ............................................................. 51
Table 4 – Score of functional coverage (ATOS, Origin., 2013) ................................................... 53
Table 5 – Maturity relevance (ATOS, Origin., 2013) ................................................................... 53
Table 6 – Level of requirement (ATOS, Origin., 2013) ................................................................ 53
Table 7 – Platforms ID card ........................................................................................................ 55
Table 8 – Score of maturity criteria ............................................................................................ 56
Table 9 – Score of functionality criteria ..................................................................................... 57
Table 10 – Weighting of maturity criteria .................................................................................. 58
Table 11 – Weighting of functionality criteria ............................................................................ 60
Table 12 – Comparison of total (Maturity)................................................................................. 60
Table 13 – Comparison of total (Functionality) .......................................................................... 61
Table 14 – QSOS Evaluation results ............................................................................................ 61
Table 15 – Minimum Hardware and Software ........................................................................... 65
Table 16 – Dataset field reference ............................................................................................. 67
Table 17 – Test queries............................................................................................................... 68
Table 18 – HDP queries times in seconds ................................................................................... 81
Table 19 – HPCC queries times in seconds ................................................................................. 82
Table 20 – OVERHEAD HDP vs. HPCC ......................................................................................... 83

xv

Acronyms
API
Application Programming Interface
BD
Big Data
BDA
Big Data Analytics
BI
Business Intelligence
BJSON
Binary JavaScript Object Notation
CRM
Customer Relationship Management
CSV
Comma-separated value
DM
Data Mart
DSL
Domain Specific Language
DW
Data Warehouse
ECL
Enterprise Control Language
ELT
Extract Load Transform
ESP
Enterprise Services Platform
ETL
Extract Transform Load
GUI
Graphical User Interface
HDFS
Hadoop Distributed File System
ICT
Information and Communications Technology
IMDB
In-memory database
IoT
Internet of Things
IT
Information Technology
JSON
JavaScript Object Notation
ML
Machine Learning
MPP
Massive Parallel Processing
NoSQL
Non-Relational Databases

xvii
OSS
Open Source Software
Portable Document Format
QSOS
Qualification and Selection of software Open Source
SQL
Structured Query Language
RDBMS
Relational Database Management Systems
RDD
Resilient Distributed Dataset
SQL
Structured Query Language
SSH
Secure Shell
UDF
User-Defined Functions
UI
User Interface
VM
Virtual Machine
XML
eXtensible Markup Language

xviii

1
1 Introduction
Today we observe huge volumes of data that are in constant growth, due to the evolution of technology together with the massive exchange of information. Therefore, it is needed one or more sophisticated platforms to deal with this massive quantity of data. The human being is just one of the main characters within this context, s/he every day handles, stores and manage all kinds of information, accompanied by technological advances and new challenges in data analysis, discovering and above all understanding a little beyond what the traditional platforms can provide.
There are two types of platforms available for handling Big Data - Open Source and Proprietary Software - which are used by all types of organizations to manage their information. However, many of them they do not know the benefits, advantages, and disadvantages that these platforms offer in cost, operation, and management of information.
In recent times all type of organizations are present on the Internet and this channel has a great impact on their business, taking care of what customers want and also serving as a guide for new products and what is offered. This process also highlights the huge deal of information in what has to do with products and services for sale to their consumers.
It is for all this that the main reason to carry out this research work is to analyse in particular the Open Source platforms for Big Data Analytics that best fit in Small and Medium-sized Enterprises (SMEs) and Non-governmental organization (NGO).
1.1 Problem
Nowadays, organizations and companies have opted for the adoption of open source and proprietary software platforms oriented to Big Data to solve problems of handling, management, storage, and analysis of information.
In order to justify this research work, a comparative analysis will be carried out between the open source platforms that can be adopted by SMEs that cannot afford or do not wish to acquire

2
proprietary platforms, with the aim of discovering what kind of platforms and tools would be most suitable for their work environment, the large amount of information they handle and the analysis they need to support their business.
In addition, the present research will help solve problems within the context of Big Data, such as variety, the velocity of data, complementing with the new knowledge that the organizations finally obtain by analysing the data.
Furthermore, the consolidation of existing knowledge in conjunction with the new knowledge that will be obtained as the present work develops.
1.2 Objectives
The main objectives of this work are:
Perform a comparative analysis and investigation of existing open source platforms for
Big Data Analytics (BDA);
Study current industrial practices and related trends in the research area;
Describe how BDA platforms can be adopted by SMEs.
Moreover we can define the following specific objectives:
Investigate concepts related to Big Data.
Identify benefits, advantages, and challenges of open source platforms within the
context of Big Data.
Analyse aspects related to Business Intelligence and generation of knowledge.
Investigate and explain the reality of SMEs in Portugal.
Compare, analyse and test a solution adjusted to the reality of SMEs.
1.3 Document structure
This document is structured as follows: The first part (chapters 1, 2 and 3) of this work gives an introductory overview of the problem behind the research, the followed research objectives, value analysis, context, related work and concepts utilized in this work. In the second part (chapters 6, 7, 8) are explained the research method and agenda, the selection and evaluation, and the tests and experiment. The major conclusions and future work are summarized in chapter 9.

3
2 Value Analysis
In recent years, intellectual capital and intangible assets have been given more importance, giving rise to new questions and studies aimed at evaluating the implications for companies that care about understanding the new business processes, legislators, accountants, and economists. A holistic view of intellectual capital offers today the possibility of redefining value and revenue both at the corporate level and at the macroeconomic level. If we define value only in monetary terms, we do not evolve since the industrial age. However, to really understand how intangibles create value, there are two very important dimensions. The first dimension is how intangibles enter the market as negotiable. The second dimension is how intangibles function as transactional in key transactions that take place in a certain business model (“V. Allee, ‘A Value Network Approach for Modeling and Measuring Intangibles,’ Transparent Enterprise, Madrid, 2002. - References - Scientific Research Publish,” n.d.). If we redefine value according to an intangible perspective, we can think of value in a broader way. Thus, we can exchange knowledge by knowledge or by tangible assets, services or money. Or even by other intangible assets such as customer loyalty. In this new economy, both value and money begin to gain new forms and appearances (Allee, 2000).
The value must be managed, this has the purpose of motivating people, developing skills and promote synergies and innovation, with the ultimate purpose of maximizing the overall results of an organization. Focusing on each process, product/service of a company can improve its overall results, mitigate risks, and increase the competitiveness (Moebius and Staack, n.d.).
2.1 Value Networks
To convert tangible and intangible assets in outputs that are sent to other roles through the execution of the transaction. And, the value is obtained by companies when they convert inputs into earnings. We can visualize the sets of roles, interactions, and relationships that generate economic or social value in value networks. Thus, any organization or activity can be understood in the value network, by analysing the network uncovers the roles, how these interact and the patterns that create (Allee, 2008).

4
2.2 Value Proposition
Our intangible asset is a study (review and evaluation) through which organizations can decide if they want to have an Open Source Platform for Big Data for Analytics. The target customers for this study are the Small and medium-sized enterprises (SMEs) and Non-governmental organization (NGO) in Portugal. This study will help the SMEs and NGO that need to manage, visualize and gain insights from his Big Data, shared data and Open Data. This will save costs to the organization from the cost of Acquisition and Ownership. On the other hand, the study will provide a good option for those who want a platform through can build Big Data valuable information which becomes an asset for making good business decisions and by that gain more competitiveness. This study is unique in that it does not only provide a review of Open Source Big Data Platforms, but it also evaluates the platforms in features, advantages, and challenges.
2.3 Canvas Model
Figure 1 – Business model canvas of Osterwalder for the present work
From this Figure 1, it can be verified in the block ‘Key Partners’ the potential stakeholders of this research work. Comparing with the ‘Customer Segments’, one critical factor can be identified: the involvement of SMEs and NGO. The model showed that SMEs and NGO are not involved, while this research work is intended for use both by interested researchers and organizations, as can be seen in the block ‘ Customer Segments’ in Figure 1. The other critical factor that can be derived regard the ‘Key Activities’, can all the significant Platforms be covered by this research?

5
3 Context
In organizations, data is created, which brings about the need for large storing capacity and the need for extracting it to obtain its value. In this chapter presents the context of the study, SMEs and related work.
3.1 Context of the work
This research work, therefore, provides an analysis of big data analytics. We also discuss appropriate and open source tools that are used in this analysis of big data as well as the technologies that are applied and how they are applied. For instance, there are issues to do with storage, capture, sharing, search, visualizing as well as analytics. Presently, organizations explore large data volumes that are highly detailed to discover the facts that they were not aware of initially. Therefore, the analytics of big data is where improved data analytics are used in huge sets of data. However, the larger the data set, the more the complexity of managing it (Morshed et al., 2016).
In this work, it is important to figure out the data waste due to inefficient storage; which means that the data about people, organizations or any other incidents, different transactions performed, or other aspects that need to be storage are lost directly after they are used. In this aspect, organizations would find it difficult to get back important data as well as the knowledge that they may need in future after they were used. Also, organizations would find it difficult to perform a detailed analysis and provide new advantages and opportunities to their stakeholders. Some data that ranges from names of customers, as well as their addresses to the available products to the purchases acquired as well as the employees recruited, has become important for daily operations of organizations (“Ventana Research,” 2014). Data is the building block on which all organizations thrive (Elgendy and Elragal, 2014).
With this data, it is even more evident that technology is imperative in data storage and its recovery. Technological advancements contribute to an increase in capabilities to store more data as well as more methods of collecting this data. Additionally, huge data amounts have been made easily accessible (Inoubli et al., 2016). Many organizations still deal with the flood of data created by IT systems and internet. Which includes data generated by the social

6
interactions, sensor data but also by business systems(Belo et al., 2013). This flood is not a problem but an opportunity for companies in particular for SMEs that can have an opportunity for growth if they can turn that data into knowledge with the right tools. Although the data is too much and difficult to manage and analyze, companies know that data and its analysis can become a strategic and competitive advantage (Sivarajah et al., 2017).
3.2 SMEs
Information and Communications Technology (ICT) has a significant impact on organizations, SMEs are trying to adopt IT systems to support their business. The adoption of these systems in SMEs is distinct from adoptions in larger organizations, due to their specific characteristics, such as resources constraints (Ghobakhloo et al., 2012). In the next section the most important definitions and characteristics, as well the strategy and innovation in Portuguese SMEs are discussed.
3.2.1 Definition of SMEs
According to European Union (EU) (European Union, 2016) for a company is considered SME; the company must be included in three categories:
Micro company: less than ten employees and an annual turnover or
balance sheet of fewer than two million euros.
Small company: less than fifty employees and an annual turnover or
balance sheet of fewer than ten million euros.
Medium-sized company: less than two hundred and fifty employees and an
annual turnover of fewer than fifty million euros or a balance sheet of fewer
than forty-three million euros.
Only 10% of all business in EU is from large companies, thus, SMEs represent 90% of all businesses. The SMEs stimulate the entrepreneurial and innovative spirit and help to promote competitiveness, economic growth, and employment in Europe.
3.2.2 Portuguese SMEs
According to Arendt (2008), all SMEs in Portugal have computers, and almost all have an internet connection. The SMEs use ICT mainly for customer relations such as email communication, sending pricelists, invoices, also use for marketing, logistics, customer Attention, HR management, payments, resource management, training and financial management, but with less expression. In Portugal, SMEs are ready to use ICT for logistical purposes, HR management, and business resources management.
It is clear that SMEs are investing in ICT for business purposes, and most importantly, training employees with e-learning officers. Today the knowledge and training of IT skills of

7
entrepreneurs, managers, and employees are crucial in to reduce the digital divide between SMEs and large companies (Arendt, 2008). Having IT-skilled employees in a given technology is significantly determinant in the decision-making process of adopting this IT technology (Barbosa and Faria, 2008). If the companies do not have the necessary skill must ponder adopting and diffusing new IT systems from a strategic point of view and evaluating them like any other investment. Some SMEs are conscious of the potential of ICTs, especially in the technology and retail sectors, who believe that the adoption of new systems increases their performance in process integration, efficient management and rapid response to demand. (Belo et al., 2013)
Arendt (2008), presented a comprehensive survey of the adoption of ICT by the Portuguese SMEs, and conclude that the most significant obstacle to adopting new ICTs is the lack of financial resources, and others such as lack of appropriate software, knowledge, and ISP.
Although some Portuguese SMEs are well equipped with ICT, they do not take advantage of the opportunities ICT offers (Arendt, 2008).
3.2.3 SMEs Innovation as opportunity to grow
According to Salavou, Baltas and Lioukas, SMEs preferably use product innovations to gain competitive advantage contrasting with large companies that use other paths, such as economies of scale, diversification and investment in new products (Barbosa and Romero, 2014).
Effective use of Information and Communications Technology (ICT) by enterprises it is a decisive factor for success in their competitiveness, innovation, and growth (Morais et al., 2011).
Recognizing the importance of SMEs as the backbone of EU economy, the EU and its members periodically introduce incentive programs for SMEs, such as research, competitiveness and
innovations (European Union, 2016). Example of this kind of programmes is the ‘Portugal 2020’1 which focuses on the alteration of certain points such as: strengthening of the organization and management capacities of SMEs, specific qualification of assets in areas relevant to the strategy of innovation, internationalization and modernization of enterprises, in order to promote the development of more productive activities in Knowledge and creativity and with a strong incorporation of national added value. This program identifies the need of Insertion of SMEs in the digital economy with the use of ICT. Thus, there is a great incentive and opportunity for SMEs for a Big Data Analytics strategy.
3.3 Related Work
Multiple research works have been done to compare and evaluate existing Big Data platforms some research focus on a specific capability, technology or purpose.
1 http://www.poci-compete2020.pt/portugal2020

8
Almeida and Bernardino (2015) focus on the capability of mining data, and in a mix of technical parameters and features that are suitable for Small and Medium Enterprise environments.
On the other hand, Morshed and others (2016) focused their work on Platforms addressing distributed real-time data analytics, and concluded that the platforms present on their research do not cover all the features that are required for distributed computation in real-time.
Miller, Bowman, Harish, & Quinn, concentrate their work on platforms written in a certain programming language, in this case SCALA, that is a new programming language that supports both the object-oriented and functional programming paradigms built on top of JAVA (Miller et al., 2016).
Landset et al. (2015) presented a comprehensive survey of open source tools for machine learning with big data in the Hadoop ecosystem to researchers or professionals in machine learning but is inexperienced with big data. Also, Inoubli et al. (2016) discuss and presents the best practices using Big Data platforms in the domain of machine learning, graph processing and other applications, this was accomplished by doing an experimental evaluation and comparative study of three Big Data platforms.
Sagiroglu and Sinanc (2013) provides an overview of big data such as samples, methods, advantages and challenges. They compare Hadoop and HPCC by their architectures, primary languages, and indexes in a Distributed File System, data warehouse abilities and performance tests where HPCC shows the best results.Another recent paper describes an experiment with 40-node using Hadoop Platforms (Hortonworks, Cloudera or Apache), Spark for streaming data processing, HBase and OpenTSDB to store time series sensor data. The authors present the characteristics, requirements, and configurations of Hadoop platforms (Liu et al., 2016).
Bhadani and Jothimani (2017) present a comprehensive view of areas that can benefit from Big Data Analytics its advantages and limitations. They also analyse the Big Data tools and point out issues and future directions.
Yang et al. (2016) focus their research on Big Data tools and how they can be applied in the industrial context, and propose an architecture for the development of an open source platform for Big Data analytics to use in the industry.
In Chang et al. (2017) introduce new approaches to integrate analytics tools that use the R programming and so them to create a high-performance Big Data analytics platform and also they develop a method for job scheduling using MSHEFT algorithm. They conclude that their approach is capable of integrating new analytics platforms by adding tools that use R programming.
Cao et al. (2017) propose a unification framework that allows a generic abstraction at the top of the Big Data platforms that resulted from the comparison of some Big Data platforms.
In kejariwal et al. (2015) present an in-depth overview of streaming analytics in Big Data, discuss applications, algorithms and open source platforms. Finally, they identified future and current challenges.
Memon et al. (2017) point out the advantages and the simple way to use "big data platforms" in a distributed environment. They also do a systematic review of new developments in the area

9
of "big data" technologies, giving some focus on the application of "big data" in the area of health.
So these were few related works which do evaluate based on specific capability, technology or purpose. Our work contributes into the identification of the Big Data platforms for analytics that may be suitable for SMEs in their operations.

10

11
4 Big Data Concepts
This chapter contains some of the essential concepts in Big Data, Big Data Storage and Management, Big Data Analytics, Big Data Ecosystems in order to systematize the concepts associated with this work.
4.1 Big Data
The appearance of the term “Big Data” might be traced back to the early 1980’s of the by the time scientists acknowledged that they failed to build the tools to analyze datasets of big size (Yan, 2013). During that era, Big Data was just quite a few hundreds of megabytes. However, currently, datasets of terabytes are frequent. Today the term Big Data still draws much attention, but behind the exaggerated publicity, there is a simple story. For decades, companies have been making business decisions based on transactional data stored in relational databases. In addition to the critical data, however, is a potential treasure trove of non-traditional data, less structured: blogs, social media, email, sensors, and photographs where we can extract useful information (Dijcks, 2013).
Big Data alludes to new ways for government and business organizations to combine miscellaneous digital data sets and after that use statistics and other data mining techniques to extract from them both occult information and astonishing correlations (Rubinstein, 2012).
According to Beyer, Big Data is “High volume, high velocity, and/or high variety information assets that require new forms of processing to enable enhanced decision making, insight discovery and process optimization” (Beyer and Laney, 2012).
Dumbill defines Big Data as “data that exceeds the processing capacity of conventional database systems. The data is too big, moves too fast, or doesn’t fit the strictures of your database architectures. To gain value from this data, you must choose an alternative way to process it.” (Dumbill, 2013).
In short, Big Data is a slogan that describes an enormous volume of structured, semi-structured and unstructured data that is so big that it’s difficult or impossible to process using traditional database systems and software techniques, in other words, Big data refers to a large data set

12
due to its complex characteristics is difficult to be acquired, processed, stored and analysed in order to satisfy to what we intend in time with traditional technologies and techniques.
For many, there is no difference in the use of the term's "Big Data" and "Big Data analytics". In general opinion "Big Data" does not simply allude to the issue of data overburden (engineering problem), but additionally alludes to analytical tools used to deal with the flood of data and transform that flood into a source of gainful and useable data (Maltby, 2011). In this respect, the McKinsey Global Institute describes Big Data as “datasets whose size is beyond the ability of typical database software tools to capture, store, manage, and analyse” (Big data, 2011).
4.1.1 Types of Big Data
Organizations collect all sorts of data; these are structured, semi-structured and unstructured (Gandomi and Haider, 2015). But typically the types of Big Data are loosely structured. With the constant addition of new types of data, the structure and relationship between the data are constantly evolving. The technological advances of the last years lead to high rate of data generation. In organizations, the source of unstructured data is internal (Sensor-data) and external (Social-Media) (Gandomi and Haider, 2015) and both (Activity-Transactional).
4.1.1.1 Sensor-Data (Internet of Things – IoT)
The huge deployment of connected devices such as cell phones, cars, RFID readers, webcams, and sensor systems adds a countless of autonomous data sources (Sharma and Navdeti, 2014). This machine data could be web logs, computer logs, mobile devices location (Sabapathi and Yadav, 2016), networking hardware devices, sensors from smart cities, such as utility poles, water lines, transportations and traffic lights. This type of data is a meaningful source of Big Data (Inoubli et al., 2016). With cloud computing becoming more and more omnipresent, it is anticipated that machine-generated data will grow by 40% of digital universe by 2020 (Kejariwal et al., 2015).
4.1.1.2 Social-Media Data
This type of Big Data is human sourced and less structured data, it is generated from various types of Internet Applications such as blogs, social networks, business networks, shared photographs and videos (Inoubli et al., 2016). It is a potential treasure trove of non-traditional data where we can extract useful information (Dijcks, 2013).
4.1.1.3 Activity-Transactional Data
Structured Data from traditional databases, generated from business transactions with information about customers, suppliers, and activities, e.g., Customer Relationship Management – CRM, e-commerce environments, (Prasad and Agarwal, 2016), and logs (e.g., web and network logs) (Sivarajah et al., 2017).

13
4.1.2 Big Data Characteristics
Big data can be defined by three characteristics of the data (Khan et al., 2014; Laney, 2001; Zikopoulos et al., 2011), first introduced by Doug Laney in 2001:
• Volume, the quantity of data;
• Variety, the types of structured data and unstructured;
• Velocity, the rate of generation, catchment, processing, and transmission.
Figure 2 – Big Data characteristics (3Vs)
Beyond the exponential increase in volume, two other characteristics of the data changed significantly.
Data flood, a consequence of machine data, this device create continuous
data streams without human intervention, expanding the velocity of data
collection and velocity needed for all processes (real-time and batch
processing) (Sharma and Navdeti, 2014).
Data is very varied. Almost all of newly created data comes from camera
images, video, and surveillance footage, blogs, social networks, forums, and
e-commerce catalogues. All of these unstructured data sources contribute
to a much higher variety of data types (Jeseke et al., 2013).
Oracle characterizes Big Data as huge datasets that are challenging to store, search, share, visualize, and analysing. At the first look, seems that those orders of magnitude exceed data processing from conventional technologies and the largest Data Warehouses (DW) (Oracle, 2013).
Variety
•Stuctured
•Structured & Unstructured
Velocity
•Batch
•Streaming Data
Volume
•Terabytes
•Zetabytes

14
With the development of discussion and enhancing interest in Big Data, considering Big Data analytics and developing Big Data strategy, the first three characteristics (three V’s) have been expanded with the following (Rijmenam, 2013; Yan, 2013):
Veracity, integrity of data;
Value, usefulness of data;
Complexity, degree of interconnection among data structures;
Variability, unpredictability of data;
Visualization, seeing the data;
Veracity, the integrity of data.
In conclusion, by reviewing the existing literature, it was found that big data can have these seven characteristics in forms of Vs, in the next points these Vs will be described in detail.
4.1.2.1 Volume
As mentioned above, managing large and rapidly increasing volumes of data has been a challenging issue for many years. The term “Big” in big data suggests to massive volumes of data, users must view this as a relative term (Olofson and Vesset, 2012). The size of a conventional structured DW is sized in terabytes and petabytes, Big Data is sized in petabytes or exabytes, and maybe soon in zettabytes (Oracle, 2013). This size used to determine if a particular dataset is considered Big Data is not solidly characterized and continues to change over time. This is a bit a moving target increasing with available computing power. Moreover "big" volume is not just relying on the available computing, but additionally on other characteristics and usage of data. (Maier, 2013). The volume of data, is exploding (Akerkar, 2014), in which data created inside organizations, outside or both and it can originate from devices, networks and people interaction on the internet like social networks that plays a key role, and also the volume of data that will be analysed is immense (Sharma and Navdeti, 2014).
4.1.2.2 Variety
The complex nature of Big Data is principally determined by the unstructured nature of a great part of the data that is produced by a huge number of different data sources with diverse data types, like that from:
social networks, e.g., Twitter responses, Facebook Likes, Pinterest;
sensors and machine data, e.g., biosensors, ventilation equipment, smart
meters; RFID Readers;
vehicles, e.g., planes, trucks;
web searches, emails, website links, pictures;
computers, cell phones, and others.
Some of this data is called semi-structured because it does not have any defined format, but their structures can be derived based on various patterns of the data (Gudipati et al., 2013). In most instances, so as to successfully use of Big Data, it must be joined with structured data

15
(transactional) from multiple conventional business applications such as Enterprise Resource Planning (ERP) or Customer Relationship Management (CRM) (Navint, 2012). The variety characteristic of big data is all about trying to acquire all of the data that relevant to the decision-making process (Zikopoulos et al., 2013). Traditional data formats have the trend to be well defined by a data schema and to have slow changes. In opposition, non-traditional data formats have a high rate of change. As new services are added, new sensors deployed, or new marketing campaigns executed, new data types are needed to capture the resultant information (Dijcks, 2013).
4.1.2.3 Velocity
The speed of creation of new data, this characteristic of Big Data is mostly due to the universal nature of present day on-line (data in motion), increasing channels, real-time data capture/creation systems, devices and networks, and in addition the need to integrate streaming information into business processes and decisions. It is normal that this rate of grown will keep on increasing for a long time to come (Oracle, 2013)(Navint, 2012)(Schroeck et al., 2012). Velocity means how data flow, at high rates, in increasingly distributed technologies and nodes. Velocity must handle and react with the streaming data, we can distinct two data stream:
streams of new data (potentially from a variety of sources and types) being
progressively incorporated into existing (huge) datasets;
streams of query results (potentially huge) to user requests (Cuesta et al.,
2013);
Often time-sensitive, streaming data must be analysed with millisecond response times to support real-time decisions (Soares, 2013). So, velocity signifies how rapidly data is generated, required and served (Cuesta et al., 2013).
As the perception of what is considered "big" volume changed over time, today the perception of real-time is not the same as it was in the mid-1990s when real-time was usually used for almost instantaneous monitoring, updating, or some activities that are around timely data processing. Today in an ultra-fast world without wires, this perception has assumed a new dimension (Kudyba, 2014).
4.1.2.4 Variability
The unpredictability of data and how these may change over time (Akerkar, 2014). Can be really pertinent when executing sentiment analyses. Variability signifies that the meaning can be altering (quickly). In the same tweets, a word can have a completely different significance, for example, the word "impact" can be used as a noun or a verb. So as to perform an appropriate sentiment analyses, algorithms need to have the capacity to comprehend the context and have the capacity to find the exact meaning of a word in that context (Rijmenam, 2013). Can exist changes from the structure of the data and how users need to think of that data (Fan and Bifet, 2013);

16
The variability may be present in the inconsistency of data streams, the rate of these flows can be quite variable, i.e., daily, seasonal or due to events peaks loads can be challenging to manage (Troester, 2012),(Katal et al., 2013),(Inukollu et al., 2014).
4.1.2.5 Visualization
Doing all of that vast quantity of data understandable in a manner that will be clear to see. Using the correct analyses and visualizations, raw data might be used in other case data continues to be useless. Having the ability to combine interactive data explorations with some analytics and visualization could create new insights that were probably hidden (Akerkar, 2014), e.g., a dataset of geo-located crimes or flu cases, or real-time data with local info from feeds can be analysed in a map. Thus, we can see where crimes happen or the source of the outbreak, or prevent something that could occur in location based information from feeds. This can be a hard aspect of Big Data;
4.1.2.6 Veracity
This is uncertain data, refers to the level of reliability regarding certain types of data (Schroeck et al., 2012), or the degree of that one leader has to be able to use certain information to make a decision (Zikopoulos et al., 2013). Possessing plenty of data in various volumes arriving in high velocity can be useless in a case in which data is incorrect. Thus, due to the high rate of arrival of these large volumes of data which need to be processed is difficult to cleanse them consistently and perform the pre-processing to improve data quality. This effect is more pronounced when dealing with the variety (Cuesta et al., 2013). To mitigate this effect is essential to assure the consistency and cleanliness of the unstructured data and the variety of many sources (Ebbers et al., 2013). Many data is inherently uncertain, e.g., sentiment and truthfulness in humans (typed human errors, ill intentions); GPS sensors bouncing, weather conditions (Schroeck et al., 2012). Completely wrong data could cause a plenty of problems for organizations and also for consumers.
In Big Data the quality issues are a reality, and veracity is what generally is used to refer to this problem domain (Ebbers et al., 2013). It is believed that one in three business leaders do not trust the information that they use to make decisions is a strong indicator that veracity is a very important aspect in Big Data (Maier, 2013; Zikopoulos et al., 2013).
However, even with uncertainty, the data still includes valuable information (Schroeck et al., 2012). Consequently, organizations must make sure that this data is right and also the analyses done on the data are right (Rijmenam, 2013);
4.1.2.7 Value
This characteristic measures the data utility in decision making (Kaisler et al., 2013). Big Data
technologies are now seen as facilitators to create or capture value from data than other
technologies have not been fully explored (“Big Data - A New World of Opportunities,” 2012),
e.g., capturing and processing a larger data set of non-traditional data, can unveil good
information can unveil hidden good information. Thereby, it can bring a business value that
offers the organization a real advantage, as a result of the capacity of making decisions based

17
on giving answers to questions which were thought in the past that were out of reach (Fan and
Bifet, 2013).
4.2 Big Data Storage and Management
Organizations need to deal with a few perspectives when managing this data. In the last few years, the amount of data used in organizations has become tremendous (Elgendy and Elragal, 2014; Khalifa et al., 2016). Firstly, knowing how and where this data is stored after it is acquired. To deal with structured data the conventional methods are Relational Database Management Systems (RDBMS), Data Marts (DM), as well Data Warehouses (DW). Under these, data is moved to storage from its operational systems making use of some methods, such as Extract, Transform, Load (ETL) or Extract, Load, Transform (ELT). These two unique methods are utilized to extract data from outside sources, and then transform the data to fit the operational needs, and at the end load that data to databases, DM or DW. At long last, this data is transformed, organized before it is made accessible for mining and or additionally for online analytics (Elgendy and Elragal, 2014). But, the present Big Data platforms also requires the utilization of Magnetic, Agile and Deep (MAD) analyses techniques (Elgendy and Elragal, 2014; Sharma et al., 2017). These analytics techniques are unique in relation to the traditional Enterprise DW platforms, in MAD all type of sources aren’t limited to traditional sources (structured) that must be cleansed and integrated. In any case, because of data omnipresence these days, Big Data platforms should be Magnetic, which implies that they may captivate new sources of data paying little attention to their quality. Moreover, given the increasing number of data sources as well as the sophistication of data analysis, Big Data storage should enable analysts to easily produce and adapt data quickly. It is required an Agile database that easily ingests, digest, produce and adapt data quickly with data evolution, and also need deep data analyses, to study huge datasets by drilling up and down in data repository (Elgendy and Elragal, 2014; Sharma et al., 2017). In such manner, a few solutions are given, and they run from systems that are distributed and
with Massively Parallel Processing (MPP) databases, which is utilized in Big Data platforms to
permit high query performance and platform scalability to non-relational or in-memory
databases. Recently, non-relational databases, generally known as NoSQL databases, capable
of store and manage unstructured, and non-relational data. These databases are capable of
massive scaling, schema free, and simply to develop and deploy (Miller et al., 2016). Another
great advantage over relational databases is the separation of the data management and data
storage in the application and organization. These databases focus on high-performance
scalable data storage and let data management tasks to the application layer. Also, perform in-
memory database they do not require data input and data output on disk, and that saves a lot
of response time from a database (Elgendy and Elragal, 2014). For a better understanding of
the mentioned technologies, in the following subsections of this subchapter, will be described
NoSQL databases and In-Memory Databases.

18
4.2.1 Non-relational databases
One of the most important information management style to handle Big Data are the NoSQL systems which are ideal for handling multi-structured data (Chandrasekhar et al., 2013).
In the last years, the use of non-relational databases considerably increased due to the advantages, such as scalability, highly available, fault-tolerant, and capable of handle heterogeneous data (Murthy and Bowman, 2014).
The non-relational databases or Not Only SQL (NoSQL) can be placed into four categories according to different optimizations (Kabakus and Kara, 2016; Kune et al., 2016):
Key-value store: uses a set of key-value (k, v) pairs. In this concept, the table is known
as "hash table" has two columns, one for the key and the other column for the value.
The value can be a single value or a data block with various values.
Document store: It is a document-oriented database, this database store, retrieve and
manage document oriented and semi-structured data. Also uses key-value (k, v) pairs
to encode or encapsulate other key-value pairs in some standard such as eXtensible
Markup Language (XML), JavaScript Object Notation (JSON) or Binary JavaScript Object
Notation (BJSON).
Column family: Rather store single key-value (k, v) pairs, they are organized according
to the relationship of data and stored as a set of rows and columns.
Graph database: Data is stored and modelled as a graph representing a collection of
nodes and edges to represent relationships between nodes.
4.2.2 In-Memory Databases
It is a current trend to use In-memory database (IMDB) in the field of processing large volumes of data (Brusakov and Botvin, 2017) quickly (Stimmel, 2014). An In-memory database is a database management system, these systems store data in the RAM memory of the machine, thus avoiding storing data on disk input/output (Scheffler and Otyepka, 2014). The in-memory database should only save data (e.g. logs and snapshots) to disk to guarantee system reliability, all operations must be carry out completely in RAM (Brusakov and Botvin, 2017).
This allows faster responses times, almost in real-time (Elgendy and Elragal, 2014; Scheffler and Otyepka, 2014). IMDB supports structured and unstructured data witch benefits in-memory analytics, with useful response time for real-time analytic visualization and data exploration (Stimmel, 2014).
4.3 Big Data Analytics
19
Big Data Analytics is becoming more and more a trending practice that many companies are adopting with a purpose to build Big Data valuable information (Sivarajah et al., 2017). The main objective of Big Data Analytics is to become an asset for making business decisions, making possible to data scientists, and other analytics professionals to analyze enormous volumes of transaction data, also other formats of data that may be other Business Intelligence (BI) can't explore (Sabapathi and Yadav, 2016).
Presently, organizations explore large data volumes that are highly detailed to discover the facts that they were not aware of initially. Therefore, the analytics of big data is where improved data analytics are used in huge sets of data. However, the larger the data set, the more the complexity of managing it (Morshed et al., 2016). Platforms oriented to Big Data Analytics are the greater promoters of the paradigm shift of Big Data. These platforms manage large volumes of data and also work as an application of various analytical techniques to make sense from large volumes of data (Miller et al., 2016).
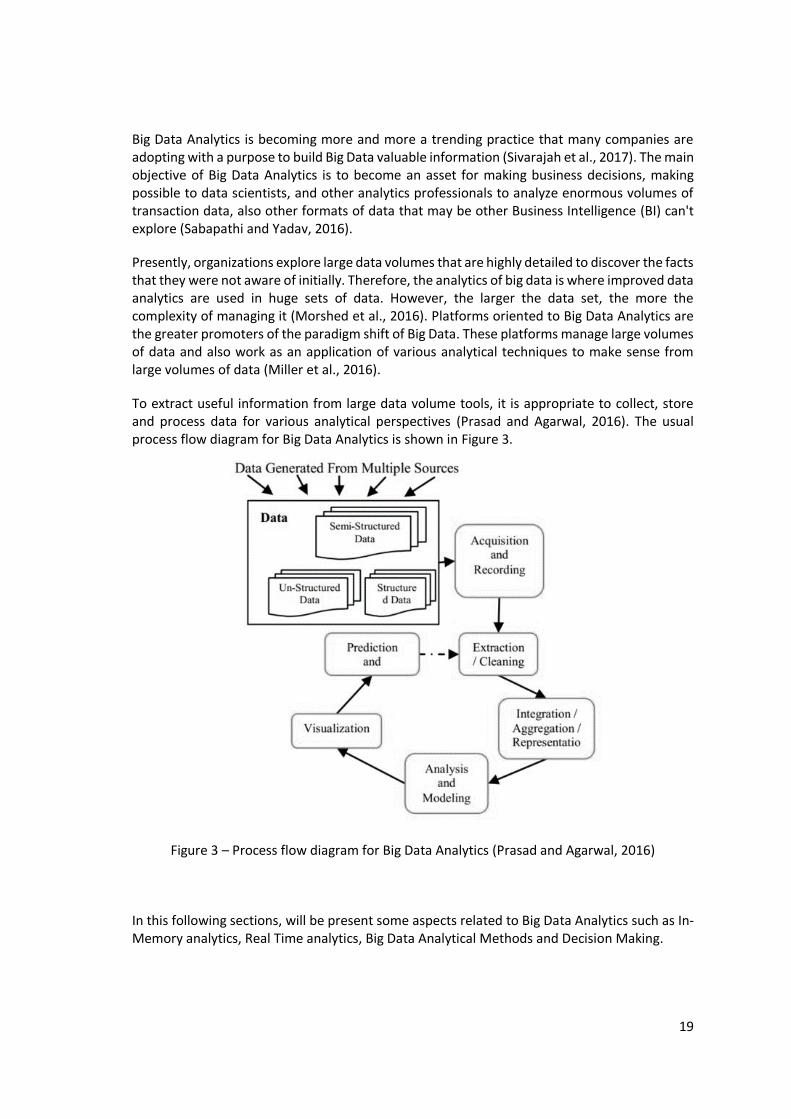
To extract useful information from large data volume tools, it is appropriate to collect, store and process data for various analytical perspectives (Prasad and Agarwal, 2016). The usual process flow diagram for Big Data Analytics is shown in Figure 3.
Figure 3 – Process flow diagram for Big Data Analytics (Prasad and Agarwal, 2016)
In this following sections, will be present some aspects related to Big Data Analytics such as In-Memory analytics, Real Time analytics, Big Data Analytical Methods and Decision Making.

20
4.3.1 In-Memory analytics
The utilization of IMDB has brought an improvement in analytic processing. As a matter of fact, many organizations are raising Hybrid Transaction/Analytical Processing (HTAP) that allows transactions and analytic processing in the same in-memory database (Sabapathi and Yadav, 2016). The results of analytics are more faster with better query response times, thus BI applications can support faster business decisions (Kune et al., 2016).
4.3.2 Real Time analytics
The high velocity that today the data flows from diverse real-time data sources bring a huge opportunity for streaming analytics (Kejariwal et al., 2015), an example of some use cases are:
Visualization of business metrics in real-time
Providing highly personalized experiences
Providing a response during catastrophe or emergencies.
This real-time interactive analytics are normally exploratory in nature, the user is online and submits a query and expects to receive the results in seconds. It is critical a low response time in such applications that supports real-time analytics, contrasting with offline and batch-oriented analytics tools that are unfit for this real-time analytics (Zhang et al., 2014).
4.3.3 Big Data Analytical Methods and Decision Making
In this section is described the analytical methods and the opportunities for decisions makers that Big Data Analytics brings to companies.
4.3.3.1 Methods
The current technologies developments as well as the expansion in large numbers of data produced every day, it is required analytical methods more efficient and faster for support decisions. It is already recognized that BD can help and improve decision making and increase productivity in organizations, it is possible when selecting appropriate analytical methods to extract the meaning of the data, such as (Sivarajah et al., 2017):
Predictive analytics: It is related to forecasting and statistic modelling to determine
future scenarios.
Prescriptive analytics: It is related to optimization and random testing to assess how
the business can improve its service levels while lowering its costs.
Descriptive analytics: This method examines the data and information to define the
current state of the business, where what is happening is based on incoming data. The
developments, patterns, and exceptions are evident. Usually, reports, dashboards, and
alerts are used.

21
Inquisitive analytics: Is concerned in discerning data to accept or reject a business
hypothesis, questions such as, what, how, what if. For example, analytical drill/drowns,
statistical analysis, and factor analysis.
4.3.3.2 Big Data Analytical Decision Making
Elgendy and Elragal identify the opportunities that Big Data Analytics brings to companies which include Small and Medium-sized Enterprises (SMEs), those include:
Customer Intelligence: BDA can benefit business areas such as retail, banking, and
telecommunications. By analyzing the data, the companies will be able to segment
the customers based on their socio-economic characteristics and also to increase
the levels of customer satisfaction. Also, companies could decide and make better-
target social-influencer marketing and identification of sales and market
opportunities.
Supply Chain: BDA can help predict demand shifts, and according to demand adjust
supply. Areas of business such as manufacturing, retail, transport, and logistics-
related industries may benefit from these forecasts.
Performance Management: Performance management can be optimized by the
healthcare industries due to the increasing need to improve productivity, and staff
performance information can be monitored and predicted. In companies can be
monitored and predict the performance of staff with predictive analysis, thus
aligning all departments in the strategic objectives which lead to increased
efficiencies.
Quality Management and Improvement: Big Data Analytics can be used in quality
management and increase profits, reduce costs by improving the quality of
products and / or services. Areas of business such as manufacturing, energy and
utilities and telecommunications could benefit of quality management, e.g., in the
manufacturing process the performance variability can be mitigated by doing
applying predictive analytics, but also to avoid quality problems by giving early
warning. In the area of health with the storage of records about patients and the
healthcare provided along with the use of BDA, there is an opportunity to mine the
data (without identification of the patients) to assess the quality of the healthcare,
as well as manage the diseases and health services.
Risk Management: BDA offers opportunities in risk management benefits
companies from the banking, investment, and insurance sectors. For the financial
investment sector, Big Data Analyses can be made to aid in the selection of
investments based on the probability of gains and losses.
Fraud Detection: Big Data Analytics can be used to detect and prevent fraud in areas
of industries such as banking and insurance, and government departments. Thus,
using BDA systems with prevalent fraud pattern data allows systems to learn new
types of fraud and delivery alerts.

22
4.4 Big Data Ecosystems
The ecosystem of big data includes several aspects such as data, the lifecycle models of big data, and finally the infrastructure that is used for support (Murthy and Bowman, 2014).
The maturity of big data and predictive analysis leads to more open source contributors to the technologies used to empower the solutions. Presently, all types and sizes of vendors are making use of open sources for big data processing and the predictive analytics process (Pääkkönen and Pakkala, 2015). In some cases, the cloud, as well as open sources for storage and computing, is the technological catapults that enable start up and an emergence of small companies to compete with the more established ones (Sen et al., 2016).
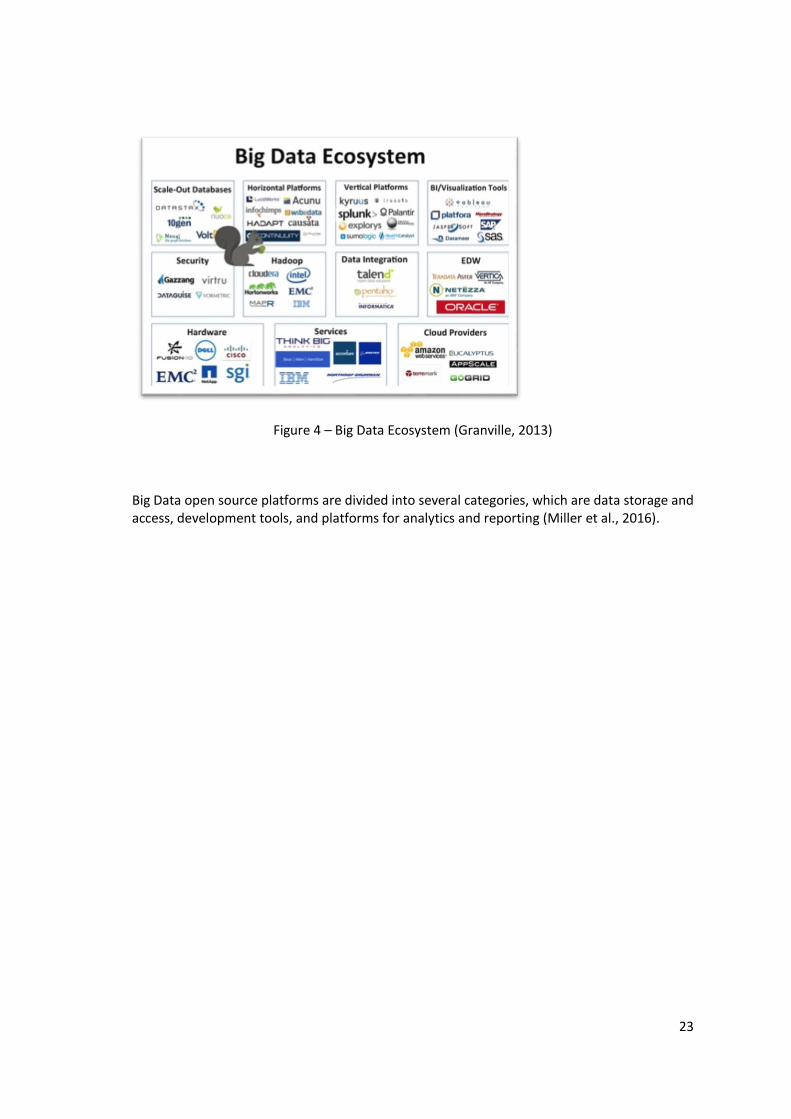
Granville and Sqrrl2 (2013) points out 11 large segments (see. Figure 4) that the Big Data Ecosystem consists, such as:
1. Hardware: Providers of hardware systems and disks for Big Data software.
2. Services: Providers of services to support strategy and implementation of Big Data
solutions.
3. Cloud: Some organizations run their Big Data in public, private or both clouds.
4. Enterprise Data Warehouse (EDW): Vendors of relational databases.
5. Data Integration: Vendors of solutions that assist in getting data into Big Data
Platforms or Scale-Out databases.
6. Hadoop: Hadoop commercial platforms with HDFS and related Apache projects.
7. Security: Vendors of security tools for encryption and key management, expressly
created for Big Data.
8. Scale-Out Database: Vendors of NoSQL and NewSQL databases.
9. Horizontal Big Data Platforms: Some of these platforms are built on top of Hadoop
and provide additional data analysis capabilities that go beyond those existent in
Hadoop.
10. Vertical Big Data Platforms: Comparable to Horizontal Big Data Platforms, but
concentrated for a particular vertical industry.
11. Business Intelligence and Visualization: Tools for interpretation and visualization of
queries results on dashboards and static reporting for data present in Hadoop.
2 https://sqrrl.com/
23
Figure 4 – Big Data Ecosystem (Granville, 2013)
Big Data open source platforms are divided into several categories, which are data storage and access, development tools, and platforms for analytics and reporting (Miller et al., 2016).

24

25
5 Open Source Big Data Platforms
In this chapter, several concepts and aspects with respect to the platforms of Big Data will be present. For this, the literature used is mostly from the scientific community, together with publications of a technical nature related to this thematic.
For Gupta and Gupta (2014), any platform that of support the massive amount of data that other traditional database tools cannot support can be considered a Big Data Platform (Almeida and Bernardino, 2015).
A Big Data platform should be a solution that is specifically designed to meet the needs of the organization in mind (Chandrasekhar et al., 2013). Thus, the basic functionalities that should be offered are:
Full-Stack: It should provide a wide foundation for the support of all three
Big Data tasks - Volume, Variety, and Velocity.
Enterprise-ready: It should incorporate the features driven for performance,
security, usability and reliability.
Incorporated: It should easily simplify and accelerate the implementation
of Big Technological innovation for organizations.
Open Source based - It should be an enterprise-class product in both
performance and integration.
Updates and Low latency flows
Solid and fault-tolerant
Scalability
Extensible
Allows ad-hoc queries
Little maintenance.
This work highlights the working characteristics of some Platforms for Big Data, and also aim to explain the working advantages of open source analytical platforms that are not limited to their ecosystem but also complement each other such as:

26
Apache Hadoop
Cloudera Impala
HPCC System
Apache Spark
Hortonworks Data Platform (HDP)
Apache Apex
Apache Storm
Apache Solr
Apache Drill
Other platforms have been identified but are not currently in the study, such as:
Apache Kudu
Lumify
Flink
Samza
Apache Ignite
Nvidia Cuda
MLPACK
Mahout
Berkeley Data Analytics Stack
S4
R Project
Pegasus
Graphlab
CreateTM
Chukwa
Elasticsearch
Ikanow
Pentaho Community
Apache Tez.
5.1 Apache Hadoop

27
The Apache Hadoop is a free software library, a project of the Apache foundation that
implements the MapReduce3 paradigm and the Hadoop Distributed File System (HDFS) as a filesystem.
This open source platform allows distributed processing of large data sets across clusters of servers using simple programming models, which one cluster is designated as the master node and other as slave node (Prasad and Agarwal, 2016).
This platform has been projected to scale from one server to thousands of servers where each has local processing and storage (“ApacheTM Hadoop®,” 2016).
The two most important components that characterize the platform are MapReduce and HDFS, where MapReduce supports analysis of data and HDFS supports storage of data (Saraladevi et al., 2015). HDFS is at the base of the architecture as shown in Figure 5.
Figure 5 – Hadoop Architecture (Saraladevi et al., 2015)
5.1.1 MapReduce
The main advantage of MapReduce is the accomplishment of parallelization and failover successfully, by splitting the work into multiple units (Chandrasekhar et al., 2013; Miller et al., 2016). MapReduce jobs are done by only using two user defined functions: map and reduce functions, which uses a set of key-value (k, v) pairs. The map function is grouped by key and is received as a single group in the Reduce function. The improvement of the Hadoop MapReduce is that users typically only have to define the functions map and reduce. Another significant advantage of Hadoop MapReduce pointed by authors is that it permits non-expert users an easy way to run analytical jobs over Big Data.
3 https://hadoop.apache.org/docs/r1.2.1/mapred_tutorial.html#Purpose

28
Figure 6 – MapReduce and HDFS Daemons (Inoubli et al., 2016)
They found that through scaling out to multiple computing nodes Hadoop MapReduce jobs attain good performance though (Dittrich and Quiané-Ruiz, 2012). The component for coordinating the tasks within the node is the job tracker and several task trackers as shown in Figure 6 Figure 6 – MapReduce and HDFS Daemons(Inoubli et al., 2016).
5.1.2 Hadoop Distributed File System (HDFS)
This platform uses a distributed file system to read and write its data, usually for data storage uses Hadoop Distributed File System - HDFS which is also open source, and HDFS is based on the distributed Google File System – GFS. It supports scalable distributed file system that stores huge files in various and distributed machines in a reliable and efficient way (Inoubli et al., 2016).
The HDFS is distributed and reliable system, self-healing, highly scalable storage, extends through every node in Hadoop cluster for data storage on commodity hardware, and by linking together the file systems on various local nodes it creates a huge file system.
The HDFS automatically replicates data across various nodes for fault tolerance and so there is no need for backup (Inukollu et al., 2014). There are two types of nodes in a cluster. The first is the name-node (master) and the second is the data-node (slave), the name-node manages files, blocks, and mapping in a formation of the data-nodes as seen in Figure 6, the data-node is responsible for storing data from a block unit into a number of locations separately. HDFS files are also replicated in multiple in order to provide parallel processing of large amounts of data (Khan et al., 2014).
The strengths of the Apache Hadoop include scalability as it stores as well as distribute large sets (Katal et al., 2013). It is also a cost-effective method and well resilient to failure. The weaknesses of this tool are that its design makes it vulnerable to security attacks. Additionally, this tool has several issues with stability. The opportunities that it provides are that it offers storage for big data in a cost-effective manner. The threats of the tool are posed by its weaknesses, which include security breaches.
Hadoop
name-nodeHDFS
data-node data-node data-node
job trackerMAPREDUCE
tasktraker tasktraker tasktraker

29
5.2 Cloudera
Cloudera is the most well-known platform based on Apache Hadoop, which offers an effective platform that empowers organizations to gain insights from all their data (structured or unstructured) (Chandrasekhar et al., 2013).
Cloudera is on the front line of the data management. Furthermore, Cloudera is the most innovative and contributes most for the open source Apache Hadoop platform (Sabapathi and Yadav, 2016). Cloudera is the leader in Hadoop-based platforms (Chandrasekhar et al., 2013) has the same methods, functions, and main properties present in Hadoop, but it includes other efficient tools for social media (Murthy and Bowman, 2014). Cloudera maximizes the capabilities of Hadoop in storage, retrieval, and analysis (Murthy and Bowman, 2014) and enables enterprises to take advantage of features for SQL tools to achieve real-time analytics (Prasad and Agarwal, 2016).
Where this platform stands out from the original Hadoop system is that it offers big data processing at faster speeds (Prasad and Agarwal, 2016), and has a user-friendly interface with many features and useful tools like Cloudera Impala. The Cloudera Impala status can be identified in the Hadoop Stack in Figure 7.
Figure 7 – Cloudera Impala Status in Hadoop Stack (Prasad and Agarwal, 2016)
Impala is a real-time, parallelized processing engine with an SQL-based interface that queries the storage (HDFS and HBASE). Impala is seen as the fastest querying engine present in the Hadoop-based platforms. Moreover, is not just the Impala that stands out from the other platforms; the Cloudera Manager is more stable and complete in features than the Ambari (HDP) and resource manager (Hadoop) (Azarmi, 2015).
The strength of this platform is that it offers to process big data at faster speeds than the original Hadoop system. The weakness that it has is that there are incompatibilities with some systems. Its opportunities are reliability as a result of faster data processing. The threats posed to this tool are issues with security.

30
5.3 Hortonworks Data Platform (HDP)
Hortonworks Data Platform (HDP) is another open source platform based on Apache Hadoop,
is an important influencer of the Apache Hadoop project, and offers its free and open source
version of Hadoop along with services and training (Dinsmore, 2016), HDP agglutinates the
stable components instead of distributing the latest version of the Hadoop project (Azarmi,
2015). Contrasting with Cloudera, HDP is 100% open source and totally free. It is an excellent
choice for organizations that need the capability and cost-effectiveness of Apache Hadoop, with
ready business tools (Chandrasekhar et al., 2013; “HDP,” 2016).
Figure 8 – Hortonworks Distribution (Azarmi, 2015)
As seen in Figure 8, HDP contains an integrated solution composed of open source tools such as Hadoop, Pig, Hive, Spark, Yarn, etc (Khalifa et al., 2016). The components of Hadoop core stack are represented in blue, the components of the Hadoop Ecosystem project are in grey, and the specific component from HDP is represented in green (Azarmi, 2015). To deal with the performance issues, the HDP promotes Apache Tez as a performance optimizer (Dinsmore, 2016). This platform does not view the Hadoop as an alternative to traditional data management platforms thus focuses on offering integration components for traditional data management platforms (“HDP,” 2016). HDP look for Hadoop as a tool to complement the existing data platforms, a similar vision with the Proprietary Software vendors.
HDP offers secure distribution on a centralized architecture and it is the only Hadoop Distribution that supports Windows as its strengths. Its main weaknesses are security breaches and a basic management interface. Its opportunity is that it focuses on the reliability and stability of the Apache Hadoop.

31
5.4 HPCC System
The High-Performance Computing Cluster (HPCC) Systems Big Data is an open source framework that is used for manipulating, querying, transforming, as well as data warehousing. This framework is tipically used as a choice instead the Hadoop-based platforms, and there are two versions of the platform, one paid and one free (Chandrasekhar et al., 2013).
The HPCC uses the Linux operating system to support the layers of custom-built middleware components, thus providing an environment for running and supporting the distributed file system for data-intensive computing.
Figure 9 – HPPC environment system (adapted from Furht and Villanustre, 2016).
As shown in Figure 9, HPPC makes use of Thor4 data refinery that is identical to the Hadoop-MapReduce combination, with its functions and capabilities, however, with similar configurations, it offers a much better performance (Furht and Villanustre, 2016). The HPPC
data delivery engine Rapid Online XML Inquiry Engine (Roxie)5 as the name suggests is an online high performance structured query and analysis tool that supports parallel data access processing requests per node per second with sub-seconds response times (Furht and Villanustre, 2016) as well supports the ECL – Enterprise Control Language. This is an Easy-to-learn and consistent programming language (ECL) which is designed specifically for big data processing. There is another framework called the community edition, which is a free HPCC version and is also supported by active developers and enthusiasts’ community through online
forums of discussion. HPCC Systems platform has the same core technology that LexisNexis6 has used for years to analyse huge data sets for its customers in industry, law enforcement, government, and science (“HPCC Systems Platform,” 2016).
Due to the high-performance and cost-effectiveness of its implementation, the HPCC has been adopted by several government agencies, companies and research laboratories (Furht and Villanustre, 2016).
4 https://hpccsystems.com/resources/faq/what-thor
5 https://hpccsystems.com/resources/faq/what-Roxie
6 http://www.lexisnexis.com/en-us/gateway.page

32
The HPCC identified the need for a new computing paradigm to address its growing volumes of data, his design approach comprehended the definition of a new highlevel language (ECL) for parallel data processing based on the Dataflow architecture (“HPCC Systems Platform,” 2016). As we can verify in Figure 9 ECL is a crucial and transverse component of HPCC.
The HPCC is also a solution to consider in an early stage of BDA (Tsai et al., 2015).
5.5 Apache Apex
Apex is an Enterprise Grade platform and a Hadoop YARN7 native platform which has oriented to unifying stream and batch processing. Apex processes big data-in-motion (streaming) in a scalable, fault-tolerant, secure, distributed, and easily operable manner.
Apex states that the platform has a low barrier entry by providing a simple API to developers for writing or re-use generic Java code, thus decreasing the knowledge necessary to develop big
data applications, also uses Malhar8 a free library to facilitate integration with 300 commonly used operators and applications templates (“Apache Apex,” 2016). The platform high-level architecture can be seen in Figure 10.
Figure 10 – Apache Apex Architecture (“Apache Apex,” 2016)
Apache Apex includes key features such as in-memory performance, fault tolerance, and hadoop-native Yarn and HDFS (as can be seen in Figure 10) as its strengths. Its opportunity is that it focuses on closing the gap between batch and stream-processing.
7 https://hadoop.apache.org/docs/current/hadoop-yarn/hadoop-yarn-site/YARN.html
8 https://apex.apache.org/docs/malhar/

33
5.6 Apache Storm
In its early stage, Apache Storm was promoted as the "Hadoop of real-time" and the first of its kind (Wingerath et al., 2016). The Apache storm is an open source computation system for distributed systems and allows the user to process structured and unstructured streams of data that are not bounded in a reliable manner (Inoubli et al., 2016). Its programming model provides an abstraction for stream-processing identical to what MapReduce paradigm does for batch-processing (Wingerath et al., 2016).
Apache Storm is comparable with Hadoop but is focused for rapid and efficient event processing system in real-time, by sending data directly from one worker to another, Apache Storm can process millions of tuples per node per second (Miller et al., 2016; Morshed et al., 2016). This platform creates a graph of real-time computation named topology (Figure 11), this graph is feed by streaming data into the cluster of the nodes called spouts. These nodes distribute the tuples between worker nodes called bolts for processing, write data to external storage and distribute tuples further downstream themselves (Wingerath et al., 2016). Apache Storm is indicated for rapid event processing system granting the increasing of computation (Morshed et al., 2016).
Figure 11 – Storm topology (Wingerath et al., 2016)
This platform has a wide user-base and supports many JVM-based languages such as Java, Python, Scala, Perl and others (Morshed et al., 2016; Wingerath et al., 2016).
Apache Storm supports the real-time distribution of computation is indicated for quick event processing that offers increasing computation and has adapters for several languages as its strengths. Its weaknesses are the dependency of a reliable and durable data source for at least once processing.

34
5.7 Apache Drill
The Apache Drill is an open source implementation of Google BigQuery9, Drill is a structured query language engine that is used to explore this data, supporting queries and joins of data from various sources (Khalifa et al., 2016).
This framework is designed to support analysis on a high-performance level on the data that is semi-structured and rapidly evolves that originates from modern applications of Big Data, such as NoSQL databases and file systems, with a simpler query Apache Drill can join data from various sources. (“Apache Drill - Schema-free SQL for Hadoop, NoSQL and Cloud Storage,” n.d.; Khalifa et al., 2016).
Apache Drill does not use a master-slave concept. As we can see in Figure 12 any Drill node (Drillbit) when accepts queries requests and assumes the role of root server (driving Drillbit), in this way, eliminates the problem of a single point of failure (“Apache Drill - Schema-free SQL for Hadoop, NoSQL and Cloud Storage,” n.d.; Khalifa et al., 2016).
Figure 12 – Flow of Apache Drill query (“Architecture - Apache Drill,” 2017)
The coordination of the nodes, the planning of the query planning, also the optimization, scheduling, and execution are performed and distributed (Hausenblas and Nadeau, 2013).
The main strengths of this platform are that it is a distributed system and its extensibility, the ability to join in a query multiple and diverse sources of data.
5.8 Apache Solr
The Apache Solr is a popular open source made to be highly reliable, tolerate faults, and scalable. It provides for indexing in a distributed system, replication as well as query balancing of loads, automated failover, and recovery (Ma et al., 2017; Sabapathi and Yadav, 2016).
9 https://cloud.google.com/bigquery/

35
Solr is very fast and intended to be an enterprise search platform (Sabapathi and Yadav, 2016) used to power the features for navigation for many global internet sites, and it is designed on
the Apache’s Lucene 10 technology that is based on Java for search technology as well as indexing (“Apache Solr,” 2017) and runs as a standalone full-text search server (“Apache Solr,” 2017; Yadav et al., 2013).
Its search engine includes full-text search, hit highlighting, faceted search, geospatial search, dynamic clustering, database connections, near real-time indexing, and the index accepts data from multiple and diverse sources, such as files in common format Portable Document Format (PDF), Comma-Separated value (CSV) files, Microsoft Word files, XML (Yadav et al., 2013).
The concept of Solr is analogous to a search engine, that is, the more information or documents available to Solr, it is more likely to find the information later through the query.
Figure 13 – Apache Solr Conceptual Architecture (Karambelkar, 2013)
Apache Solr has various modules as can be seen in Figure 13, some of the modules are other projects in themselves (Karambelkar, 2013).
Apache Solr is highly modular, reliable, scalable and fault tolerant as its strengths. Its weakness is the verticality in BDA platforms.
10 https://lucene.apache.org/core/

36
5.9 Apache Spark
Spark is an open source framework that was originally developed at UC Berkley in 2009 (Inoubli et al., 2016). This platform stands out for running programs faster than Hadoop MapReduce on disk or memory.
Spark API supports Java, Scala, Python and R to develop quickly applications, and can be integrated with others platforms or work standalone (“Apache SparkTM,” 2016).
Apache Spark is particularly appropriate and efficient for the analytics of heterogeneous data (Inoubli et al., 2016) and for stateful computations when precisely a delivery is useful indifferent whether it takes too long or not. Spark supports real-time distributed features, and integrates
a complete SQL interface (Spark-SQL). It uses Hive11 for standard query languages, and also Domain Specific Language – DSL for query structured data (Morshed et al., 2016). It is similar to Impala in features and performance (Azarmi, 2015).
Spark uses a resilient distributed dataset (RDD) as a basic abstraction for a distributed dataset. The core operations (map, reduce and groupByKey) can be accomplished on the elements of the RDD and any one of those operations is evaluated lazily (transformations) or eagerly (actions). The distinct property of RDD is that they are unchangeable; operations on the RDDs create new RDDs (Miller et al., 2016).
As seen in Figure 14 – SPARK system overview (Inoubli et al., 2016)Figure 14, Apache Spark cluster is based on master-slave architecture and have three main components:
Driver Program;
Cluster Manager;
Worker Nodes.
Figure 14 – SPARK system overview (Inoubli et al., 2016)
11 https://hive.apache.org/

37
Apache Spark is best suitable for near real-time data processing, and not for real-time processing because Spark uses mini batches that are not suitable for event level processing. The most attrative feature of Spark is the capacity of Machine Learning (ML) efficiently, due to its memory caching capacity that is impressive. Almost all of the popular streaming data sources can be easily integrated into Spark API (Morshed et al., 2016).
5.10 OS Big Data Platforms Comparison
The Open Source Big Data Platforms described in the previous sections, provide a certain number of functionalities for a comparison.
This section explains the reasons behind the criteria chosen for comparison among them. To ensure a logical thread in the comparison, the criteria chosen can be useful for business or IT managers understand which platform could be appropriate for their purposes. Some of the functionalities supported by each tool that has been taken into consideration are:
Full-Stack: Have all the functionalities for processing, storing and analysing
data in an application stack;
SQL-based interface: A query engine that uses a query language similar to
SQL.
API support: API to access and manage components.
Real-time analytics: Ability to perform real-time analysis, analysing the
data almost at the same time as it enters the system.
Ready-Business Tools: It integrates seamlessly with the tools/systems your
business already uses.
Graphical User Interface (GUI): Graphical user interface via browser or
software.
Table 1 below presents the list with the presence of these functionalities for each platform.
Table 1 – Big Data Platforms – comparative table
Full-Stack Sql-based Interface
API support
Real-time Analytics
Ready-Business Tools
GUI
Hadoop Yes Hive Yes No No Yes Cloudera Yes Hive Yes Yes Yes Yes Hortonworks Yes Hive Yes Yes Yes Yes HPCC Yes Add-on Yes Yes Yes Yes Apex No Apex-
Calcite Yes Yes Yes No
Storm No Storm SQL Yes Yes No Yes Drill No ANSI SQL Yes No Yes Yes Solr No Parallel SQL Yes Yes No Yes Spark No Spark SQL Yes Yes No Yes

38
Following our comparison and analysing the features we have chosen we can conclude that Hadoop, Cloudera, Hortonworks, and HPCC are the only platforms that are full-stack and ideal for most organizations. The Apex, Storm, Drill, Solr, and Spark could be considered to complement another full-stack platform due to its vertical nature.
Regarding real-time analytics, Hadoop do not have this functionality, only with the use of third-party tools.
All of them have support for API to access and manage the system or components. It was verified that the platforms Cloudera, Hortonworks, HPCC, and Drill have tools to integrate into existing business systems easily.
Most platforms already have interfaces to SQL; only the HPCC needs an add-on to do so. It was verified that almost all platforms have a graphic user interface via browser or application, with the exception of Apache Apex.
5.11 Summary
The first ten parts of the chapter present and analyse nine of the most popular open source Big Data platforms describing some of the more significant qualities, characteristics, capabilities, and functionalities of each platform.
Table 2 shows a succinct description of the platforms and the key features, contributing to the identification of the Big Data platforms for analytics that may be suitable for SMEs in their day-to-day business operations.
Table 2 – Big Data Platforms – strong points
BDP Description Strong Points
Apache Hadoop
The most popular platform that implements the MapReduce paradigm and uses the HDFS.
-Largest community -Popularity -Forefront
Cloudera The most well-known Hadoop-based platform. Same methods, functions, main properties as Hadoop, but more efficient in storage, retrieval, and analysis.
-Innovative -Efficient tools for social media -SQL tools for real-time analytics -User-friendly interface -Stability -Training & Support
HDP This platform is also Hadoop-based but only uses the stable components. Promotes the Apache Tez to deal with performance issues and the Apache Ambari as the cluster manager.
-Training & Support -Stability -Ready business tools -Low complexity for integration into an IT infrastructure -Microsoft Windows support
HPCC System
Typically chosen as alternative to Hadoop-based platforms, uses Thor data refinery as a distributed file system and for processing data across several nodes.
-High-performance -Consistent programming language (ECL) -Experienced -Robust solution

39
Apache Apex
Oriented to unify stream and batch processing, provides developers with a simple API to reuse Java code.
-Low barrier entry -Free library with connectors -In-memory performance
Apache Storm
Focused for rapid and efficient event processing system in real-time.
-Supports many JVM-based languages -Rapid event processing
Apache Drill
This platform is a SQL engine to explore data, supporting queries and joins of data from various sources.
-Query and Joins multiple sources -Avoid a single point of failure
Apache Solr
It is intended to be an enterprise search platform which includes full-text search, hit highlighting, faceted search, geospatial search, dynamic clustering, database connections, near real-time indexing of data from multiple and diverse sources.
-Fast engine -Indexes data from multiple and diversified sources.
Apache Spark
This platform runs programs faster than MapReduce on disk or memory and can be integrated to work with others platforms.
-Supports several programming languages -Integration with other BDA -Efficient analytics -Memory caching capacity -Complete SQL interface

40

41
6 Methodology
This chapter details the methodology applied to achieve the research aim and objectives. The chapter comprises the following sections: research agenda and research design method. For every section, first the concept is described and next the justification behind selection of process is discussed.
6.1 Design Method
The following subsections describes the Research Method, Method for Selecting and Evaluation and finally the Testing Method.
6.1.1 Research Method
Being this research work in the area of Information Systems, the adoption of Design Science Research Methodology for Information Systems seems appropriate. Considering the background and objectives of the research that will be done, the method represented in Figure 15 will be used.

42
Figure 15 – Design Science Research Process Model (Vaishnavi and Kuechler, 2012)
This model is very flexible, allowing to any research work starts at any process step. In this research work, we begin in the first process step the ‘Awareness of problem’ where the research began.
6.1.2 Method for Selecting and Evaluation
Many software evaluation methodologies were created by various organizations in the world. Each methodology is intended for different purposes or focused on distinct aspects of software such as maturity, durability or functionality itself.
Firstly, it was considered the use of and adapt the criteria’s from the 2017 Gartner Magic Quadrant for Data Warehouse Data Management Solutions for Analytics, although it is more suitable for proprietary software, it indicates what to expect from a data management and analytics solution. For a qualitative evaluation, it is essential to mention some key factors (criteria’s) on which platforms must respond to be considered functional. It will be used and adapted the criteria’s from the 2017 Gartner Magic Quadrant for Data Warehouse Data Management Solutions for Analytics. However, it is necessary to use an assessment method that quantifies those key factors and features, and the method QSOS (Qualification and Selection of software Open Source) was considered the most suitable for the type of software that will be evaluated and oriented to the adoption of OSS in SMEs. The two following subsections present 2017 Gartner Magic Quadrant for Data Warehouse Data Management Solutions for Analytics and QSOS respectively.
6.1.2.1 2017 Gartner Magic Quadrant for DW Data Management Solutions for Analytics
The Gartner uses two dimensions to classify the 2017 criteria, such as the ability to execute and completeness of vision. All criteria can be seen in the following figure.

43
Figure 16 – 2017 Gartner evaluation criteria (Gartner, 2017)
Ability to Execute is mainly related with the ability and maturity of the product and the vendor. Criteria under this title either look for portability of the product, its scalability, and its ability to run in different environments, thus allowing to the customer several options. These ability to execute criteria are critical to customer satisfaction and product success, so customer references are weighted heavily throughout the process (Black and Thomas, 2013; Gartner, 2017).
Completeness of Vision describes a supplier’s ability to understand the functions needed to put in place a product strategy that meets market needs, understands the general market trends, and influences or leads the market when needed. For the long-term viability of the business, it is needed a visionary role, this vision is strengthened by its willingness to broaden its influence across the market by working with independent third-party application software supplier’s that provide complementary solutions. A successful supplier will be capable to not only comprehend the competitive scenario of its product field but also be a game changer of this field with the appropriate focus of its capabilities for future product development (Black and Thomas, 2013; Gartner, 2017).
6.1.2.2 QSOS
This methodology was conceived by Atos SE12 to qualify, select and compare free or open-source software in an objective, traceable and fact based (Ferreira et al., 2012).
The method is currently in version 2.0 with a GNU Free Documentation License and is
maintained by an open community 13 , which also offer a tool called O3S that help in the
12 https://atos.net/pt-pt/portugal
13 http://www.qsos.org/Community.html
Ability to Execute
•Product/Service
•Overall Viability
•Sales Execution/Pricing
•Market Responsiveness/Record
•Marketing Execution
•Customer Experience
•Operations
Completeness of Vision
•Market Understanding
•Marketing Strategy
•Sales Strategy
•Offering (Product) Strategy
•Business Model
•Vertical/Industry Strategy
•Innovation
•Geographic Strategy

44
application of the method (ATOS, Origin., 2013). The QSOS model is partial derived from ISO/IEC 9126 quality model (Adewumi et al., 2013).
This model has the well-defined methods and is practical in nature, follow an interactive process and the scoring is strict (0 to 2) (Umm-e-Laila et al., 2017).
The general process of QSOS consists of four iterative steps (ATOS, Origin., 2013): Definition, Evaluation, Qualification and Selection as seen in Figure 17 – QSOS Figure 17.
Figure 17 – QSOS Steps (ATOS, Origin., 2013)
6.1.2.2.1 Definition
In this initial step, it is critical to describe the software in at least three recommendations:
Type of software reference: the type of software that exists and meets the general
requirements divided into two axes: maturity analysis and functionality coverage
analysis. In version 2.0 of QSOS it is mandatory to use the maturity criteria defined in
the method shown in Figure 18.
Community: identify the type of community involved in the development of the project,
e.g., an open community or a company.
Type of licence: verify the type of licence, e.g., BSD or GPL.
1.Definition
2.Evaluation
3.Qualification
4.Selection
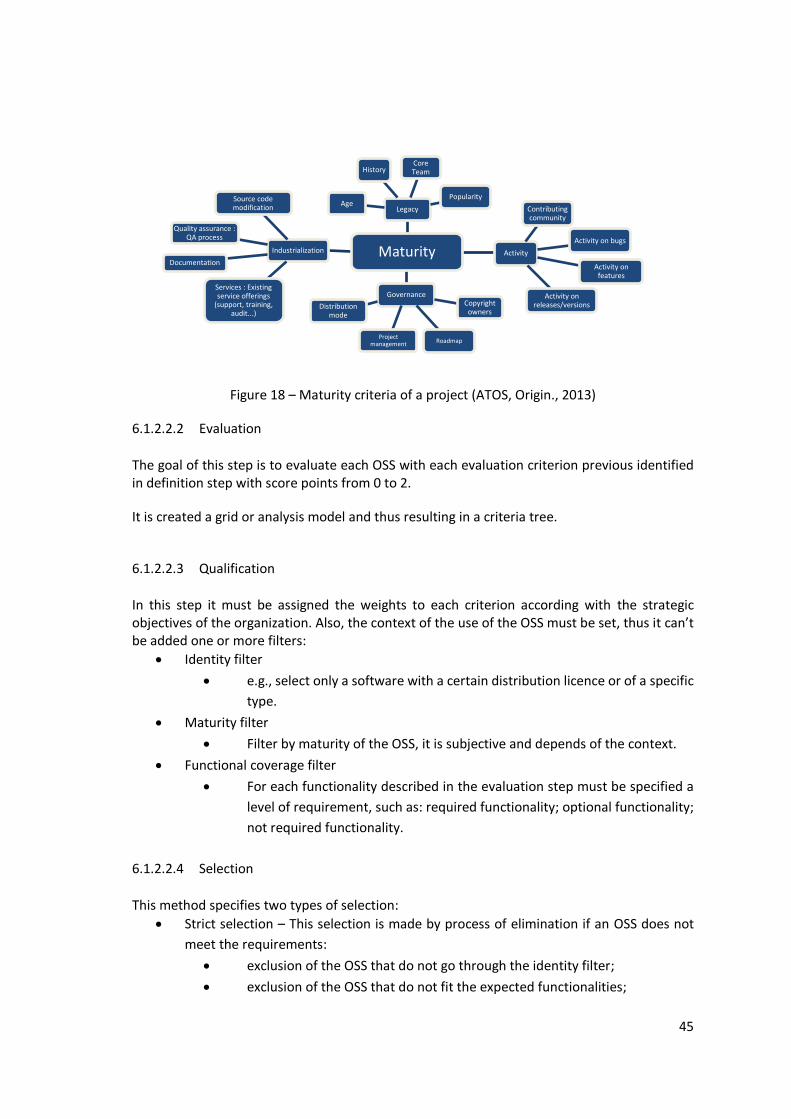
45
Figure 18 – Maturity criteria of a project (ATOS, Origin., 2013)
6.1.2.2.2 Evaluation
The goal of this step is to evaluate each OSS with each evaluation criterion previous identified in definition step with score points from 0 to 2.
It is created a grid or analysis model and thus resulting in a criteria tree.
6.1.2.2.3 Qualification
In this step it must be assigned the weights to each criterion according with the strategic objectives of the organization. Also, the context of the use of the OSS must be set, thus it can’t be added one or more filters:
Identity filter
e.g., select only a software with a certain distribution licence or of a specific
type.
Maturity filter
Filter by maturity of the OSS, it is subjective and depends of the context.
Functional coverage filter
For each functionality described in the evaluation step must be specified a
level of requirement, such as: required functionality; optional functionality;
not required functionality.
6.1.2.2.4 Selection
This method specifies two types of selection:
Strict selection – This selection is made by process of elimination if an OSS does not
meet the requirements:
exclusion of the OSS that do not go through the identity filter;
exclusion of the OSS that do not fit the expected functionalities;
Maturity
LegacyAge
HistoryCore Team
Popularity
Activity
Contributing community
Activity on bugs
Activity on features
Activity on releases/versions
GovernanceCopyright
owners
Roadmap Project
management
Distribution mode
Industrialization
Services : Existing service offerings
(support, training, audit...)
Documentation
Quality assurance : QA process
Source code modification

46
exclusion of the OSS in which the maturity criterion do not reach the level
of relevance defined by the user, in the method it is defined that for a
relevant criterion the score must be equal to or greater than 1, and for a
critical criterion the score must be equal to 2;
Loose Selection – This selection is less rigorous than the strict selection because it does
not eliminate the OSS that is not eligible and classifies them concerning the previously
defined filters.
Result of the product of the assigned weights and the score points of each evaluation of the OSS.
This general process step by step, the evaluation of criterion and the model of scoring allows one objective and traceable selection of the OSS.
6.1.3 Testing Process
These tests and experiments comparison process consists in to examine and functionally explore the Open Source Platforms for BDA and compare their performance and tools.
Han and Lu (2014) suggests that any Big Data benchmark should consist of five steps: Planning; Generating data; Generate tests; Execution; Analysis and evaluation. An adaptation of this process can been seen in Figure 19.
Figure 19 – Testing Process (Han and Lu, 2014)
Thus, the steps of the testing process are as follows:
Planning: In this step, the evaluation object, application domain, and evaluation metrics
are determined.
Generating data/Generate tests: In these steps, the data to be used is obtained, and
the tests are generated.
Execution: In this step, the test is performed and then reported.
Analysis and evaluation: Finally, in this step, the results are analysed and evaluated.
Planning Generating
data & tests
ExecutionAnalysis
and evaluation

47
6.2 Agenda for Selection, Evaluation, and Tests
The first step is to select from the reviewed platforms the ones that will be tested during this research. The second are identifying the key features that will be used to explore each platform. Then, the datasets and some queries from the SMB’s domain are selected to be employed for testing the analytics and query capabilities of every selected platform.
6.2.1 Platforms Selection
There are some platforms that are intended to be an all-in-one solution to deal with Big Data (BD) and Analytics; others are specific solutions for Big Data Analytics (BDA). A thorough investigation of the existing open source BDA platforms was done, and a few were chosen to evaluate them.
6.2.2 Platforms Evaluation
It is clear that for any comparative analysis is necessary to establish criteria and choose a method. For the evaluation of the BDA platforms, were choose the QSOS (Qualification and Selection of software Open Source), this method allows to qualify and evaluate the OSS, according to the analysis of the requirements and the restrictions (technical, functional and strategic).
6.2.3 Platforms Tests
In this research, the two BDA platforms chosen to test will be the two best classified using one assessment methodology the QSOS. Several tests will be performed, such as queries, and some selected visual reports.

48

49
7 Evaluation and Selection of BDA
Platforms
This chapter presents the evaluation and selection of Big Data Analytics (BDA) platforms using and adapting the Qualification and Selection of software Open Source (QSOS)(ATOS, Origin., 2013) method. We consider this method as the best and most appropriate for our evaluation and selection of the two platforms for the empirical experiment and tests.
This method was developed by Atos Origin and is intended to qualify, select and compare tools and open source platforms. The QSOS method consists of four stages definition, evaluation, qualification and selecting, and can be used interactively.
This chapter is organized as follows: in section 7.1 the QSOS method are described, in section 7.2 the method implementation are shown, in section 7.3 the chapter conclusions are summarized in section 7.3.
7.1 QSOS Method
The method adopted for the evaluation and selection of the BDA platform for the tests is the QSOS. This decision is justified by the fact that methodology is available freely under the GNU General Public License on the Web, allowing its adaptation to the present research work.
The choice of software, OSS or proprietary software, has to be based on the purpose of the software. It is imperative to know the functional needs and limitations of the software, after this it is possible to apply the QSOS method and adapt if necessary.
The QSOS method proposes four iterative stages (as seen in Figure 20) namely: definition, evaluation, selection and qualification (Adewumi et al., 2013).

50
Figure 20 – General approach (ATOS, Origin., 2013)
7.1.1 Definition
At this step all the criterion will be organized. In chapter 5, it was identified some of the free and open source Big Data Analytics platforms which must be suitable for SMEs strategic needs, their licenses type and communities type. Each maturity criterion (predefined criteria) and functionality criterion (domain criteria) will be identified.
7.1.1.1 Maturity criteria
The maturity criteria are already defined by the method and are as follows:
Legacy – Project's history and heritage: Age; History; Core Team; Popularity;
Activity – Activity inside and around the project: Contributing community; Activity on
bugs; Activity on features; Activity on releases/versions;
Governance – Project's strategy: Copyright owners; Roadmap; Project management;
Distribution mode;
Industrialization – Industrialization of the project: Services – existing service offerings
(support, training, audit...); Documentation; Quality assurance – QA process; Source
code modification;
7.1.1.2 Functionality criteria
After the previous theoretical explanation the basic functionalities/aspects identified were:

51
Full Stack (Solution Stack): This links several software and applications required for
doing particular tasks, and additionally as infrastructure software, in the case of BDA
platforms (tools for storage, management and analytics).
Enterprise-ready: It should incorporate the features driven for performance, security,
usability and reliability.
Incorporated: It should easily simplify and accelerate the implementation of Big
Technological innovation for organizations.
Real-time Analytics: It involves analysing the data almost at the same time as it enters
the system.
Solid and fault-tolerant: Configuration that prevents a BDA platform from fail due an
unexpected problem or event.
Scalability: Platform able to grow by adding more resources and at the same time be
able to manage it.
Paid Version: Includes software support and advanced components.
User-friendly Management: End-to-end application for managing all solution stack.
In this stage, all evaluation criteria will be organized, and all the OSS selected for evaluation will have an Identity Card with license type, version, and website.
7.1.2 Evaluation
For each identified criterion in previous step it is assigned a discrete score. The evaluation model imposes a discrete scale of 3 values. The sources to find the presence of each criterion are the scientific literature, BDA platforms documents/manuals and websites.
The evaluation templates suggest the significance of the three scores 0, 1 and 2 for each criterion.
For evaluation the criteria of maturity, the scale is 0 to 2. The scoring rule is normally as shown in Table 3.
Table 3 – QSOS Maturity criteria (ATOS, Origin., 2013)
Maturity criterion Description
Lega
cy
Age
Sco
re 0 Less than three months
1 Between three months and three years 2 More than three years
His
tory
Sco
re 0 The software has many problems which can be prohibitive
1 No major crisis, or unknown history 2 Good past experience in crisis management
Co
re
Team
Sco
re 0 Very few identified core developers
1 Few active core developers 2 Important and identified core development team
Popularity Sc ore
0 Very few identified users 1 Usage can be detected

52
2 Many known users and references
Act
ivit
y
Contributing community Sc
ore
0 No real community nor activity (forum, mailing lists...) 1 Community with significant activity 2 Strong community with vivid activity in forums, with many contributors and
supporters
Activity on bugs
Sco
re
0 Low reactivity in forums and mailing lists, or no mention about bug fixes in release notes
1 Existing activity but without any clearly defined process or with long resolution times
2 Strong reactivity based on roles and task assignments
Activity on features Sc
ore
0 Few or no new features 1 Product's evolution is led by a dedicated team or by users, but without a clearly
stated process 2 Feature request process is industrialized, an associated roadmap is available
Activity on releases or
versions
Sco
re
0 Very low activity on the production or development versions (alpha, beta) 1 Activity on production or development versions (alpha, beta) with frequent
minor corrective versions 2 Important activity with frequent corrective versions and planned major versions
linked with the roadmap
Go
vern
ance
Copyright owners Sc
ore
0 Rights are being held by a few individuals or commercial entities 1 Rights are uniformly held by many individuals 2 Rights are held by a legal entity or a foundation that the community trust (ex:
FSF, Apache, ObjectWeb)
Roadmap
Sco
re 0 No roadmap is published
1 Roadmap without planning 2 Versioned roadmap with planning and delay measurements
Project management Sc
ore
0 No clear and apparent project management 1 Project managed by an individual or a single commercial entity 2 Strong independence of the core team, rights held by a recognized entity
Distribution mode Sc
ore
0 Dual distribution with a commercial version along with a functionally limited free one
1 Subparts are only available under proprietary license (core, plugins...) 2 Completely open and free distribution
Ind
ust
rial
izat
ion
Services
Sco
re
0 No service offering identified 1 Limited service offering (geographically, to a single language, to a single provider
or without warranty) 2 Rich ecosystem of services provided by multiple providers, with guaranteed
results
Documentation
Sco
re
0 No user documentation 1 Documentation exists but is partly obsolete or restricted to one language or to
few details 2 Documentation is up to date, translated and possibly adapted to several target
readers (end user, sys admin, manager...)
Quality assurance Sc
ore
0 No QA process identified 1 Existing QA processes, but they are not formalized or equipped 2 QA process based on standard tools and methodologies
Source code modification Sc
ore
0 No convenient way to propose source code modifications 1 Tools are provided to access and modify the code (eg SCM, forge...) but are not
really used by core team to develop the product 2 The contributing process is well defined, exposed and respected, it is based on
clearly defined roles
For functional aspects, concerning to evaluation, it was considered a scale 0 to 2, and the scoring rule is normally as shown in Table 4. Thus if the functionality is not covered in the platform, the criterion is scored with 0 if it is present only is partially covered with 1, but if the criterion is fully covered on the platform is scored with 2.

53
Table 4 – Score of functional coverage (ATOS, Origin., 2013)
Score Description
0 Not covered
1 Partially covered
2 Fully covered
The result of this step is two tables, one with the maturity criteria score and another with the functionality criteria.
7.1.3 Qualification
In this step, the primary goal is to qualify the evaluation through the organization of the criteria, according to the degree of importance of each one and according to the context of the use of BDA platforms in SMEs with this are created some filters that can be used in the selection step.
There are no guidelines on how factors should be given. The QSOS, however, presents suggestions as to whether these weights can be given.
For maturity the degree of importance of each criterion is based on the context, the QSOS suggests:
Table 5 – Maturity relevance (ATOS, Origin., 2013)
Weight Degree of maturity
0 Not relevant criterion
1 Relevant criterion
3 Critical criterion
For functional coverage the level of requirement of each criterion is based on how important
or critical it is for the use of a BDA platform in the context of SMEs daily based operations, the
QSOS suggests:
Table 6 – Level of requirement (ATOS, Origin., 2013)
Weight Level of requirement
0 Not required functionality
1 Optional functionality
3 Required functionality
The degree of relevance of each maturity criterion serves as the basis for the weighting factor. Thus, for each functional criterion, a weighting factor of +3 for required, for optional +1 and assign 0 points for not required functionality.

54
7.1.4 Selection
In this last step, the platforms are compared according to the weighted average, which is
calculated by summing the multiplications between the scores (S) and weights (W) divided by
the sum of the Weights, according to the following equation:
�̅� =∑ 𝑆𝑖 ∗ 𝑊𝑖
𝑛𝑖=1
∑ 𝑊𝑖𝑛𝑖=1
(1)
After performing the calculations, the two BDA platforms with the highest scores, according to
the weighted average, are selected for tests.
7.2 Method Implementation
As identified in the chapter 5 we choose nine of existing BDA platforms for this research work
that can be used in some of SMEs. The Open Source BDA platforms are the following: Apache
Hadoop, Cloudera, Hortonworks Data Platform, HPCC System, Apache Apex, Apache Storm,
Apache Drill, Apache Solr and Apache Spark.
Considering the objectives of our work and what type of BDA platform will be most appropriate
for most SMEs, we consider the following functionalities criteria: Full Stack, Enterprise-ready,
Real-time Analytics, Solid and fault-tolerant, Scalability, Paid Version and User-friendly
Management.
Some of the platforms will be disregarded in this evaluation because our selection mode will be
strict and we consider the Full-Stack criterion as eliminatory, and the excluded BDA platforms
from de evaluation and selection are Apache Apex, Apache Storm, Apache Drill, Apache Solr
and Apache Spark.
7.2.1 Definition
We consult the sites of the chosen platforms, and we gather information about the licenses of
each platform, start date, the community involved in the project, the latest available version
and release date, operating system, community website, wiki, forum, and download URL.

55
The set of this information generates an identity card of each platform. Table 7 presents this
information for the 4 BDA platforms:
Table 7 – Platforms ID card
Hadoop Cloudera Hortonworks HPCC
Co
mp
any Apache
Software Foundation
Cloudera, Inc. Hortonworks, Inc. LexisNexis
Cre
atio
n 2007 2009 2012 2011
Pro
du
ct Apache™
Hadoop® CDH Hortonworks Data
Platform (HDP®) HPCC Systems Platform
Lice
nse
Apache Apache Apache GNU Affero General Public License
Ve
rsio
n 3.0.0-beta1 5.12.1 2.6.2 6.4.2
Re
leas
e
Dat
e
03-10-2017 29-06-2017 01-04-2017 07-09-2017
Op
erat
ing
Syst
em
Linux-compatible
Linux-compatible Linux-compatible Windows
Linux-compatible installation, Windows and Mac OSX (ECL IDE and Client tools).
Co
mm
un
ity
https://hadoop.apache.org/who.html
http://community.cloudera.com/
https://community.hortonworks.com/
https://hpccsystems.com/community
Wik
i
https://wiki.apache.org/hadoop
http://community.cloudera.com/t5/tkb/communitypage
- https://wiki.hpccsystems.com/display/hpcc/Home

56
Foru
m
Mailing list https://community.cloudera.com/t5/community/mobilecommunitypage/interaction-style/forum
https://community.hortonworks.com/topics/forum.html
https://hpccsystems.com/bb/
UR
L
http://hadoop.apache.org/releases.html
https://www.cloudera.com/downloads.html
https://hortonworks.com/downloads/
https://hpccsystems.com/download
Hadoop is the oldest platform of all, as is evident in the case of Hortonworks and Cloudera because they are based on Hadoop.
The Hadoop platform is only without commercial interests. Hadoop, Hortonworks, and Cloudera have an Apache License, and HPCC code is under GNU Affero General Public License.
It is possible to verify that all projects remain current and popular, their communities are active and interested and also with frequent updates and releases.
All BDA platforms evaluated allow installation in Linux environment. However, for the access to the platform all can be accessed by the web-browser.
It should be noted that Hortonworks has a version of the platform to run on Microsoft Windows environment and HPCC provides management and query tools to access the platform through the Windows environment.
7.2.2 Evaluation
Maturity criteria
For each identified maturity criterion defined by QSOS method, were scored according to the information collected during the entire research. Table 8 shows this.
Table 8 – Score of maturity criteria
Criterion Hadoop Cloudera Hortonworks HPCC
Age 2 2 2 2
History 1 2 2 2
Core team 2 2 2 2
Popularity 2 2 2 2
Contributing community
2 2 2 2
Activity on bugs 1 2 2 2
Activity on features
2 2 2 2

57
Activity on releases/versions
1 2 1 2
Copyright owners 2 0 0 0
Roadmap 1 1 2 2
Project management
2 1 1 1
Distribution mode
2 1 2 2
Services 2 2 2 2
Documentation 2 2 2 2
Quality assurance 1 2 2 2
Source code modification
2 2 2 2
In this context of maturity, it was possible to identify a significant difference between Hadoop platform and the others in the criterion “Copyright owners” because Hadoop is held by Apache a foundation that the community trust and the others platforms are held by a few individuals or commercial entities, although the Cloudera, Hortonworks and HPCC platforms are open source and free, the brand is a commercial entity.
Another aspect is the criterion “Quality assurance” it is difficult to identify the existing QA processes, but they are not formalized or equipped in Hadoop contrary to the QA process based on standard tools and methodologies of the other platforms.
Although the results are very similar, the HPCC platform stands out slightly in Activity on releases/versions, it is verified important activity with frequent corrective versions and properly identified in the release notes.
Functionality criteria
Each functionality criterion were scored according to the information collected during the
entire research, and verified in the official websites and manuals. The “0” means that the
functionality not covered, “1” functionality partially covered and “2” functionality fully covered.
Table 9 shows the functionality criteria.
Table 9 – Score of functionality criteria
Criterion Hadoop Cloudera Hortonworks HPCC
Full Stack 2 2 2 2
Enterprise-ready 0 2 2 2
Real-time Analytics
0 2 2 2
Solid and fault-tolerant
1 2 2 2
Scalability 1 2 1 2
Paid Version 0 2 2 2
User-friendly Management
0 2 2 2

58
In this context of functionalities, Hadoop it was possible to identify a significant difference between Hadoop platform and the others in four criteria the Enterprise-ready, Real-time Analytics, Paid Version, User-friendly Management it is clear because this platform project is used as the base for other projects that explore each one of this criterion to differentiate themselves.
As we had previously identified, HPCC, Hortonworks and Cloudera have tools for easy integration with enterprise systems, so they score 2 points in Enterprise-ready criterion. Also, the User-friendly Management tools present in Hortonworks-Ambari, Cloudera-Cloudera Manager, and HPCC-ECL Watch are really end-to-end applications for managing all solution stack.
7.2.3 Qualification
Maturity criteria
For the weighting of the criteria of maturity, it was considered the importance that each one will have in any SMEs an assessment based on observation of the Portuguese reality. By way of illustration, in Portugal, many SMEs do not know how to consolidate several databases to create management reports. Because of this, they need someone who is capable of doing that or hiring consulting services (Belo et al., 2013). So it is necessary a rich ecosystem of services provided by multiple providers, with guaranteed results, to have a competitive market and not have such high costs when hiring outside services or investing in training.
The “0” means when it is a not relevant criterion, “1” when it is a relevant criterion and “3” when is a critical criterion.
Within this assumption, it can be considered that the criterion Age, History and Popularity is critical for SMEs because it indicates that the platform is widely used, has a positive track record and will be difficult to be abandoned in the short term.
The criteria associated with Activity inside and around the project, like bug fixes and development of new features are critical for businesses. Also, new versions are not relevant because they may interfere with platform stability. It is very important that the distribution criterion must be completely open and free distribution.
Almost all criterion of the industrialization of the project is critical. Having a rich ecosystem of services provided by multiple providers, with guaranteed results is critical for the business continuity, documentation up to date and for end-users, administrators and others is critical for an optimal administration and utilization of the platform.
Table 10 summarize the weights.
Table 10 – Weighting of maturity criteria
Criterion Weight
Age 3
History 3
Core team 0
Popularity 3

59
Contributing community
3
Activity on bugs 3
Activity on features
3
Activity on releases/versions
1
Copyright owners 0
Roadmap 0
Project management
1
Distribution mode
3
Services 3
Documentation 3
Quality assurance 3
Source code modification
1
We consider that some criteria are not relevant to SMEs, such as the Roadmap, generally, companies when they adopt a software, only consider the immediate and which problem the software will solve or improve and do not consider very important what the product will do in the future. Also we considered the criterion Core team and Copyright owners a not relevant, and Project management criterion and Source code modification relevant. All other criteria such as Age, History, Popularity, Contributing community, Activity on bugs, Activity on features Activity on releases / versions, Distribution mode, Services, Documentation and Quality assurance are considered critical.
Functionality criteria
For the weighting of the criteria of maturity, it was considered the importance that each one will have in any SMEs an assessment based on observation of the Portuguese reality.
The “0” means when it is a not relevant criterion, “1” when it is a relevant criterion and “3” when is a critical criterion.
It is considered that the full-stack criterion is critical for an SME because it is important to have all the functionalities for processing, storing and analysing data in an application stack. It is also critical to be enterprise-ready having low complexity for integration into an IT infrastructure, and also incorporate the features driven for performance, security, usability, and reliability.
However having the ability to perform analytics that can access and use almost at the same time that data come into a system is a relevant criterion.
Solid and fault-tolerant and scalability criterion are relevant as well, because they must be an intrinsic property and something to expect on any BDA platforms.
User-friendly Management is a critical criterion in case of SMEs is critical possess an easy and intuitive end-to-end application for managing all solution stack.

60
Table 11 summarize the weights of functionality criteria.
Table 11 – Weighting of functionality criteria
Criterion Weight
Full Stack 3
Enterprise-ready 3
Real-time Analytics
1
Solid and fault-tolerant
1
Scalability 1
Paid Version 1
User-friendly Management
3
7.2.4 Selection
In this step with the information of the points and weights of all the criteria, we calculate the weighted average, which is the sum of the product of the Weight by the Score divided by the sum of all weights. The comparison results are briefly listed in Table 12 and Table 13.
Table 12 – Comparison of total (Maturity)
Criterion W Hadoop Cloudera Hortonworks HPCC
S S*W S S*W S S*W S S*W
Age 3 2 6 2 6 2 6 2 6
History 3 1 3 2 6 2 6 2 6
Core team 0 2 0 2 0 2 0 2 0
Popularity 3 2 6 2 6 2 6 2 6
Contributing community
3 2 6 2 6 2 6 2 6
Activity on bugs 3 1 3 2 6 2 6 2 6
Activity on features 3 2 6 2 6 2 6 2 6
Activity on releases/versions
1 1 1 2 2 1 1 2 2
Copyright owners 0 2 0 0 0 0 0 0 0
Roadmap 0 1 0 1 0 2 0 2 0
Project management
1 2 2 1 1 1 1 1 1
Distribution mode 3 2 6 1 3 2 6 2 6
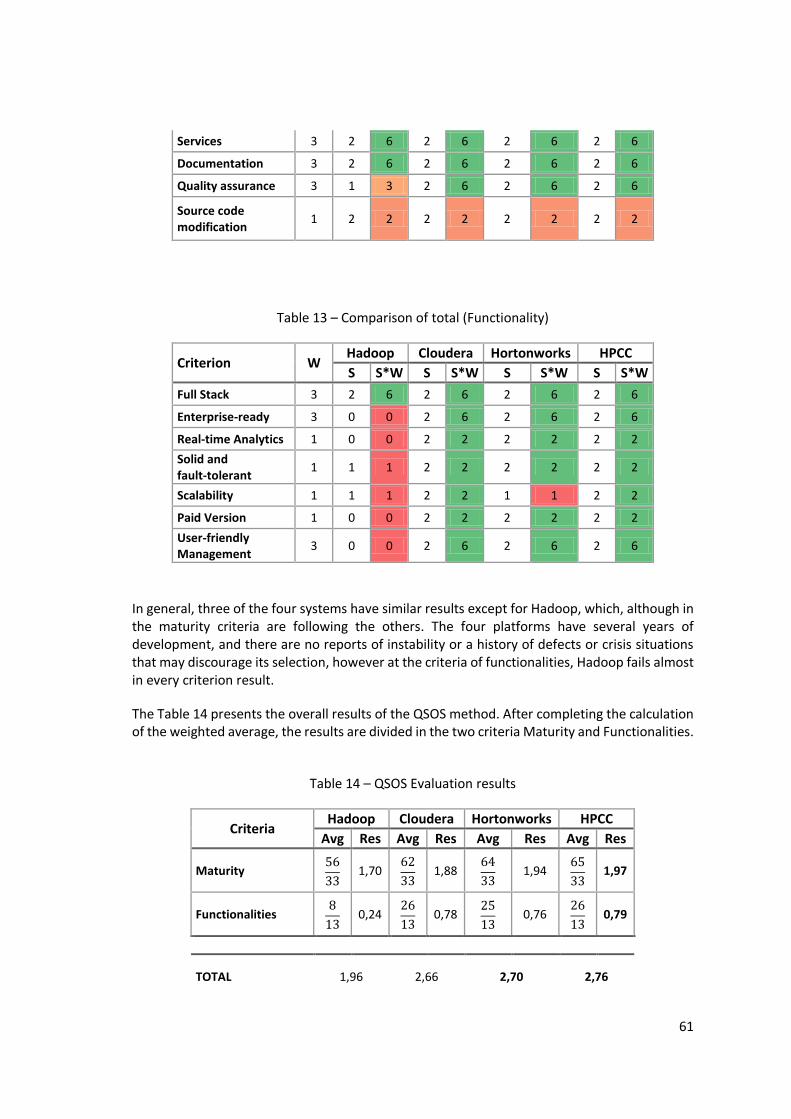
61
Services 3 2 6 2 6 2 6 2 6
Documentation 3 2 6 2 6 2 6 2 6
Quality assurance 3 1 3 2 6 2 6 2 6
Source code modification
1 2 2 2 2 2 2 2 2
Table 13 – Comparison of total (Functionality)
Criterion W Hadoop Cloudera Hortonworks HPCC
S S*W S S*W S S*W S S*W
Full Stack 3 2 6 2 6 2 6 2 6
Enterprise-ready 3 0 0 2 6 2 6 2 6
Real-time Analytics 1 0 0 2 2 2 2 2 2
Solid and fault-tolerant
1 1 1 2 2 2 2 2 2
Scalability 1 1 1 2 2 1 1 2 2
Paid Version 1 0 0 2 2 2 2 2 2
User-friendly Management
3 0 0 2 6 2 6 2 6
In general, three of the four systems have similar results except for Hadoop, which, although in the maturity criteria are following the others. The four platforms have several years of development, and there are no reports of instability or a history of defects or crisis situations that may discourage its selection, however at the criteria of functionalities, Hadoop fails almost in every criterion result.
The Table 14 presents the overall results of the QSOS method. After completing the calculation of the weighted average, the results are divided in the two criteria Maturity and Functionalities.
Table 14 – QSOS Evaluation results
Criteria Hadoop Cloudera Hortonworks HPCC
Avg Res Avg Res Avg Res Avg Res
Maturity 56
33 1,70
62
33 1,88
64
33 1,94
65
33 1,97
Functionalities 8
13 0,24
26
13 0,78
25
13 0,76
26
13 0,79
TOTAL 1,96 2,66 2,70 2,76

62
The Figure 21 shows a radar chart with the four platforms and their coverage in the four groups of maturity: Legacy-Project's history and heritage; Activity-Activity inside and around the project; Governance-Project's strategy; Industrialization-Industrialization of the project.
Figure 21 – Maturity coverage by group
Figure 22 shows a radar diagram with the four platforms and their coverage in the all seven functionalities: Full Stack; Enterprise-ready; Real-time Analytics; Solid and fault-tolerant; Scalability; Paid Version; User-friendly Management.
Figure 22 – Functionality coverage
Legacy : Project'shistory and heritage
Activity : Activityinside and around the
project
Governance : Project'sstrategy
Industrialization :Industrialization of the
project
Hadoop Cloudera Hortonworks HPCC
Full Stack
Enterprise-ready
Real-time Analytics
Solid and fault-tolerant
Scalability
Paid Version
User-friendlyManagement
Hadoop Cloudera Hortonworks HPCC

63
It is confirmed that the platform HPCC and Cloudera have both the same and better functional coverage, and Hadoop the functional coverage.
7.3 Summary
This chapter evaluated four of the nine platforms described in this research work, focusing on their maturity and functionalities. These aspects are described considering the concepts of the BDA platforms for data analytics, their features, and components.
Due to its complete application stack and maturity, was performed one evaluation with the platforms Apache Hadoop, Cloudera-CDH, Hortonworks Data Platform, and HPCC Systems Platform, using the method QSOS. This model of evaluation and selection of open source software used is flexible and interactive and suitable for the selection of open source software.
The HPCC platform has more functionalities and maturity than the Hortonworks platform, the LexisNexis Company is more experienced than Hortonworks and because of that has a more mature platform.
It is important to note that Cloudera scored higher than Hortonworks on the functionalities, but lost in the maturity criteria. Especially for evidence that has more Scalability than Hortonworks.
Based on the evaluations and results obtained, it is noted that of the platforms evaluated, the least adequate to adopt as BDA platform is Apache Hadoop and the two to consider are the Hortonworks Data Platform and HPCC Systems Platform.
It is also clear that not always the software with more functionality coverage is one of the eligible, the maturity attributes have an essential influence on the final selection of the alternative, as is verified in the case of Cloudera and Hortonworks.

64

65
8 Tests and Experiment Comparison
This chapter summarizes the tests and findings related to the two open source BDA platforms selected in chapter 7. An experiment end-to-end with in virtual machines (VM) has been designed and performed to have experimental data and comparison of the BDA platforms. The dataset used in this experiment is from an open data repository from the United States (US) Government.
8.1 Testbed
In this empirical experiment the evaluation and tests was run in a virtual machine configured with the minimum and recommended hardware requirements of Hortonworks Data Platform (HDP) for a virtualization environment.
Table 15 shows the minimum and recommended Hardware and Software requirements for the VM of each platform:
Table 15 – Minimum Hardware and Software
Requirement Hortonworks HPCC Host Operating System Any 64-bit 32-bit/64-bit
Host Processor Intel i5/ i7/ Xeon or AMD equivalent Intel i5/ i7/ Xeon or AMD equivalent
Host Browser Internet Explorer® 8, Google Chrome 10, or Firefox™ 3.0 (or later)
Internet Explorer® 8, Google Chrome 10, or Firefox™ 3.0 (or later)
Virtual Appliance File Size 9,7 GB 0,94 GB
Virtualiz. Software Support Azure, VirtualBox or VMWare VirtualBox
VM CPU 4 1
BDA Platform version 2.6.1 6.4.2
VM RAM 8 GB 1,5 GB
VM Disk Space 48,83 GB 5 GB
Virtualization Technology Intel VT/AMD-V Intel VT/AMD-V
For the purpose of this experiment, we chose to download and use the Virtual Machines available on the Platforms sites, this experiment only implements one node for each platform.

66
Also, Oracle VM VirtualBox® has also been chosen as the only virtualization software that is supported by both platforms appliances.
The host machine is a normal office laptop with an Intel® Core™ i7-4500U CPU, 16GB memory, Windows 10 (64-bit) and Oracle VM VirtualBox® 5.1.28.
8.2 Dataset
In this experiment, it is used one semi-structured data file containing real records from complaints filed by US citizens to US government (Consumer Financial Protection Bureau) about financial products and services.
This dataset is available online at address: https://catalog.data.gov/dataset/consumer-complaint-database and is intended for public access and use. The file, has the following details:
Semi-structured data: Comma-Separated value (CSV)
Size: 375MB
Records: 879855
Release date: May 2017)
Complaints received on or after June 1, 2012.
The dataset fields are documented in the Table 16:

67
Table 16 – Dataset field reference
Field name Data type
Date received date & time
Product plain text
Sub-product plain text
Issue plain text
Sub-issue plain text
Consumer complaint narrative plain text
Company public response plain text
Company plain text
State plain text
ZIP code plain text
Tags plain text
Consumer consent provided? plain text
Submitted via plain text
Date sent to company date & time
Company response to
consumer
plain text
Timely response? plain text
Consumer disputed? plain text
Complaint ID number
8.3 Queries
Although the dataset used in both BDA platforms is the same, how queries are interpreted, optimized, and processed depends on the data processing of each platform. And also the integration of the data in the platforms can be inconsistent and produce errors in the processing of queries, something that has not been verified. Thus, to make the test more comprehensive a mixed set of queries has been created, with some queries more complex than others.
To cover the whole dataset all the queries should follow a rationale, something that is outside the scope of this research work, although we created this set of queries, as seen in Table 17.

68
Table 17 – Test queries
Query # Description
Q1 Queries all the complaints in USA
Q2 Queries all the complaints of Wyoning (WY) state
Q3 Counts all the complaints of Wyoning (WY) state
Q4 Counts all the complaints of New York (NY) state
Q5 Queries all the complaints of Wyoning (WY) state order by ID
Q6 Counts the group of complaints of Wyoning (WY)
Q7 Queries with distinct of ID only four columns from Wyoning order by ID
Q8 Queries the total complaints for each Financial Product in Wyoming
Q9 Queries the total complaints for each Sub-Product of Mortgages in Wyoming
Q10 Queries the total complaints for each Financial Product in USA
8.4 Experiment Organization
For the purpose of verifying the functionalities described in its documentation and in our research. We structured the empirical experiment on the platform as follows:
Cluster Manager: the interface with user and tool for managing the cluster.
Data acquisition: how to acquire the dataset and load it into the HDFS in HDP and Data Refinery in the HPCC.
Data Integration/Representation: transform the semi-structured, structured or
unstructured data and deliver it to the platform.
Analysis and Visualization: query data from the HDFS/ Data Refinery, and interpret the
results in tabular form and in charts.
Tests: execution of a comparable set of queries.
8.5 Hortonworks
For the experiment on this BDA, the virtual appliance with the latest version (2.6.1) of Hortonworks Data Platform has been downloaded and imported into VirtualBox, the process is standard and almost excludes advanced and additional settings.
8.5.1 Cluster Manager
The platform already has some accounts created to admin and use the cluster manager (Ambari), it was decided to use an admin account with the following credentials:

69
raj_ops/raj_ops. It is possible to access the platform remotely by SSH – Secure Shell protocol or simply by the browser in the URL http://127.0.0.1:8888, as seen in Figure 23.
Figure 23 – Ambari user login
The Ambari is also an Apache project developed to enable simple management of HDP which includes tools for provisioning, management, and monitoring of HDP clusters. Its interface is
easy to use, intuitive and Web UI (User Interface) backed by its RESTful14 APIs.
It is possible to analyze the performance of the cluster, workloads, logs, and queries executions.
8.5.2 Data Acquisition
As previously mentioned, the dataset used in this experiment is a CSV, to place the file in HDFS, we chose to use the Files View module (see. Figure 24). Next, a folder was created in the user folder and then uploaded the file Consumer_Complaints.csv.
14 Representational state transfer - web services that provides interoperability between computer systems on the
Internet.
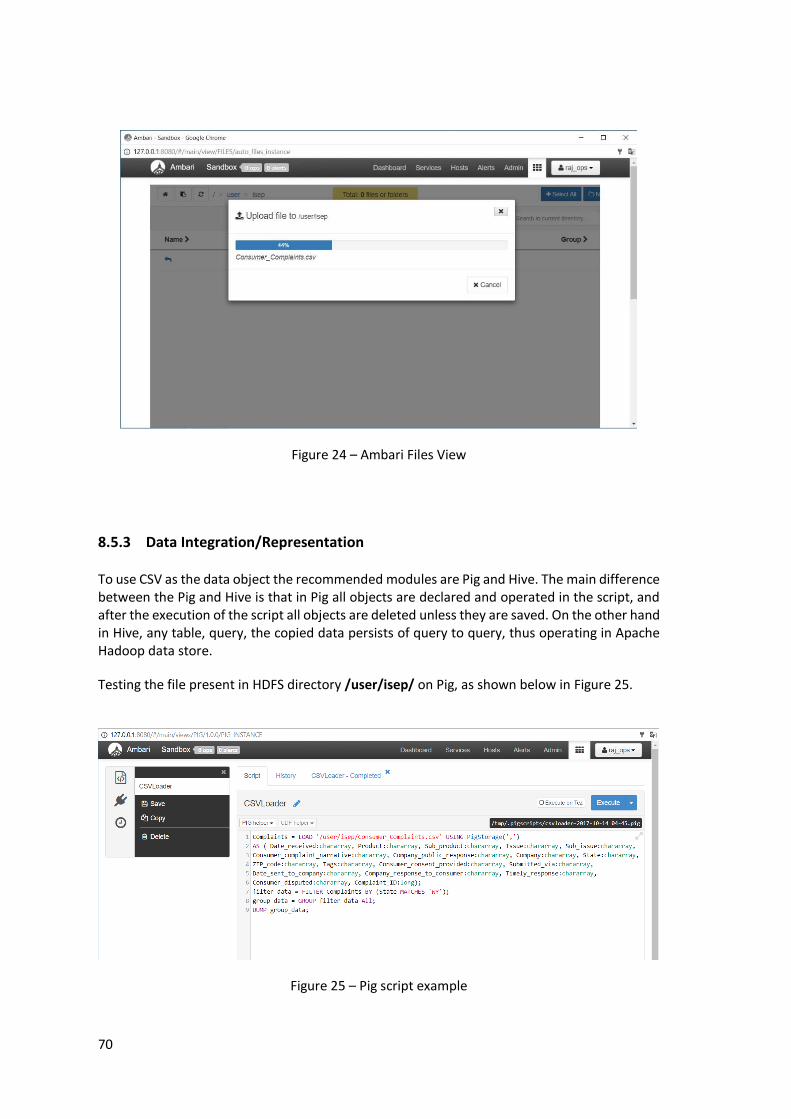
70
Figure 24 – Ambari Files View
8.5.3 Data Integration/Representation
To use CSV as the data object the recommended modules are Pig and Hive. The main difference between the Pig and Hive is that in Pig all objects are declared and operated in the script, and after the execution of the script all objects are deleted unless they are saved. On the other hand in Hive, any table, query, the copied data persists of query to query, thus operating in Apache Hadoop data store.
Testing the file present in HDFS directory /user/isep/ on Pig, as shown below in Figure 25.
Figure 25 – Pig script example

71
For this experience, Hive seemed more appropriate due to its persistence, but also to the fact that it is more intuitive, uses the Hive query language (HiveQL) similar to SQL and with visual representation of data and process.
In Hive, it is necessary to create a table to hold the data. The query in HiveQL typed into the Query Editor to hold the data is the follow:
Create Table temp_complaints (col_value STRING);
Code 1 – Create Table in HiveQL
After creating the temporary table with just one column, it is necessary to load the CSV file into the temp_complaints table, the following code is executed:
LOAD DATA INPATH ‘/user/isep/Consumer_Complaints.csv’
OVERWRITE INTO TABLE temp_complaints;
Code 2 – Load CSV file to table
After loading the file, the table temp_compaints was populated with data from the CSV file and the file was also consumed from HDFS. Next, the definitive table was created with the desired columns according to the data fields found in the file, as seen in Figure 26.
Figure 26 – Structure of the table Complaints in HiveQL

72
To extract the data from table temp_complaints and copy it into table complaints, it was used regular expressions, as seen in Figure 27.
Figure 27 – Load data from temporary table into complaints
Next, it was possible to query the table complaints (see. Figure 28 with the first row of the table complaints).
Figure 28 – The First row of the table complaints

73
8.5.4 Analysis and Visual Representation
At this point, it is possible to filter the data to have results from the dataset with the complaints filed by US citizens to US government about financial products and services. For this experiment we executed a query, to know the number of complaints by-product in the state of Wyoming. In the Figure 29 it can be seen the result in a tabular form.
Figure 29 – Complaints in Wyoming by-product
It is possible to view the data as a simple chart (see. Figure 30), such as point chart, area chart, bar chart, line chart and tick chart. By visualizing the data it is clear that Debt collection is the product that has more complaints.

74
Figure 30 – Data Visualization in Hive
8.6 HPCC
For the experiment on HPCC, the virtual appliance with the latest version (6.4.2) of HPCC Systems platform has been downloaded and imported into VirtualBox; the process is standard, just follow the virtual assistant and almost excludes advanced and additional settings.
8.6.1 Cluster Manager
There are several interfaces to manage the HPCC platform, such as ECL IDE, Eclipse, Command line ECL, ECL Watch, DFU Plus and others (“HPCC Systems Platform,” 2016). All of these interfaces run on the Enterprise Services Platform (ESP) and have the option of LDAP authentication, an interesting option for companies that have LDAP. ECL IDE and HPCC Client Tools is also an interesting tool for end users because it has a version to run on MS Windows and designed to run ECL code.
In our experiment, we chose the ECL Watch middleware that comes configured in the virtual appliance and runs in the browser, and there is no need to install.
ECL Watch provides a simple and user-friendly interface (see. Figure 31) allowing users to view node information and check if the other nodes are running as expected, e.g., check processes, examine system end-to-end, monitor the status of jobs and files, and view logs.

75
Figure 31 – ECL Watch start page
8.6.2 Data Acquisition
In the HPCC environment, the physical storage location defined in the HPCC environment is called the Landing Zone or Drop Zone. The dataset was placed in the Landing Zone mydropzone via the “Upload” button, and then we just selected the file (Consumer_Complaints.csv) on our disk. Next, we needed to load the file into Data Refinery, this operation is called spray in HPCC environment alluding to the spread of data across the nodes. Because our dataset was a CSV file, we had to select the file in Dropzone and click the “Delimited” button, as seen in Figure 32.

76
Figure 32 – Spray the Data File to your THOR Cluster
This operation is done with the help of an assistant; it is at this stage that we define the name and target scope by which our dataset will be identified in the ECL as a logical file.
8.6.3 Data Integration/Representation
After the file spray process is completed, for this file takes about 21 seconds. Next, it was possible to see the logical file (see. Figure 33), its contents (see. Figure 34) and the structure that the ECL is automatically identified.

77
Figure 33 – Logical File in HPCC
Figure 34 – Logical File contents
8.6.4 Analysis and Visual Representation
To filter and query the data we had to use the ECL playground.
For our experience, we first had to define the layout of the records, this definition can be done directly in the ECL code or pre-create the layout and then export it. Then every time we need to query that layout, we just need to reference it. We have always chosen to define the layout. Thus the structure of the dataset is always visible, which helps in queries.
The layout defined was as follows:

78
Layout_Complaint := RECORD STRING Date_received; STRING Product; STRING Sub_product; STRING Issue; STRING Sub_issue; STRING Consumer_complaint_narrative; STRING Company_public_response; STRING Company; STRING State; STRING ZIP_code; STRING Tags; STRING Consumer_consent_provided; STRING Submitted_via; STRING Date_sent_to_company; STRING Company_response_to_consumer; STRING Timely_response; STRING Consumer_disputed; UNSIGNED3 Complaint_ID; END;
Code 3 – Layout of the record in ECL
After defining the registry layout, the name (Complaints) of the attribute to be used as the dataset is defined, the first argument is the constant string with the name of the logical file, and the second argument the type of file that in our case is a CSV using the number of columns of the file and the field delimiter selected in the spray process. By defining the name of the DATASET is useful for later use in other definitions. The dataset declaration was as follows:
Complaints := DATASET('~isep::complaints::consumer_complaints.csv', ComS,CSV(HEADING(1), SEPARATOR([','])));
Code 4 – Dataset declaration
In Figure 35 we can observe the code in ECL Playground.

79
Figure 35 – ECL Playground
The ECL Playground after executing the ECL and the job end with success than displays the results and also a graph (see. Figure 36) is generated, this can be useful for troubleshooting queries or node problems.
Figure 36 – Activities graph
In ECL Playground the results are displayed in a tabular representation, it is possible to export the results to a compressed file, spreadsheet or CSV. Visualizing ECL results of queries is possible and uncomplicated, this add-on offers a variety of visual representations such as pie chart, line

80
chart, area chart, step chart, scatter chart, bubble chart, word cloud, Maps (see. Figure 37), and others.
Figure 37 – US financial products and services complaints by State
8.7 Experimental Results and Discussion
The installation and configuration of HDP is relatively simple, however, the configuration and operation of the cluster through SSH or console has a higher level of complexity. The user experience in Apache Ambari is intuitive and quite manageable, the modules (e.g., Hive, Pig, and others) that have a visual interface have all the link in the Views icon on the top bar. Although Pig and Hive do the same operations, there is no doubt that Hive by having its SQL like
query language is a positive point. It is familiar to users who have experience using SQL to query
data.
The data visualization in Hive it is very simple, other and advanced visualizations like heat maps are not available, this kind of representation would be interesting considering that there are data from all the US states.
The installation of the virtual appliance of HPCC it is really uncomplicated and fast, it is only necessary to set up a second network adapter.
In HPCC the cluster manager used was the ECL Watch, which is a useful, and easy learning tool, on the main page of ECL Watch, are present in the top bar all the essential modules such as ECL Playground, Files, Publish Queries, Operations and search bar. The search bar allows you to search a diversity of items and supports wildcards, can be searched users, files, workunits, and ECL.
To test the queries and define dataset was used the ECL Playground, without a doubt that is an ideal tool for this purpose. It already has some samples of ECL code available which facilitates

81
the learning of the ECL programming language. After the execution of each query, it was possible to see the results of the DAG, and also to visualize the results in a graphical representation.
The analysis of the workunits is also notable; we can go back to consulting the ECL, the DAG, timers, system variables at that moment, and even see the results again in table or chart.
Also, the variety of available chart types is a plus for the HPCC; it is possible to generate charts like bubble chart, word cloud and maps of the USA and the world without make use of external tools.
According with Hortonworks (2016), Apache Hive is best suited for both interactive batch queries and to the petabyte scale.
All the queries were executed in Hive and on the Apache Tez, because according to the literature the Apache Tez improves the MapReduce paradigm in speed and at the same time maintains the ability to scale petabytes of data (“HDP,” 2016).
Table 18 shows the time of each query in seconds, the Q1 and Q2 take less time than the others and Apache Tez does not show the Directed Acyclic Graph (DAG) of this type of simple queries. However, this times are shown in Hive jobs but rounded to zero decimal places.
Table 18 – HDP queries times in seconds
1st Run 2nd Run 3rd Run 4th Run 5th Run AVG
Q1 2 1 1 1 1 1.200 Q2 1 1 1 1 1 1.000 Q3 69.417 57.122 52.386 36.554 44.220 51.940 Q4 71.604 63.860 74.226 57.506 56.905 64.820 Q5 83.293 85.101 77.255 79.721 78.449 80.764 Q6 93.977 80.253 69.369 78.647 106.809 85.811 Q7 76.470 51.186 37.952 37.688 68.538 54.367 Q8 52.957 44.103 82.551 41.131 70.392 58.227 Q9 46.970 63.884 43.616 39.001 38.329 46.360 Q10 45.509 50.389 43.035 40.130 46.310 45.075
The queries trends of Hortonworks Data Platform are shown in Figure 38, it is verified that the times of each query improve in each interaction.

82
Figure 38 – HDP Queries Trends
For these tests in HPCC, we used the ECL Playground component that is present in the ECL Watch. This is an ideal tool for users who do not have much experience programming in ECL and want to submit some code and see the results (HPCC Systems, 2017). HPCC provides three types of clusters, Roxie, Thor, and hThor. The hThor was the selected and used as the target cluster. It is suitable for testing because hThor emulates the Roxie operation, queries and directly accesses the data disks on a Thor cluster without interfering with the operations of that cluster.
Table 19 shows the time of each query in seconds, the query (Q1) take more time and memory, the default value of the option “outputLimit” is 10MB, and 10MB in HPCC are not sufficient to output the results, to perform this query it is necessary to add the option “outputLimit” and set it to 500 at the beginning of the ECL code.
Table 19 – HPCC queries times in seconds
1st Run 2nd Run 3rd Run 4th Run 5th Run AVG
Q1 13.469 9.211 10.048 9.032 7.673 9.887 Q2 4.612 4.721 4.913 4.771 4.500 4.703 Q3 4.308 4.421 4.507 4.529 4.614 4.476 Q4 4.327 4.718 4.724 4.713 4.546 4.606 Q5 4.420 4.706 4.626 4.645 4.678 4.615 Q6 4.473 4.481 4.653 4.392 4.396 4.479 Q7 4.378 4.687 4.799 4.593 4.547 4.601 Q8 4.404 4.576 4.585 4.636 4.680 4.576 Q9 5.437 4.348 4.348 4.886 4.764 4.757 Q10 4.633 4.963 5.047 4.915 4.954 4.902
The queries trends are shown in Figure 39, it is possible to show query time gain in all the queries during all the runs with exception of the 3rd run of each query during the test.
1 2 3 4 5
Q1 Q2 Q3 Q4 Q5
Q6 Q7 Q8 Q9 Q10

83
Figure 39 – HPCC Queries Trends
Table 20 shows the average times of each query in HDP and HPCC, absolute slowdown and relative slowdown, the absolute difference (2) and the relative difference (3) as the following equation:
𝐴𝑏𝑠𝑜𝑙𝑢𝑡𝑒𝐷𝑖𝑓𝑓𝑒𝑟𝑒𝑛𝑐𝑒 = 𝐴𝑣𝑔𝑄𝑢𝑒𝑟𝑦𝑇𝑖𝑚𝑒𝐻𝐷𝑃 − 𝐴𝑣𝑔𝑄𝑢𝑒𝑟𝑦𝑇𝑖𝑚𝑒𝐻𝑃𝐶𝐶 (2)
𝑅𝑒𝑙𝑎𝑡𝑖𝑣𝑒𝐷𝑖𝑓𝑓𝑒𝑟𝑒𝑛𝑐𝑒 =𝐴𝑏𝑠𝑜𝑙𝑢𝑡𝑒𝐷𝑖𝑓𝑓𝑒𝑟𝑒𝑛𝑐𝑒
𝐴𝑣𝑔𝑄𝑢𝑒𝑟𝑦𝑇𝑖𝑚𝑒𝐻𝐷𝑃× 100 (3)
Table 20 – OVERHEAD HDP vs. HPCC
Query # HDP (secs) HPCC (secs) Abs difference (secs) Rel. difference (%)
Q1 1.200 9.887 -8.687 -87.862%
Q2 1.000 4.703 -3.703 -78.739
Q33 51.940 4.476 47.464 1060.458
Q4 64.820 4.606 60.215 1307.421
Q5 80.764 4.615 76.149 1650.028
Q6 85.811 4.479 81.332 1815.852
Q7 54.367 4.601 49.766 1081.681
Q8 58.227 4.576 53.651 1172.383
Q9 46.360 4.757 41.603 874.646
Q10 45.075 4.902 40.172 819.439
TOTAL 489.563 51.601 437.962 9615.309
1 2 3 4 5
Q1 Q2 Q3 Q4 Q5
Q6 Q7 Q8 Q9 Q10

84
IT is evident in this tests that HDP has better performance in Q1, Q2 tests, that perform a simple query which includes only selecting all columns and filter by a value, and has no aggregate functions or using sorts. HPCC performance is affected when the result returns many lines as is the case with Q1 that returns 879855 lines.
It is noticed that in the HDP when query fewer columns using only one condition (state="WY") and using sorts the performance improves as is the case of Q7.
However, the Q3, Q4, Q5, Q6, Q7, Q8, Q9, Q10 tests had better results in HPCC, when queries use aggregation functions and sorts. In the individual tests, it was verified in the times of the two platforms that the times of each query improve each interaction.
As noted in the table all the queries in Hortonworks Data Platform take a total of 489.563 seconds, and the HPCC take 51.601 seconds, and the difference between the two platforms is of 437.962 seconds (more than 7 minutes).
8.8 Summary
Using the testing method outlined in chapter 6, we have conducted an experiment to empirically analyze some functionalities and queries performance of the two selected platforms HDP and HPCC. The main goal of this test and experiment was to compare the two BDA platforms implementations and indicate possible drawbacks and advantages.
For this end-to-end experiment with virtual machines (VM) was performed, using the official and last virtual appliances from each platform, without any particular configuration or optimization. For the dataset, for the data used in the test we chose a real dataset from the US government (Consumer Financial Protection Bureau), this dataset contains real records from complaints filed by US citizens from all the USA states about financial products.
In the tests performed, each query was run 5 times, and each test results were the average time taken as seen in Table 20.
When we compare the queries executed on both platforms, we find very different results, Hortonworks Data Platform has 2 in 10 better query times and the total of 489.563 seconds, and the HPCC had better times 8 in 10 making a total of 51.601 seconds average times).

85
9 Conclusions
Big Data and Big Data Analytics has a direct relationship with the generation of knowledge since it is a fundamental and necessary element for the decision-making within an organization, where information has been acquired.
In this thesis, the whole chapter 4 presents concepts related with Big Data and challenges within the Big Data Analytics context, in chapter 5 explained features and tools of open source platforms as a basis for comparing those platforms with their most outstanding advantages, features and functionalities.
As exposed in chapter 5, the open source platform analysed Hadoop is the most used and serves as basis for some other mention platforms, maybe the better suited for all contexts are HPCC Systems Platform, particularly in the Big Data approach, for integration with existing traditional data managements systems is Hortonworks Data Platform it has its own data integration modules that allows better support for other systems in an approach in terms of processes, analysis, and manipulation of various data sources.
In chapter 7 we evaluated four of the nine platforms described in this research work, focusing on their maturity and functionalities. These aspects are described considering the concepts of the BDA platforms for data analytics, their features, and components. In the future, for such evaluation and selection, the weighting factors of functionality criteria would be more accurate if they were based on questionnaires anonymous to SMEs to know their priorities.
Both platforms are very similar in their cluster manager, components, and functionality, but unlike the HDP, HPC does not use SQL-based interface, but an add-on can be added in HPCC.
When comparing two BDA platforms, HPCC Systems Platform is found to be more efficient and reliable than Hortonworks Data Platform,
There are many possible future performance comparison such as test both the platforms with more nodes to confirm the fault tolerance and scalability.
Without a doubt, several projects and developments offer possibilities for adoption, cost reduction, profit growth and structural for Small and Medium-sized Enterprises (SMEs).

86
In particular, Portuguese SMEs should consider for BDA platforms an opportunity to obtain competitive advantage and improve their processes and consequently define an IT and business strategy.

87
References
Adewumi, A., Misra, S., Omoregbe, N., 2013. A Review of Models for Evaluating Quality in Open Source Software. IERI Procedia 4, 88–92. doi:10.1016/j.ieri.2013.11.014
Akerkar, R. (Ed.), 2014. Big data computing. CRC Press, Boca Raton. Allee, V., 2008. Value network analysis and value conversion of tangible and intangible assets.
J. Intellect. Cap. 9, 5–24. doi:10.1108/14691930810845777 Allee, V., 2000. The value evolution: Addressing larger implications of an intellectual capital
and intangibles perspective. J. Intellect. Cap. 1, 17–32. doi:10.1108/14691930010371627
Almeida, P.D.C. d, Bernardino, J., 2015. Big Data Open Source Platforms, in: 2015 IEEE International Congress on Big Data. Presented at the 2015 IEEE International Congress on Big Data, pp. 268–275. doi:10.1109/BigDataCongress.2015.45
Apache Apex [WWW Document], 2016. URL https://apex.apache.org/ (accessed 11.15.16). Apache Drill - Schema-free SQL for Hadoop, NoSQL and Cloud Storage [WWW Document], n.d.
URL http://drill.apache.org/ (accessed 2.4.17). Apache Solr [WWW Document], 2017. URL http://lucene.apache.org/solr/ (accessed 2.4.17). Apache SparkTM [WWW Document], 2016. . Apache SparkTM - Light.-Fast Clust. Comput. URL
http://spark.apache.org/ (accessed 11.16.16). ApacheTM Hadoop® [WWW Document], 2016. URL http://hadoop.apache.org/ (accessed
11.15.16). Architecture - Apache Drill [WWW Document], 2017. URL
https://drill.apache.org/architecture/ (accessed 2.1.17). Arendt, L., 2008. Barriers to ICT adoption in SMEs: how to bridge the digital divide? J. Syst. Inf.
Technol. 10, 93–108. doi:10.1108/13287260810897738 ATOS, Origin., 2013. Qualification and Selection of Open Source software (QSOS). Azarmi, B., 2015. Scalable Big Data Architecture: A practitioners guide to choosing relevant Big
Data architecture. Apress. Barbosa, F. de O., Romero, F., 2014. A case study of the links between strategy, innovation
and internationalization in Portuguese SMEs, in: KITAB 2014 - Knowledge, Innovation and Technology across Borders : An Emerging Research Agenda. Presented at the KITAB 2014 - Knowledge, innovation and technology across borders : an emerging research agenda.
Barbosa, N., Faria, A.P., 2008. Technology adoption: does labour skill matter? Evidence from Portuguese firm-level data. Empirica 35, 179–194. doi:10.1007/s10663-007-9056-x
Belo, A., Castela, G., Fernandes, S., 2013. How Small and Medium Enterprises Are Using Social Networks? Evidence from the Algarve Region, in: Advances in Information Systems and Technologies, Advances in Intelligent Systems and Computing. Springer, Berlin, Heidelberg, pp. 143–155. doi:10.1007/978-3-642-36981-0_14
Beyer, M., Laney, D., 2012. The Importance of “Big Data”: A Definition [WWW Document]. URL https://www.gartner.com/doc/2057415/importance-big-data-definition (accessed 2.3.17).
Bhadani, A., Jothimani, D., 2017. Big Data: Challenges, Opportunities and Realities. ArXiv170504928 Cs.
Big Data - A New World of Opportunities, 2012. Big data: the next frontier for innovation, competition, and productivity., 2011. . McKinsey,
Lexington, KY.
88
Black, D., Thomas, J., 2013. How Gartner Evaluates Vendors and Markets in Magic Quadrants and MarketScopes [WWW Document]. URL https://www.gartner.com/doc/2560415/gartner-evaluates-vendors-markets-magic (accessed 1.3.17).
Brusakov, M.I., Botvin, G.A., 2017. In-memory technology integration features for work with big data on high-tech enterprises, in: 2017 XX IEEE International Conference on Soft Computing and Measurements (SCM). Presented at the 2017 XX IEEE International Conference on Soft Computing and Measurements (SCM), pp. 697–698. doi:10.1109/SCM.2017.7970694
Cao, J., Chawla, S., Wang, Y., Wu, H., 2017. Programming Platforms for Big Data Analysis, in: Handbook of Big Data Technologies. Springer, Cham, pp. 65–99. doi:10.1007/978-3-319-49340-4_3
Chandrasekhar, U., Reddy, A., Rath, R., 2013. A comparative study of enterprise and open source big data analytical tools, in: 2013 IEEE Conference on Information Communication Technologies. Presented at the 2013 IEEE Conference on Information Communication Technologies, pp. 372–377. doi:10.1109/CICT.2013.6558123
Chang, B.R., Lee, Y.-D., Liao, P.-H., 2017. Development of Multiple Big Data Analytics Platforms with Rapid Response [WWW Document]. Sci. Program. doi:10.1155/2017/6972461
Cuesta, C.E., Martínez-Prieto, M.A., Fernández, J.D., 2013. Towards an Architecture for Managing Big Semantic Data in Real-Time, in: Drira, K. (Ed.), Software Architecture, Lecture Notes in Computer Science. Springer Berlin Heidelberg, pp. 45–53.
Dijcks, J.-P., 2013. Oracle: Big Data for the Enterprise. Dinsmore, T.W., 2016. Disruptive Analytics: Charting Your Strategy for Next-Generation
Business Analytics, 1st ed. edition. ed. Apress, New York, NY. Dittrich, J., Quiané-Ruiz, J.-A., 2012. Efficient big data processing in Hadoop MapReduce. Proc.
VLDB Endow. 5, 2014–2015. doi:10.14778/2367502.2367562 Dumbill, E., 2013. Making Sense of Big Data. Big Data 1, 1,2. Ebbers, M., Abdel-Gayed, A., Budhi, V.B., Dolot, F., Kamat, V., Picone, R., Trevelin, J.,
Redbooks, I.B.M., 2013. Addressing Data Volume, Velocity, and Variety with IBM InfoSphere Streams V3.0. IBM Redbooks.
Elgendy, N., Elragal, A., 2014. Big Data Analytics: A Literature Review Paper, in: Perner, P. (Ed.), Advances in Data Mining. Applications and Theoretical Aspects, Lecture Notes in Computer Science. Presented at the Industrial Conference on Data Mining, Springer International Publishing, pp. 214–227. doi:10.1007/978-3-319-08976-8_16
European Union, 2016. Micro, pequenas e médias empresas: definição e âmbito de aplicação [WWW Document]. URL http://eur-lex.europa.eu/legal-content/PT/TXT/HTML/?uri=URISERV:n26026 (accessed 2.23.17).
Fan, W., Bifet, A., 2013. Mining Big Data: Current Status, and Forecast to the Future. SIGKDD Explor Newsl 14, 1–5. doi:10.1145/2481244.2481246
Ferreira, M., Ferros, L., Fernandes, V., 2012. Avaliação e seleção de software open-source para Gestão Integrada de Bibliotecas, in: 11o Congresso Nacional de Bibliotecários, Arquivistas e Documentalistas. Presented at the 11o Congresso Nacional de Bibliotecários, Arquivistas e Documentalistas, Associação Portuguesa de Bibliotecários, Arquivistas e Documentalistas (APBAD).
Furht, B., Villanustre, F., 2016. Big data technologies and applications. Springer, Cham. Gandomi, A., Haider, M., 2015. Beyond the hype: Big data concepts, methods, and analytics.
Int. J. Inf. Manag. 35, 137–144. doi:10.1016/j.ijinfomgt.2014.10.007 Gartner, 2017. Magic Quadrant for Data Warehouse Data Management Solutions for Analytics
[WWW Document]. URL https://www.gartner.com/doc/reprints?id=1-3TZLPYX&ct=170221&st=sb (accessed 2.24.17).

89
Ghobakhloo, M., Hong, T.S., Sabouri, M.S., Zulkifli, N., 2012. Strategies for Successful Information Technology Adoption in Small and Medium-sized Enterprises. Information 3, 36–67. doi:10.3390/info3010036
Grandzol, J.R., 2005. Improving the Faculty Selection Process in Higher Education: A Case for the Analytic Hierarchy Process. IR Applications. Volume 6. Association for Institutional Research.
Granville, V., 2013. Big Data Ecosystem [WWW Document]. URL http://www.bigdatanews.datasciencecentral.com/profiles/blogs/big-data-ecosystem (accessed 4.21.17).
Gudipati, M., Rao, S., Mohan, N.D., Kumar, N., 2013. Big Data: Testing Approach to Overcome Quality Challenges. Infosys Labs Brief., Big Data: Challenges and Opportunities 11, 65–72.
Han, R., Lu, X., 2014. On Big Data Benchmarking 8807. doi:10.1007/978-3-319-13021-7_1 Hausenblas, M., Nadeau, J., 2013. Apache Drill: Interactive Ad-Hoc Analysis at Scale. Big Data
1, 100–104. doi:10.1089/big.2013.0011 HDP [WWW Document], 2016. . Hortonworks Data Platf. HDP. URL
http://hortonworks.com/products/data-center/hdp/ (accessed 2.4.17). HPCC Systems, 2017. Documentation | HPCC Systems [WWW Document]. URL
https://hpccsystems.com/training/documentation (accessed 6.11.17). HPCC Systems Platform [WWW Document], 2016. . HPCC Syst. Platf. HPCC Syst. URL
https://hpccsystems.com/download/hpcc-platform (accessed 11.15.16). Inoubli, W., Aridhi, S., Mezni, H., Jung, A., 2016. Big Data Frameworks: A Comparative Study.
ArXiv161009962 Cs. Inukollu, V.N., Arsi, S., Ravuri, S.R., 2014. HIGH LEVEL VIEW OF CLOUD SECURITY: ISSUES AND
SOLUTIONS. Conf. Comput. Sci. Eng. Appl. 4. Jeseke, M., Grüner, M., Weiß, F., 2013. BIG DATA IN LOGISTICS. Kabakus, A.T., Kara, R., 2016. A performance evaluation of in-memory databases. J. King Saud
Univ. - Comput. Inf. Sci. doi:10.1016/j.jksuci.2016.06.007 Kaisler, S., Armour, F., Espinosa, J.., Money, W., 2013. Big Data: Issues and Challenges Moving
Forward, in: 2013 46th Hawaii International Conference on System Sciences (HICSS). Presented at the 2013 46th Hawaii International Conference on System Sciences (HICSS), pp. 995–1004. doi:10.1109/HICSS.2013.645
Karambelkar, H., 2013. Scaling Big Data with Hadoop and Solr. Packt Publishing Ltd. Katal, A., Wazid, M., Goudar, R.H., 2013. Big data: Issues, challenges, tools and Good practices,
in: 2013 Sixth International Conference on Contemporary Computing (IC3). Presented at the 2013 Sixth International Conference on Contemporary Computing (IC3), pp. 404–409. doi:10.1109/IC3.2013.6612229
Kejariwal, A., Kulkarni, S., Ramasamy, K., 2015. Real Time Analytics: Algorithms and Systems. Proc VLDB Endow 8, 2040–2041. doi:10.14778/2824032.2824132
Khalifa, S., Elshater, Y., Sundaravarathan, K., Bhat, A., Martin, P., Imam, F., Rope, D., Mcroberts, M., Statchuk, C., 2016. The Six Pillars for Building Big Data Analytics Ecosystems. ACM Comput Surv 49, 33:1–33:36. doi:10.1145/2963143
Khan, N., Yaqoob, I., Hashem, I.A.T., Inayat, Z., Mahmoud Ali, W.K., Alam, M., Shiraz, M., Gani, A., 2014. Big Data: Survey, Technologies, Opportunities, and Challenges. Sci. World J. 2014, e712826. doi:10.1155/2014/712826
Koen, P., Ajamian, G., Burkart, R., Clamen, A., Davidson, J., D’Amore, R., Elkins, C., Herald, K., Incorvia, M., Johnson, A., Karol, R., Seibert, R., Slavejkov, A., Wagner, K., 2001. Providing Clarity and A Common Language to the “Fuzzy Front End.” Res.-Technol. Manag. 44, 46–55. doi:10.1080/08956308.2001.11671418

90
Kudyba, S., 2014. Big Data, Mining, and Analytics: Components of Strategic Decision Making, 1 edition. ed. Auerbach Publications.
Kune, R., Konugurthi, P.K., Agarwal, A., Chillarige, R.R., Buyya, R., 2016. The Anatomy of Big Data Computing. Softw Pr. Exper 46, 79–105. doi:10.1002/spe.2374
Landset, S., Khoshgoftaar, T.M., Richter, A.N., Hasanin, T., 2015. A survey of open source tools for machine learning with big data in the Hadoop ecosystem. J. Big Data 2. doi:10.1186/s40537-015-0032-1
Laney, D., 2001. 3-D Data Management: Controlling Data Volume, Velocity and Variety. Appl. Deliv. Strateg. META Group Inc 949.
Liu, F.C., Shen, F., Chau, D.H., Bright, N., Belgin, M., 2016. Building a research data science platform from industrial machines, in: 2016 IEEE International Conference on Big Data (Big Data). Presented at the 2016 IEEE International Conference on Big Data (Big Data), pp. 2270–2275. doi:10.1109/BigData.2016.7840859
Ma, L., Bao, W., Bao, W., Yuan, W., Huang, T., Zhao, X., 2017. A Mongolian Information Retrieval System Based on Solr, in: 2017 9th International Conference on Measuring Technology and Mechatronics Automation (ICMTMA). Presented at the 2017 9th International Conference on Measuring Technology and Mechatronics Automation (ICMTMA), pp. 335–338. doi:10.1109/ICMTMA.2017.0087
Maier, M., 2013. Towards a Big Data Reference Architecture. Maltby, D., 2011. Big Data Analytics. Assist 2011. Memon, M.A., Soomro, S., Jumani, A.K., Kartio, M.A., 2017. Big Data Analytics and Its
Applications. ArXiv171004135 Cs. Miller, J.A., Bowman, C., Harish, V.G., Quinn, S., 2016. Open Source Big Data Analytics
Frameworks Written in Scala, in: 2016 IEEE International Congress on Big Data (BigData Congress). Presented at the 2016 IEEE International Congress on Big Data (BigData Congress), pp. 389–393. doi:10.1109/BigDataCongress.2016.61
Moebius, R., Staack, V., n.d. Strategic product value management: How companies can improve innovation, reduce costs and mitigate risk [WWW Document]. URL http://www.strategyand.pwc.com/reports/strategic-product-value-management (accessed 2.13.17).
Morais, E.P., Santos, S.S., Gonçalves, R.M., 2011. Electronic Business Maturity in Portuguese SME and Large Enterprises. IBIMA Publ.
Morshed, S.J., Rana, J., Milrad, M., 2016. Open Source Initiatives and Frameworks Addressing Distributed Real-Time Data Analytics, in: 2016 IEEE International Parallel and Distributed Processing Symposium Workshops (IPDPSW). Presented at the 2016 IEEE International Parallel and Distributed Processing Symposium Workshops (IPDPSW), pp. 1481–1484. doi:10.1109/IPDPSW.2016.152
Murthy, D., Bowman, S.A., 2014. Big Data solutions on a small scale: Evaluating accessible high-performance computing for social research. Big Data Soc. 1, 2053951714559105. doi:10.1177/2053951714559105
Navint (Ed.), 2012. Why is BIG Data Important? Olofson, C.W., Vesset, D., 2012. Big Data: Trends, Strategies, and SAP Technology (No.
236135). IDC. Oracle, 2013. Oracle Information Architecture: An Architect’s Guide to Big Data [WWW
Document]. CIO Portal. URL http://www.cioindex.com/article/articleid/119815/oracle-information-architecture-an-architects-guide-to-big-data (accessed 11.1.13).
Pääkkönen, P., Pakkala, D., 2015. Reference Architecture and Classification of Technologies, Products and Services for Big Data Systems. Big Data Res. 2, 166–186. doi:10.1016/j.bdr.2015.01.001

91
Prasad, B.R., Agarwal, S., 2016. Comparative Study of Big Data Computing and Storage Tools : A Review. Int. J. Database Theory Appl. 9, 45–66.
Rijmenam, M. van, 2013. Why the 3V’s are not sufficient to describe big data [WWW Document]. Big Data Startups. URL http://www.bigdata-startups.com/3vs-sufficient-describe-big-data/ (accessed 10.1.13).
Rubinstein, I., 2012. Big Data: The End of Privacy or a New Beginning? (SSRN Scholarly Paper No. ID 2157659). Social Science Research Network, Rochester, NY.
Sabapathi, R., Yadav, S., 2016. Big Data:Technical Challenges towards the Future and its Emerging Trends. AADYA -Natl. J. Manag. Technol. 6, 130–137.
Sagiroglu, S., Sinanc, D., 2013. Big data: A review, in: 2013 International Conference on Collaboration Technologies and Systems (CTS). Presented at the 2013 International Conference on Collaboration Technologies and Systems (CTS), pp. 42–47. doi:10.1109/CTS.2013.6567202
Saraladevi, B., Pazhaniraja, N., Paul, P.V., Basha, M.S.S., Dhavachelvan, P., 2015. Big Data and Hadoop-a Study in Security Perspective. Procedia Comput. Sci. 50, 596–601. doi:10.1016/j.procs.2015.04.091
Scheffler, A., Otyepka, S., 2014. Successful In-Memory Database Usage - A Structured Analysis, in: 20th Americas Conference on Information Systems, AMCIS 2014, Savannah, Georgia, USA, August 7-9, 2014.
Schroeck, M., Shockle, R., Smart, J., Romero-Morales, D., Tufano, P., 2012. Analytics: The real-world use of big data. IBM Institute for Business Value, New York.
Sen, D., Ozturk, M., Vayvay, O., 2016. An Overview of Big Data for Growth in SMEs. Procedia - Soc. Behav. Sci., 12th International Strategic Management Conference, ISMC 2016, 28-30 October 2016, Antalya, Turkey 235, 159–167. doi:10.1016/j.sbspro.2016.11.011
Sharma, I., Tiwari, R., Anand, A., 2017. Open Source Big Data Analytics Technique, in: Satapathy, S.C., Bhateja, V., Joshi, A. (Eds.), Proceedings of the International Conference on Data Engineering and Communication Technology, Advances in Intelligent Systems and Computing. Springer Singapore, pp. 593–602. doi:10.1007/978-981-10-1675-2_58
Sharma, P.P., Navdeti, C.P., 2014. Securing Big Data Hadoop: A Review of Security Issues, Threats and Solution. Int. J. Comput. Sci. Inf. Technol. 5, 2126–2131.
Sivarajah, U., Kamal, M.M., Irani, Z., Weerakkody, V., 2017. Critical analysis of Big Data challenges and analytical methods. J. Bus. Res. 70, 263–286. doi:10.1016/j.jbusres.2016.08.001
Soares, S., 2013. IBM InfoSphere A Platform for Big Data Governance and Process Data Governance. Mc Press, [S.l.].
Stimmel, C.L., 2014. Big Data Analytics Strategies for the Smart Grid. CRC Press. Troester, M., 2012. Big Data Meets Big Data Analytics: Three Key Technologies for Extracting
Real-Time Business Value from the Big Data That Threatens to Overwhelm Traditional Computing Architectures. [WWW Document]. URL http://www.sas.com/en_us/whitepapers/big-data-meets-big-data-analytics-105777/download.html (accessed 11.13.14).
Tsai, C.-W., Lai, C.-F., Chao, H.-C., Vasilakos, A.V., 2015. Big data analytics: a survey. J. Big Data 2, 21. doi:10.1186/s40537-015-0030-3
Umm-e-Laila, Zahoor, A., Mehboob, K., Natha, S., 2017. Comparison of open source maturity models. Procedia Comput. Sci., The 8th International Conference on Advances in Information Technology 111, 348–354. doi:10.1016/j.procs.2017.06.033
V. Allee, “A Value Network Approach for Modeling and Measuring Intangibles,” Transparent Enterprise, Madrid, 2002. - References - Scientific Research Publish [WWW
92
Document], n.d. URL http://www.scirp.org/(S(351jmbntvnsjt1aadkposzje))/reference/ReferencesPapers.aspx?ReferenceID=747909 (accessed 2.13.17).
Vaishnavi, V., Kuechler, B., 2012. Design Research in Information Systems [WWW Document]. URL http://desrist.org/design-research-in-information-systems/ (accessed 1.22.17).
Ventana Research: Big Data Analytics [WWW Document], 2014. . Pentaho. URL http://www.pentaho.com/resource/ventana-research-big-data-analytics (accessed 2.3.17).
Wingerath, W., Gessert, F., Friedrich, S., Ritter, N., 2016. Real-time stream processing for Big Data. It - Inf. Technol. 58, 186–194. doi:10.1515/itit-2016-0002
Yadav, D., Sanchez-Cuadrado, S., Morato, J., Morillo, J.B.L., 2013. An approach for spatial search using SOLR, in: Confluence 2013: The Next Generation Information Technology Summit (4th International Conference). Presented at the Confluence 2013: The Next Generation Information Technology Summit (4th International Conference), pp. 202–208. doi:10.1049/cp.2013.2316
Yan, J., 2013. Big Data, Bigger Opportunities - Data.gov’s roles: Promote, lead, contribute, and collaborate in the era of big data.
Yang, W., Haider, S.N., Zou, J., Zhao, Q., 2016. Industrial Big Data Platform Based on Open Source Software. Presented at the International Conference on Computer Networks and Communication Technology (CNCT 2016), Atlantis Press. doi:10.2991/cnct-16.2017.90
Zhang, S., Yang, Y., Fan, W., Winslett, M., 2014. Design and Implementation of a Real-time Interactive Analytics System for Large Spatio-temporal Data. Proc VLDB Endow 7, 1754–1759. doi:10.14778/2733004.2733079
Zikopoulos, P., Eaton, C., Deutsch, T., Deroos, D., Lapis, G., 2011. Understanding Big Data: Analytics for Enterprise Class Hadoop and Streaming Data, 1 edition. ed. McGraw-Hill Osborne Media, New York.
Zikopoulos, P.C., deRoos, D., Parasuraman, K., Deutsch, T., Corrigan, D., Giles, J., 2013. Harness the power of Big Data: the IBM Big Data platform. McGraw-Hill, New York; Singapore.

93
Appendix
Appendix I - Big Data Analytics: A Preliminary Study of Open
Source Platforms

94

95
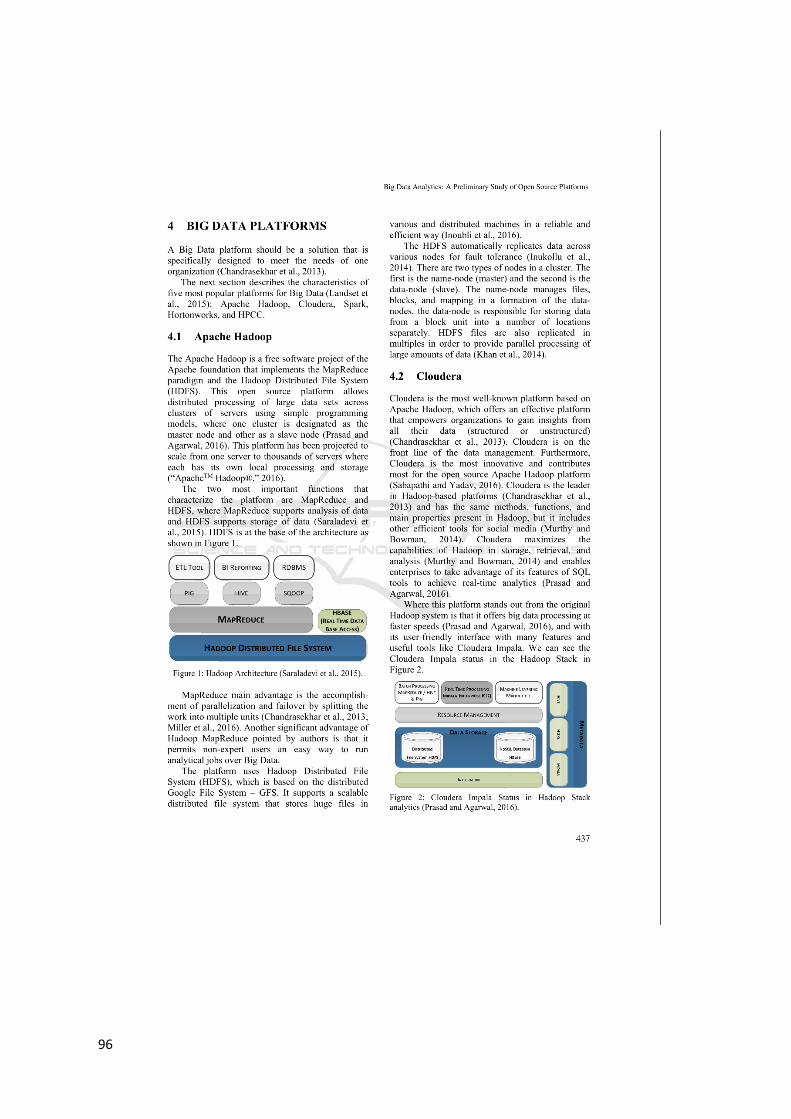
96

97

98

99

100
Appendix II: Value Analysis Questionnaire
Q1: Numa fase inicial de um processo de negócio e de inovação, baseado no modelo de Peter
Koen:
Identifique e explicite, de acordo com o seu tema de projeto, os 5 elementos chave do modelo
“the new concept development model” (NCD).
Identifique métodos/técnicas e/ou ferramentas para analisar cada elemento chave.
R1: O conceito de desenvolvimento neste trabalho é sistemático, é um estudo cooperativo e
espera ser uma aplicação de inovação. A inovação consiste em novas ideias, conceitos,
doutrinas, etc. O the new concept development model é importante para este e qualquer
trabalho porque possibilita e potencia conceitos alternativos.
Os cinco elementos-chave do modelo “the new concept development model”(Koen et al., 2001)
são:
a) Opportunity Identification: É neste momento que organização identifica uma
oportunidade para obter uma vantagem competitiva, responder a uma ameaça ou
resolver um problema. Este elemento é normalmente motivado pelos objetivos do
negócio. Nesta etapa podem-se usar técnicas de criatividade, resolução de problemas,
brainstorming. E utilizadas como ferramentas o diagrama de espinha de peixe
(Ishikawa), mapas mentais e mapeamento de processos.
b) Opportunity Analysis: Aqui é onde se considera que a oportunidade deve ser avaliada e
estabelecida uma prioridade à mesma. Uma boa análise da oportunidade irá
determinar o tempo e esforço despendido, o tempo de desenvolvimento, o ajuste com
a estratégia e cultura da empresa, e os possíveis riscos. Nesta etapa podem-se usar
técnicas de grupos de discussão, pesquisa de mercado, análise de tendências e estudo
de cenários. Para esta fase podem-se usar ferramentas como o diagrama de espinha de
peixe (Ishikawa), mapas mentais e mapeamento de processos.
c) Idea genesis: É neste elemento onde a oportunidade é formulada e transformada em
novas ideias de produto. Sendo um processo evolutivo as ideias sugeridas, estas podem
ser eliminadas, unidas, ajustadas, alteradas e atualizadas, até surgir uma solução que
vá de encontro à necessidade do cliente, e à capacidade produtiva ou comercial. Nesta
etapa podem-se usar técnicas de contato direto com os clientes e utilizadores, parcerias
com outras equipas transversais, colaboração com outras organizações ou instituições,
brainstorming, e etnografia. E utilizadas como ferramentas um banco de ideias, folhas
de cálculo, software e sistemas de informação e comunicação.
d) Idea selection: Depois de ter as ideias formadas, é neste passo onde a melhor ideia é
escolhida ou várias ideias para o desenvolvimento do conceito. Nesta etapa podem-se
usar técnicas de determinação de sucesso probabilístico, probabilidade de sucesso
comercial, retorno, encaixe estratégico e processos de seleção de ideias com feedback
dos criadores das ideias. E utilizadas como ferramentas um software especifico.
e) Concept & Technology Development: É onde se seleciona os conceitos da ideia com o
objetivo de alocação de recursos e se inicia o processo de desenvolvimento de novos

101
produtos. Nesta etapa podem-se usar técnicas de desenho de experiencias, otimização
matemática, teste do conceito e brainstorming. E como ferramentas software (exemplo:
planeamento e de analise de viabilidade).
Figura 1 - The NCD model of front end of innovation (Koen et al., 2001)
Q2: Baseado nos conceitos “value”, “value for the customer” e “perceived value”, e de acordo
com o tema da sua tese, qual o valor (benefícios/sacrifícios) para o cliente? Justifique
convenientemente a sua resposta enquadrando os vários benefícios /sacrifícios numa
perspetiva longitudinal de valor.
R2: O cliente pode obter benefícios ao implementar uma plataforma open source para análise
de Big Data enquanto ao mesmo tempo sacrifica algum tempo e custos. Como não existe um
custo de aquisição do software pode haver um valor percebido diferente e não totalmente
quantificável, ou seja, resulta do custo-benefício que o cliente reconhece, por exemplo se o
cliente após a implementação reconhecer uma vantagem competitiva e produtiva, o valor
percebido será que foi uma boa aposta e de grande valor, e caso não tenha sucesso, o
investimento foi residual.
Q3: Enuncie a proposta de valor do seu Produto/Serviço.
R3: ver 2.2 acima ( Value Proposition )

102
Q4: Apresente o modelo de negócio de Canvas para descrever a sua ideia de negócio.
R4: ver 2.2 acima (Canvas Model)
Q5: “People naturally network as they work so why not model itself as network” (V.Allee).
Baseado nesta afirmação, de que forma podemos contruir e analisar o valor?
Explique de que forma poderia utilizar o modelo de Verna Allee ou a cadeia de valor de Porter
para analisar o valor de negócio.
R5: Segundo Verna Allee o valor de negócio é melhor desenvolvido através de uma rede de
valor e criado através da cadeia de valor. Os dois tipos de valor que identifica são os tangíveis e
os intangíveis. Assim, o valor não se limita aos produtos e serviços (valores tangíveis), mas
também se cria valor intangível, como o conhecimento, know-how técnico, etc.
Q6: De uma forma geral, um problema que envolva a necessidade de optar por uma decisão
que envolva critérios e alternativas com graus de importância diferentes ou pesos variáveis para
o decisor é necessário o uso de métodos multicritério. A variação desses pesos para cada
critério pode ter diferentes motivos, podendo por exemplo, numa análise de valor de negócio
depender de valor para cliente, da perceção do cliente, dos processos existentes, ou mesmo de
outras opções com carácter subjetivo. Através de um exemplo real ou ilustrativo do seu
trabalho, indique de que forma utilizaria o método AHP. Apresente os cálculos necessários à
elaboração do método.
R6: O Analytical Hierachy Process (AHP) é um processo usado para o processo de decisão. E que
acrescenta valor na gestão de um trabalho, porque estabelece prioridades, parâmetros ótimos
e de seleção de alternativas(Grandzol, 2005). Assim, o método AHP pode simplificar e organizar
de forma racional os critérios necessários para a realização deste trabalho de estudo e facilitar
a análise e gestão da execução do trabalho.
Por exemplo uma PME quer uma plataforma open source para BDA, terá que escolher uma que
preencha aos requisitos mínimos exigidos por uma PME e que garanta a continuidade dos
negócios fundamentais na área do BI.
Para este exemplo os critérios utilizados são os seguintes:
Plataforma Open Source para BDA
o Custo com Hardware
o Formação
o Integração
Critérios de qualidade de software (ISO/IEC 9126)
o Funcionalidade
o Manutenibilidade
o Confiabilidade

103
o Usabilidade
o Eficiência
o Portabilidade
Figura 2 - Estrutura Hierárquica da escolha da plataforma
A importância dos critérios e respetiva matriz de comparação é a seguinte:
Tabela 1 - Matriz de comparação de critérios e respetiva matriz normalizada
Critérios Plataforma OS para BDA Qualidade
Plataforma OS para BDA 1 3
Qualidade 1/3 1
SOMA 4/3 4/1
Critérios Plataforma OS para BDA Qualidade Prioridade Relativa
Plataforma OS para BDA 3/4 3/4 0,75
Qualidade 1/4 1/4 0,25
Observa-se que na matriz de comparação, o critério Plataforma OS para BDA têm 3 em relação
ao critério da Qualidade, assim é mais importante.
No próximo passo é calcular a Razão de Consistência (RC).
Λmax = Média(1,5/0,75;0,50/0,25) = 2,00
Uma vez calculado Λmax, deve-se calcular o Índice de Consistência (IC) para logo calcular a
Razão de Consistência (RC).
Escolha da plataforma
Plataforma Open Source
para BDA
Custo com Hardware
Formação Integração
Critérios de qualidade de
software(ISO/IEC 9126)
FuncionalidadeManutenibilida
deConfiabilidade Usabilidade Eficiência Portabilidade
wAw max

104
O índice de consistência é determinado de acordo com a fórmula abaixo, em que n é o número
de critérios:
IC=(2,0-2) / (2-1) = 0
Após feita a comparação dos critérios principais, fez-se uma comparação entre os subcritérios
estabelecidos para um dos critérios.
Tabela 2 - Matriz de comparação de subcritérios de qualidade
Subcritérios Funcionalidade Manutenibilidade Confiabilidade Usabilidade Eficiência Portabilidade
Funcionalidade 1 3 3 2 3 3
Manutenibilidade 1/3 1 2 1/3 1/2 2
Confiabilidade 1/3 1/2 1 1/3 1/2 1/2
Usabilidade 1/2 3 3 1 3 4
Eficiência 1/3 2 2 1/3 1 3
Portabilidade 1/3 1/2 2 1/4 1/3 1
Tabela 3 - Matriz de comparação de critérios plataformas BDA
Subcritérios Custo com hardware Formação Integração
Custo com hardware 1 3 2
Formação 1/3 1 2
Integração 1/2 1/2 1
SOMA 11/6 9/2 5/1
Subcritérios Custo com hardware
Formação Integração Prioridade Relativa
Custo com hardware 6/11 2/3 2/5 0,537
Formação 2/11 2/9 2/5 0,268
Integração 3/11 1/9 1/5 0,195
Observa-se que nos subcritérios de qualidade a Funcionalidade e Usabilidade foram os critérios
com maior peso.
A comparação das alternativas (plataformas) é apresentada na seguinte tabela.
1
n
nIC max

105
Tabela 4 - Comparação de alternativas
Na seguinte tabela apresentam-se os resultados das prioridades normalizadas obtidas com base
nos julgamentos realizados.

106
Tabela 5 - Prioridades
Tal como referido anteriormente, pode-se concluir que os critérios para a Plataforma Open
Source para BDA (L=0,750) tem prioridade em relação aos critérios da Qualidade (L=0,250).
Assim determina-se a prioridade global para cada alternativa:
Plataforma A: [0,045+0,019+0,078+0,011+0,013+0,002+0,024+0,006+0,004] ≅ 0,202
Plataforma B: [0,226+0,109+0,017+0,047+0,011+0,009+0,015+0,016+0,001] ≅ 0,450
Plataforma C: [0,143+0,064+0,030+0,023+0,015+0,005+0,037+0,020+0,011] ≅ 0,348
A plataforma mais viável é a plataforma B.

107
Appendix III - Tests and Evaluation Questionnaire
Questão #1
Descrição clara e sucinta do problema e objetivos
R1:Muitas organizações possuem acesso a dados, e essa informação a retirar pode ter
potencial de alterar significativamente o seu comportamento e sua dinâmica organizacional.
Mas, estas organizações não conseguem tirar partido deste potencial, pois estes dados por
vezes são demasiados e difíceis de processar, armazenados nas mais diversas formas e com
características diferentes. Toda esta necessidade de analisar dados para retirar valor e
produzir novos produtos/serviços traz consigo grandes desafios, que podem ser ultrapassados
pela adoção de uma plataforma de código aberto para análise Big Data adequada. Portanto, é
indispensável o enquadramento conceptual e tecnológico da temática da Big Data Analytics,
incluindo a análise de plataforma de código aberto para análise Big Data já existentes, de
modo a identificar as suas características e limitações.
Questão #2
Que grandezas vai utilizar para avaliar o seu trabalho (e.g. tempo, memória, accuracy, satisfação
do utilizador, …)? Justifique.
R2: Neste trabalho de pesquisa vou analisar tempos médios de resposta a queries e user-
defined functions. Serão feitas n execuções e será calculada uma média aritmética simples por
teste. Os testes serão em número ímpar. Como os dados (data sets) serão de repositórios
(exemplo: Common Crawl15), não será fácil aferir a precisão e número de resultados.
Questão #3
Que hipótese ou hipóteses pretende testar para suportar os resultados do seu trabalho?
R3:Não irão ser feitos testes de hipótese, o número de testes serão impar e não há tempos
esperados nem de referência, como serão testadas duas plataformas, uma delas irá ter melhor
resultado.
15 http://commoncrawl.org/

108
Questão #4
Qual a metodologia de avaliação (e.g. grupos de controlo/teste, usar crossvalidation, resultados
inquérito de satisfação, …)? Justifique.
R4: O Método de Avaliação será com base no resultado dos testes que correspondem a critérios
(ex: aggregation query) a soma dos testes determinará a classificação de cada plataforma.
Questão #5
Como pretende testar essas hipóteses (que teste estatístico vai usar)? Justifique.
R5: Não é aplicável.

109
Appendix IV – Queries used in tests
HPCC: ECL – Enterprise Control Language
Q1
1 2 3 4 5 6 7 8 9 10 11 12 13 14 15 16 17 18 19 20 21 22 23 24 25 26 27 28
#option('outputLimit',500); ComS := RECORD STRING Date_received; STRING Product; STRING Sub_product; STRING Issue; STRING Sub_issue; STRING Consumer_complaint_narrative; STRING Company_public_response; STRING Company; STRING State; STRING ZIP_code; STRING Tags; STRING Consumer_consent_provided; STRING Submitted_via; STRING Date_sent_to_company; STRING Company_response_to_consumer; STRING Timely_response; STRING Consumer_disputed; UNSIGNED3 Complaint_ID; END; //Data Complaints := DATASET('~isep::complaints::consumer_complaints.csv',ComS,CSV(HEADING(1), SEPARATOR([',']))); Complaints;
Q2
1 2 3 4 5 6 7 8 9 10 11 12
#option('outputLimit',500); ComS := RECORD STRING Date_received; STRING Product; STRING Sub_product; STRING Issue; STRING Sub_issue; STRING Consumer_complaint_narrative; STRING Company_public_response; STRING Company; STRING State;

110
13 14 15 16 17 18 19 20 21 22 23 24 25 26 27 28 29
STRING ZIP_code; STRING Tags; STRING Consumer_consent_provided; STRING Submitted_via; STRING Date_sent_to_company; STRING Company_response_to_consumer; STRING Timely_response; STRING Consumer_disputed; UNSIGNED3 Complaint_ID; END; //Data Complaints := DATASET('~isep::complaints::consumer_complaints.csv',ComS,CSV(HEADING(1), SEPARATOR([',']))); WyomingComplaints:= Complaints(State='WY'); WyomingComplaints;
Q3
1 2 3 4 5 6 7 8 9 10 11 12 13 14 15 16 17 18 19 20 21 22 23 24 25 26 27 28 29
#option('outputLimit',500); ComS := RECORD STRING Date_received; STRING Product; STRING Sub_product; STRING Issue; STRING Sub_issue; STRING Consumer_complaint_narrative; STRING Company_public_response; STRING Company; STRING State; STRING ZIP_code; STRING Tags; STRING Consumer_consent_provided; STRING Submitted_via; STRING Date_sent_to_company; STRING Company_response_to_consumer; STRING Timely_response; STRING Consumer_disputed; UNSIGNED3 Complaint_ID; END; //Data Complaints := DATASET('~isep::complaints::consumer_complaints.csv',ComS,CSV(HEADING(1), SEPARATOR([',']))); WyomingComplaints:= Count(Complaints(State='WY')); WyomingComplaints;

111
Q4
1 2 3 4 5 6 7 8 9 10 11 12 13 14 15 16 17 18 19 20 21 22 23 24 25 26 27 28 29
#option('outputLimit',500); ComS := RECORD STRING Date_received; STRING Product; STRING Sub_product; STRING Issue; STRING Sub_issue; STRING Consumer_complaint_narrative; STRING Company_public_response; STRING Company; STRING State; STRING ZIP_code; STRING Tags; STRING Consumer_consent_provided; STRING Submitted_via; STRING Date_sent_to_company; STRING Company_response_to_consumer; STRING Timely_response; STRING Consumer_disputed; UNSIGNED3 Complaint_ID; END; //Data Complaints := DATASET('~isep::complaints::consumer_complaints.csv',ComS,CSV(HEADING(1), SEPARATOR([',']))); NewYorkComplaints:= Count(Complaints(State='NY')); NewYorkComplaints;
Q5
1 2 3 4 5 6 7 8 9 10 11 12 13 14
#option('outputLimit',500); ComS := RECORD STRING Date_received; STRING Product; STRING Sub_product; STRING Issue; STRING Sub_issue; STRING Consumer_complaint_narrative; STRING Company_public_response; STRING Company; STRING State; STRING ZIP_code; STRING Tags;

112
15 16 17 18 19 20 21 22 23 24 25 26 27 28 29
STRING Consumer_consent_provided; STRING Submitted_via; STRING Date_sent_to_company; STRING Company_response_to_consumer; STRING Timely_response; STRING Consumer_disputed; UNSIGNED3 Complaint_ID; END; //Data Complaints := DATASET('~isep::complaints::consumer_complaints.csv',ComS,CSV(HEADING(1), SEPARATOR([',']))); WYComplaints:= SORT(Complaints(State='WY'),Complaint_ID); WYComplaints;
Q6
1 2 3 4 5 6 7 8 9 10 11 12 13 14 15 16 17 18 19 20 21 22 23 24 25 26 27 28 29 30 31
#option('outputLimit',500); ComS := RECORD STRING Date_received; STRING Product; STRING Sub_product; STRING Issue; STRING Sub_issue; STRING Consumer_complaint_narrative; STRING Company_public_response; STRING Company; STRING State; STRING ZIP_code; STRING Tags; STRING Consumer_consent_provided; STRING Submitted_via; STRING Date_sent_to_company; STRING Company_response_to_consumer; STRING Timely_response; STRING Consumer_disputed; UNSIGNED3 Complaint_ID; END; //Data Complaints := DATASET('~isep::complaints::consumer_complaints.csv',ComS,CSV(HEADING(1), SEPARATOR([',']))); WyomingComplaints:=Complaints(State='WY'); GroupWyomingComplaints:=RECORD WyomingComplaints.Complaint_ID; END;

113
32 33
WYComplaints:= TABLE(WyomingComplaints,GroupWyomingComplaints, Complaint_ID); WYComplaints;
Q7
1 2 3 4 5 6 7 8 9 10 11 12 13 14 15 16 17 18 19 20 21 22 23 24 25 26 27 28 29 30 31 32 33 34 35 36 37 38
#option('outputLimit',500); ComS := RECORD STRING Date_received; STRING Product; STRING Sub_product; STRING Issue; STRING Sub_issue; STRING Consumer_complaint_narrative; STRING Company_public_response; STRING Company; STRING State; STRING ZIP_code; STRING Tags; STRING Consumer_consent_provided; STRING Submitted_via; STRING Date_sent_to_company; STRING Company_response_to_consumer; STRING Timely_response; STRING Consumer_disputed; UNSIGNED3 Complaint_ID; END; //Data Complaints := DATASET('~isep::complaints::consumer_complaints.csv',ComS,CSV(HEADING(1), SEPARATOR([',']))); WyomingComplaints:=Complaints(State='WY'); GroupWyomingComplaints:=RECORD WyomingComplaints.Complaint_ID; WyomingComplaints.Date_received; WyomingComplaints.Issue; WyomingComplaints.Company; WyomingComplaints.State; END; WYComplaints:= SORT(TABLE(WyomingComplaints,GroupWyomingComplaints, Complaint_ID),Complaint_ID); WYComplaints;
Q8
1 2 3 4
ComS := RECORD STRING Date_received; STRING Product; STRING Sub_product;

114
5 6 7 8 9 10 11 12 13 14 15 16 17 18 19 20 21 22 23 24 25 26 27 28 29 30 31 32
STRING Issue; STRING Sub_issue; STRING Consumer_complaint_narrative; STRING Company_public_response; STRING Company; STRING State; STRING ZIP_code; STRING Tags; STRING Consumer_consent_provided; STRING Submitted_via; STRING Date_sent_to_company; STRING Company_response_to_consumer; STRING Timely_response; STRING Consumer_disputed; UNSIGNED3 Complaint_ID; END; Complaints := DATASET('~isep::complaints::consumer_complaints.csv',ComS,CSV(HEADING(1), SEPARATOR([',']))); WyomingComplaints:=Complaints(State='WY'); GroupWyomingComplaints:=RECORD WyomingComplaints.Product; Total:=COUNT(GROUP); END; WYComplaints:= TABLE(WyomingComplaints,GroupWyomingComplaints, Product); WYComplaints;
Q9
1 2 3 4 5 6 7 8 9 10 11 12 13 14 15 16 17 18
ComS := RECORD STRING Date_received; STRING Product; STRING Sub_product; STRING Issue; STRING Sub_issue; STRING Consumer_complaint_narrative; STRING Company_public_response; STRING Company; STRING State; STRING ZIP_code; STRING Tags; STRING Consumer_consent_provided; STRING Submitted_via; STRING Date_sent_to_company; STRING Company_response_to_consumer; STRING Timely_response; STRING Consumer_disputed;

115
19 20 21 22 23 24 25 26 27 28 29 30 31 32 33
UNSIGNED3 Complaint_ID; END; Complaints := DATASET('~isep::complaints::consumer_complaints.csv',ComS,CSV(HEADING(1), SEPARATOR([',']))); WyomingComplaints:=Complaints(State='WY' AND Product='Mortgage'); GroupWyomingComplaints:=RECORD WyomingComplaints.Sub_product; Total:=COUNT(GROUP); END; WYComplaints:= TABLE(WyomingComplaints,GroupWyomingComplaints, Sub_product); WYComplaints;
Q10
1 2 3 4 5 6 7 8 9 10 11 12 13 14 15 16 17 18 19 20 21 22 23 24 25 26 27 28 29 30 31
#option('outputLimit',500); ComS := RECORD STRING Date_received; STRING Product; STRING Sub_product; STRING Issue; STRING Sub_issue; STRING Consumer_complaint_narrative; STRING Company_public_response; STRING Company; STRING State; STRING ZIP_code; STRING Tags; STRING Consumer_consent_provided; STRING Submitted_via; STRING Date_sent_to_company; STRING Company_response_to_consumer; STRING Timely_response; STRING Consumer_disputed; UNSIGNED3 Complaint_ID; END; Complaints := DATASET('~isep::complaints::consumer_complaints.csv',ComS,CSV(HEADING(1), SEPARATOR([',']))); USAComplaints:=Complaints; GroupUSAComplaints:=RECORD USAComplaints.Product; Total:=COUNT(GROUP); END;

116
32 33
AllComplaints:= TABLE(USAComplaints,GroupUSAComplaints, Product); AllComplaints;
HDP: HiveQL - Hive query language
Q1
1 select * from complaints
Q2
1 select * from complaints where state="WY"
Q3
1 select count(*) from complaints where state="WY"
Q4
1 select count(*) from complaints where state="NY"
Q5
1 2
select * from complaints where state = "WY" order by Complaint_ID
Q6
1 2
select Count(*) from (select count(*) from complaints where state="WY" group by Complaint_ID) as table_1;
Q7
1 2
select distinct Complaint_ID, Date_received, Issue, Company, State from complaints where state="WY" order by Complaint_ID
Q8
1 select Product, count(*) from complaints where state="WY" group by Product
Q9
1 2
select Sub_product, count(*) from complaints where state="WY" and Product="Mortgage" group by Sub_product
Q10
1 select Product, count(*) from complaints group by Product;