openmedia.ca/cippic's final comments for crtc 2011-77 (ubb proceedings)
TRANSCRIPT
8/6/2019 OpenMedia.ca/CIPPIC's Final Comments for CRTC 2011-77 (UBB Proceedings)
http://slidepdf.com/reader/full/openmediacacippics-final-comments-for-crtc-2011-77-ubb-proceedings 1/23
Telecom Notice of Consultation CRTC 2011‐77
Review of Billing Practices for Wholesale Residential High‐
Speed Access Services
CRTC Reference No.: 8661‐C12‐201102350
Final Comments of OpenMedia.ca
July 29, 2011
Tamir Israel, Staff Lawyer, CIPPIC
8/6/2019 OpenMedia.ca/CIPPIC's Final Comments for CRTC 2011-77 (UBB Proceedings)
http://slidepdf.com/reader/full/openmediacacippics-final-comments-for-crtc-2011-77-ubb-proceedings 2/23
TABLE OF CONTENTS
INTRODUCTION 1
I. WHOLESALE TARRIFS AS COST RECOVERY 1 II. HOW BEST TO RECOVER INCUMBENT COSTS? 2 THE RELATIVE COST OF AN OFF‐PEAK BYTE 2 VOLUME & CAPACITY: ATTEMPTS TO CORRELATE AND GENERAL RELEVANCE 9 THE INCREMENTAL COST OF A GB/GBPS 13 III. WHAT DOES A WHOLESALE TARIFF BUY YOU? 18 APPENDIX A 1

8/6/2019 OpenMedia.ca/CIPPIC's Final Comments for CRTC 2011-77 (UBB Proceedings)
http://slidepdf.com/reader/full/openmediacacippics-final-comments-for-crtc-2011-77-ubb-proceedings 3/23
CIPPIC/OpenMedia.ca TNC CRTC 2011‐77
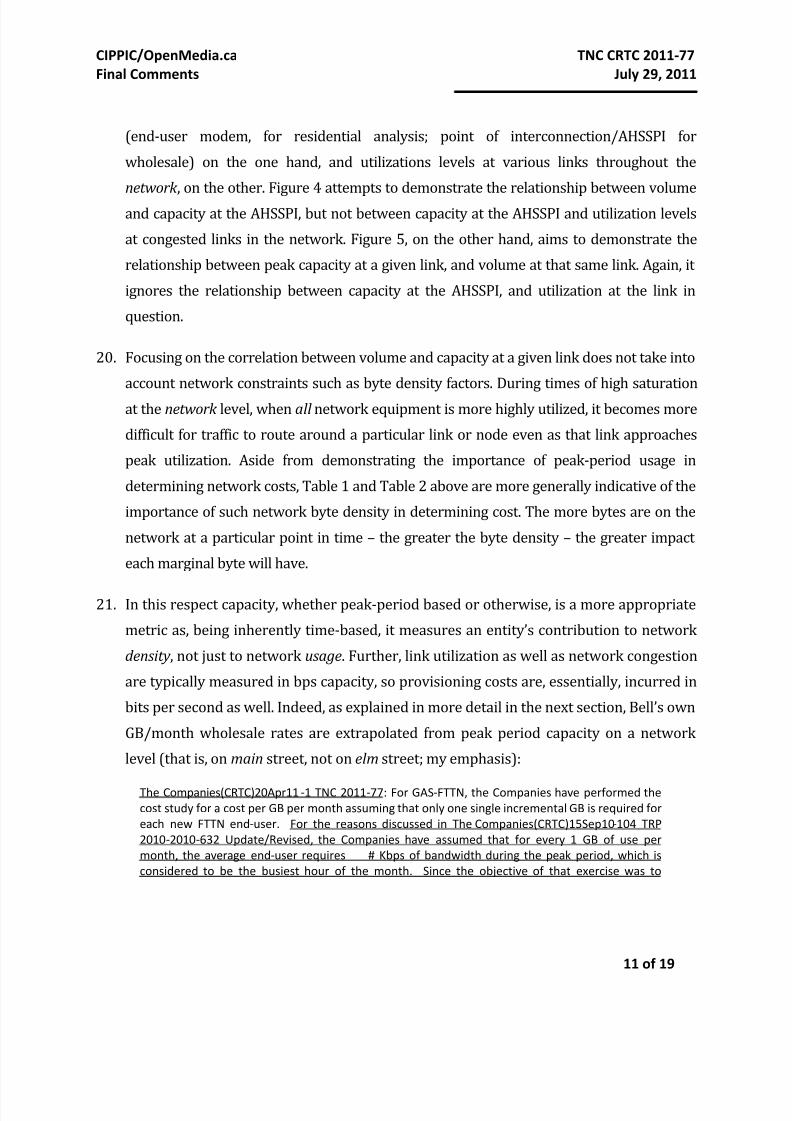
Final Comments July 29, 2011
1 of 19
INTRODUCTION
1. The Samuelson‐Glushko Canadian Internet Policy & Public Interest Clinic and
OpenMedia.ca are pleased to present their final comments in Telecom Notice of
Consultation CRTC 2011‐77, Review of billing practices wholesale residential high speed
business access services.
2. We address the following points in this submission:
The proper composition of a wholesale tariff;
The best mechanism for recovering incumbent costs; and
The range of wholesale autonomy different tariffs should provide.
I. WHOLESALE TARRIFS AS COST RECOVERY
3. While this proceeding does not directly address the issue of retail economic ITMPs and
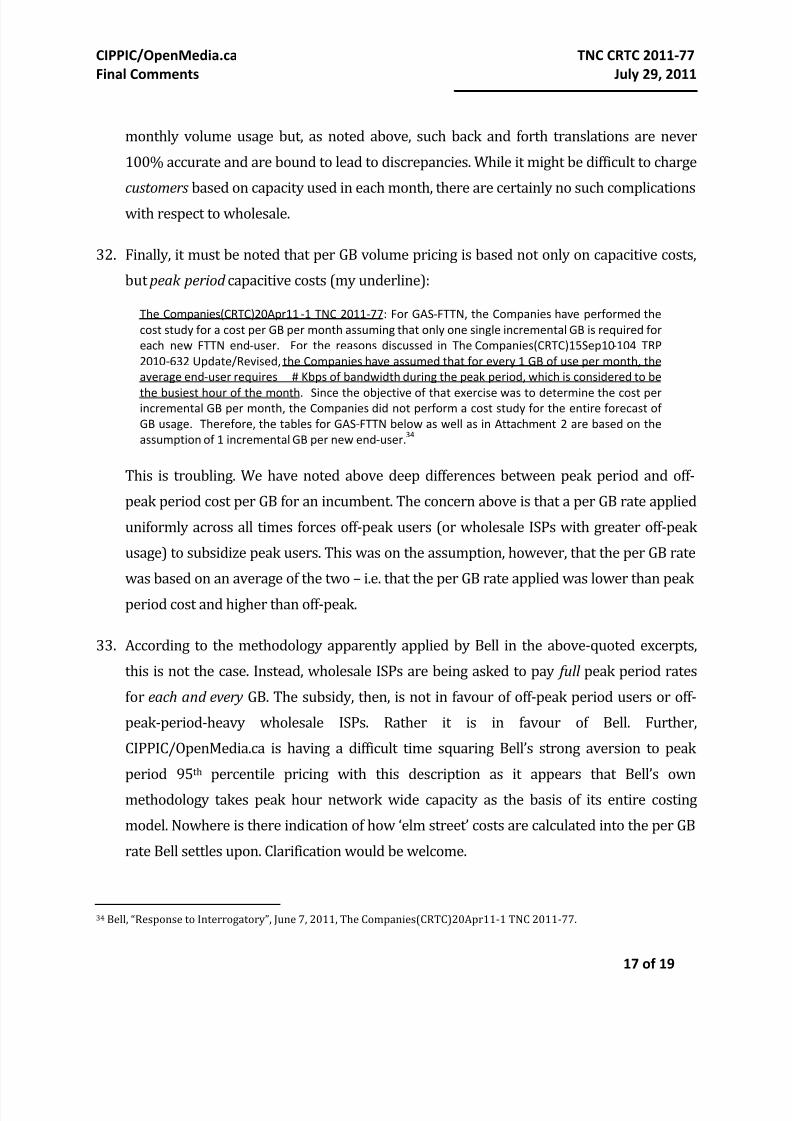
their potential to impact detrimentally on Internet usage and innovation, our position
remains that the Commission cannot ignore the exigencies of the retail market in setting
the parameters of this tariff. Our concerns with respect to the unjustified nature and
potential for harm emerging from unchecked economic ITMPs in the retail market are
well documented in our initial and reply comments to this proceeding. As noted in those
comments, we maintain that wholesale billing principles adopted by the Commission
should be calculated in order to address these retail‐market concerns by maximizing
wholesale ISP autonomy and, hence, ability to provide competitive checks on retail usage‐
based billing.
4. The way to achieve this is to approach the tariff as a cost‐recovery mechanism. As long as
incumbents receive fair recovery for their costs, tariffs should be designed with to provide
wholesale ISPs with maximum flexibility and autonomy. Tariffs should also develop in a
fact‐based and transparent manner. Within the context of this proceeding, which is
wholesale‐focused, this is most likely to ensure online innovation and fairness.
8/6/2019 OpenMedia.ca/CIPPIC's Final Comments for CRTC 2011-77 (UBB Proceedings)
http://slidepdf.com/reader/full/openmediacacippics-final-comments-for-crtc-2011-77-ubb-proceedings 4/23
CIPPIC/OpenMedia.ca TNC CRTC 2011‐77
Final Comments July 29, 2011
2 of 19
II. HOW BEST TO RECOVER INCUMBENT COSTS?
5. Much has been said on the record of this proceeding regarding the relative accuracy of
various different billing attempts to recover incumbent costs. Particular issues have
examined the efficacy of using peak period as opposed to off‐peak period traffic; reliance
on volume in place of capacity as a metric for determining variable usage; and the scope of
autonomy various pricing models should afford. Each is examined below. In analyzing
these various factors, it is very important to keep in mind the difference between volume
and utilization at specific links on a network, on the one hand, and volume/capacity at
wholesale interconnection points on the other.
The relative cost of an off ‐ peak byte
6. While peak‐period usage has long been acknowledged as the primary driver of network
provisioning costs, a number of claims have emerged within the context of this proceeding
that attempt to cast that long‐accepted reality in new light. An examination of the data on
the record of this proceeding demonstrates that, in spite of these claims, peak‐period
usage remains by far the primary driver of network provisioning costs. Indeed, peak
period usage appears to be at least 5‐10 times more likely to trigger an augmentation cost
than off‐peak period usage. An off‐peak byte seems to cost an incumbent approximately1/5th as much as a peak‐period byte, and 77% of bytes that a wholesale ISP will be
charged for are off‐peak bytes. This leaves significant room for overcharging based on
variations between ISPs, and such concerns remains salientirrespective of whether the
wholesale billing model ultimately adopted by the Commission is capacity or volume
based.
7. Bell Canada now defines its peak period as occurring 8:00‐11:00 pm daily.1 CIPPIC
questions this delineation, noting that in prior proceedings Bell defined its peak asrunning from 4:30pm – 2:00am.2 Indeed, this presumed 9.5 hour peak remains the basic
premise under which Bell’s current ITMP policy operates and is justified. 3
1 Bell, “Response to Undertaking”, July 21, 2011, The Companies(CRTC)18Jul11 8 TNC 2011 77 , Confidential, page 5 of 7.2 See Bell, “Response to Interrogatory”, January 13, The Companies(CRTC)4Dec08 1 PN 2008 19, Abridged, page 5 of 14:
8/6/2019 OpenMedia.ca/CIPPIC's Final Comments for CRTC 2011-77 (UBB Proceedings)
http://slidepdf.com/reader/full/openmediacacippics-final-comments-for-crtc-2011-77-ubb-proceedings 5/23
CIPPIC/OpenMedia.ca TNC CRTC 2011‐77
Final Comments July 29, 2011
3 of 19
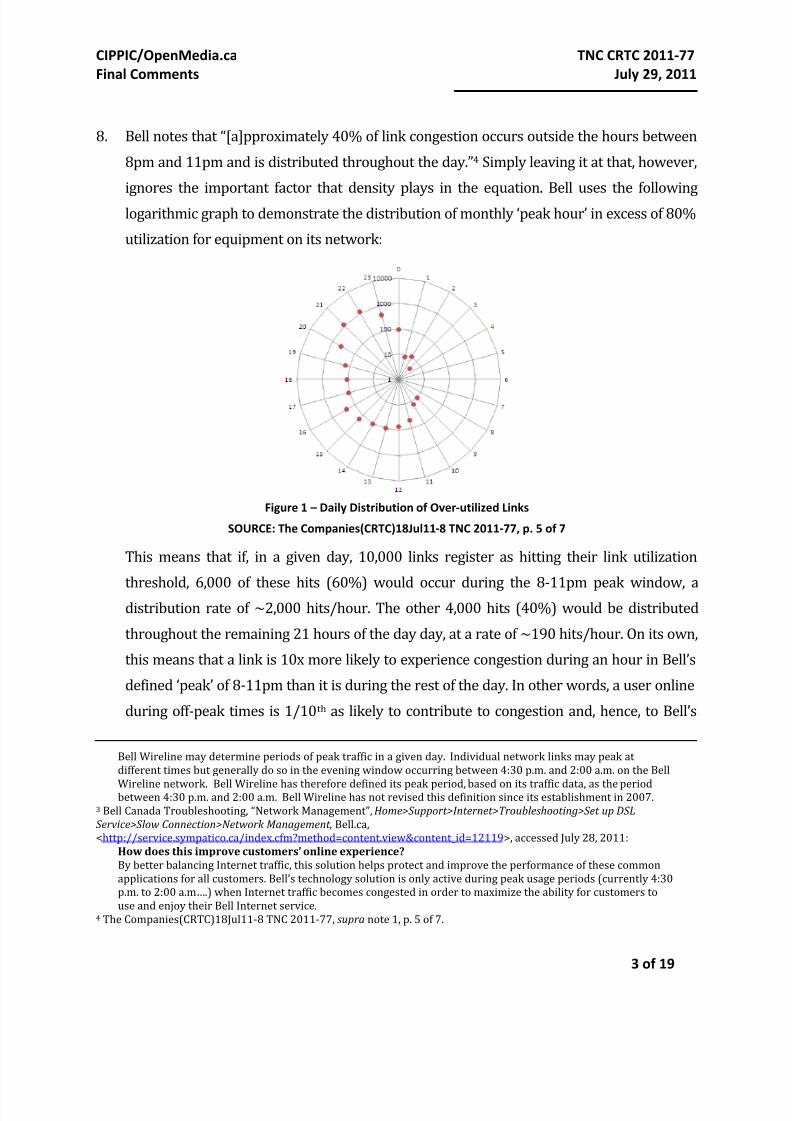
8. Bell notes that “[a]pproximately 40% of link congestion occurs outside the hours between
8pm and 11pm and is distributed throughout the day.”4 Simply leaving it at that, however,
ignores the important factor that density plays in the equation. Bell uses the following
logarithmic graph to demonstrate the distribution of monthly ‘peak hour’ in excess of 80%
utilization for equipment on its network:
Figure 1 – Daily Distribution of Over‐utilized Links
SOURCE: The Companies(CRTC)18Jul11‐8 TNC 2011‐77, p. 5 of 7
This means that if, in a given day, 10,000 links register as hitting their link utilization
threshold, 6,000 of these hits (60%) would occur during the 8‐11pm peak window, adistribution rate of ~2,000 hits/hour. The other 4,000 hits (40%) would be distributed
throughout the remaining 21 hours of the day day, at a rate of ~190 hits/hour. On its own,
this means that a link is 10x more likely to experience congestion during an hour in Bell’s
defined ‘peak’ of 8‐11pm than it is during the rest of the day. In other words, a user online
during off‐peak times is 1/10th as likely to contribute to congestion and, hence, to Bell’s
Bell Wireline may determine periods of peak traffic in a given day. Individual network links may peak at different times but generally do so in the evening window occurring between 4:30 p.m. and 2:00 a.m. on the Bell
Wireline network. Bell Wireline has therefore defined its peak period, based on its traffic data, as the periodbetween 4:30 p.m. and 2:00 a.m. Bell Wireline has not revised this definition since its establishment in 2007.
3 Bell Canada Troubleshooting, “Network Management”, Home>Support>Internet>Troubleshooting>Set up DSL
Service>Slow Connection>Network Management, Bell.ca,<http://service.sympatico.ca/index.cfm?method=content.view&content_id=12119>, accessed July 28, 2011:
How does this improve customers’ online experience? By better balancing Internet traffic, this solution helps protect and improve the performance of these commonapplications for all customers. Bell’s technology solution is only active during peak usage periods (currently 4:30p.m. to 2:00 a.m….) when Internet traffic becomes congested in order to maximize the ability for customers touse and enjoy their Bell Internet service.
4 The Companies(CRTC)18Jul11‐8 TNC 2011‐77, supra note 1, p. 5 of 7.

8/6/2019 OpenMedia.ca/CIPPIC's Final Comments for CRTC 2011-77 (UBB Proceedings)
http://slidepdf.com/reader/full/openmediacacippics-final-comments-for-crtc-2011-77-ubb-proceedings 6/23
CIPPIC/OpenMedia.ca TNC CRTC 2011‐77
Final Comments July 29, 2011
4 of 19
costs, than a user online during 8‐11pm. The cablecos appear to exhibit similar
provisioning patterns.5
9. Further, a ‘byte’ traversing Bell’s network during the highly under‐utilized midnight‐noon
timeslot is only 1/30th as likely to contribute to congestion as a byte generated during 8‐
11pm.6
Time of Day % of Over‐utilized Links
(Figure 1)
Over‐utilized Link Concentration
(links per hour)
Relative Concentration
(as fraction of peak period
links per hour)
Peak Period
(8‐11pm) 60%
6000/10,000
links
2,000 1
Off ‐Peak Period
(12am‐7pm) 40%
4000/10,000 links 190 1/10.5
Midnight‐Noon 8.4%
840/1000 links 65 1/30.8
Table 1 –Congestion Impact of a GB by Time of Day I
10. That is not to say that usage during this 12‐12 period is zero. Indeed, a significant (41% of
all daily bytes) number of ‘bytes’ are transferred over Bell networks during this time slot:
5 See Cable Carriers, “Response to Undertaking”, July 27, 2011, Cable Carriers(CRTC)18Jul11‐1 TNC CRTC 2011‐77. Seealso, Cable Carriers, “Rebuttal Remarks”, July 18, 2011, Telecom Notice of Consultation CRTC 2011‐77, Schedule 1.6 Figure 1 registers 315 ‘hits’ during the 12am‐12pm period and approximately 1,515 ‘hits’ during the entire off‐peak period (12am‐7pm). This means that the 12am‐12pm period accounts for only about 21% of all off‐peak congestion[315/1,515 = 0.21]. Returning to our example above, the off‐peak period generates 40% of all ‘hits’ or 4000/10000 ‘hits’.Of this, 21% or 840 ‘hits’ appear to occur during the 12am‐12pm period. This calculates to a concentration of 65 ‘hits’ perhour [840 hits / 13 hours], or about 1/30th the 2000 peak period ‘hits’ per hour.

8/6/2019 OpenMedia.ca/CIPPIC's Final Comments for CRTC 2011-77 (UBB Proceedings)
http://slidepdf.com/reader/full/openmediacacippics-final-comments-for-crtc-2011-77-ubb-proceedings 7/23
CIPPIC/OpenMedia.ca TNC CRTC 2011‐77
Final Comments July 29, 2011
5 of 19
Figure 2 – Time of Day Traffic as Percentage of Peak
SOURCE: The Companies(CRTC)29April11‐6 TNC 2011‐77, page 1 of 17
Using the graph above, which presents hourly usage as a percentage of peak volume, a
comparison can be achieved if an amount is assigned to the ‘peak’ (for example if ‘100%’ is
said to correlate to 1,000GBs of volume). On can see, then, that 3,910 ‘GBs’ of volume are
‘used’ during peak hours.8 Meanwhile, 7,140 ‘GBs’ of volume are ‘used’ during the 12am‐
12pm time frame,9 and 13,450 ‘GBs’ are used during the entire off‐peak slot of 12am‐
8pm.10
11. When these time‐based volume usage variances are factored in to the per‐hour peak
utilization numbers in Figure 1, the cost per byte disparities pointed out above appear to
be generally confirmed. The 7,140 ‘GBs’ passing through Bell’s network during 12am‐
12pm generated 840 congested links, for a concentration of ~8.5 GB per congested link.
7 The Cable companies confirm comparable patterns and usage percentages in Cable Carriers, “Initial Comments to TNCCRTC 2011‐77”, March 28, 2011, Appendix B, page B3 of B4.8 Peak Period Volumes: 8pm = 970GB [97% of peak usage on the graph]; 9pm = 990GB; 10pm = 1000GB; 11pm = 950GB.Sum = 3910 GB.9 Midnight to Noon Volumes: 12am = 820GB [82% of peak usage on the graph]; 1am = 700GB; 2am = 580GB; 3am =520GB; 4am = 400GB; 5am = 300GB; 6am = 280GB; 7am = 300GB; 8am = 400GB; 9am = 550GB; 10am = 680GB; 11am =780GB; 12pm = 830GB. SUM = 7,140GB.10 Off Peak Period Volumes:12am‐12pm = 7,140GB; 1pm = 860GB; 2pm = 890GB; 3pm = 910GB; 4pm = 940GB; 5pm =890GB; 6pm = 900GB; 7pm = 920GB. SUM = 13,450GBs (12am – 7pm).

8/6/2019 OpenMedia.ca/CIPPIC's Final Comments for CRTC 2011-77 (UBB Proceedings)
http://slidepdf.com/reader/full/openmediacacippics-final-comments-for-crtc-2011-77-ubb-proceedings 8/23
CIPPIC/OpenMedia.ca TNC CRTC 2011‐77
Final Comments July 29, 2011
6 of 19
The entire 13,450 ‘GBs’ of off‐peak usage generated 4,000 over‐utilized network links, a
concentration of ~3.7 GBs per congested link. At peak, the 3,910 ‘GBs’ of volume
generated produced 6,000 congested links, for a concentration of 0.7 GB per congested
link. This means that a byte traversing Bell’s network during off‐peak hours is 1/5 th as
likely to contribute to cost as a byte traversing the network during 8‐11pm.
12. Put another way, volume based models that ignore peak/off‐peak distinctions will
overcharge by a factor of 5x for off‐peak usage. As approximately 77% of bytes traverse
Bells network during off peak hours [13,450 GB / 17,360 GB], while only 23% do so
during peak, this can lead to dramatic overcharging. It is exacerbated when one considers
the midnight‐noon timeslot. While 41% of bytes traverse the network during this period,
these bytes are only 1/12th as likely to contribute to cost and therefore are at least 12x
overpriced.
Time of Day Relative Volume Generated
(GB ‐ Figure 2)
% Daily GB
(Figure 2) Relative # of Over‐utilized Links
(Figure 1)
GB Impact Ratio
(GB : Congested Link)
[as multiple of peak]
Peak Period
(8‐11pm) 3,910 23%11
6,000 0.7:1
12
[1x]
Off ‐Peak Period
(12am‐
7pm)
13,450 77%13
4,000 3.7:1
14
[1/5x]
Midnight‐Noon
7,140 41%15
840
8.5:116
[1/12x]
Table 2 – Congestion Impact of a GB by Time of Day II
Costing models that ignore this distinction are inherently flawed and, in effect, subsidize
peak usage by overcharging for off‐peak bytes by a factor of at least x5, and significantly
higher in the midnight to noon period. Further, as most volume usage occurs during off‐
11 Peak Period Volume as Percentage of Daily Total: According to our relative model set out above with respect to Figure2, there are ~17,360 daily GB (3,190 peak GB + 13,450 off‐peak GB = 17,360 GB per day). Of this, the 3, 190 peak periodGB amount to 23% (3,190 / 17,360 = 0.225).12 3,910 GB / 6,000 over utilized links = 0.7 GB for each congested link.13 Off Peak Volume as Percentage of Daily Total: 13,450 off peak GB / 17,360 daily GB = 0.775.14 13,450 GB / 4,000 over utilized links = 3.7 GB for each congested link. 3.7 is about 5x 0.7, or 5x the congestive impact of a peak‐period Byte.15 Midnight Madness Volume as Percentage of Daily Total: 7,140 midnigt‐midday GB / 17,360 daily GB = 0.411.16 7,140 GB / 840 over‐utilized links = 8.5 GB per congested link. 8.5 is about 12x 0.7, amounting to ~12x the congestiveimpact of a peak‐period Byte.
8/6/2019 OpenMedia.ca/CIPPIC's Final Comments for CRTC 2011-77 (UBB Proceedings)
http://slidepdf.com/reader/full/openmediacacippics-final-comments-for-crtc-2011-77-ubb-proceedings 9/23
CIPPIC/OpenMedia.ca TNC CRTC 2011‐77
Final Comments July 29, 2011
7 of 19
peak periods, this per GB multiplier can accumulate into significant overcharges based on
variations between different users or ISPs.
13. For this reason, as well, stated concerns over wholesale ISP attempts to flatten usage
appear unfounded. Indeed, such ‘flattening’ is simply more efficient usage of existing
network capacity which is currently underutilized. Incumbents operate under similar
incentives to ‘flatten’ network traffic by shifting some usage to off‐peak periods. This
utilizes the network more efficiently, thereby imposing lower costs. Indeed, Bell’s
technical throttling of P2P applications is motivated by this very attempt to push usage to
off‐peak periods:
I think it is clear we showed that peer‐to‐peer is a problem for us during peak periods. So if we
were to turn off throttling, there would be increased instances of congestion. So removal of that
shaping would lead to congestion, which would most likely lead to poor customer service…So from
that point, in face of poor customer service, I would have to ‐‐ I can do two things. I can do nothing
and leave my customers experience the congestion throughout the network, which I am not going
to do, or I can invest, and if I invest, again, I can invest and have to redirect capital from other
locations, from other network projects, or I would pass on potentially pricing increases to the
customers to help me make up the money for that investment.17
‘Flattening’ by wholesale ISPs will similarly lead to more efficient use of the network –
more ‘volume usage’ and less ‘cost’, as underutilized segments of the network are used.
14. It should be noted that network traffic trends appear to be resilient, in that peak period
usage persists as defining feature of such traffic. Indeed, traffic charts from a UK ISP that
has provides discounts for midnight usage demonstrate that, even with ‘midnight
madness’ sales, peak period traffic trends persist.18 Midnight madness sales aside, the
trend in network traffic appears to be moving in the other direction – that is, towards peak
period consolidation:
The traffic on the Companies' networks has been growing as well. Overall traffic grew by 38% in
2009 and 32% in 2010. But, more important for congestion purposes, has been the growth of peak traffic. Because congestion is, by definition, at its worst during the peak usage period and
investments necessary to relieve congestion must target usage as measured during the peak
17 Bell, “Oral Testimony to TPN CRTC 2008‐19”, July 14, 2009, Telecom Public Notice CRTC 2008‐19, at lines 6190‐6192.18 See World Broadband Foundation, “Oral Rebuttal in TNC CRTC 2011‐77”, July 19, 2011, providing traffic trends fromUK ISP PlusNet. Concerns over ‘midnight madness’ sales are stated at: Bell, “Oral Rebuttal Testimony in TNC CRTC 2011‐77”, July 18, 2011, lines 6601‐6602.

8/6/2019 OpenMedia.ca/CIPPIC's Final Comments for CRTC 2011-77 (UBB Proceedings)
http://slidepdf.com/reader/full/openmediacacippics-final-comments-for-crtc-2011-77-ubb-proceedings 10/23
CIPPIC/OpenMedia.ca TNC CRTC 2011‐77
Final Comments July 29, 2011
8 of 19
period, the most important measure from a network provisioning standpoint is that of the peak
period.
Given the nature of video traffic, it is unsurprising that peak traffic is actually increasing at a much
higher rate than global traffic. In fact, the Companies' peak traffic increased by 55% in 2009 and
61% in 2010.19
The reason for this is the move away from P2P as a primary mechanism for media
consumption and towards streaming services. Whereas P2P was more efficient, in that it
allowed those users the flexibility to at times utilize off‐peak periods, it seems users are no
longer relying on such protocols as much, likely because of the almost universal throttling
they are subjected to.20
15.
Video streaming applications such as Netflix exhibit peak‐heavy traffic patterns, meaningthat the move towards video streaming will increase the importance of peak period traffic
as a driver of network cost:
Figure 3 – Typical Netflix Traffic on a Network (U.S.)
SOURCE: Sandvine, Global Internet Phenomenon Report, Fall 201021
Assuming Canadians are not deterred, the trend towards video streaming as a primary
means of consumption should persist, and peak period will continue to drive provisioning
costs to increasing extents.
19 Bell, “Initial Comments to TNC CRTC 2011‐77”, March 28, 2011, paras. 33‐34.20 Sandvine, “Global Internet Phenomena Report”, Spring 2011, notes at p. 2 that P2P has now fallen to only 18.8% of allpeak period traffic.21 Sandvine, “Fall 2010 Global Internet Phenomena Report”.

8/6/2019 OpenMedia.ca/CIPPIC's Final Comments for CRTC 2011-77 (UBB Proceedings)
http://slidepdf.com/reader/full/openmediacacippics-final-comments-for-crtc-2011-77-ubb-proceedings 11/23
CIPPIC/OpenMedia.ca TNC CRTC 2011‐77
Final Comments July 29, 2011
9 of 19
16. Wholesale ISPs who do succeed in convincing their customers to watch movies at 1am, or
whose customers make greater use of more efficient protocols such as P2P, would if
anything lower incumbent costs, not raise them, even while registering higher per month
volumes. Indeed, Figure 4, below, suggests that wholesale ISPs are not being priced fairly,
as between each other. This is because, as appears evident from the above, off‐peak ‘bytes’
cost an incumbent a fraction of peak‐period bytes. For these reasons, a truly cost‐based
tariff, whether capacity based or volume based, cannot ignore the very real distinction
between peak and off peak period costs.
Volume & Capacity: attempts to correlate and general relevance
17. CIPPIC/OpenMedia.ca finds the evidence attempting to correlate volume with capacity on
the record of this proceeding at times irrelevant and at other times contradictory. To begin
with, in The Companies(CRTC)11Jul11‐1 TNC 2011‐77, Bell has put on the record the
following graph analyzing the correlation between 95th percentile peak capacity on
various AHSSPI ports for the month of June 2011, on the one hand, and volume at those
same ports over the same timeframe:
Figure 4 – Correlation Between Capacity & Volume I
SOURCE: The Companies(CRTC)18Jul11‐8 TNC 2011‐77, page 6 of 7, Figure 5
This graph is used to support the conclusion that “at a given 95 th Percentile Peak
Throughput at the AHSSPI, ISPs can drive a wide range of Total Usage…there is no

8/6/2019 OpenMedia.ca/CIPPIC's Final Comments for CRTC 2011-77 (UBB Proceedings)
http://slidepdf.com/reader/full/openmediacacippics-final-comments-for-crtc-2011-77-ubb-proceedings 12/23
CIPPIC/OpenMedia.ca TNC CRTC 2011‐77
Final Comments July 29, 2011
10 of 19
correlation between Peak Throughput at the AHSSPI and Total Usage”.22 The points on the
graph chart daily 95th percentile usage at various AHSSPI interconnection links in relation
to total daily volume at those same AHSSPI links (multiple AHSSPIs are shown, covering
interconnection points for 6 GAS ISPs on Bell’s IP network).
18. In other graphs, incumbents attempt to show a close correlation between 95th percentile
peak utilization at a network node and volume at the same node:
Figure 5 ‐ Correlation Between Capacity & Volume II
SOURCE: The Companies(CRTC)18Jul11‐8 TNC 2011‐77, page 3 of 7, Figure 6
If there is, indeed, a correlation between 95th percentile peak capacity and volume usage at
a given link, it is unclear why strong opposition to a capacity‐based model has manifested
at this proceeding. As the AHSSPI interconnection point is a ‘network link’, this correlation
should not be vastly different here than it is elsewhere on the network. Indeed, upon
closer inspection, similarities can be seen between the two graphs above.
19. Regardless of how this conflict is ultimately resolved, the correlation between capacity
and aggregate volume at a particular link or at the AHSSPI does little to inform the
ultimate question of which metric is a more accurate driver of network costs. That
question is dependent on the correlation between volume/capacity at the point of entry
22 The Companies(CRTC)11Jul11‐1 TNC 2011‐77, page 2 of 2.
8/6/2019 OpenMedia.ca/CIPPIC's Final Comments for CRTC 2011-77 (UBB Proceedings)
http://slidepdf.com/reader/full/openmediacacippics-final-comments-for-crtc-2011-77-ubb-proceedings 13/23
CIPPIC/OpenMedia.ca TNC CRTC 2011‐77
Final Comments July 29, 2011
11 of 19
(end‐user modem, for residential analysis; point of interconnection/AHSSPI for
wholesale) on the one hand, and utilizations levels at various links throughout the
network , on the other. Figure 4 attempts to demonstrate the relationship between volume
and capacity at the AHSSPI, but not between capacity at the AHSSPI and utilization levels
at congested links in the network. Figure 5, on the other hand, aims to demonstrate the
relationship between peak capacity at a given link, and volume at that same link. Again, it
ignores the relationship between capacity at the AHSSPI, and utilization at the link in
question.
20. Focusing on the correlation between volume and capacity at a given link does not take into
account network constraints such as byte density factors. During times of high saturation
at the network level, when all network equipment is more highly utilized, it becomes more
difficult for traffic to route around a particular link or node even as that link approaches
peak utilization. Aside from demonstrating the importance of peak‐period usage in
determining network costs, Table 1 and Table 2 above are more generally indicative of the
importance of such network byte density in determining cost. The more bytes are on the
network at a particular point in time – the greater the byte density – the greater impact
each marginal byte will have.
21. In this respect capacity, whether peak‐period based or otherwise, is a more appropriate
metric as, being inherently time‐based, it measures an entity’s contribution to network
density , not just to network usage. Further, link utilization as well as network congestion
are typically measured in bps capacity, so provisioning costs are, essentially, incurred in
bits per second as well. Indeed, as explained in more detail in the next section, Bell’s own
GB/month wholesale rates are extrapolated from peak period capacity on a network
level (that is, on main street, not on elm street; my emphasis):
The Companies(CRTC)20Apr11 ‐1 TNC 2011‐77: For GAS‐FTTN, the Companies have performed the
cost study for a cost per GB per month assuming that only one single incremental GB is required for
each new FTTN end‐user. For the reasons discussed in The Companies(CRTC)15Sep10‐104 TRP
2010‐2010‐632 Update/Revised, the Companies have assumed that for every 1 GB of use per
month, the average end‐user requires # Kbps of bandwidth during the peak period, which is
considered to be the busiest hour of the month. Since the objective of that exercise was to

8/6/2019 OpenMedia.ca/CIPPIC's Final Comments for CRTC 2011-77 (UBB Proceedings)
http://slidepdf.com/reader/full/openmediacacippics-final-comments-for-crtc-2011-77-ubb-proceedings 14/23
CIPPIC/OpenMedia.ca TNC CRTC 2011‐77
Final Comments July 29, 2011
12 of 19
determine the cost per incremental GB per month, the Companies did not perform a cost study for
the entire forecast of GB usage. Therefore, the tables for GAS‐FTTN below as well as in Attachment
2 are based on the assumption of 1 incremental GB per new end‐user.23
While the number of bytes passing through a link over the course of a day or month may
bear some relationship to congestion on that link, it is the density of bits on a per second
basis that is determinative of whether the link (or a network) will be over‐utilized or
not. A loose correlation between the two allows back and forth, capacity to volume
translation, but this can cause distortions in each translation attempt.
22. Two sets of objections have been raised with respect to the 95 th percentile model. First,
that the model measures usage ‘at the wrong time’. This has nothing to do with the
capacitive (as opposed to volume‐based) nature of the pricing model, but to do with itsfocus on the peak period. A similar, volume‐based model could be devised that would
focus on peak‐period GBs used and this would presumably raise the same objections.
23. The second objection, that measurements are being made ‘at the wrong place’ (meaning
the AHSSPI) and hence fail to account for traffic on ‘Elm street’, is equally applicable to
both the volume‐based and the capacity‐based models. Neither costing scenario (AVP or
95th percentile) is responsive to what is happening on ‘Elm street’, because both are based
on the aggregate amount of usage at the AHSSPI. Ultimately, if priced properly, both avolume‐based and a capacity‐based approach can account for ‘Elm street’ in its per unit
marginal cost. However, a volume‐based approach will require back and forth translation,
leading to increased chances of inaccurate pricing.
24. It appears the real objection to 95th percentile peak period pricing is not, however, that it
is capacity as opposed to volume based, but that it is peak‐period based. A capacity‐based
model can be built, for example, that charges $x/mbps, and imposes those charges onto
wholesale ISPs for their average throughput at the AHSSPI during each hour of the month.This would capture the full range of traffic changes on a network throughout the day. On
the other hand, a model can be devised that will only charge for monthly GB volume
23 Bell, “Response to Interrogatory”, June 7, 2011, The Companies(CRTC)20Apr11‐1 TNC 2011‐77.
8/6/2019 OpenMedia.ca/CIPPIC's Final Comments for CRTC 2011-77 (UBB Proceedings)
http://slidepdf.com/reader/full/openmediacacippics-final-comments-for-crtc-2011-77-ubb-proceedings 15/23
CIPPIC/OpenMedia.ca TNC CRTC 2011‐77
Final Comments July 29, 2011
13 of 19
generated during peak period. This would, presumably, raise the same concerns for
incumbents as the 95th percentile model.
25. Given the wide discrepancies in incumbent cost between peak and off‐peak usage
highlighted in Table 1 and Table 2 above, a cost recovery structure that reflects this is
more appropriate. A volume‐based model, if implemented, would need to adopt different
rates per GB for different times of the day if it were to avoid these discrepancies, but this
would result in very complex billing processes. Similarly, a capacity‐based model that
charged $x/mbps based on hourly averages throughout the month, as opposed to 95th
percentile peak, would require excessively complex billing. As peak capacity represents
the convergence of highest throughput with highest congestion impact and incumbent
cost, the most efficient solution is to build other costs into an incremental $/mbps rate
based on the 95th percentile industry standard rate (with or without commits). For
reasons stated below, we analyze the MTS Allstream proposal, which is based on pre‐
purchased blocks of capacity, separately.
The Incremental Cost of a GB/mbps
26. Each of these models requires very carefully calibrated costs. Bell has now put forward a
cost‐based (plus markup) figure.24 While there is no need to revisit Phase II costingmethodologies in total, it should be noted that Bell’s mechanism for determining volume‐
based costs is a departure in that it ignores the monthly and annual equivalent cost
component traditionally inherent in Phase II costs and adopts a new mechanism for
determining the incremental costs of a GB. For a number of reasons, CIPPIC/OpenMedia.ca
find Bell’s current pricing structures fundamentally flawed and submits, unfortunately,
that these will need to be re‐examined regardless of whether a capacity or volume based
approach is ultimately adopted.
24 As set out in Telecom Decision CRTC 2008‐17, Revised regulatory framework for wholesale services and definition of
essential service, CRTC Reference No.: 8663‐C12‐200614439, <http://www.crtc.gc.ca/eng/archive/2008/dt2008‐17.htm>, para. 136.

8/6/2019 OpenMedia.ca/CIPPIC's Final Comments for CRTC 2011-77 (UBB Proceedings)
http://slidepdf.com/reader/full/openmediacacippics-final-comments-for-crtc-2011-77-ubb-proceedings 16/23
CIPPIC/OpenMedia.ca TNC CRTC 2011‐77
Final Comments July 29, 2011
14 of 19
27. Bell is proposing a $0.178 rate to be charged per monthly GB used by wholesale ISPs.25 A
95th percentile monthly peak capacity rate is provided at $39.15/Mbps.26 As a starting
point it is important to understand that this mbps rate is premised on Bell’s initial
$0.178/GB monthly rate,27 so this second figure remains the focus of our initial analysis.
To begin with, it should be noted that the manner in which the figure blends Legacy and
FTTN incremental costs and markups is problematic. Bell’s per GB FTTN costs appear to
be about 20% lower, and the blended figure appears to heavily favour Legacy over FTTN
(as reflective of current demand breakdown).28 Longer term, this will put wholesale ISPs
at a disadvantage, as more customers migrate to FTTN services and Bell’s relative per GB
cost decreases. Further, the per GB figure makes no distinction between upstream and
downstream ‘GBs’, which is problematic as these are provisioned distinctly and have
distinct costs associated with them.
28. Of greater concern, however, is the manner in which Bell has developed its per GB rate.
That this approach remains the underpinning of Bell’s per GB rate can perhaps best be
seen in Bell’s explanation of how it derived the incremental per GB figure:
The Companies(CRTC)04Feb11‐108 TRP 2010‐632: As stated in The Companies(CRTC)15Sep10 ‐104
TRP 2010‐632 Update/Revised, the Companies undertook a study that assessed the usage for retail
residential DSL customers that showed that for every 1 GB of use per month, the average end‐user
requires # Kbps of bandwidth during the peak period, which is considered to be the busiest hour
of the month.29
The study referred to in this has since been applied to variable‐based usage costs and its
AVP model, as noted by Bell in its reply comments to this proceeding: “The usage costs for
legacy services are # per GB and, as filed in The Companies(CRTC)04Feb11‐108 TRP
25 Stripped of the 15% markup, this amounts to $0.154/GB. As Legacy per GB incremental costs are higher than FTTN, 25 it
is presumed that this represents a blended average rate which includes the 10% additional markup approved by theCommission for FTTN. Stripped of half this markup, the blended Legacy/FTTN cost base appears to be ~$0.147/GB.26 Bell, “Response to Undertaking”, July 21, 2011, The Companies(CRTC)19Jul11‐10 TNC 2011‐77, p. 1 of 3.27 See The Companies(CRTC)19Jul11‐10 TNC 2011‐77, July 21, 2011, p. 1 of 3. See Appendix A.28 See The Companies(CRTC)13Jun11‐1 TNC 2011‐77, pp. 6‐7 of 7: “As noted above, the proposed rates for AVP would not be affected since those rates are not cost‐based…However, in the event that the proposed rates were cost‐based, thenthose rates, based on these revised costs, would be calculated as follows”. FTTN per GB monthly costs plus markup is set,in this interrogatory, at $0.165/GB. Subtracting a markup of 25% (mandatory non‐essential + the additional FTTN risk markup from TNC CRTC 2010‐632), we are left with a $0.132/GB rate for FTTN. Legacy cost +markup rates are presentedas $0.187/GB, or $0.163/GB without the 15% markup. $0.132/GB is approximately 20% lower than $0.163/GB.29 Bell, “Response to Interrogatory”, April 20, 2011, The Companies(CRTC)04Feb11‐108 TRP 2010‐632, p. 1 of 3.

8/6/2019 OpenMedia.ca/CIPPIC's Final Comments for CRTC 2011-77 (UBB Proceedings)
http://slidepdf.com/reader/full/openmediacacippics-final-comments-for-crtc-2011-77-ubb-proceedings 17/23
CIPPIC/OpenMedia.ca TNC CRTC 2011‐77
Final Comments July 29, 2011
15 of 19
2010‐632, the usage costs for FTTN are # per GB, with a weighted average of
# per GB.”.30
29. At first glance three features of this method are particularly problematic. First, it is notable
that Bell appears to derive its per GB rate by: first determining a capacitive kbps rate for
its equipment; next, attempting to determine how much peak hour network capacity
(kbps) is required for each GB generated by an end user; and, finally, by translating their
aggregate, network‐wide, peak hour kbps equipment costs into end‐user per GB costs.
This is most evident in The Companies(CRTC)15Sep10‐104 TRP 2010‐632, on which the
above cited statement is premised:
The Companies(CRTC)15Sep10‐104 TRP 2010‐632: Specifically, the costs of some components…are
driven by bandwidth usage and are therefore affected by the bandwidth requirements during the
peak period. For these components the Companies developed an Installed First Cost (IFC) per Kbps of
peak period usage for use in the cost study. See The Companies(CRTC)15Sep10‐103 TRP 2010‐632.
The Companies then estimated the average GB usage per end‐user per month for each wholesale
DSL‐FTTN speed and developed forecasts of this usage for each year of the study. For reasons
discussed in part b) below, the Companies then assumed that for every 1 GB of usage per month,
the average end‐user required # Kbps of bandwidth during the peak period. The Companies
then multiplied the annual incremental Kbps peak usage for all end‐users by the IFC per Kbps of
peak usage for each of the equipment components listed above and for each of the wholesale DSL‐
FTTN speeds to estimate the total peak usage IFCs for each of those components and for each
wholesale DSL‐FTTN speed.31
The problem with this is that it derives its per GB rate based on end user costs, not based
on wholesale ISP aggregate costs. It is based on presumed average usage scenarios for end
users, listed in table 1 of The Companies(CRTC)15Sep10‐104 TRP 2010‐632. However,
the purpose of moving to an aggregate costing mechanism for wholesale was to avoid
these very per‐end user ‘average use’ presumptions in order to permit wholesale ISPs
greater flexibility in customer base.32 A similar study correlating volume at the AHSSPI
with the same ‘within the network’ equipment based capacity costs (kbps) is likely to yield
more accurate results.
30 As noted at para. 17 of Bell’s Reply Comments to this proceeding.31 The Companies(CRTC)15Sep10‐104 TRP 2010‐632, April 20, 2011.32 This correlation between calculation methodologies is also the reason why Legacy tariffs defined before the move toAVP happen to generate 0 new costs, at least at first, when they are provided AVP‐priced credit based on pre‐existingusage assumptions. See Bell, Initial Comments to this proceeding.

8/6/2019 OpenMedia.ca/CIPPIC's Final Comments for CRTC 2011-77 (UBB Proceedings)
http://slidepdf.com/reader/full/openmediacacippics-final-comments-for-crtc-2011-77-ubb-proceedings 18/23
CIPPIC/OpenMedia.ca TNC CRTC 2011‐77
Final Comments July 29, 2011
16 of 19
30. While there is not a great deal of evidence on the record addressing this point, there is
enough to suggest it is an issue. For example, Bell’s rates ($0.178/GB or $39.15/Mbps)
appear to be based on a ~63% usage scenario – meaning that it is assumed network
equipment will be operating at roughly 63% of theoretical maximum capacity, constantly,
throughout the course of the month (see Appendix A). However, Bell’s data on usage
patterns by 6 of its wholesale ISPs suggests that this is not actually representative of
wholesale usage patterns:
Figure 6 – Daily Usage in Excess of Theoretical Link Capacity
SOURCE: Andrew Moore, Closing Comments, TNC CRTC 2011‐77, Figure 3
In this figure, the red line represents the maximum amount of volume an AHSSPI can
generate in one month’s time (marked on the x‐axis) for a given peak capacity (y‐axis).
The plotted blue dots represent actual ISP volumes (x‐axis) correlated to 95 th percentile
peak capacity (y‐axis). The black line represents average volume per capacity. It appears
from this that average wholesale ISP usage (black line) falls short of 63% of theoretical
maximum (red line), suggesting rates calibrated via retail market average usage may not
be appropriate for wholesale aggregate volume usage. It is important to properly calibrate
this figure for wholesale, to ensure Bell is compensated for its costs in aggregate across all
wholesale ISPs.33
31. Second, it should be noted that the baseline for costing here is capacity‐based. A complex
correlation is undertaken in order to attempt to correlate this existing capacity cost to
33 CNOC(CRTC)12Jul11‐1 TNC 2011‐77, pp. 2‐3 has an answer to this point.
8/6/2019 OpenMedia.ca/CIPPIC's Final Comments for CRTC 2011-77 (UBB Proceedings)
http://slidepdf.com/reader/full/openmediacacippics-final-comments-for-crtc-2011-77-ubb-proceedings 19/23
CIPPIC/OpenMedia.ca TNC CRTC 2011‐77
Final Comments July 29, 2011
17 of 19
monthly volume usage but, as noted above, such back and forth translations are never
100% accurate and are bound to lead to discrepancies. While it might be difficult to charge
customers based on capacity used in each month, there are certainly no such complications
with respect to wholesale.
32. Finally, it must be noted that per GB volume pricing is based not only on capacitive costs,
but peak period capacitive costs (my underline):
The Companies(CRTC)20Apr11 ‐1 TNC 2011‐77: For GAS‐FTTN, the Companies have performed the
cost study for a cost per GB per month assuming that only one single incremental GB is required for
each new FTTN end‐user. For the reasons discussed in The Companies(CRTC)15Sep10‐104 TRP
2010‐632 Update/Revised, the Companies have assumed that for every 1 GB of use per month, the
average end‐user requires # Kbps of bandwidth during the peak period, which is considered to be
the busiest hour of the month. Since the objective of that exercise was to determine the cost per
incremental GB per month, the Companies did not perform a cost study for the entire forecast of
GB usage. Therefore, the tables for GAS‐FTTN below as well as in Attachment 2 are based on the
assumption of 1 incremental GB per new end‐user.34
This is troubling. We have noted above deep differences between peak period and off‐
peak period cost per GB for an incumbent. The concern above is that a per GB rate applied
uniformly across all times forces off‐peak users (or wholesale ISPs with greater off‐peak
usage) to subsidize peak users. This was on the assumption, however, that the per GB rate
was based on an average of the two – i.e. that the per GB rate applied was lower than peak
period cost and higher than off‐peak.
33. According to the methodology apparently applied by Bell in the above‐quoted excerpts,
this is not the case. Instead, wholesale ISPs are being asked to pay full peak period rates
for each and every GB. The subsidy, then, is not in favour of off‐peak period users or off‐
peak‐period‐heavy wholesale ISPs. Rather it is in favour of Bell. Further,
CIPPIC/OpenMedia.ca is having a difficult time squaring Bell’s strong aversion to peak
period 95th percentile pricing with this description as it appears that Bell’s own
methodology takes peak hour network wide capacity as the basis of its entire costing
model. Nowhere is there indication of how ‘elm street’ costs are calculated into the per GB
rate Bell settles upon. Clarification would be welcome.
34 Bell, “Response to Interrogatory”, June 7, 2011, The Companies(CRTC)20Apr11‐1 TNC 2011‐77.

8/6/2019 OpenMedia.ca/CIPPIC's Final Comments for CRTC 2011-77 (UBB Proceedings)
http://slidepdf.com/reader/full/openmediacacippics-final-comments-for-crtc-2011-77-ubb-proceedings 20/23
CIPPIC/OpenMedia.ca TNC CRTC 2011‐77
Final Comments July 29, 2011
18 of 19
34. For all these reasons, it is our position that more careful analysis of pricing is required. As
we noted in CIPPIC(CRTC)12Jul11‐2 TNC 2011‐77, other models have suggested a far
lower per GB rate than that being proposed by Bell in existing costing scenarios. We draw
your attention in particular to a study prepared by Professor Michael Geist (see
Attachment B to the above noted undertaking response), estimates per GB costs to be as
low as $0.07/GB. The methodology adopted in that study could be applied to Bell’s
network by the Commission without great difficulty to determine a factually based
capacity or volume based cost. It would simply be a matter of determining investment
costs for a specific region on Bell’s network for a specified period of time, and dividing it
by peak capacity in that region over that period of time. We note a similar approach as
been suggested in CNOC(CRTC)12Jul11‐2 TNC 2011‐77, and ask that a study of this type
be undertaken.
III. WHAT DOES A WHOLESALE TARIFF BUY YOU?
35. While our final comments to this point have focused primarily on differences between
Bell’s proposed AVP model and CNOC’s 95th percentile proposal, it is our view that the
MTS model has merit as well. If it is to be viable, it will have to be priced more accurately
to reflect the issues raised in Section II above.
36. CIPPIC notes that the MTS model best emulates the manner in which actual incumbent
provisioning costs are incurred in the wholesale market. For this reason, if this model is
adopted, while it may carry a heavier capacitive rate than other suggested models as well
as greater risk allocation, it should be accompanied by greater flexibility and autonomy in
arranging retail packages.
37. Ideally, both the MTS and the 95th percentile models should be made available to the
wholesale market, as some may find one preferable over the other, depending on available
funds and business models. We note in closing that, while it was suggested that permitting
wholesale ISPs to create their own retail packages is in effect a variation on the
Commission’s speed matching decision, we do not view this to be the case, as the speed
matching decision was a.) specific to certain new incumbent modem speed offerings; b.)
imposed obligations on incumbents, not on CLECs; and c.) was premised on the need to

8/6/2019 OpenMedia.ca/CIPPIC's Final Comments for CRTC 2011-77 (UBB Proceedings)
http://slidepdf.com/reader/full/openmediacacippics-final-comments-for-crtc-2011-77-ubb-proceedings 21/23
CIPPIC/OpenMedia.ca TNC CRTC 2011‐77
Final Comments July 29, 2011
19 of 19
ensure greater competition in the retail market. As long as incumbent costs are covered in
some manner (as well, in our view, added recognition for recently incurred investments in
higher speed provisioning, such as FTTN or DOCSIS 3.0), there should not be any objection
in principle to flexibility in retail offerings made by wholesale competitors.
All of which we respectfully submit.
8/6/2019 OpenMedia.ca/CIPPIC's Final Comments for CRTC 2011-77 (UBB Proceedings)
http://slidepdf.com/reader/full/openmediacacippics-final-comments-for-crtc-2011-77-ubb-proceedings 22/23
CIPPIC/OpenMedia.ca TNC CRTC 2011‐77
Final Comments July 29, 2011
1 of 2
APPENDIX A
1. All of Bell’s proposed rates in this proceeding are based on the same usage scenarios. Bell
notes this in The Companies(CRTC)19Jul11‐10 TNC 2011‐77: “The Companies haveperformed an analysis based on the MTS pricing model using the Companies’ current cost
model with no changes to the existing traffic assumptions.”35
2. This is also evident from the relationship between Bell’s 95th percentile peak mbps rate
($39.15) and its 100 percentile rate for a GigE AHSSPI port ($36,888/month). Both, Bell
notes, are based on the same traffic usage assumptions.36 Bell notes that the 100
percentile mbps rate will be lower than the 95th percentile rate. This is because both
represent the same usage patterns and it is these usage patterns that have formed thebasis of Bell’s usage‐based costing since The Companies(CRTC)15Sep10‐104 TRP 2010‐
632. In other words, moving from 95th to 100 percentile billing requires a lower mbps
rate because both capacities at the AHSSPI represent the same number of monthly bytes
in Bell’s model.
3. Bell’s usage scenario can be calculated from a comparison of pricing applied to the MTS
model at 100% capacity using current usage levels and at 100% capacity assuming
maximum theoretical capacity levels.37
4. Bell provides an example of a GigE AHSSPI link. First, scenario A: a link is priced on the
assumption that 100% of its downstream capacity of 1024 mbps will be available to the
wholesale ISP. Under scenario A, the GigE link is presumed to peak monthly at 1024 mbps.
Put another way, it is priced to correspond to 95th percentile peak period capacity of 1024
mbps. The usage‐based price attached to scenario A is $36,888/month.
5. Scenario B: the same GigE link is provided to a wholesale ISP under the assumption that
the entire downstream capacity of the link (1024 mbps) will be used at 100% for every
35 Page 1 of 3, my emphasis.36 Ibid .37 Bell provides these in The Companies(CRTC)19Jul11‐10 TNC 2011‐77, p. 1 of 3. We note that, in reality, theoreticalmaximum can never be achieved at a steady rate over the course of a month. This is because the downstream network operates on a best efforts basis, and there is no guarantee that 1024 mbps (full capacity on a GigE AHSSPI) will beavailable upon demand.
8/6/2019 OpenMedia.ca/CIPPIC's Final Comments for CRTC 2011-77 (UBB Proceedings)
http://slidepdf.com/reader/full/openmediacacippics-final-comments-for-crtc-2011-77-ubb-proceedings 23/23
CIPPIC/OpenMedia.ca TNC CRTC 2011‐77
Final Comments July 29, 2011
second of the entire month. This will generate a presumed 328,320 GBs38 of downstream
traffic over the course of the month, and will cost the wholesale ISP $58,440.96. 39 The
difference between the two figures, we are informed, is the traffic usage pattern that
underpins scenario A (the same traffic assumptions that underpin all of Bell’s costing).40
6. Comparing these two figures, it appears that Bell is using a 63.12% utilization assumption.
This is calculated by dividing the ‘maximum theoretical usage’ rate ($58,440.96) by the
scenario A rate, which is based on maximum capacity but no maximum usage on the same
port ($36,888) = 0.6312.
7. Put another way, the monthly figure used by Bell in scenario A ($36,888) represents
63.12% of the theoretical maximum downstream capacity of the GigE link being used as
an example. The downstream theoretical maximum of the link is 328,320 GB41 and
scenario A appears to presume that only 63.13% of this or has been utilized over the
course of the month (0.6132 * 328,320 GB = 207,235.58 GB/month). As it turns out,
207,235.58 GB/month * $0.178/GB = $36,887.9/month, the initial price provide by Bell
for scenario A.
8. In sum, under Bell’s pricing model, a 1024 mbps monthly capacity peak represents a
monthly cost of $36,888 for 207.2 TB of volume, based on an assumption of 63.12%
AHSSPI utilization.
*** END OF DOCUMENT ***
38 Ibid .39 In Bell’s example at The Companies(CRTC)19Jul11‐10 TNC 2011‐77 uses symmetrical upstream and downstream tocalculate scenario B (1024 x2 maximum theoretical capacity = 656,640 GB/month * 0.178/GB = $116,881/month) but uses only downstream capacity to calculate scenario A. For simplicity’s sake, we use just downstream for both.40 Ibid.
Conceptually, the difference between the [$56,440.96 x2 for symmetrical capacity = $116,881] and the [$36,888]is that the former is based on full usage, and the latter is based on the actual usage pattern of the network measured when the current cost model used by the Companies was developed.
41 Ibid .