operational and administrative analysis
TRANSCRIPT

OPERATIONAL AND
ADMINISTRATIVE
ANALYSIS BILLINGS FIRE DEPARTMENT,
BILLINGS, MONTANA Final Report-May 2021
CENTER FOR PUBLIC SAFETY MANAGEMENT, LLC
475 K STREET NW, STE 702 • WASHINGTON, DC 20001
WWW.CPSM.US • 716-969-1360
Exclusive Provider of Public Safety Technical Services for
International City/County Management Association
CE
NT
ER
F
OR
P
UB
LI
C
SA
FE
TY
M
AN
AG
EM
EN
T,
L
LC

i
THE ASSOCIATION & THE COMPANY The International City/County Management Association is a 103-year-old nonprofit professional
association of local government administrators and managers, with approximately 13,000
members located in 32 countries.
Since its inception in 1914, ICMA has been dedicated to assisting local governments and their
managers in providing services to its citizens in an efficient and effective manner.
ICMA advances the knowledge of local government best practices with its website
(www.icma.org), publications, research, professional development, and membership. The ICMA
Center for Public Safety Management (ICMA/CPSM) was launched by ICMA to provide support
to local governments in the areas of police, fire, and emergency medical services.
ICMA also represents local governments at the federal level and has been involved in numerous
projects with the Department of Justice and the Department of Homeland Security.
In 2014, as part of a restructuring at ICMA, the Center for Public Safety Management (CPSM)
was spun out as a separate company. It is now the exclusive provider of public safety technical
assistance for ICMA. CPSM provides training and research for the Association’s members and
represents ICMA in its dealings with the federal government and other public safety professional
associations such as CALEA, PERF, IACP, IFCA, IPMA-HR, DOJ, BJA, COPS, NFPA, and others.
The Center for Public Safety Management, LLC, maintains the same team of individuals
performing the same level of service as when it was a component of ICMA. CPSM’s local
government technical assistance experience includes workload and deployment analysis using
our unique methodology and subject matter experts to examine department organizational
structure and culture, identify workload and staffing needs, and align department operations
with industry best practices. We have conducted 341 such studies in 42 states and provinces
encompassing 246 communities ranging in population from 8,000 (Boone, Iowa) to 800,000
(Indianapolis, Ind.).
Thomas Wieczorek is the Director of the Center for Public Safety Management.
Leonard Matarese serves as the Director of Research & Program Development. Dr. Dov Chelst is
the Director of Quantitative Analysis.

ii
CENTER FOR PUBLIC SAFETY MANAGEMENT
PROJECT CONTRIBUTORS
Thomas J. Wieczorek, Director
Leonard A. Matarese, Director, Research & Project Development
Dov Chelst, Ph.D. Director of Quantitative Analysis
Michael Iacona, Senior Manager Fire and EMS
Sarah Weadon, Senior Data Analyst
Xianfeng Li, Data Analyst
Dennis Kouba, Senior Editor

iii
CONTENTS
Tables ........................................................................................................................................ v
Figures...................................................................................................................................... vii
Section 1. Executive Summary ............................................................................................... 1
Recommendations ..................................................................................................................................... 2
Section 2. Scope of Project ..................................................................................................... 5
Section 3. Organization and Management ........................................................................... 6
Governance and Administration .............................................................................................................. 6
Billings Fire Department Overview ............................................................................................................ 7
Staffing and Deployment ........................................................................................................................ 13
Fire Station Facilities .................................................................................................................................. 19
Apparatus and Fleet Management ....................................................................................................... 22
Capital Equipment………………………………………………………………………………………………..26
Radio Interoperability and Coverage .................................................................................................... 27
Section 4. Analysis of Planning Approaches ..................................................................... 288
Fire Risk Analysis ....................................................................................................................................... 288
Hazard Analysis and Risk Assessment…………………………………………………………………………29
Hazardous Materials Response ............................................................................................................. 322
Target Hazards and Fire Preplanning ................................................................................................... 344
Accreditation .......................................................................................................................................... 355
Section 5. Operational Response Approaches ................................................................. 377
Fire Response Protocols ............................................................................................................................ 39
Wildland Fires ........................................................................................................................................... 466
Integrated Risk Management ............................................................................................................... 488
EMS Response and Transport................................................................................................................. 500
Mutual Aid/Automatic Response ......................................................................................................... 555
Workload Analysis ..................................................................................................................................... 56
Section 6. Response Time Analysis ..................................................................................... 622
Measuring Response Times .................................................................................................................... 633
Billings Response Times ........................................................................................................................... 644
Section 7. Performance Measurement .............................................................................. 788
Key Performance Indicators for EMS ................................................................................................ 811
Section 8. Essential Resources ............................................................................................ 833
Fire Prevention and Code Enforcement .............................................................................................. 833
ISO Rating ................................................................................................................................................ 866
Education and Training Programs .......................................................................................................... 87
Emergency Management ..................................................................................................................... 922
Emergency Communications Center (911) .......................................................................................... 94
iv
Section 9. Data Analysis .......................................................... Error! Bookmark not defined.6
Methodology ........................................................................................................................................... 966
Aggregate Call Totals and Runs ........................................................................................................... 977
Calls by Type........................................................................................................................................ 977
Calls by Type and Duration ............................................................................................................. 1000
Average Calls by Month and Hour of Day .................................................................................... 1022
Units Arriving at Calls ......................................................................................................................... 1044
Workload: Runs and Total Time Spent ................................................................................................ 1077
Runs and Deployed Time – All Units ................................................................................................ 1077
Workload by Location ...................................................................................................................... 1111
Workload by Unit ............................................................................................................................... 1122
Analysis of Busiest Hours ....................................................................................................................... 1166
Response Time ....................................................................................................................................... 1199
Response Time by Type of Call ........................................................................................................ 1200
Response Time by Hour .................................................................................................................... 1233
Response Time Distribution ............................................................................................................... 1255
Response Time by Location ........................................................................................................... 12828
Attachment I: Actions Taken ............................................................................................................... 1300
Attachment II: Additional Personnel .................................................................................................. 1311
Attachment III: Fire Loss ........................................................................................................................ 1322
Attachment IV: Wildland, Grass, and Brush Fires .............................................................................. 1344
Attachment V: NFPA 1710 Analysis ..................................................................................................... 1355

v
TABLES
TABLE 3-1: Fire Apparatus vs. Small Vehicle Maintenance/Response Cost Comparison ................ 11 TABLE 3-2: BFD Fire Stations, Response Units, and Assigned Personnel ............................................... 14 TABLE 3-3: Potential Program Assignment Duties .................................................................................. 15 TABLE 3-4: Station Locations, Year Built, and Size .................................................................................. 19 TABLE 3-5: BFD Inventory of Frontline Apparatus ................................................................................... 24 TABLE 3-6: Fire Pumper Life Expectancy by Type of Jurisdiction ......................................................... 25 TABLE 5-1: Calls by Call Type and Number of Units Arriving ................................................................. 41 TABLE 5-2: Calls by Type ........................................................................................................................... 42 TABLE 5-3: Content and Property Loss – Structure and Outside .......................................................... 45 TABLE 5-4: Total Fire Loss Above and Below $25,000 ............................................................................ 45 TABLE 5-5: Wildland/Grass & Brush Fires, Billings and Mutual Aid Communities................................. 46 TABLE 5-6: Call Workload by Unit ............................................................................................................. 57 TABLE 5-7: Annual Runs and Deployed Time by Run Type ................................................................... 58 TABLE 5-8: Annual Workload by Call Location ...................................................................................... 59 TABLE 5-9: Station Availability to Respond to Calls ............................................................................... 59 TABLE 5-10: Top 10 Hours with the Most Calls Received ....................................................................... 60 TABLE 5-11: Frequency Distribution of the Number of Calls ................................................................. 61 TABLE 6-1: Average Response Time of First Arriving Unit, by Call Type ............................................... 65 TABLE 6-2: 90th Percentile Response Times, by Call Type .................................................................... 65 TABLE 6-3: Average Response Time of First Arriving Unit, by Location ................................................ 66 TABLE 6-4: 90th Percentile Response Time of First Arriving Unit, by Location ..................................... 66 TABLE 6-5: Average and 90th Percentile Travel Times, Structure Fires ................................................ 67 TABLE 6-6: Number and Percentage of Calls Meeting NFPA 1710 Guidelines, Structure Fires ........ 67 TABLE 6-7: Structure Fires by Number of Responders ............................................................................ 68 TABLE 7-1: The Five GASB Performance Indicators ............................................................................... 79 TABLE 8-1: BFD Fire Prevention Division Major Activity Statistics, 2016–2019 ....................................... 84 TABLE 8-2: Fire Investigations Bureau Statistics, 2016–2019 ................................................................... 86 TABLE 9-1: Call Types ................................................................................................................................. 97 TABLE 9-2: Calls by Type and Duration ................................................................................................. 100 TABLE 9-3: Calls by Call Type and Number of Units Arriving ............................................................... 104 TABLE 9-4: Annual Runs and Deployed Time by Run Type ................................................................. 107 TABLE 9-5: Average Deployed Minutes by Hour of Day ..................................................................... 109 TABLE 9-6: Annual Workload by Call Location .................................................................................... 111 TABLE 9-7: Runs for Structure and Outside Fires by Call Location ..................................................... 111 TABLE 9-8: Call Workload by Unit ........................................................................................................... 112 TABLE 9-9: Total Annual Runs by Run Type and Unit ........................................................................... 113 TABLE 9-10: Daily Average Deployed Minutes by Run Type and Unit .............................................. 114 TABLE 9-11: Frequency Distribution of the Number of Calls ............................................................... 116 TABLE 9-12: Top 10 Hours with the Most Calls Received ..................................................................... 116 TABLE 9-13: Frequency of Overlapping Calls ....................................................................................... 117 TABLE 9-14: Station Availability to Respond to Calls ........................................................................... 118 TABLE 9-15: Average Response Time of First Arriving Unit, by Call Type ........................................... 120 TABLE 9-16: 90th Percentile Response Time of First Arriving Unit, by Call Type ................................. 122 TABLE 9-17: Average and 90th Percentile Response Time of First Arriving Unit, by Hour of Day ... 123 TABLE 9-18: Cumulative Distribution of Response Time – First Arriving Unit – EMS ............................ 126 TABLE 9-19: Cumulative Distribution of Response Time – First Arriving Unit – Outside and Structure
Fires ........................................................................................................................................................... 127 TABLE 9-20: Average Response Time of First Arriving Unit, by Location ............................................ 128

vi
TABLE 9-21: 90th Percentile Response Time of First Arriving Unit, by Location ................................. 128 TABLE 9-22: Actions Taken Analysis for Structure and Outside Fire Calls .......................................... 130 TABLE 9-23: Workload of Administrative Units ...................................................................................... 131 TABLE 9-24: Total Fire Loss Above and Below $25,000 ........................................................................ 132 TABLE 9-25: Content and Property Loss – Structure and Outside Fires .............................................. 132 TABLE 9-26: Wildland, Grass, and Brush Fires by Location and Acres Burned .................................. 134 TABLE 9-27: Average and 90th Percentile Travel Times ...................................................................... 135 TABLE 9-28: Number and Percentage of Calls Meeting NFPA 1710 ................................................. 135 TABLE 9-29: Structure Fires by Number of Responders ........................................................................ 136

vii
FIGURES
FIGURE 3-1: City of Billings Table of Organization .................................................................................... 7 FIGURE 3-2: Billings Fire Department Table of Organization ................................................................... 8 FIGURE 3-3: Alternative Response Vehicle ............................................................................................. 10 FIGURE 3-4: City of Billings Fire Department Station Locations ............................................................ 20 FIGURE 4-1: Community Risk Matrix ......................................................................................................... 29 FIGURE 5-1: Low-Risk Response–Exterior Fire Attack .............................................................................. 37 FIGURE 5-2: Moderate-Risk Response–Interior Fire Attack .................................................................... 38 FIGURE 5-3: Full-Force Response–Utilizing an Aerial Device ................................................................. 38 FIGURE 5-4: Number of Units Dispatched–EMS ...................................................................................... 40 FIGURE 5-5: Number of Units Dispatched–Fire ....................................................................................... 40 FIGURE 5-6: Location of Structure Fires ................................................................................................... 43 FIGURE 5-7: Location of Structure Fires with Fire Loss Greater Than $25,000 ...................................... 44 FIGURE 5-8: Location of Brush/Grass Wildland and Vegetation Fires ................................................. 47 FIGURE 5-9: Area of Concentration of Billings Structure Fires ............................................................... 49 FIGURE 5-10: MDPS Response Matrix ....................................................................................................... 54 FIGURE 6-1: Times to Flashover-Modern vs Legacy Construction Methods ....................................... 63 FIGURE 6-2: Billings Station Locations with Travel Projection of 240 Seconds ..................................... 70 FIGURE 6-3: Billings Station Locations with Travel Projection of 360 Seconds ..................................... 71 FIGURE 6-4: Billings Station Locations with Travel Projection of 480 Seconds ..................................... 72 FIGURE 6-5: Billings Station Locations with Composite Travel Projections .......................................... 73 FIGURE 6-6: BFD Fire Runs ......................................................................................................................... 74 FIGURE 6-7: BFD EMS Runs ........................................................................................................................ 75 FIGURE 6-8: BFD Other Runs ..................................................................................................................... 76 FIGURE 6-9: BFD Responses with Total Response Times of 10 Minutes or Greater ............................. 77 FIGURE 7-1: ESO EMS Index Example ...................................................................................................... 82 FIGURE 9-1: EMS Calls by Type ................................................................................................................. 98 FIGURE 9-2: Fire Calls by Type .................................................................................................................. 98 FIGURE 9-3: Average Calls by Month.................................................................................................... 102 FIGURE 9-4: Calls by Hour of Day........................................................................................................... 103 FIGURE 9-5: Calls by Number of Units Arriving – EMS ........................................................................... 105 FIGURE 9-6: Calls by Number of Units Arriving – Fire ............................................................................ 105 FIGURE 9-7: Average Deployed Minutes by Hour of Day .................................................................. 110 FIGURE 9-8: Average Response Time of First Arriving Unit, by Call Type – EMS ................................ 121 FIGURE 9-9: Average Response Time of First Arriving Unit, by Call Type – Fire ................................. 121 FIGURE 9-10: Average Response Time of First Arriving Unit, by Hour of Day .................................... 124 FIGURE 9-11 Cumulative Distribution of Response Time – First Arriving Unit – EMS ........................... 125 FIGURE 9-12: Cumulative Distribution of Response Time – First Arriving Unit – Outside and Structure
Fires ........................................................................................................................................................... 126

1
SECTION 1. EXECUTIVE SUMMARY
The Center for Public Safety Management, LLC (CPSM) was retained by the City of Billings to
conduct an Operational and Administrative Analysis for its fire department, including a detailed
review of department operations, its interaction with AMR, workload, staffing, fire stations, fire
apparatus, and deployment practices. This analysis includes a thorough review of the
organization structure, training, performance measures, prevention activities, and its service
responsibilities in the Billings Urban Fire Service Area (BUFSA). Specifically, CPSM was tasked with
providing recommendations and alternatives regarding fire department operations, staffing
levels, and alternative modes of operation for current service demand and in terms of options
that can best position the department to respond to the community’s anticipated growth.
CPSM analyzed performance data provided by the Billings Fire Department (BFD) and also
conducted a firsthand examination of the department’s operations. Fire departments tend to
deploy resources utilizing traditional approaches, which are rarely reviewed. To begin the
review, project staff asked for certain documents, data, and information. The project staff used
this information/data to familiarize themselves with the department’s structure, assets, and
operations. The provided information was supplemented with information collected during an
on-site visit to observe the performance of the department and to compare that performance
to national benchmarks. CPSM will typically utilize benchmarks that have been developed by
organizations such as the National Fire Protection Association (NFPA), Center for Public Safety
Excellence, Inc. (CPSE), the ICMA Center for Performance Measurement, as well as others.
Project staff conducted a site visit on October 14–16, 2020, for the purpose of observing fire
department and agency-connected support operations, interviewing key department staff, and
reviewing preliminary data and information. Telephone conference calls as well as email
exchanges were conducted between CPSM project management staff, the city, and the fire
department so that CPSM staff could affirm the project scope, and elicit further discussion
regarding this analysis.
The Billings Fire Department (BFD) is a highly skilled and progressive organization that is making
exceptional progress in dealing with a very significant and growing workload. The personnel with
whom CPSM interacted are truly interested in serving the city to the best of their abilities and
demonstrated a unified goal of achieving excellence in service delivery. As service demands
increase and the department is faced with providing expanded services, it is essential that the
organization continue its strategic planning efforts, organizational team building, performance
measurement, and goal setting. The challenges in Billings are not unique nor are they
insurmountable. CPSM will provide a series of observations and recommendations that we
believe will enable the BFD to become more efficient and smarter in the management of its
emergency and nonemergency responsibilities.
§ § §

2
RECOMMENDATIONS
The Billings Fire Department provides a range of excellent services to its citizens, local businesses,
the university, and visitors to the area. The department is well-respected in the community and
by city leadership. For an organization of the caliber of the BFD, the recommendations provided
in our analysis are minor in comparison to the department’s performance and do not denote
major flaws in its day-to-day operations or overall efficiencies. In an organization such as the
Billings Fire Department, which is achieving a high level of performance, the real challenge
becomes the drive to maintain—in its line personnel and managerial staff—the continued pursuit
of excellence and ongoing improvement.
Thirty-four recommendations are listed below and are also found in applicable sections within
this report. The recommendations are based on best practices derived from the NFPA, CPSM,
ICMA, the U.S. Fire Administration, the International Association of Emergency Managers (IAEM),
and the Federal Emergency Management Agency (FEMA).
These recommendations are listed in the order in which they appear in the report.
1. In future negotiations with the IAFF, the city should pursue a reduction in the number of Kelly
Days awarded to each employee and a corresponding increase in the number of hours in
the firefighter workweek. (See discussion on p. 9.)
2. The Billings Fire Department should consider the use of two-person EMS squad units to handle
EMS and non-emergency service calls in the city’s busiest service districts. (See discussion on
pp. 9-11.)
3. The Billings Fire Department should consider the implementation of a Dynamic Staffing policy
that utilizes peak-period deployment during high service demand periods. (See discussion on
pp. 11-12.)
4. Billings should revise its interpretation of time worked when considering overtime eligibility for
fire personnel and exclude any leave time taken as hours worked when determining overtime
eligibility. (See discussion on p. 12.)
5. BFD should consider the expansion of program management duties for field personnel and
utilize these assignments to enhance career development and subsequently consider
successful fulfillment of these duties as a factor in the promotional process. (See discussion on
pp. 14-16.)
6. The City of Billings should negotiate changes to the promotional requirements for Fire
Equipment Operator (Engineer) and Fire Captain which expand the use of objective testing
and competitive skills assessments and reduce the dependence of seniority in making
appointments. (See discussion on p. 16.)
7. BFD should expand the training requirements, certifications, and college education
prerequisites for the Fire Equipment Operator (Engineer), Fire Captain, and Battalion Chief
promotional processes. (See discussion on pp. 16-17.)
8. The City of Billings should negotiate a reduction in the 15-year time-in-grade requirement for
eligibility to enter the Battalion Chief promotional process. (See discussion on p. 17.)
9. BFD should redefine the purpose of employee performance reviews and utilize these
appraisals as a key component when considering employee promotions, step increases, and
merit reviews. (See discussion on pp. 17-18.)
10. The City of Billings should conduct periodic audits of the CrewSense™ payroll and scheduling
process utilized by the Fire Department. (See discussion on p. 18.)

3
11. The Billings Fire Department should institute a Quality Assurance-Quality Improvement (QA/QI)
review process for its fire incident reporting. (See discussion on p. 18.)
12. The city should undertake a comprehensive fire station capital improvements program and
earmark upwards of $3 million from the recent CARES Act to supplement the funding
available for repairs and renovations to existing facilities. (See discussion on pp.19-22.)
13. The city should work with AMR to implement a common radio frequency that is utilized by
ambulance and fire first responders on all EMS calls. (See discussion on pp. 27.)
14. The Billings Fire Department should conduct a formal fire risk assessment that concentrates on
the city’s downtown, strip commercial establishments, big-box occupancies, high-rise
structures, and industrial, processing, and institutional properties. (See discussion on pp. 29-32.)
15. Billings should consider working toward CPSE Fire Accreditation in the future. (See discussion
on pp. 36-37.)
16. The BFD should consider hiring seasonal fuel crews who can provide fuel management and
wildfire mitigation efforts in the community. (See discussion on pp. 47-49.)
17. BFD should develop an integrated risk management plan that focuses on structure fires in the
areas of the community that demonstrate the highest risk of occurrence. (See discussion on
pp. 49-51.)
18. The City of Billings should move to an Ambulance Provider Services Agreement with AMR and
which specifies the terms and conditions for providing these services to the city. (See
discussion on p. X.)
19. BFD should evaluate its efforts to maintain ALS first response capabilities with its primary
response units. (See discussion on pp. 51-52.)
20. BFD should work with the 911 Dispatch Center to implement response protocols that alter the
BFD response mode when calls are determined to be minor or non-emergency. (See
discussion on pp. 54-55.)
21. BFD should work with AMR, the 911 Dispatch Center, area hospitals, and social service
providers to develop a Billings FD-Mobile Integrated Health/Community Paramedicine
program. (See discussion on pp. 55-56.)
22. BFD should implement a series of performance measures that enable ongoing review of
service outcomes. The process of developing these measures should utilize input from BFD
members, the Fire Union, the community, the City Council, and City Administration. (See
discussion on pp. 79-82.)
23. The City of Billings should increase its fees for fire plans review, inspection, and permitting in
order to recover the full cost of providing these services in the community. (See discussion on
p. 84.)
24. The City of Billings should lobby the Montana Building Codes Council to reinstate the
International Residential Code (IRC) requirements for automatic fire sprinklers in newly
constructed single- and two-family residential structures. (See discussion on pp. 84-85.)
25. Billings should consider adopting a Wildland Urban Interface Code for its service area. (See
discussion on pp. 85-86.)
26. BFD should restructure the format of its 12-week recruit firefighter training academy and
include both Firefighter 1 & 2 as part of this curriculum. (See discussion on p. 89.)
27. The Billings Fire Department should institute written and practical skills testing as part of the
department’s comprehensive fire training program. (See discussion on p. 90.)

4
28. BFD should institute an annual physical fitness evaluation process for all emergency response
personnel, including chief officers. (See discussion on p. 90.)
29. BFD should institute annual medical physicals in accordance with NFPA 1582 for all
emergency response personnel, including chief officers. (See discussion on p. 91.)
30. BFD should institute an Employee Safety and Injury Avoidance Program aimed reducing the
number of line-of-duty injuries and lost time. (See discussion on pp. 91-92.)
31. The City of Billings should initiate an effort with the City of Laurel, the Town of Broadview, and
Yellowstone County to establish an Emergency Management Leadership Team to support
planning and operational assignments in the joint County-Municipal Emergency
Management process. (See discussion on pp. 92-93.)
32. The City of Billings should designate a city Emergency Manager from a key department
(Police, Fire, or City Administrator’s Office) who would be responsible for implementing the
city’s emergency management planning and operational efforts in cooperation with
Yellowstone County. (See discussion on p. 93-94.)
33. The City of Billings should initiate an effort in which every city department develops and
exercises a Continuity of Operations Plan (COOP). (See discussion on p. 94.)
34. The City of Billings and Yellowstone County should conduct an operational and architectural
review of the Emergency Operations Center facility and make immediate plans to either
initiate a comprehensive renovation of the facility or begin an effort to relocate the Joint
County-City EOC to a more functional facility. (See discussion on p. 94.)

5
SECTION 2. SCOPE OF PROJECT
The scope of this project was to provide an
independent review of the services provided by
the Billings Fire Department (BFD) so that the
Mayor, City Council and city officials, including
officials of BFD, could obtain an external
perspective regarding the city’s fire and EMS
delivery system. This study provides a
comprehensive analysis of the BFD, including its
organizational structure, workload, staffing,
overtime, deployment, training, fire prevention,
emergency communications (911), planning, and
public education efforts.
In addition, CPSM will provide its insights to help
the department determine the appropriateness
of the level of response and alternative delivery
systems that could be utilized in meeting both
current and projected service demands. Local
government officials often commission these
types of studies to measure their department against industry best practices. In this analysis,
CPSM provides recommendations where appropriate, and offers input on a strategic direction
for the future.
Key areas evaluated during this study include:
■ Fire department response times (using data from the city’s computer-aided dispatch system
and the BFD records management system).
■ Deployment, staffing, and overtime.
■ Agency interaction with AMR and service delivery in the Billings Urban Fire Service Are (BUFSA).
■ Organizational structure and managerial oversight.
■ Fire and EMS workloads, including unit response activities.
■ BFD support functions (training, fire prevention/code enforcement, and 911 dispatch).
■ Essential facilities, equipment, and resources.
■ An evaluation of the capacity of the organization to best position itself in meeting anticipated
demand.
§ § §

6
SECTION 3. ORGANIZATION AND
MANAGEMENT
GOVERNANCE AND ADMINISTRATION
Billings is the largest city in the State of Montana and is the county seat for Yellowstone County.
The city is located in the south-central portion of the State, and is the principal city of the Billings
Metropolitan Area. Billings is approximately 340 miles southeast of Missoula and about 160 miles
northeast of Yellowstone National Park. The city is located at the convergence of Interstate 90
and Interstate 94. These two freeway systems are the primary north-south and east-west
thoroughfares in the northwest United States. It is estimated by the U.S. Census Bureau that
Billings had a population 109,577 in 2019.
Billings is a rapidly growing urban center that is the trade and distribution center for much of
Montana, Northern Wyoming, and western areas of North and South Dakota. Some areas of the
city grew as much as 60 percent in the ten-year period from 2000 to 2010. Much of the area’s
growth has been fueled by the shale oil boom and corporate business expansion. Billings has a
diverse economy with a growing medical sector, oil refineries, sugar beet processing, farming,
ranching, chemical manufacturing, energy exploration, mining, commercial and residential
construction, building materials manufacturing, professional and financial services, banking,
trucking, and higher education. The corporate limits of the city encompass a land area of
approximately 44.7 square miles.
Billings is a chartered municipal government within the State of Montana; it operates under a
mayor-council form of government. The Mayor is selected at-large for a four-year term. The City
Council is composed of 10 members who are elected from individual wards, with five wards in
the city each represented by two Councilmembers. They are also elected to four-year terms.
The City Council appoints the City Administrator, who is the administrative officer for the city with
the authority to hire, appoint, and remove all employees of the local government. The City
Council serves as the legislative body for the city. The Mayor presides at the City Council
meetings and votes along with the 10 council members to effectuate decisions. City Council
responsibilities include enacting laws that govern the city, adopting the annual budget, and
appropriating funds to provide city services. Most transactions require only a quorum or simple
majority be present.
Billings is typical of many cities and towns across the United States in that it operates its own
public works department, library, parks and recreation, and several internal functions including
finance and human resources. Billings operates its own police department and fire department.
The fire department is responsible for emergency 911/dispatch services for fire and police in the
city, and for the Yellowstone County Sherriff’s Office, area fire departments, the Billings-Logan
International Airport, and several ambulance agencies.

7
FIGURE 3-1: City of Billings Table of Organization
BILLINGS FIRE DEPARTMENT OVERVIEW
The Billings Fire Department (BFD) is a career fire department comprised of 161 personnel, of
which 110 are sworn, uniformed fire-rescue personnel assigned to emergency operations. The
department also has 51 personnel who are assigned to administrative, fire prevention, dispatch,
and training positions.
The Fire Chief has overall responsibility for managing the department’s day-to-day operations
and providing administrative oversight. The Fire Chief is assisted by two Assistant Chiefs and two
Administrative Support Staff. The Operations Division includes 110-line personnel who are
assigned to the city’s seven fire stations. These stations serve the city along with nearly 48 square
miles of the Billings Urban Fire Service Area. The BUFSA is comprised of unincorporated areas that
are generally situated around the perimeter of the city. The department’s Training Division,
consisting of three personnel, is managed by the Assistant Chief of Operations.

8
The Administrative Division, headed by the Senior Assistant Chief of Administration, is composed
of 45 personnel who are assigned duties in Fire Prevention, Administrative Services, IT, and 911-
Communications. Fire Prevention is responsible for fire inspections, code enforcement, plans
review, public education, and fire investigations.
FIGURE 3-2: Billings Fire Department Table of Organization
The Operations Division is broken into three shifts, with a (24-hour) field supervisor (Battalion
Chief), assigned to each shift with the responsibility for supervising field operations, scheduling,
and personnel matters on their respective shifts. The Operations Division also includes a fourth
Battalion Chief who serves as a coverage officer for field operations. Operations is responsible
for providing the department’s emergency response functions for a wide array of fire, rescue,
and emergency medical services. From its seven fire stations, the department staffs one ladder
truck, one quint (ladder/engine combination), six engines, and one1 Battalion Chief/command
unit. These units are operational 24 hours per day, 7 days a week.
BFD operates with three-person staffing on each of its engines, the quint, and ladder truck. Daily
minimum staffing, which is set according to the department’s labor agreement, is 25 personnel.
Each shift is assigned 36 personnel, which allows upwards of 11 personnel to be off on various
leave types (vacation, sick, Kelly-day, compensatory time, disability, FMLA, etc.) and still mt
minimum staffing. Even with this cushion, overtime is utilized frequently to maintain the minimum
staffing requirements.
During the one-year period of this study from January 1, 2019 through December 31, 2019, the
BFD responded to 15,675 incidents, of which 4,338 were cancelled or mutual aid responses
(4,325 and 13, respectively). When cancelled and mutual aid calls are excluded, EMS calls

9
accounted for nearly 74 percent of the response activities in the Billings service area. All
personnel are cross-trained and are able to provide emergency medical care as well as
structural and wildland fire fighting.
All line personnel must hold a Basic-EMT certification (BLS); in addition, approximately 36 of the
BFD personnel possess Advanced Life Support/paramedic certification (ALS). The department is
equipped to provide advanced life support services (ALS) from all seven of its stations; however,
BFD does not maintain a minimum staffing policy for on-duty paramedics, so on occasion,
depending on staffing, units will operate as a BLS provider.
BFD operates in what is often termed a two-tiered EMS delivery system. In this arrangement the
fire department provides EMS first response (either ALS or BLS depending on the assignment of
paramedics) and a private ambulance provider (AMR) provides advanced life support services
and ambulance transport.
In addition to their emergency response duties, emergency services personnel also provide a
wide range of customer service and community outreach efforts, including blood pressure
screenings, tours of fire stations and apparatus, smoke detector installations, and fire and life
safety presentations.
Kelly Days and Workweek
Under the negotiated agreement with IAFF Local 521, operations personnel work a three-
platoon system in which personnel are on duty for 24 consecutive hours followed by 48 hours off.
This rotation is followed for seven iterations (or 168 hours of duty time) and then employees are
off for six consecutive days (48 hours of duty time off). These off-duty days are often referred to in
the fire service as “Kelly Days.” The frequency and number of Kelly Days in the pay cycle
determine the average workweek.
In Billings, the frequency of Kelly Days (two 24-hours days off every 27 calendar days) effectively
reduces the average workweek to 46 hours (2,392 hours annually). As a result of the Billings work
schedule, line fire personnel receive a total of 27 Kelly Days each year (648 total hours of off-duty
time without pay). Considering that the BFD currently employees 110 personnel who each
receive 27 Kelly Days annually, the total amount of time annually attributable to Kelly Days is
estimated to be 71,280 hours (110 personnel X 648 Kelly Day hours off). As a result, six personnel
are off every day because of the Kelly Day provision.
CPSM believes the city should pursue a reduction in the number of Kelly Days received, and a
corresponding renegotiated increase in the average firefighter workweek. If the city could
negotiate a 50 percent reduction in the frequency of Kelly Days (to one 24-hour Kelly Day off in
each 27-work cycle), this would equate to a 49.8-hour workweek for firefighters. In turn, this
would increase daily available staffing by up 72 hours. This staffing time could be utilized to
enhance deployment and service coverage.
Recommendation: In future negotiations with the IAFF, the city should pursue
a reduction in the number of Kelly Days awarded to each employee and a
corresponding increase in the average number of hours in the firefighter
workweek. (Recommendation No. 1.)
Alternative Response Vehicles
EMS calls are the predominant workload for the Billings Fire Department, accounting for nearly
74 percent of its call activity, with an estimated 9,731-unit responses annually. As well, the BFD
responds to more than 3,400 requests annually for other incidents in which no fire is present.
10
These call types typically involve public assists, good intent requests, and system malfunctions. In
total, CPSM estimates that BFD units are responding an estimated 18,000 times annually to calls
that do not involve actual fires.
BFD handles all of its emergency and non-emergency responses with a fleet of fire apparatus
that includes six fire engines, one ladder truck, and one quint. This workload puts considerable
wear and tear on these heavy vehicles. CPSM estimates the combined service miles traveled
annually by the BFD fleet is in the range of 70,000 to 85,000 miles, with several of the busier units
(Engine 1 and Engine 5) each amassing as much as 12,000 miles annually.
Fire apparatus are extremely expensive vehicles to purchase and maintain. Engines have a
replacement cost of more than $650,000 and ladders are more than $1.5 million. In addition,
each engine and ladder must be outfitted with various tools, equipment, EMS supplies, radios,
computers, and other equipment that collectively add upwards of $200,000 to the cost of any
replacement. Due to the high replacement cost for these vehicles and the ongoing operating
and maintenance costs, many agencies have gone to the use of alternative response vehicles
for EMS and non-fire related incidents. Incorporating smaller vehicles into the response fleet
helps to reduce the wear and tear on larger vehicles and prolong their useful time in service.
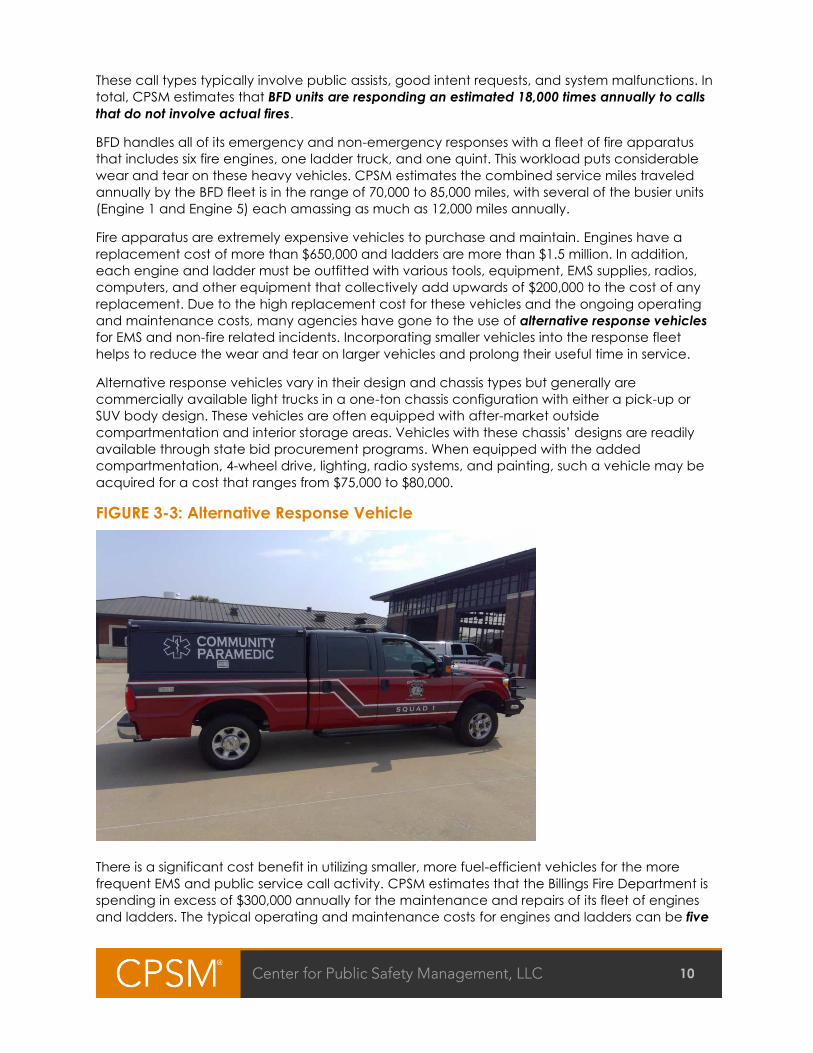
Alternative response vehicles vary in their design and chassis types but generally are
commercially available light trucks in a one-ton chassis configuration with either a pick-up or
SUV body design. These vehicles are often equipped with after-market outside
compartmentation and interior storage areas. Vehicles with these chassis’ designs are readily
available through state bid procurement programs. When equipped with the added
compartmentation, 4-wheel drive, lighting, radio systems, and painting, such a vehicle may be
acquired for a cost that ranges from $75,000 to $80,000.
FIGURE 3-3: Alternative Response Vehicle
There is a significant cost benefit in utilizing smaller, more fuel-efficient vehicles for the more
frequent EMS and public service call activity. CPSM estimates that the Billings Fire Department is
spending in excess of $300,000 annually for the maintenance and repairs of its fleet of engines
and ladders. The typical operating and maintenance costs for engines and ladders can be five

11
times higher than for smaller EMS squad vehicles. In addition, the smaller units are more
maneuverable, provide off-road access, and can achieve faster response times than the larger
fire apparatus, especially ladder trucks and quints. There is also the benefit of perception in the
community when the department responds with an alternative response vehicle to non-
emergency or EMS calls rather than larger fire apparatus.
Two communities that have opted for the use of alternative response vehicles are Tualatin Valley
Fire Rescue, Oregon (CARS Program) and the Shreveport Fire Department, Louisiana (SPRINT
Program). An analysis of repair costs for fire apparatus compared to lighter weight alternative
response vehicles offers a striking contrast. The cost comparisons shown in the following table
were utilized by the Shreveport Fire Department in helping to make its decision to initiate its
SPRINT Program.
TABLE 3-1: Fire Apparatus vs. Small Vehicle Maintenance/Response Cost
Comparison
Service Fire Apparatus (Engine) Alternative Response Vehicle
Oil and filter change $175 $25.95
Set of tires $1,800 $625
Complete brake job $3,600 $270
Battery replacement $429 $53.95
Alternator replacement $1,195 $125
Windshield replacement $2,400 $600
Fuel efficiency 3-5 MPG 15-20 MPG
Squad and SUV-type response vehicles can be expected to be operational for seven to eight
years or approximately 100,000 to 120,000 miles in a first-line status. Given the economic
comparison between engines and alternative response vehicles and the added fact that two-
person EMS squads operate with fewer personnel, it is apparent that from both an economic
and operational perspective, the use of two-person EMS squads is very applicable for the Billings
system.
Recommendation: The Billings Fire Department should consider the use of
two-person EMS squad units to handle EMS and non-emergency service calls
in the city’s busiest service districts. (Recommendation No. 2.)
Dynamic Staffing
If the city is successful in negotiating a reduction in the number of Kelly Days granted to
employees, CPSM believes that the added productivity will be sufficient to operate two peak-
period EMS squad units without adding personnel. A peak-period unit typically operates for an 8-
to-12-hour period, such as between 9:00 a.m. and 9:00 p.m. Billings currently operates in a Static
Deployment Model. In this configuration, the number of units and the number of on-duty
personnel is the same at 2:00 p.m. as it is at 2:00 a.m. However, call activity is significantly higher
in the daytime period when people are at work, in school, shopping, and moving about the city.
The frequency of simultaneous alarms is also higher during the daylight hours and department
resources are most likely to be strained during these high-demand periods.
Based on these factors, a number of agencies have moved to Dynamic Staffing, in which more
resources and personnel are made available during peak demand periods and resources and
personnel are reduced during those times when service demand is less.
12
Recommendation: The Billings Fire Department should consider the
implementation of a Dynamic Staffing policy that utilizes peak-period
deployment during periods of high service demand. (Recommendation
No. 3.)
The typical 24-hour shift followed by 48 hours off is perhaps the most coveted aspect of
employment in the fire service. Fire unions will make every effort to maintain this schedule.
However, the 24-hour schedule is highly inefficient and often leads to periods of fatigue.
There are options for combining 24-hour shift assignments with peak-period assignments. CPSM
has found that alternative scheduling can be appealing to some employees. For those
employees who do not wish to work an extended schedule and sleep at the fire station, the
alternative schedule is often preferred. It is also appealing to single parents with child-care
responsibilities who need to be home at night. In addition, a peak-period schedule can be the
initial assignment for new personnel, who, after gaining seniority, can choose to move to a
24-hour assignment slot when it becomes available.
Definition of Time Worked
Overtime guidelines relating to municipal fire personnel are specified in the Fair Labor Standards
Act (FLSA) and the “7(k) exemption,” which allows municipal fire personnel to work up to
53 hours each week before an overtime premium is required.1 FLSA only requires overtime pay
when the actual hours worked are in excess of the designated workweek. FLSA does not require
that this calculation include time not worked, such as vacation time, sick leave, or holidays
(federal or otherwise).2 Billings operates on a 27-day FLSA cycle and under the current contract
agreement, overtime is paid for any additional hours worked. Billings considers all leave time as
time worked. CPSM believes that the City should pursue the exclusion of any leave time in
determining eligibility for overtime pay during the FLSA work cycle.
Recommendation: Billings should revise its interpretation of time worked when
considering overtime eligibility for fire personnel and exclude any leave time
taken as hours worked when determining overtime eligibility.
(Recommendation No. 4.)
Under the 27-day FLSA work cycle utilized in Billings, a premium overtime payment (time and
one-half) would only be required under FLSA guidelines for those actual hours worked in excess
of 204 hours in the 27-day period. If the 204-hour mark is not met, additional hours worked are
paid at a straight time rate without the overtime premium.
§ § §
1. See 29 USC §207(k).
2. U.S. Department of Labor, Wage and Hour Division, Overtime Pay: General Guidance.

13
STAFFING AND DEPLOYMENT
Staffing of individual apparatus and minimum daily staffing levels are perhaps the most
contentious aspects of managing fire operations in the U.S. There are a number of factors that
have fueled the staffing debate. Aside from FAA requirements for minimum staffing levels at
commercial airports, there are no state or federal requirements for the staffing of structural fire
apparatus.
The U.S. Occupational Safety and Health Administration (OSHA) has issued a standard that has
been termed the “Two-In/Two-Out” provision. This standard affects most public fire departments
across the U.S., including the BFD. Under this standard, firefighters are required to operate in
teams (of no fewer than two personnel) when engaged in interior structural firefighting. The
environment in which interior structural firefighting occurs is further described as areas that are
immediately dangerous to life or health (an IDLH atmosphere) and subsequently require the use
of self-contained breathing apparatus (SCBA). When operating in these conditions, firefighters
are required to operate in pairs and they must remain in visual or voice contact with each other
and must have at least two other employees located outside the IDLH atmosphere. This assures
that the “two-in” can monitor each other and assist with equipment failure or entrapment or
other hazards, and the “two-out” can monitor those in the building, initiate a rescue, or call for
back-up if a problem arises.3
This standard does not specify staffing on individual apparatus, but rather specifies a required
number of personnel be assembled on-scene when individuals are in a hazardous environment.
There is, however, a provision within the OSHA standard that allows two personnel to make entry
into an IDLH atmosphere without the required two back-up personnel outside. This is allowed
when they are attempting to rescue a person or persons in the structure before the entire team
is assembled.4
A second factor that contributes to the staffing debate is the National Fire Protection
Association (NFPA) 1710 publication, Organization and Deployment of Fire Suppression
Operations, Emergency Medical Operations, and Special Operations to the Public by Career
Fire Departments (2020 Edition, Sec. 5.2.2.). This standard specifies that the staffing level on
responding engine and ladder companies be established at a minimum of four on-duty
personnel. Unlike the OSHA guideline, which is a mandatory provision, the NFPA 1710 guideline is
advisory, meaning that communities (including Billings) are not required to adhere to this NFPA
guideline. NFPA 1710 also provides guidance regarding staffing levels for units responding to EMS
incidents; however, the provision is less specific and does not specify a minimum staffing level for
EMS response units. Instead, the standard states; “EMS staffing requirements shall be based on
the minimum levels needed to provide patient care and member safety.”5
The difficulty that many agencies have is the co-utilization of fire companies and EMS
companies in responding to both fire and EMS calls. Working fires involving hazardous
environments are labor intensive and more personnel are needed to effectively manage these
incidents. EMS calls are typically managed with fewer personnel, and the majority of EMS calls
can be handled with a single rescue company of two fire personnel. In the call-screening
process, those calls that require additional personnel are typically identified at the dispatch level
3. OSHA-Respiratory Protection Standard, 29CFR-1910.134(g)(4).
4. Ibid, Note 2 to paragraph (g).
5. (NFPA) 1710, Organization and Deployment of Fire Suppression Operations, Emergency Medical
Operations, and Special Operations to the Public by Career Fire Departments (2020 Edition Sec., 5.3.3.2.2.).

14
and additional personnel can be assigned when needed. In addition, in two-tiered EMS delivery
systems, an additional ambulance with two personnel is typically deployed on each EMS call.
BFD operates eight primary fire suppression companies that are staffed on a daily basis (six
engines, one ladder, and one quint). In addition, the BFD staffs a Battalion Chief/command unit.
BFD has established as part of its labor agreement a minimum daily staffing of 25 personnel. Most
fire stations operate with a single crew that consists of a Fire Captain, a Fire Equipment Operator,
and one Firefighter. Station 1 is the only multicompany station in the city; it operates with one
engine, a ladder truck, and the BC/command unit.
Most of the department’s stations are equipped with various vehicle types that are cross-staffed
with the assigned personnel and the most appropriate apparatus is utilized when a call is
assigned. These vehicle types include wildland engines, USAR, the hazardous materials response
unit, and an array of reserve units of various types. The following table identifies the primary
response units operating from each BFD station and the personnel assigned.
TABLE 3-2: BFD Fire Stations, Response Units, and Assigned Personnel
Station # Response Units Minimum Assignment
1
1 Engine
1 Ladder Truck
1 BC/Command
3
3
1
2 1 Engine 3
3 1 Engine 3
4 1 Quint (Engine/Ladder Combination) 3
5 1 Engine 3
6 1 Engine 3
7 1 Engine 3
7 Stations 9 Response Units 25 on-duty personnel
Program Management Responsibilities
Many agencies often assign the oversight of program management duties to those staff officers
and chief officers who are assigned to 40-hour assignments. CPSM believes it is critical that many
of the program management duties required in the operation of a modern fire and EMS
organization be delegated to and under the direction of field personnel.
BFD has made a number of assignments of support duties to line personnel and this is
commendable. However, these assignments are selective and not all officers have been
assigned program management duties. The ability to properly manage key organizational duties
is beneficial from a career development perspective. In addition, the assumption of program
management duties and the effectiveness with which an individual performs in these
assignments can be viable considerations in the promotional process. The following table lists a
variety of program management duties that could be considered for assignment to field
personnel.

15
TABLE 3-3: Potential Program Assignment Duties
Program Description Assignment Level
Promotional Testing Battalion Chief
Performance Appraisals Battalion Chief
Haz Mat/Technical Rescue Battalion Chief
Employee Recognition/Awards Battalion Chief
CISM/EAP Battalion Chief
Sick Leave/Absenteeism Review Battalion Chief
Budget Committee Battalion Chief
Payroll / Executive Time Auditing Battalion Chief
Police Department Liaison Battalion Chief
EMS Protocols Captain
Station Maintenance/Upkeep and Supplies Captain
Fire Reporting QA Captain
Hose Testing Captain/Fire Equipment Operator/FF
Hydrant Testing Captain/Fire Equipment Operator /FF
Radio Programming Captain/Fire Equipment Operator
Mapping Captain/Fire Equipment Operator
Fire Pre-incident Planning Captain
Infectious Disease Control Captain/Paramedic
EMS Supplies/Decon/Bio Disposal Captain/Fire Equipment Operator /FF
911 Liaison Captain
Station Response Area Designation Captain
Response Protocols Captain
Fire Investigations Captain/Fire Equipment Operator
Safety/Rehab/Risk Management Captain
SOP/Ops Committee Captain/Fire Equipment Operator /FF
Fitness Committee Captain/Fire Equipment Operator /FF
Shift Training Coordinator Captain
Recruit Training/Proctoring Captain
Public Information Officer Captain/Fire Equipment Operator /FF
Driver Training/EVOC Captain/Fire Equipment Operator
Fleet Maintenance/Repair Record Keeping Captain/Fire Equipment Operator
Internal Communications/Newsletter Captain/Fire Equipment Operator /FF
Social Media/FD Web Page Captain/Fire Equipment Operator /FF
FF/EMS Recruitment Committee Captain/Fire Equipment Operator /FF
Car Seat Installation Captain/Fire Equipment Operator /FF
Smoke Detector Replacement Captain/Fire Equipment Operator /FF
Recommendation: BFD should consider the expansion of program
management duties for field personnel and utilize these assignments to
enhance career development and subsequently consider successful

16
fulfillment of these duties as a factor in the promotional process.
(Recommendation No. 5.)
Internal Communication
The ability to communicate work assignments, conduct training sessions, discuss new program
initiatives, or merely to update employees on departmental programs or the strategic direction
of the organization requires ongoing outreach, specifically from the Fire Chief, chief officers, and
training instructors in the organization. There are a number of communication tools currently
available that can be used to conduct video conference calls, training sessions, and
information exchanges among multiple work settings (for example, see Zoom™, Microsoft
TEAMS™, Skype for Business™, and Lifesize™, etc.). These tools are inexpensive and, in some
cases, the software is free and there are minimal recurring charges. The ability to discuss key
department issues along with interactive training sessions is critical to organizational
effectiveness and operational readiness. The realities of the COVID-19 pandemic have
increased the use of these types of remote meeting and virtual training activities. BFD has
become proficient in these applications and should continue and expand their use once the
pandemic has subsided.
Promotional Process
Career development and professional growth of employees are essential to the sustainability of
any organization. Fire service organizations are extremely regimented in terms of personnel
issues. As is the case in Billings, these processes are guided by civil service rules, collective
bargaining agreements, and public personnel guidelines.
The fire service promotional process is normally very competitive, and provides an opportunity to
foster the development of individual skills, measure personal initiative and performance, and
instill organizational philosophies. The ability to direct an employee’s learning effort to develop
the needed skill sets is a key function that should be orchestrated through the promotional
testing process. This factor is essential in the development of the future workforce and in creating
or perhaps changing the culture of an organization. It is essential that an effective promotional
process be built around individual performance, personal achievement, and the ability to
measure the required skills in a competitive forum.
The BFD promotional process is primarily based on seniority. Though the department uses a series
of development programs and task book exercises as prerequisites to qualify a candidate for
promotions, once these criteria are met, promotions are made solely on the basis of tenure
within the BFD system. In addition, when competencies are evaluated in the qualifying process,
these assessments are extremely subjective and when skills assessment are required, only a 70
percent passing grade is needed. In practical terms, promotions for the key positions of Engineer
and Captain are awarded on the basis of seniority, with only limited objective testing.
Recommendation: The City of Billings should negotiate changes to the
promotional requirements for Fire Equipment Operator and Fire Captain. The
process should expand the use of objective testing and competitive skills
assessments so as to reduce the dependence on seniority in making
appointments. (Recommendation No. 6.)
Sound leadership and effective supervision are the cornerstones for success in the public safety
arena. A fire department and its leaders are tested regularly and often under dire
circumstances. Future leadership must have expanded competencies in the use of technology,
honed interpersonal skills, sound judgement, and a broad range of tactical expertise. These skills

17
must be learned and it is essential that the system rewards performance and demonstrated
achievement. Making key promotions on the basis of how long an employee is on the job, is
counterintuitive in that it stymies initiative and inhibits the pursuit of personal excellence.
The Billings Fire Department has developed extensive development and task book requirements
for the positions of Fire Equipment Operator, Fire Captain, and Battalion Chief. These criteria are
formidable but do not require any college course work or degree requirements. The promotional
testing process offers an opportunity to utilize the source materials for testing and to establish the
prerequisite training criteria for promotional eligibility. CPSM believes that these criteria should be
expanded to include college coursework, such as associate’s and bachelor’s degrees, along
with weighted consideration given to the quality of service performed in preparation for
promotions. Service should include but not be limited to project management duties, fitness
qualifications, specialized certifications, and performance appraisals.
Recommendation: BFD should expand the training requirements,
certifications, and college education prerequisites for the Fire Equipment
Operator, Fire Captain, and Battalion Chief promotional processes.
(Recommendation No. 7.)
Battalion Chief Tenure Requirement
The Battalion Chief promotional process is the only bargaining unit position that requires a
competitive testing process for selection. CPSM believes that this change from a seniority-
dominated selection process is proper and should be applied to other positions. However, the
current criteria for Battalion Chief promotion includes a 15-year tenure with the Billings Fire
Department. CPSM believes that this time-in-grade requirement is too long and overly restrictive.
If the testing and assessment process used to select qualified candidates for this position are
comprehensive and effective in predicting success, this requirement should be reduced. We
believe that three to five years of qualified experience in the rank of Fire Captain should suffice
as one of the eligibility requirements for entering the Battalion Chief promotional testing process.
Recommendation: The City of Billings should negotiate a reduction in the 15-
year time-in-grade requirement for eligibility to enter the Battalion Chief
promotional process. (Recommendation No. 8.)
Performance Reviews
Closely aligned with the promotional process and equally effective in career development,
professional growth, and remediation is the annual employee performance review. The City of
Billings and the fire department do employ an annual performance review process, but the
methodologies utilized in the fire department are largely ineffective. Performance appraisals are
not considered in the Fire Equipment Operator, Captain, and Battalion Chief promotional
process, nor are these reviews considered when merit or step increases are awarded. CPSM
believes that the performance review process can be an effective supervisory process when
used effectively. It provides a formal communication and documentation between the
supervisor and an employee in establishing goals, monitoring performance, and identifying
areas requiring improvements.
Recommendation: BFD should redefine the purpose of employee
performance reviews and utilize these appraisals as a key component when
considering employee promotions, step increases, and merit reviews.
(Recommendation No. 9.)

18
When re-engineering the use of the performance review process, it is extremely important that
all supervisors be properly trained in its use and that clear guidelines are developed for both
supervisors and subordinates.
Payroll and Scheduling Process
BFD utilizes the CrewSense™ software package to assist in the management of its payroll
process. CrewSense™ is an automated payroll and scheduling system. It is used to track the
various categories of leave time taken by employees and to authorize any additional pay and
overtime. The CrewSense™ system is interfaced with the city’s payroll system and involves time-
sheet entries and authorizations by both employees and supervisors. The system utilizes a number
of checks and reviews by supervisors and fire management staff along with city’s Finance staff
to ensure that all leave time is entered and any additional pay is paid. Most fire departments,
including Billings, have a complex series of rules and conditions in which leave time is authorized
and additional pay is applied.
The CrewSense™ system is a software package that is customized to address the payroll criteria
established and utilized for the specific organization. The CrewSense™ system is very effective
and quite versatile. However, a number of authorizations are built into the system and situations
arise in which omissions occur or overpayments are made. As with any financial process in an
organization, a periodic audit should be incorporated to ensure proper financial oversight. In
Billings, an audit of the department’s CrewSense™ payroll and scheduling system is not being
done. CPSM believes that periodic audits of CrewSense™ are warranted.
Recommendation: The City of Billings should conduct periodic audits of the
CrewSense™ payroll and scheduling process utilized by the Fire Department.
(Recommendation No. 10.)
Fire Incident Reporting Review
Every response that is carried out by the Billings Fire Department is documented by a written
incident report. EMS calls utilize a patient care report that documents the date, time, personnel
involved, and actions taken in treating the patient along with any related patient information
(blood pressure, respirations, level of consciousness, signs and symptoms, injuries etc.). Fire
reports identify the date and time of the incident, the occupancy type or location of the
incident, the situation found, personnel involved, and the actions taken. These incident reports
serve as the official public record and also provide statistical information that can be used to
evaluate department activities including workload, response times, fire loss estimates, patient
transports, etc.
All EMS reports undergo a comprehensive review for Quality Assurance (Q/A) and Quality
Improvements (Q/I). These reviews are done by EMS Coordinators on each shift and the city’s
Medical Director. Fire reports, however, are not reviewed in the same manner. Reports are
typically done by the first arriving officer and input is added by the Incident Commander
(Battalion Chief) and other officers regarding their actions taken and their involvement with the
incident. BFD does not have a formal quality review process for its fire reporting.
Recommendation: The Billings Fire Department should institute a Quality
Assurance-Quality Improvement (QA/QI) review process for its fire incident
reporting. (Recommendation No. 11.)

19
FIRE STATION FACILITIES
Fire department capital facilities are exposed to some of the most intense and demanding uses
of any public local government facility, as they are occupied and in use 24 hours a day, 7 days
a week.6 The Billings Fire Department operates out of seven fire stations with nine staffed
emergency response apparatus. Department administrative offices are located at Station #1.
The following table shows the location, year built, and size of the department’s stations.
TABLE 3-4: Station Locations, Year Built, and Size
Building Address Year Built Size/Sq. Ft.
Fire Station #1* 2305 8th Avenue N. 1974 14,740
Fire Station #2 501 S. 28th Street 1965 4,672
Fire Station #3 1928 17th Street W. 1965 4,000
Fire Station #4 476 6th Street W. 2001 9,998
Fire Station #5 605 S 24th Street W. 1973 5,740
Fire Station #6 1601 Saint Andrews 1987 5,560
Fire Station #7** 1501 54th Street W. 2007 9,200
Notes: *Fire Station #1 also houses Fire Department Headquarters. **Fire Station #7 also houses Police
Substation #3
The following figure shows the location of the city’s seven fire stations and the municipal
boundaries of Billings.
§ § §
6. Compton and Granito, eds., Managing Fire and Rescue Services, 219.

20
FIGURE 3-4: City of Billings Fire Department Station Locations
The BFD serves an estimated population of approximately 110,000 people and a total city
service area of 44.7 square miles. The average service area in the city for each of the seven fire
stations is approximately 6.4 square miles. However, in addition to the service responsibilities
within city limits, BFD also provides full services from its seven fire stations to the BUFSA, which
spans an additional 47.7 square miles and an estimated population of 12,000 people. If this
combined service area is looked at as the BFD’s total service area, each BFD station is servicing
an average area of 13.2 square miles. This is only an approximate service area distribution for
while the BUFSA is generally located around the perimeter of the city, there are greater
expanses of BUFSA land along the western portion of the city and some areas north and east of
city limits.
In an FY 2011 ICMA Data Report, ICMA tabulated survey information from 34 municipalities with
populations greater than 100,000 people. In this grouping the average fire station service area
was 13.1 square miles.7 The median service area for this grouping was 7.17 square miles per fire
station.8
7. Comparative Performance Measurement, FY 2011 Data Report - Fire and EMS, ICMA Center for
Performance Measurement, August 2012.
8. Ibid.

21
In addition, the NFPA and ISO have established different indices in determining fire station
distribution. The ISO Fire Suppression Rating Schedule, Section 560, indicates that first-due engine
companies should serve areas that are within a 1.5-mile travel distance.9 The placement of fire
stations that achieves this type of separation creates service areas that are approximately 4.5
square miles in size, depending on the road network and other geographical barriers (rivers,
lakes, railroads, limited access highways, etc.).
The National Fire Protection Association (NFPA) references the placement of fire stations in an
indirect way. It recommends that fire stations be placed in a distribution that achieves the
desired minimum response times. NFPA Standard 1710, Section 5.2.4.1.1, suggests an engine
placement that achieves a 240-second (four-minute) travel time.10 Using an empirical model
called the “piece-wise linear travel time function” the Rand Institute has estimated that the
average emergency response speed for fire apparatus is 35 mph. At this speed the distance a
fire engine can travel in four minutes is approximately 1.97 miles.11 A polygon based on a 1.97-
mile travel distance results in a service area that on average is approximately 7.3 square miles.12
From these comparisons, it can be seen that the average 6.4 square-mile service area per
station in Billings is very much in line with the noted references. However, when the additional
area served in the BUFSA is included, each fire station in effect has a 13.2-mile average service
area, which is significantly larger than the stated references.
Fire and EMS services are extremely labor intensive. Typically, the overwhelming share of the
annual operating expenses are attributable to personnel costs. In many systems it is not
uncommon to see personnel costs account for as much as 85 to 90 percent of the annual
budget expenditures. For this reason, fire departments will not deploy additional resources (new
fire stations, new apparatus, and the assigned staffing) until the actual service demand exists.
Unlike public water utilities, sewer systems, and transportation networks, where it is cost effective
to develop this infrastructure prior to development, fire and EMS service enhancements are best
established after growth has occurred and the service demand actually exists.
Fire service demand is very predictable. In many systems, this demand is a by-product of
population growth, the transportation network, and service demand generators related to
commerce, institutions, and tourist attractions. Another important point when considering the
expansion of the service network is that the increase in additional call volume is typically very
gradual and can be tracked or monitored sufficiently to allow for a more orderly expansion of
the service network. As subdivisions are built and commercial areas are developed, the activities
involved in responding to calls gradually trail the growth of these alarm generators. The ongoing
ability to monitor response activities provides ample lead time to develop funding, construct
new facilities, and deploy the needed resources.
The only real difficulty in meeting future service expansion is when there is an immediate service
increase associated with assuming service responsibilities in an area when there is an annexation
or an addition of a contract service arrangement with a developed community or service
9. Insurance Services Office. (2003) Fire Protection Rating Schedule (edition 02-02). Jersey City, NJ:
Insurance Services Office (ISO).
10. National Fire Protection Association. (2010). NFPA 1710, Standard for the Organization and Deployment
of Fire Suppression Operations, Emergency Medical Operations, and Special Operations to the Public by
Career Fire Departments. Boston, MA: National Fire Protection Association.
11. University of Tennessee Municipal Technical Advisory Service, “Clinton Fire Location Station Study,”
Knoxville, TN, November 2012. p. 8.
12. Ibid. p. 9.

22
district. Even in these scenarios, there is ample lead time to arrange temporary quartering or
deployment strategies until permanent infrastructure and staffing can be established.
Stations are designed to adequately house apparatus and necessary equipment. Typically, new
fire stations have an anticipated service life of 50 years. However, we note that in many
jurisdictions older facilities are being replaced in a 30- to 35-year time frame. In most cases,
facilities require replacement because of their size constraints, a need to relocate the facility to
better serve changing population centers, the absence of needed safety features or service
accommodations, and the general age and deterioration of the facility.
BFD stations range in age from 56 years (Stations 2 & 3) to about 14 years (Station 7). There are
stations that require significant repair and renovation. Much of the preventive maintenance
effort at a number of the stations has been deferred in the recent past. The situation had been
compounded by recent winter storms and hail storms that have contributed to the needed roof
repairs.
Consequently, Billings needs to undertake a comprehensive capital facilities improvement
program. This effort would include roof replacement and repair; electrical, plumbing, and
mechanical repair and replacement; exterior and interior finish work; and site paving. CPSM
believes that an appropriate facilities replacement and improvement program in Billings will
entail a multiyear effort with a cost of $2 million to $3 million. Recently, Billings was awarded
nearly $13 million from the Federal CARES Act. CPSM believes that the city should allocate
upwards of $3 million of this money to supplement its funding for a station capital renovation and
improvements program.
Recommendation: The city should undertake a comprehensive fire station
capital improvements program and earmark upwards of $3 million from the
recent CARES Act to supplement the funding available for repairs and
renovations to existing facilities. (Recommendation No. 12.)
In addition, Billings is experiencing rapid and continuous growth in its outlying areas and may
need to build new fire stations in those areas of the city that are experiencing extended
response times. The addition of new facilities, combined with the improvements to existing
stations, will require an orchestrated and comprehensive capital facilities improvement plan. This
effort will require a multiyear planning, prioritization, and funding program to accomplish.
APPARATUS AND FLEET MANAGEMENT
Fire departments utilize a wide range of fire apparatus, along with tools and equipment, in
carrying out their core mission. Apparatus generally includes emergency response vehicles such
as engines, tenders/tankers (water supply vehicles), aerial apparatus (ladders), quints, rescue
vehicles/squads, and ambulances. There are also specialized apparatus including wildland
engines, off-road vehicles, and watercraft that are typically part of the emergency fleet. Trailers
are utilized to carry specialized equipment when needed. These include hazardous materials
response/equipment, decontamination devices and diking materials, structural collapse
equipment, portable air filling stations, scene lighting, foam units, and mass casualty incident
supplies. In addition, a wide range of utility vehicles including command vehicles and
emergency communications units, staff vehicles, and maintenance trucks can be part of the
fleet.
The mission, duties, demographics, geography, and construction features within the community
all play a major role in the makeup of the apparatus and equipment inventory utilized. These
23
factors, as well as the funding available, must be taken into consideration when specifying and
purchasing apparatus and equipment. Every effort should be made to make new apparatus as
versatile, safe, and multifunctional as is possible as well as practical.
Apparatus maintenance is also an integral part of any fire department, and budget-wise it is
invariably a key component in keeping such large ticket items as apparatus running and
extending their usefulness. It takes a big chunk of a city’s budget to purchase and subsequently
maintain a fire department fleet. As fleets age, it is logical and sound planning to conclude that
repairs and costs will increase exponentially.
There are two proven ways to mitigate the long-term and short-term costs associated with
repairs and replacements. The primary way is to have a sound, dedicated preventive
maintenance (PM) program that is on a regular cycle for each and every vehicle in a
department’s fleet. PM should be a sacrosanct practice and unwavering. This strategy not only
saves money, but saves lives as well by keeping the fleet apparatus ready to respond to
emergencies and accident free. The other method is to have a realistic capital improvement
plan (CIP) to acquire new apparatus when an existing vehicle has outlived its usefulness. NFPA
1911, which sets standards for Guidelines for First-Line and Reserve Fire Apparatus, has changed
and adapted over the years to reflect the changes in industry standards, but on one thing it has
been wholly consistent:
“…it is imperative that all fire apparatus be checked and maintained regularly to
ensure that they are reliable and safe to use. The manufacturer’s instructions should
always be followed when maintaining the fire apparatus.” (Italics and underlines
added)
The standard further states:
“In the fire service there are fire apparatus with 8 to 10 years of service that are simply
worn out. There is also fire apparatus that were manufactured with quality
components, that have had excellent maintenance, and that have responded to a
minimum number of incidents that are still in serviceable condition after 20 years.
…the quality and timelessness of maintenance are perhaps the most significant
factors in determining how well a fire apparatus ages. (Italics added)
NFPA Standard 1915 addresses the minimum expectations for a comprehensive PM program.
The benefits of implementing a PM program in compliance with NFPA 1915 are many. First,
maintaining a vehicle is less expensive than repairing it. Second, vehicles that undergo PM on a
dedicated schedule are more likely to have a longer lifespan. Third, PM reduces the time that a
vehicle is unavailable for use in the community by reducing the chances that it will need repairs
that take it out of service for a lengthy period of time. Finally, demonstrating adherence to an
NFPA 1915-compliant PM program reduces the chance of a maintenance-related untoward
event and possible resulting lawsuits.
The BFD deploys nine primary first response units to accomplish its mission. These apparatus are
strategically placed among the seven fire stations. The BFD also deploys a total of 37 apparatus
and support vehicles, including a number of special service units such as hazmat units, water
tenders, a technical rescue unit, a heavy rescue and six brush trucks. These units are not staffed
on a daily basis; instead, when necessary, the personnel assigned to that station will operate
these units and deploy as needed. The brush trucks, for instance, are deployed in the event of a
wildfire, which is a palpable, seasonal risk in Billings and neighboring joint-response areas.
Finally, the department maintains several reserve apparatus (engines, ladders, and command
units) for use when maintenance or repair is needed for its frontline apparatus. Units are also

24
assigned to the training division, fire prevention, and administrative staff. Altogether, the
department’s entire fleet is comprised of 48 vehicles including apparatus, trailers, staff vehicles,
etc. The following table shows the basic frontline inventory.
TABLE 3-5: BFD Inventory of Frontline Apparatus
Unit Type Make Year Age Mileage*
Engine 1 Type 1/Engine Sutphen 2009 12 years 34,015
Engine 2 Type 1/Engine Pierce Enforcer 2020 1 year 2,243
Engine 3 Type 1/Engine Sutphen 2009 12 years 123,388
Engine 4 Type 1/Mini Tower Sutphen Quint 2005 16 years 117,868
Engine 5 Type 1/Engine Pierce Enforcer 2020 1 year 2,949
Engine 6 Type 1/Engine Sutphen S-2 2007 14 years 128,138
Engine 7 Type 1/Engine Sutphen 2008 13 years 23,645
Truck 1 Ladder Truck Pierce Aerial 2015 6 years 22,487
Rescue 2 Heavy Rescue GMC-4500 2009 12 years 14,164
Regional Haz Mat HazMat Tow Unit Freightliner M-2106 2014 7 years 3,501
HazMat 5 HazMat Van Freightliner MT-55 2004 17 years 4,441
Brush 1 Brush Truck Ford F-550 2008 13 years 13,871
Brush 4 QRV-Brush Truck Ford F-550 2010 11 years 20,285
Brush 5 Brush Truck Ford F-550 2004 17 years 15,896
Brush 7 Brush Truck Ford F-550 2002 19 years 19,634
Brush 7 QRV Brush Truck Ford F-550 2010 11 years 27,632
*Note: Mileage as of Feb. 2020.
The department’s frontline pumpers range in age from 1 year to 14 years. On average, frontline
engines in the fleet are 8.8 years of age. The ladder truck has reached 6 years and the quint has
reached 16 years. The reserve apparatus in the fleet is generally sufficient to serve in a
replacement mode. The fleet is well-maintained and the department has been proficient in its
replacement schedule.
The city’s Fleet Maintenance Department is responsible for maintaining the department’s fire
apparatus, support vehicles, and mechanical tools and equipment. These services are
supervised by the Fleet Services Manager, who is extremely proficient in providing these services
and was spoken highly of by BFD management and line personnel. The fleet services
facility/shop located at 4848 Midland Road is well-equipped, sufficiently sized, clean, and well-
maintained. The Fleet Services Manager oversees the shop and the entire fleet maintenance
system; the Manager is assisted by nine mechanics and three service technicians. Two of the
mechanics at the shop are Emergency Vehicle Technicians (EVTs) who have received
specialized training on fire apparatus and emergency equipment repairs. CPSM highly
commends the efficiency and effectiveness of the fleet management services unit given the
staff and the corresponding output of services delivered.
Preventive maintenance is performed every 4,000 miles or at six-month intervals on ladder trucks
and engines. The Fleet Maintenance Department will do just about all repairs in-house, except
transmission, radiator, tires, and windshields, all of which are contracted out. Fleet maintenance
personnel are integrally involved in writing and reviewing vehicle specifications and working with

25
BFD operational personnel on vehicle acceptance. The shop maintains a significant supply
inventory of minor parts and auto supplies that are securely stored in-house. Most repair needs
are filled and delivered by local parts establishments.
The capability to track the annual cost of operations, including mechanical repair costs, is
critical in determining whether a vehicle is costing excessive amounts to be maintained. This can
include vehicle repairs, labor costs, and parts. This information is critical in determining when
replacement is warranted or can be anticipated in upcoming budget cycles. At the time of this
assessment, Motor Pool was utilizing an automated system to track work orders, labor rates, and
parts. This system appears effective in its reporting and is kept up to date.
NFPA 1901, Standard for Automotive Fire Apparatus, 2016 edition, serves as a guide to the
manufacturers that build fire apparatus and the fire departments that purchase them. The
document is updated every five years, using input from the public/stakeholders through a formal
review process. The committee membership is made up of representatives from the fire service,
manufacturers, consultants, and special interest groups. The committee monitors various issues
and problems that occur with fire apparatus and attempts to develop standards that address
those issues. Of primary interest to the committee over the past years has been improving
firefighter safety and reducing fire apparatus accidents.
The Annex Material in NFPA 1901 contains recommendations and work sheets to assist in
decision-making in vehicle purchasing. With respect to recommended vehicle service life, the
following excerpt is noteworthy:
"It is recommended that apparatus greater than 15 years old that have been
properly maintained and that are still in serviceable condition be placed in reserve
status and upgraded in accordance with NFPA 1912, Standard for Fire Apparatus
Refurbishing, to incorporate as many features as possible of the current fire apparatus
standard. This will ensure that, while the apparatus might not totally comply with the
current edition of the automotive fire apparatus standards, many improvements and
upgrades required by the recent versions of the standards are available to the
firefighters who use the apparatus.”13
"Apparatus that were not manufactured to the applicable apparatus standards or
that are over 25 years old should be replaced."14
In a 2004 survey of 360 fire departments in urban, suburban, and rural settings across the nation,
Pierce Manufacturing reported on the average life expectancy for fire pumpers.15 The results are
shown in the following table.
TABLE 3-6: Fire Pumper Life Expectancy by Type of Jurisdiction
Demographic Frontline Service
Annual Miles
Driven Reserve Status
Total Years of
Service
Urban 15 Years 7,629 10 Years 25
Suburban 16 Years 4,992 11 Years 27
Rural 18 years 3,034 14 Years 32
Note: Survey information was developed by Added Value Inc. for Pierce Manufacturing in, “Fire Apparatus
Duty Cycle White Paper,” Fire Apparatus Manufacturer’s Association (FAMA), August 2004.
13. NFPA 1901, Standard for Automotive Fire Apparatus, 2016 Edition. Quincy, MA.
14. NFPA 1901, Standard for Automotive Fire Apparatus, 2016 Edition. Quincy, MA.
15. “Fire Apparatus Duty Cycle White Paper,” Fire Apparatus Manufacturer’s Association. August 2004.

26
Most agencies utilize a combination of funding methods for apparatus replacements. These
include capital replacement funds, bond initiatives, or simply through annual budget
allocations. The key, however, is to develop an ongoing funding mechanism to fund the
replacement of apparatus when their useful lifespan has been met. Billings has been very
attentive in making annual allocations to its fire apparatus fleet replacement fund. It was
estimated that total replacement value of the BFD frontline fleet is $6,300,000.
Using a straight-line amortization schedule that anticipates a 15-year replacement schedule for
engines and the quint, and 18 years for the ladder, CPSM estimates that an annual vehicle
replacement schedule will require an estimated $405,000 annually to keep pace with the
replacement schedule. This schedule assumes a replacement cost of $650,000 for an engine,
$1million for the quint, and $1.4 million for a ladder truck. Also, no adjustment was made in this
calculation for the annual cost increase in new fire apparatus, which historically has averaged
3 percent to 5 percent annually.
The current condition of the fleet is aging. Most apparatus are at the end of their anticipated
frontline service life. Four of the frontline engines are 12 years old or older. The quint is 16 years
old and approaching an odometer reading of 120,000. The city can anticipate apparatus
replacement costs in the next five years that will approach $4 million. Fortunately, the city has
adopted and maintained and Equipment Replacement Plan (ERP). This fund allocates dollars
annually in anticipation of vehicle and large equipment replacement. This plan has proven to
be successful in establishing an appropriate vehicle replacement schedule and in providing
sufficient funding to meet this budgetary obligation. CPSM recognizes the City of Billings’ ERP as
a Best Practice.
Capital Equipment
Fire apparatus are equipped with various types of tools and equipment that are utilized in
providing fire and EMS services. Many of the tools and much of the equipment carried on fire
apparatus are specified in NFPA and ISO guidelines. Fire and EMS equipment includes such items
as hose, couplings, nozzles, various types of ladders, foam, scene lighting, oxygen tanks, AEDs,
defibrillators, small hand tools, fire extinguishers, mobile and portable radios, salvage covers, and
medical equipment and supplies. Many of the small tools and equipment are considered
disposable items and are replaced with ongoing operating funds. However, some pieces of
equipment are very expensive, and thus their replacement must be planned. The more
expensive capital items include:
■ Self-contained breathing apparatus (SCBA) and fill stations.
■ Firefighting PPE (personal protective equipment).
■ Hydraulic/pneumatic extrication equipment.
■ ECG Monitors/Defibrillators/AEDs.
■ Thermal imaging cameras.
■ Mobile/portable and base radios.
■ Mobile data computers.
■ Gas monitoring and detection devices.
Much of the more expensive capital equipment is generally on a ten-year replacement cycle.
Each new apparatus must be outfitted with a complement of capital equipment; a full
27
complement has an estimated cost of nearly $200,000. The total cost of outfitting a department
the size of the BFD with the capital items described is estimated to be in excess of $2 million. Thus,
CPSM estimates that the annual replacement needs for these types of capital items in the BFD is
approximately $200,000 to $250,000.
RADIO INTEROPERABILITY AND COVERAGE
In general, interoperability refers to seamless radio communications between emergency
responders using different communication systems or products. Wireless communication
interoperability is the specific ability of emergency responders to use voice and data
communication in real time, without delay. For example, police, fire, and EMS responding to an
incident are interoperable when all can communicate with one another over individual and
perhaps shared communication channels. Interoperability enables first responders from any
jurisdiction to communicate with one another at larger incidents and also enables emergency
planners and personnel to coordinate their radio operations in advance of major events.16
The BFD has transitioned its radio system to a P-25, trunked system. This system provides complete
interoperability with area law enforcement and surrounding jurisdictions. Unfortunately, AMR
does not utilize the P-25 compliant trunked system and direct unit-to-unit radio communications
are not possible. Subsequently, BFD provides a portable radio to assigned AMR ambulances in
the city to facilitate unit-to-unit communications. It is essential to have unit-to-unit
communication between emergency responders who jointly respond on the majority of all calls.
CPSM believes that efforts must be made to move AMR units to the P-25 compatible trunked
system.
Recommendation: The city should work with AMR to implement a common
radio frequency that is utilized by ambulance and fire first responders on all
EMS calls. (Recommendation No. 13.)
§ § §
16. SAFECOM, U.S. Department of Homeland Security, “Interoperability,”
http://www.safecomprogram.gov/SAFECOM/interoperability/default.htm.

28
SECTION 4. ANALYSIS OF PLANNING
APPROACHES
FIRE RISK ANALYSIS
The cost of providing fire and EMS protection in many communities has increased steadily in
recent years. This has been fueled in part by rising wages, additional special pay, and escalating
overtime costs. In addition, funding requirements have been compounded by increasing health
insurance premiums and spiraling pension contributions. At the same time, the workforce has
become less productive, largely because of the increases in lost time, specifically vacation
leave, greater usage of sick leave, compensatory time, and increases in other miscellaneous lost
time categories (Kelly Days, workers’ compensation, light duty, FMLA, holiday leave, training
leave, etc.). As a result, many jurisdictions are asking the fundamental question of whether the
level of risk in their jurisdiction is commensurate with the type of protective force that is being
deployed. To this end, a fire risk and hazard analysis can be helpful in providing a more
objective assessment of a community’s level of risk.
A fire risk analysis utilizes a “fire risk score,” which is a rating of an individual property on the basis
of several factors, including:
■ Needed fire flow if a fire were to occur.
■ Probability of an occurrence based on historical events.
■ The consequence of an incident in that occupancy (to both occupants and responders).
■ The cumulative effect of these occupancies and their concentration in the community.
A community risk and vulnerability assessment is used to evaluate community properties and
assign an associated risk as either a high, medium, or low hazard. The NFPA Fire Protection
Handbook defines these hazards as:
High-hazard occupancies: Schools, hospitals, nursing homes, explosive plants, refineries,
high-rise buildings, and other high life-hazard or large fire-potential occupancies.
Medium-hazard occupancies: Apartments, offices, and mercantile and industrial
occupancies not normally requiring extensive rescue by firefighting forces.
Low-hazard occupancies: One-, two-, or three-family dwellings and scattered small business
and industrial occupancies. 17
Plotting the rated properties on a map provides a better understanding of how the response
matrix and staffing patterns can be used to ensure a higher concentration of resources for worst-
case scenarios or, conversely, fewer resources for lower levels of risk.18
17. Cote, Grant, Hall & Solomon, eds., Fire Protection Handbook (Quincy, MA: NFPA 2008), 12.
18. Fire and Emergency Service Self-Assessment Manual, Eighth Edition (Center for Public Safety Excellence,
2009), 49.

29
Hazard Analysis and Community Risk Assessment
Hazard analysis and community risk assessment are essential elements in a fire department’s
planning process. The City of Billings and the BFD have recognized the need for a
comprehensive community risk and vulnerability assessment and are working diligently in
pursuing this outcome to help define the optimum arrangement for deploying resources. Each
jurisdiction has to decide what degree of risk is acceptable to the citizens it serves. This
determination is based on criteria that have been developed to define the levels of risk (e.g., of
fire) within all sections of the community.19 To this end, a comprehensive planning approach that
includes a fire risk assessment and hazard analysis is essential in determining local needs.
The term integrated risk management refers to a planning methodology that recognizes that
citizen safety, the protection of property, and the protection of the environment from fire and
related causes must include provisions for the reasonable safety of emergency responders. This
means assessing the risk faced, taking preventive action, and deploying the proper resources in
the right place at the right time.20 There are two main considerations of a risk assessment: the
probability of an event occurring and the consequence of that event occurring. The matrix in
the following figure divides the risk assessment into four quadrants. Each quadrant of the chart
creates different requirements in the community for commitment of resources.
FIGURE 4-1: Community Risk Matrix
Plotting the rated properties on a map will provide a better understanding of how the response
matrix and staffing patterns can be used to ensure a higher concentration of resources for worst-
case scenarios or, conversely, fewer resources for lower levels of risk.21
Community risk and vulnerability assessments are essential elements in a fire department’s
planning process. Although the City of Billings and the BFD have identified a number of potential
19. Compton and Granito, Managing Fire and Rescue Services, 39.
20. Cote, Grant, Hall & Solomon, eds., Fire Protection Handbook (Quincy, MA: NFPA 2008), 12-3.
21. Fire and Emergency Service Self-Assessment Manual, Eighth Edition, (Center for Public Safety
Excellence, 2009), 49.

30
hazards in the community, a comprehensive community risk and vulnerability assessment has not
been done.
Recommendation: The Billings Fire Department should conduct a formal fire
risk assessment that concentrates on the city’s downtown, strip commercial
establishments, big-box occupancies, high-rise structures, and industrial,
processing, and institutional properties. (Recommendation No. 14.)
As a guide in conducting a vulnerability assessment, CPSM has developed the following
template that may be utilized in completing this process.
Community Risk Assessment Template
TASK 1: Establish a Risk Assessment Team
■ Five to six members with assorted skills.
■ Team leader.
■ Data analyst.
■ Tactical/command expertise.
■ City planning/growth management.
■ Financial/economic.
■ GIS/mapping.
TASK 2: Review and Plot Historical Workload (5 years)
■ Breakout daily call distribution by type.
□ Location/occupancy type.
□ High-volume/frequent use.
○ Hospital.
○ University.
○ Adult living center.
■ Identify high-dollar loss fire events (>$25K).
□ Location/occupancy type.
□ Cause & origin/demographic.
■ Identify high-manpower events (>20 people).
■ Identify high-time duration events (>2 hours).
■ Identify events with significant economic impact (>$1 million).
■ Identify events with multiple injuries or fatalities.
■ Identify events with significant environmental impacts (which require remediation).
TASK 3: Identify the Community Risks for High-profile Events
■ Transportation accidents (rail, air, roadway, port).

31
■ Occupancies with high OVAP scores.22
■ Wildfire events.
■ Large, complex fire (dormitory, assisted living, jail, hospital, etc.).
■ Processing or manufacturing accident (chemical, radiologic, petroleum, electrical, etc.).
■ Mass casualty incident.
■ Weather, flooding, or seismic event.
■ Terrorist event.
■ Driven by a community profile or demographic.
TASK 4: Identify Capacity Issues or Incidents in which Insufficient Resources Resulted in a
Negative Outcome
■ Related to daily activities.
■ Related to larger/significant events.
■ Related to incidents requiring the utilization of mutual aid or external resources.
■ Other incident types.
TASK 5: Identify Additional Service Demands Related to Anticipated Growth of the Service Area
■ Affecting daily activities
■ Related to larger/significant events
■ Incidents that required specialized services or a currently unavailable expertise
TASK 6: Identify Risk Reduction or Prevention Efforts that can Reduce or Eliminate Future
Workload
■ Related to daily activities.
■ Related to larger/significant events.
■ Related to new demand resulting from growth.
■ Develop cost/outcome analysis.
TASK 7: Identify Additional Training Needs to Better Manage Current or Anticipated Service
Demand
■ Develop cost/outcome analysis.
TASK 8: Identify Organizational or Tactical Capabilities Needed to Meet Current Shortfalls
■ Develop cost/outcome analysis.
In addition to examining risks faced by the community at large, the department needs to
examine internal risks. The National Fire Protection Association’s Standard for a Fire Department
Occupational Safety and Health Program (NFPA 1500) requires a risk management plan for fire
departments to be developed separately from those that are incorporated in the local
22 http://riskassessment.strategicfire.org/wp-content/uploads/2016/03/Community-Risk-Assessment-Guide-
v1.5.pdf

32
government plan.23 The Billings Fire Department does not have a written internal risk
management program in place.
A fire department risk management plan is developed and implemented to comply with the
requirements of NFPA 1500. The following components must be included in the risk management
plan:
Risk Identification: Actual or potential hazards.
Risk Evaluation: The potential of occurrence of a given hazard and the severity of its
consequences.
Prioritizing Risk: The degree of a hazard based upon the frequency and severity of occurrence.
Risk Control: Solutions for elimination or reduction of real or potential hazards by implementing
an effective control measure.
Risk Monitoring: Evaluation of effectiveness of risk control measures. 24
HAZARDOUS MATERIALS RESPONSE
Hazardous materials incidents occur with some frequency in Billings. In 2019, according to data
provided by the BFD, there were 325 hazmat-related calls of varying degree. Incidents ranged
from natural gas and propane leaks, carbon monoxide incidents, biologic hazards, combustible
and flammable gas spills, chemical hazards, assorted spills and leaks, and chemical incidents. A
portion of the incidents are directly attributable to gasoline and oil spills from vehicles that travel
through portions of Billings. I-90/ I-94, and Highways 87, 21, and 3 run through or are adjacent to
the city and account for much of the city traffic and a portion of the spill calls.
Billings is home to active oil refinery faculties; these pose significant threat with regard to
hazardous materials spills and containment issues. Additional concern involves the two railroad
lines that operate through the city. The Burlington Northern Santa Fe (BNSF) rail line and the
Montana Rail Link carry Amtrak trains along with high-volume cargo trains that run through the
city on a regular basis. In addition, the Billings-Logan International Airport is located within city
limits, just two miles north of downtown. While crash fire-rescue is provided by the airport
personnel, BFD has joint response duties for any significant event. The airport offers 140 daily
flights on nine different commercial carriers in addition to cargo services by UPS and FedEx. The
airport saw annual passenger traffic of just under 1 million in 2019.
Indeed, the traditional primary risks are those generated by hazmat transportation and fixed
facilities. However, over the years, the type and nature of incidents to which regional hazmat
teams may respond has significantly changed and have become more technically challenging.
Examples include the following:
■ Clandestine labs, criminal and terrorist use of hazmat as weapons, chemical suicides, etc.
■ Interdisciplinary response scenarios in which the regional hazmat teams’ interface with their
response partners in the law enforcement, emergency medical, and fire communities.
Scenarios include special events and the use of Joint Hazard Assessment Teams (JHAT),
23. Robert C. Barr and John M. Eversole, eds., The Fire Chief’s Handbook, 6th edition (PennWell Books, 2003),
270.
24. NFPA 1500, Standard for a Fire Department Occupational Safety and Health Program (2007 ed.), Annex
D.

33
improvised explosive devices, coordinated/complex attack scenarios, active
shooter/assailant scenarios, and the emergence of virus threats such as Ebola and Zika.
■ Tourism and economic development initiatives have drawn national level and sporting events
and festivals to the state. While this is a positive economic development, high-profile and high-
density crowd events raise the threat level that requires a more sophisticated hazmat
preparedness and response package.
■ Changes in the U.S. domestic energy infrastructure have impacted the response community,
such as for incidents involving high-hazard, flammable trains with crude oil and ethanol,
increased use of liquefied natural gas (LNG) and related facilities, etc.
■ The increasing use of social media is viewed as both a situational awareness asset and a
potential operations security (OPSEC) vulnerability. The regional hazmat teams can assume a
leadership role in determining future pathways and options on how social media can be
safely and effectively integrated into response operations.25
Response to hazardous materials incidents is defined in the BFD Standard Operating Procedures.
Billings is compliant with OSHA, Hazardous Waste Operations and Emergency Response, 29 CFR
Part 1910.120 and NFPA 472, Professional Competence of Responders to Hazardous Materials
Incidents. Level I incidents can be effectively managed and mitigated by the first response
personnel without a hazardous materials response team or other special unit. These incidents
include:
■ Spills that can be properly and effectively contained/or abated by equipment and supplies
immediately accessible to BFD.
■ Leaks and ruptures that can be controlled using equipment and supplies accessible to BFD.
■ Fires involving toxic materials and which can be extinguished and cleaned up with resources
immediately available to BFD.
■ Hazardous materials incidents not requiring civilian evacuation. (Example: A small pool supply
spill that can be diluted with water for clean-up.)
The Billings Fire Department operates a Regional Hazardous Materials Response Team (RHMRT)
that coordinates with six other regional teams that operate throughout Montana, along with
Montana National Guard (83rd CST) and Park Service resources. The team is specialized in
providing critical skills and equipment needed during any emergency where hazardous
materials, chemical, radiologic, and biological dangers are present. The RHMRT provides hazard
identification, response, and mitigation to not only Billings and the metro area, but throughout
Montana.
Each BFD responder maintains hazardous materials operations-level certification, which enables
them to identify hazards and defensive operations for those situations requiring Level II and III
capability. CPSM recognizes the BFD’s participation in the RHMRT as a Best Practice, and we
view the current level of response capability as appropriate for the community.
25. Flippin, P., et al; Virginia Department of Emergency Management Hazmat Program Strategic Review
(VDEM, Richmond, VA, 2016)
34
TARGET HAZARDS AND FIRE PREPLANNING
The process of identifying target hazards and pre-incident planning are basic preparedness
efforts that have been key functions in the fire service for many years. In this process, critical
structures are identified based on the risk they pose. Then, tactical considerations are
established for fires or other emergencies in these structures. Consideration is given to the
activities that take place (manufacturing, processing, etc.), the number and types of occupants
(elderly, youth, handicapped, imprisoned, etc.), and other specific aspects relating to the
construction of the facility or any hazardous or flammable materials that are regularly found in
the building. Target hazards are those occupancies or structures that are unusually dangerous
when considering the potential for loss of life or the potential for property damage. Typically,
these occupancies include hospitals, nursing homes, and high-rise and other large structures.
Also included are arenas and stadiums, industrial and manufacturing plants, and other buildings
or large complexes.
NFPA’s 1620, Standard for Pre-Incident Planning, through its Sample Pre-Incident Plan Field
Collection Card and Facility Data Record in Annex A is quite specific in identifying the need to
utilize a written narrative, diagrams, and predesignated, detailed forms to depict the physical
features of a building, its contents, and any built-in fire protection systems. Information collected
for pre-fire/incident plans includes, but is certainly not limited to, data such as:
■ The occupancy types.
■ Floor plans/layouts.
■ Building construction type and features.
■ Building fire protection systems.
■ Utility locations.
■ Hydrant locations.
■ Hazards to firefighters and/or firefighting operations.
■ Hazmat considerations and locations.
■ Special conditions in the building.
■ Apparatus placement plan.
■ Fire flow requirements and/or water supply plan.
■ Forcible entry and ventilation plan.
■ Emergency contact information.
NFPA 1620 goes on to state that “A pre-incident plan is one of the most valuable tools available
for aiding responding personnel in effectively controlling an emergency.”26 The information
contained in pre-incident fire plans enables firefighters and officers to have a familiarity with the
building/facility, its features, characteristics, operations, and hazards. Thus, they can more
effectively, efficiently, and safely conduct firefighting and other emergency operations. Pre-
26 http://www.nfpa.org/codes-and-standards/all-codes-and-standards/codes-and-
standards/detail?code=1620

35
incident fire plans should be reviewed regularly and tested by periodic table-top exercises and
on-site drills, especially in the most critical and frequented occupancies.
Strategically and from an operational standpoint, according to NFPA 1620, pre-incident
planning is a total concept based upon the following:
■ Situation awareness.
■ Management commitment.
■ Education.
■ Protection.
■ Prevention.
■ Emergency organization.27
Billings is home to several hospitals and medical centers. These include the Billings Hospital:
Murter Melody Ann, St. Vincent Healthcare, and Billings Clinic. There is also the Advanced Care
Hospital of Montana, the Rehabilitation Hospital of Montana, Riverstone Health, and the Billings
VA Clinic. There are numerous senior assisted living facilities in Billings, including Autumn Springs,
Tender Nest, Westpark Village, the Legacy, Canyon Creek Memory Center, Casmur Assisted
Living, Sweetwater Retirement Community, Morning Star, Primrose, the Springs at Grand Park,
River Ridge, Gallaghers, Lincoln Lane, Avantara, and Highgate Senior Living.
The city has two oil refineries (Exon Mobile and Phillips 66), and a number of oil exploration and
production processing facilities including Iron Oil, Rig Mats of America, Cardinal Oil LLC, Baker
Commodities, Industrial Measurement and Control, Ballard Petroleum Holdings, and McJunkin
Red Man. There are a number of agribusiness-related companies and processing facilities in
Billings including Wilbur-Ellis, Western Sugar, JR Simplot, Mintana Mills, Midland Implement
Company, Billings Farmhand, Helena Agri Enterprises, Westfeeds, and Agri Industries. The
downtown area also has many businesses, high-rise structures, and restaurants with suppression
systems for which familiarization and preplanning walk-throughs could be accomplished during
some form of company inspection program.
CPSM believes that these conceptual considerations are particularly relevant in the case of BFD
and the BFD Fire Prevention Division. BFD line personnel are actively involved in in-service
company inspections and pre-fire incident planning. CPSM believes that these efforts are critical
in developing tactical expertise and preplanning reconnaissance; while at the same time they
provide an ability to inspect and correct code violation and life-safety concerns. CPSM
recognizes BFD and its pre-fire planning and in-service company inspection program as a Best
Practice.
ACCREDITATION
Accreditation is a comprehensive self-assessment and evaluation model that enables
organizations to examine past, current, and future service levels. It is used to evaluate internal
performance and compares this performance to industry best practices. The intent of the
process is to improve service delivery.
27. Ibid.

36
The Center for Public Safety Excellence (CPSE) provides an extensive evaluation process, on a
fee basis, to member agencies and which ultimately leads to accreditation. CPSE is governed
by the Commission on Fire Accreditation International (CFAI), an 11-member commission
representing a cross-section of the fire service, including fire departments, city and county
management, code councils, the U.S. Department of Defense, and the International Association
of Firefighters.
The CPSE Accreditation Program is built around the following key measurements:
■ Determine community risk and safety needs.
■ Evaluate the performance of the department.
■ Establish a method for achieving continuous organizational improvement.
Local government executives face increasing pressure to "do more with less" and justify
expenditures by demonstrating a direct link to improved or measured service outcomes.
Particularly for emergency services, local officials need criteria to assess professional
performance and efficiency.
CPSE accreditation has national recognition and is widely used throughout the fire service. The
key to its success is that it enables communities to set their own standards that are reflective of
their needs and a service delivery model that is specific to these needs. In addition, it is a
program that is based on ongoing improvement and continuous monitoring. The CPSE
accreditation model may be well-suited for Billings.
Recommendation: Billings should consider working toward CPSE Fire
Accreditation in the future. (Recommendation No. 15.)
§ § §

37
SECTION 5. OPERATIONAL RESPONSE
APPROACHES
As mentioned previously, many agencies incorporate the use of prefire plans to provide a
response and tactical strategy for those more critical or complex occupancies in the
community. Figures 5-1 to 5-3 illustrate the critical tasks and resources required on low and
moderate risk structure incidents along with when an aerial device is utilized. Understanding the
community’s risk greatly assists fire department planning, and with ongoing training, these
activities improve overall effectiveness and responder safety.
FIGURE 5-1: Low-Risk Response–Exterior Fire Attack
Figure 5-2 is a representation of the critical task elements for a moderate-risk structure fire. Some
jurisdictions add additional response resources to meet and, in some cases, exceed the national
benchmarking provided by the National Fire Protection Association (NFPA) 1710, Standard for
the Organization and Deployment of Fire Suppression Operations, Emergency Medical
Operations, and Special Operations to the Public by Career Departments, 2020 Edition. NFPA
1710 calls for the initial assignment of 16 personnel on a single-family residential structure fire
when an aerial ladder is not utilized. Billings is able to assemble a full complement of resources
for a single-family residential structure fire from its on-duty resources. In fact, on the initial
assignment to a residential structure fire, BFD will typically assemble upwards of 17 personnel,
including an off-duty training officer who responds to all structure fires, assisting Command as the
Safety Officer.

38
FIGURE 5-2: Moderate-Risk Response–Interior Fire Attack
FIGURE 5-3: Full-Force Response–Utilizing an Aerial Device

39
FIRE RESPONSE PROTOCOLS
The ability to assemble the necessary resources to effectively manage even a smaller residential
or commercial structure fire is significant. As mentioned above, the NFPA standard (NFPA 1710)
recommends a minimum of 16 personnel as the initial response to a fire at a single-family
residential structure. An actual fire of any significance will require 16 to 20 personnel or more for
extended periods of time. As the incident grows in size and complexity, it is not unusual to see
staffing needs that can exceed 30 to 40 personnel. This would be the case in a fire at a big-box
retail center like a Home Depot or Walmart, a wildfire, or a fire at an apartment complex.
Though these larger incidents do not occur frequently, when they do occur, the ability to
assemble sufficient resources rapidly can significantly impact the outcome.
The decision as to what is the proper staffing level for a specific community’s protection is
perhaps the most difficult assessment faced by policy makers and fire department leadership
across the nation. As communities adjust this level of response, the costs associated with
maintaining this level of readiness will have significant financial implications. CPSM believes that
the deployment process in Billings is built around residential and commercial fire suppression
efforts. As the predominance of the BFD workload involves EMS-related call activities, as CPSM
stated previously we believe that Billings should consider an alternative deployment strategy
that utilizes smaller, two-person EMS squad units to handle the high volume of EMS calls and
other service-related incidents that do not involve fire extinguishment.
The key to organizational efficiency and the safety of responding personnel is directly related to
response activities and departmental deployment practices. BFD is doing an excellent job in
responding the fewest number of units to those incidents that are non-emergency or are public
service-related. Our evaluation indicates that, overall, BFD is responding one unit to nearly 95
percent of all responses (95.7 percent of EMS calls and 90.7 percent of fire calls). However,
when it comes to the mode of response (lights and sirens or no lights and sirens), BFD is not
proficient and we believe that significant improvements can be made. Overall, about 95
percent of all incidents in Billings are handled by a single unit response. CPSM recognizes this as
a Best Practice which should be continued. Figures 5-4 and 5-5 illustrate the breakout of the
number of units arriving for EMS and fire call types, respectively.
§ § §

40
FIGURE 5-4: Number of Units Dispatched–EMS
FIGURE 5-5: Number of Units Dispatched–Fire
§ § §
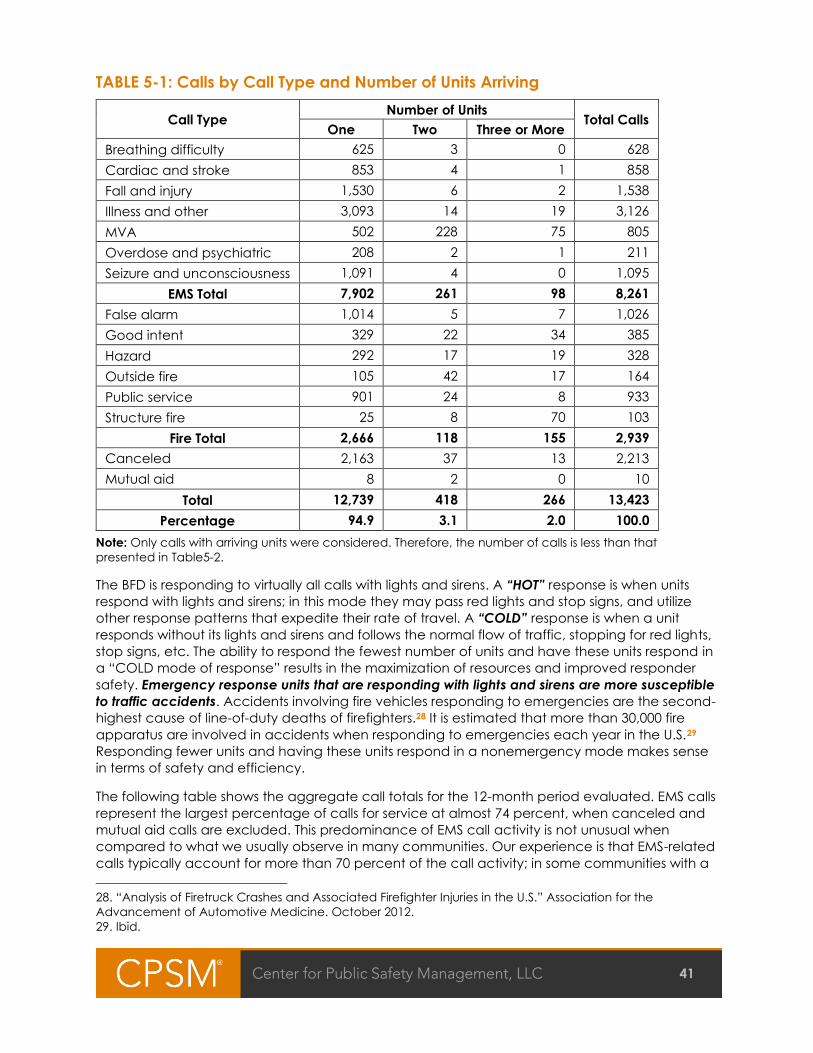
41
TABLE 5-1: Calls by Call Type and Number of Units Arriving
Call Type Number of Units
Total Calls One Two Three or More
Breathing difficulty 625 3 0 628
Cardiac and stroke 853 4 1 858
Fall and injury 1,530 6 2 1,538
Illness and other 3,093 14 19 3,126
MVA 502 228 75 805
Overdose and psychiatric 208 2 1 211
Seizure and unconsciousness 1,091 4 0 1,095
EMS Total 7,902 261 98 8,261
False alarm 1,014 5 7 1,026
Good intent 329 22 34 385
Hazard 292 17 19 328
Outside fire 105 42 17 164
Public service 901 24 8 933
Structure fire 25 8 70 103
Fire Total 2,666 118 155 2,939
Canceled 2,163 37 13 2,213
Mutual aid 8 2 0 10
Total 12,739 418 266 13,423
Percentage 94.9 3.1 2.0 100.0
Note: Only calls with arriving units were considered. Therefore, the number of calls is less than that
presented in Table5-2.
The BFD is responding to virtually all calls with lights and sirens. A “HOT” response is when units
respond with lights and sirens; in this mode they may pass red lights and stop signs, and utilize
other response patterns that expedite their rate of travel. A “COLD” response is when a unit
responds without its lights and sirens and follows the normal flow of traffic, stopping for red lights,
stop signs, etc. The ability to respond the fewest number of units and have these units respond in
a “COLD mode of response” results in the maximization of resources and improved responder
safety. Emergency response units that are responding with lights and sirens are more susceptible
to traffic accidents. Accidents involving fire vehicles responding to emergencies are the second-
highest cause of line-of-duty deaths of firefighters.28 It is estimated that more than 30,000 fire
apparatus are involved in accidents when responding to emergencies each year in the U.S.29
Responding fewer units and having these units respond in a nonemergency mode makes sense
in terms of safety and efficiency.
The following table shows the aggregate call totals for the 12-month period evaluated. EMS calls
represent the largest percentage of calls for service at almost 74 percent, when canceled and
mutual aid calls are excluded. This predominance of EMS call activity is not unusual when
compared to what we usually observe in many communities. Our experience is that EMS-related
calls typically account for more than 70 percent of the call activity; in some communities with a
28. “Analysis of Firetruck Crashes and Associated Firefighter Injuries in the U.S.” Association for the
Advancement of Automotive Medicine. October 2012.
29. Ibid.
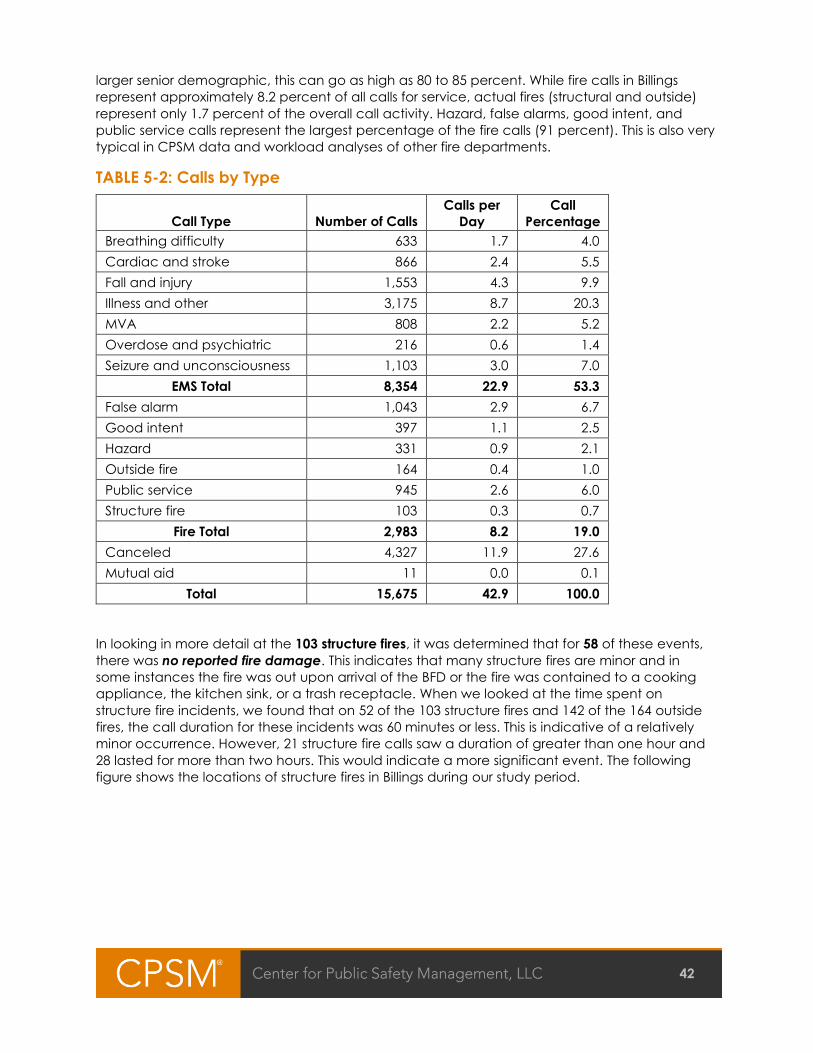
42
larger senior demographic, this can go as high as 80 to 85 percent. While fire calls in Billings
represent approximately 8.2 percent of all calls for service, actual fires (structural and outside)
represent only 1.7 percent of the overall call activity. Hazard, false alarms, good intent, and
public service calls represent the largest percentage of the fire calls (91 percent). This is also very
typical in CPSM data and workload analyses of other fire departments.
TABLE 5-2: Calls by Type
Call Type Number of Calls
Calls per
Day
Call
Percentage
Breathing difficulty 633 1.7 4.0
Cardiac and stroke 866 2.4 5.5
Fall and injury 1,553 4.3 9.9
Illness and other 3,175 8.7 20.3
MVA 808 2.2 5.2
Overdose and psychiatric 216 0.6 1.4
Seizure and unconsciousness 1,103 3.0 7.0
EMS Total 8,354 22.9 53.3
False alarm 1,043 2.9 6.7
Good intent 397 1.1 2.5
Hazard 331 0.9 2.1
Outside fire 164 0.4 1.0
Public service 945 2.6 6.0
Structure fire 103 0.3 0.7
Fire Total 2,983 8.2 19.0
Canceled 4,327 11.9 27.6
Mutual aid 11 0.0 0.1
Total 15,675 42.9 100.0
In looking in more detail at the 103 structure fires, it was determined that for 58 of these events,
there was no reported fire damage. This indicates that many structure fires are minor and in
some instances the fire was out upon arrival of the BFD or the fire was contained to a cooking
appliance, the kitchen sink, or a trash receptacle. When we looked at the time spent on
structure fire incidents, we found that on 52 of the 103 structure fires and 142 of the 164 outside
fires, the call duration for these incidents was 60 minutes or less. This is indicative of a relatively
minor occurrence. However, 21 structure fire calls saw a duration of greater than one hour and
28 lasted for more than two hours. This would indicate a more significant event. The following
figure shows the locations of structure fires in Billings during our study period.

43
FIGURE 5-6: Location of Structure Fires
There were 43 structure fires in which some degree of fire damage was noted in the incident
report. The total fire loss (structure and contents) for all structural fires in the 12-month evaluation
period was estimated to be $3,765,150. Fire damage estimates are made by BFD investigators
and company officers.
For the calls in which damage was reported (structure and contents), we estimate that the
average damage for each fire was approximately $112,143. We can compare this experience
to average fire loss nationwide for structure fires. NFPA estimates that in 2019 the average fire loss
for a structure fire in the U.S. was $25,500.30 From this perspective the average fire loss in Billings is
significantly higher than the amount of loss found in many communities across the nation.
Another indication that we use in our analysis of structure fire occurrence is the frequency in
which an individual event results in a combined loss that exceeds $25,000. The $25,000
demarcation is relevant from two perspectives. First, this is a dollar amount that is comparable to
the national average for fire loss in a structure fires, and second, it indicates a fire loss that from
CPSM’s perspective is representative of a more significant fire event that requires fire
30. Marty Ahrens and Ben Evarts, “Fire Loss in the United States during 2019,” NFPA September 2020.

44
department extinguishment. In the period evaluated, there were 25 structure fires in which the
combined fire loss was $25,000 or greater (22 in Billing, 3 in the BUFSA).
FIGURE 5-7: Location of Structure Fires with Fire Loss Greater Than $25,000
The largest combined fire loss (structure and contents) for a single event was $806,000. The
average fire loss and the frequency of higher loss fires appears higher in Billings than what would
be expected. It is hard to fully determine the reason(s) for the number of fires that resulted in
significant fire loss; however, CPSM believes that this level of loss would be significantly lower if
automatic fire sprinklers were installed in residential structures.
The following two tables provide an analysis of fire loss in Billings during the year-long evaluation
period.

45
TABLE 5-3: Content and Property Loss – Structure and Outside
Location Call Type Property Loss Content Loss
Loss Value Number of Calls Loss Value Number of Calls
Billings
Outside fire $96,050 17 $48,200 5
Structure fire $3,639,150 38 $980,000 32
Total $3,735,200 55 $1,028,200 37
BUFSA
Outside fire $495,000 3 $50,000 1
Structure fire $126,000 5 $77,000 5
Total $621,000 8 $127,000 6
Total $4,356,200 63 $1,155,200 43
Note: The table includes only fire calls with a recorded loss greater than 0.
TABLE 5-4: Total Fire Loss Above and Below $25,000
Location Call Type No Loss Under $25,000 $25,000 plus
Billings
Outside fire 119 16 1
Structure fire 55 16 22
Total 174 32 23
BUFSA
Outside fire 27 1 2
Structure fire 3 2 3
Total 30 3 5
Total 204 35 28
Observations:
■ 146 outside fires and 58 structure fires had no recorded loss.
■ Three outside fires and 25 structure fires had $25,000 or more in loss.
■ Structure fires:
□ The highest total loss for a structure fire was $806,000.
□ The average total loss for all structure fires was $112,143.
□ 37 structure fires had content loss with a combined $1,057,000 in losses.
□ Out of 101 structure fires, 43 had recorded property loss, with a combined $3,765,150 in
losses.
■ Outside fires:
□ The highest total loss for an outside fire was $390,000.
□ The average total loss for outside fires with loss was $34,463.
□ Six outside fires had content loss with a combined $98,200 in losses.
□ Out of 166 outside fires, 20 had recorded property loss, with a combined $591,050 in losses.

46
WILDLAND FIRES
Wildland fires occur with regular frequency in the Billings area and surrounding communities.
Generally, the fire season extends from June into November of each year, during the hot and
dry months. Because of the terrain and fire load in the Billings area, most wildland fires are
controlled and contained early, with limited damage to residences, outside buildings,
equipment, and infrastructure. For those ignitions that are not readily contained and when
combined with the prevalent high winds, it is not uncommon for these fires to grow in size and
intensity and threaten homes and buildings.
In the 12-month evaluation period, BFD responded to 36 incidents that were classified as
wildfires, grass fires, or brush fires in city jurisdiction, BUFSA, and in neighboring mutual aid
response areas. These fires were primarily small in nature and involved fires in open areas, forest
or woodlands, grass fires, and fires in cultivated croplands. Most fires were contained rapidly, in
less than an hour; however, there were seven fires that required significant resources and took
more than several hours to contain. The following table is a breakout of the size in acres of
wildfire/brush and grass fires in Billings and neighboring mutual aid jurisdictions.
TABLE 5-5: Wildland, Grass, and Brush Fires, Billings and Mutual Aid Communities
Location Number of
Acres Burned
Number of
Calls
Shepherd 316 1
Shepherd 113 1
Park City 4 1
Billings 3 1
Shepherd 3 1
Billings 1 1
BUFSA 1 2
Billings N/A 19
BUFSA N/A 7
Huntly N/A 2
The Billings area is subject to larger events, such as the 2020 Bobcat Fire in neighboring
Musselshell County that burned 30,300 acres and threatened hundreds of homes. In 2019, the
Mountain View Fire in neighboring Stillwater County burned about 2,775 acres.
§ § §

47
FIGURE 5-8: Location of Brush/Grass Wildland and Vegetation Fires
Fuel Management and Wildfire Hazard Mitigation Programs
The goal of fuel management and wildfire hazard mitigation programs is to protect life and
property by providing effective public education and wildfire home protection strategies
through fuel reduction efforts. Programs of this type include prescribed burning, forest thinning
projects, vegetation management, directed logging efforts, and watershed protection. The
reduction of wildfire hazards helps protect firefighter and public safety, as well as improves the
ability to protect property in the event of a fire.
To be effective, programs of these types need to be carried out on a regional basis and must
involve collaborative efforts at the local, regional, state, and federal levels. These programs can
be employed to identify and prioritize prefire and post-fire management strategies and tactics,
all of which are aimed at reducing the threat of a loss to life and property from wildfires.
Several methods can be used to reduce forest biomass fuels. Prescribed burning is the
deliberate use of fire in specific areas under specified conditions to reduce fuel loads. Thinning is
the selective removal of fuels to eliminate fuel ladders that contribute to the larger and more
devastating crown fires. Broadcast burns eliminate fine fuels, grasses, and smaller ground fuel,
which reduces the head and spread rate of fires when they occur.
48
Many communities that are susceptible to wildfire have undertaken fuel management and fuel
mitigation efforts that focus on those specific risks in their communities. These include protecting
and hardening efforts for housing in the wildland urban interphase (WUI) or specific infrastructure
that is critical to the community (electrical transmission lines, transportation networks, utility
systems, watersheds, etc.). Fuel management programs are typically orchestrated during
seasonal operating periods, utilizing temporary employees who serve multiple functions such as
thinning or clearing efforts in wildfire prone areas. In addition, these employees can provide
public education and home prescription guidance for those properties that are vulnerable.
Lastly, they provide additional wildland firefighting forces that can be deployed both locally and
for out-of-area assignments.
Recommendation: The BFD should consider hiring seasonal fuel crews who
can provide fuel management and wildfire mitigation efforts in the
community. (Recommendation No. 16.)
The fuel management effort must be collaborative and involve key agencies, including
Yellowstone County, area Fire Departments, the U.S. Forest Service, National Parks personnel, the
Bureau of Land Management, tribal entities, and local universities. These efforts must be
coordinated; specific outreach and community awareness efforts must be orchestrated to
improve overall effectiveness and acceptance. CPSM has found that the cost-recovery
potential for seasonal fuel programs is very high. The frequency and intensity of wildfires in the
Western United States has created a significant demand for these resources and the revenue
potential for the co-utilization of wildfire personnel and equipment will likely escalate in the
foreseeable future.
INTEGRATED RISK MANAGEMENT
Fire suppression and response, although necessary to minimize property damage, have little
impact on preventing fires. Rather, public fire education, fire prevention, and built-in fire
protection and notification systems are essential elements in protecting citizens from death and
injury due to fire. The term integrated risk management, first developed in the United Kingdom,
refers to a planning methodology that focuses on citizen safety and the protection of property
and the environment through a community-wide fire reduction effort. This is accomplished by
assessing the risk faced, taking preventive action, and deploying the proper resources in the
right place at the right time.31
An integrated risk management model uses incident data (location, construction types,
population density, demographics, etc.) to assess all types of fire, health, and safety risk in the
community. The model is then used to manage risk through targeted, community-based risk
reduction strategies and flexible approaches to incident response (See Merseyside Fire and
Rescue Service and Nanaimo Fire Rescue).
The integrated risk management model helps to guide deployment of the fire department’s
response and prevention resources to best meet the frequency and location of incidents. It also
aids in all-hazard risk assessment, and increases the value of risk reduction efforts (such as fire
prevention education for the elderly and children, the populations that are the most vulnerable
to fire). Finally, the model can be used to measure the fire department’s service workload, and
assess the efficiency and outcome of the delivery of each service; the department can then
make adjustments as needed. In essence, integrated risk management pulls together all the
31. National Fire Protection Association, Fire Protection Handbook (2008 Edition), 12-3.

49
different planning aspects of community hazard and vulnerability analysis, fire department risk
management, resource allocation, and performance measurement into one unified, cohesive
whole. The end product of this effort is the reduction of fire incidents.
There is clearly a concentration of overall call activity, including a predominance of structure
fires, in the downtown area of Billings. We identified an area of approximately 11.2 square miles
(12.1 percent of the combined service area) that should be the focus of an integrated risk
management effort. The area highlighted in the following figure generated:
■ More than 50 percent of the total call volume (all calls) in the city.
■ 59 structure fires.
■ 73 percent of those structure fires with fire loss exceeding $25,000 (16 fires)
■ Five of the top 10 fire loss fires in the city.
■ More than $2.9 million of combined fire loss, representing 61 percent of the city’s total fire loss.
FIGURE 5-9: Area of Concentration of Billings Structure Fires
It appears that this area is an ideal target for a concentrated effort that focuses on reducing the
occurrence of fire. CPSM believes that enhanced code enforcement efforts, concentrated

50
public outreach, directed prefire planning, smoke detector distribution, and in-service company
inspections would have a significant impact on reducing fire incidents in this area.
Recommendation: BFD should develop an integrated risk management plan
that focuses on structure fires in the area of the community that has a history
of the highest risk of occurrence. (Recommendation No. 17.)
The downtown area depicted in Figure 5-9 clearly generated a significant number of the city’s
structure fires and a predominance of overall fire loss. The key to future prevention is to drill down
on these incidents to determine if any patterns of similarities exist regarding the cause of these
incidents. Questions that could be investigated include:
■ Are there any seasonal trends?
■ Do fires frequently involve cooking or heating appliances?
■ Are there certain demographic groups involved, such as the elderly or certain ethnic groups?
■ Are fires concentrated in rental properties?
Identifying trends or patterns thus points the way to opportunities to concentrate code
enforcement, inspections, or public outreach efforts that could impact these outcomes.
EMS RESPONSE AND TRANSPORT
EMS calls make up the predominant workload within the BFD system. As already mentioned,
nearly 74 percent of the call activities reviewed (when canceled and mutual aid calls are
excluded), involve EMS-related responses (including MVAs).
BFD operates in a two-tiered EMS delivery system in cooperation with AMR. AMR is a private, for-
profit corporation that is a fully integrated healthcare provider. It is authorized under city
ordinance to provide 911ambulance ground transportation in the City of Billings. AMR has a
unique working relationship with the city in that it operates under a municipal ordinance rather
than a time-certain provider agreement. The ordinance has been in effect since May of 2002
and there have been no changes in the terms of this arrangement since that time.
CPSM believes that the current working relationship with AMR should be expanded and
specified in a provider agreement or contract that defines the terms and conditions of this
relationship. This contact should address the following service requirements:
■ Term of agreement and extension options.
■ Dispatching procedures and response-time standards for emergency and non-emergency
call types.
■ Performance measures and service delivery standards.
■ Reporting requirements for patient complaints, accidents, personnel malfeasance, etc.
■ Specified penalties and termination proceedings for noncompliance.
■ Adopting medical control and treatment protocols.
■ Radio communications and CAD interface.
■ ePCR reporting and data transfer.

51
■ QA/QI requirements and remediation.
■ Inter-agency training requirements.
■ Mass causality and disaster responsibilities.
■ Equipment/supplies exchange and first responder fees.
■ Approval of the provider transport fee schedule and fee revisions.
■ Other transport services (Interfacility, air transport, etc.).
Recommendation: The City of Billings should move to an Ambulance Provider
Services Agreement with AMR. This agreement should specify the terms and
conditions for providing these services to the city. (Recommendation No. 18.)
CPSM is not inferring any failures or making any accusations regarding the quality of care or level
of services currently being provided by AMR. Our recommendations are merely that any working
relationship with an out-sourced service provider should be guided by an openly competitive
and negotiated services agreement that fully specifies the terms and conditions of this
relationship.
Evaluating ALS Capabilities
Many fire and EMS agencies often struggle with the question of whether they should maintain
EMS first response at the ALS level or if providing a BLS-level first response is more appropriate.
BFD currently employees approximately 30 credentialed paramedics and equips all its primary
response apparatus with equipment and supplies required to provide Advanced Life Support
(ALS) services. BFD does not have a minimum staffing policy regarding the number of
paramedics that are on duty and assigned to each of the city’s seven service response areas.
Personnel have assigned stations; if a paramedic is not on duty at a station during a shift, that
unit reverts to a BLS first response unit. BFD does not alter or modify its response patterns on the
basis of whether a unit is staffed as ALS or BLS. BLS first response is a high level of EMS first
response and in most instances is sufficient to provide the treatment that is needed for optimum
patient care. It must also be pointed out that all AMR units are staffed with paramedics and
provide ALS care at all times.
CPSM has observed a number of ALS first response systems that are beginning to question the
effectiveness of ALS first response over BLS first response. In fact, a number of recent clinical
studies have found that there are limited impacts on patient outcomes when EMS first response
services are at the BLS level vs. ALS.32 The ability to provide ALS first response care is significantly
more expensive than BLS first response. These costs are a result of the additional equipment that
is required in the delivery of ALS care and the level of training required for paramedics versus
EMTs. In addition, most systems pay higher pay to paramedics to maintain a higher level of
certification. In the BFD system, paramedics receive a 5 percent pay adjustment for maintaining
their paramedic certification.
32.https://www.researchgate.net/publication/51110389_Advanced_life_support_versus_basic_life_support_i
n_the_pre-hospital_setting_A_meta-analysis
https://www.ems1.com/bls/articles/bls-is-more-than-basic-its-fundamental-to-good-care-
vUccOufXAABcGUQW/#:~:text=They%20found%20no%20substantial%20difference,(60.1%25%20v%2051.2%2
5).
https://www.jems.com/special-topics/assumptions-discredit-als-vs-bls-study/

52
From this perspective, it appears that BFD is deploying its ALS units with little regard to the actual
impacts of providing ALS versus BLS first response. CPSM believes that BFD should evaluate its
practice of providing ALS care and determine if there is any measurable benefit in providing ALS
care over the care provided when operating as BLS first responders.
Recommendation: BFD should evaluate its efforts to maintain ALS first
response capabilities with its primary response units. (Recommendation
No. 19.)
The concepts in prehospital emergency medical care are rapidly evolving as more evidence-
based research becomes available on the efficacy and effectiveness of traditional EMS models.
Two of the more widely-held EMS system response beliefs that have been challenged by this
research include:
■ Faster response times improve patient outcomes.
■ The more paramedics in an EMS system the higher the level of care.
Four recent studies evaluated the impact of response times on patient outcomes; findings
consistently point to the fact that there is very little, if any association, between EMS response
times and patient outcomes.33 Further, a 2008 statement developed by the Consortium of U.S.
Metropolitan Municipalities EMS Medical Directors published in Pre-hospital Emergency Care
Journal contains the following:
“Over-emphasis upon response-time interval metrics may lead to unintended, but
harmful, consequences (e.g., emergency vehicle crashes).”34
As EMS systems were initially developed, the concept of a paramedic on every call seemed
logical. This concept led to the development of ALS first response. It is thought that the evidence
for an ALS 1st response model was derived, for the most part, from early research that showed
improved cardiac arrest outcomes with an ALS response time of eight minutes or less.35 At the
time of this study (1979), only paramedics could perform defibrillation. Today, automated
external defibrillators (AEDs) are commonplace and are used effectively by bystanders. In fact,
most current research indicates that the initiation of CPR and AED use by bystanders are the
most significant survival predictors for out-of-hospital cardiac arrest (OHCA) victims.36
Conversely, there have been several published studies that indicate that when there is an
excess of paramedics on an EMS call, and there are more paramedics operating in an EMS
system, there is a negative impact on patient outcomes.37 While initially this may seem counter-
intuitive, the reality is that the performance of critical ALS skills requires regular practice on real
patients.
When paramedics are assigned to every response vehicle and they are assigned to every
service district in the jurisdiction, there is very little likelihood that a paramedic assigned to
service response areas that are less busy will encounter a high number of critical patients that
33. See: https://www.ncbi.nlm.nih.gov/pubmed/15995089
https://www.ncbi.nlm.nih.gov/pubmed/19731155
https://www.ncbi.nlm.nih.gov/pubmed/12217471
https://www.ncbi.nlm.nih.gov/pubmed/11927452
34. Prehospital Emergency Care 2008;12:141–151
35. JAMA. 1979 May 4;241(18):1905-7
36. https://www.ncbi.nlm.nih.gov/pubmed/28427882
37. See: https://www.ncbi.nlm.nih.gov/pubmed/19499471
https://www.ncbi.nlm.nih.gov/pubmed/18584496

53
require these advanced services. However, when paramedics are utilized selectively and
assigned to only the most critical patients, the frequency with which they use advanced
medical procedures and critical treatment protocols is expanded dramatically. Think of it this
way: If you need to select a cardiac surgeon, are you likely to choose the surgeon that
conducts one procedure a month or the one who conducts 20 procedures a month? The ability
to develop and maintain critical life-saving skills are enhanced and more readily monitored
when these services are provided by a limited number of individuals.
The position statement of the Consortium of U.S. Metropolitan Municipalities’ EMS Medical
Directors contains the following provision:
“As more paramedics are added to a particular system, however, the frequency with
which each individual paramedic has the opportunity to assess and manage
critically ill or injured patients in the primary or “lead” paramedic role may decrease.
Pragmatically, considering that ALS cases constitute a small minority of all EMS 9-1-1
responses, adding more paramedics into the system may actually reduce an
individual paramedic’s exposure to critical decision-making and clinical skill
competencies.”38
Interestingly, EMS systems that are widely recognized for their exceptional outcomes on critical
patients, such as Seattle (King County) and Milwaukee, actually limit the number of paramedics
operating in these EMS systems. The theory is it is better to have a few, very well-experienced
paramedics than a large number of paramedics who rarely practice their critical skills.
EMS Response Mode
Evolved EMS systems have revised response configurations based on quality emergency
medical dispatch processes, deemphasizing speed as a proxy for quality service. These systems
liberally use non-lights and siren responses and reserve precious ALS first response resources for
the few calls in which the rapid arrival of an EMS unit may make a life-or-death difference. The
key component in making this distinction is the utilization of an effective and coordinated call
screening and emergency medical dispatching process.
A recent report compiled by the National Highway Traffic Safety Administration (NHTSA), “Lights
and Sirens Use by Emergency Medical Services (EMS): Above All Do No Harm,”39 revealed that
HOT responses are inherently dangerous, do not result in changes of patient outcomes, and
should be limited to only time-life critical events. The study goes on to recommend that HOT
responses should be less than 50 percent of all EMS responses.
Our observations and national statistics indicate that when medical priority dispatching systems
are fully functional, the number of Priority 1 calls that necessitate a “HOT” response are
dramatically reduced. We have also observed in a number of urban EMS delivery systems that
responding fire officers and paramedics are given the latitude to alter their mode of response on
the basis of the dispatch call-screening process and dispatcher notes and their familiarity with
the caller.40 As a result of this discretion, the ensuing response patterns have been altered so that
“HOT” responses are being reduced significantly to about 20 percent of the total EMS call
activity.41
38. Prehospital Emergency Care 2008;12:141–151. 39 https://www.ems.gov/pdf/Lights_and_Sirens_Use_by_EMS_May_2017.pdf
40. See Sugar Land Fire-Rescue, a suburb of Houston TX.
41. Ibid.

54
In addition to modifying the response mode, there is also the option to actually eliminate the fire
department’s response completely for those very minor EMS call types or public assist calls in
which a single ambulance response is sufficient. This point is critical, as government entities are
frequently faced with requests for additional EMS response capabilities because of the volume
of EMS call activity. Th following figure is a graphic developed by the International Academies of
Emergency Dispatch that provides guidance regarding the mode of response and resources
deployed on the basis of the call-screening and call-prioritization process.
FIGURE 5-10: MDPS Response Matrix
The Billings 911Communication Center is currently determining if the call is ALS or BLS and also
making the distinction between emergency and non-emergency calls. However, BFD units
continue to respond HOT regardless of the 911 Center’s call-screening assessment. CPSM
believes that as many as 6,000 calls annually can be altered to a COLD response in the Billings
service area.
Recommendation: BFD should work with the 911 Dispatch Center to
implement response protocols that alter the BFD response mode when calls
are determined to be minor or non-emergency. (Recommendation No. 20.)
In addition to modifying the response mode, there is also the option to actually eliminate the fire
department’s response completely for those very minor EMS call types or public assist calls in
which a single ambulance response is sufficient. In the 2019 evaluation period, BFD units
responded to over 4,300 calls in which units were canceled en route; the overwhelming majority
of these were initially identified as being EMS-related. CPSM believes that many, if not most,
canceled calls would not necessitate a BFD response if a call-screening process is fully

55
implemented. This point is critical, as government entities are frequently faced with requests for
additional EMS response capabilities because of the volume of EMS call activity.
Community Paramedicine
In many communities, an effective call-screening process along with a Mobile Integrated Health
(MIH) Care and Community Paramedicine Program are being used to diver calls to alternative
service providers and transport destinations (other than hospital emergency departments).A
Community Paramedicine Program can facilitate patient care, reduce costs, and unclog
overloaded EMS networks. (See for example, MedStar Mobile Healthcare, Fort Worth, Texas, and
Colorado Springs Fire Department, CARES Program, Colorado Springs, Col.). Glacier County EMS
initiated Montana’s first MIH program in 2017. Additional MIH pilot programs have been
established throughout Montana:
■ Red Lodge Fire.
■ STAT Ambulance Service-Glasgow.
■ Great Falls Emergency Services.
■ Marcus Daily EMS – Hamilton.
■ Jesse Ambulance/Power River EMS – Broadus.
■ Rocky Boy Ambulance – Box Elder.
Such a program requires a strong relationship between the dispatch center, area hospitals, and
social services partners. CPSM believes that a Mobile Integrated Healthcare option can be
viable in Billings. This approach can help manage the impacts of low-acuity calls in the system
and address the social and behavioral health needs of patients accessing the 911 pre-hospital
care environment.
Recommendation: BFD should work with AMR, the 911 Dispatch Center, area
hospitals, and social service providers to develop a Billings FD-
MIH/Community Paramedicine program. (Recommendation No. 21.)
CPSM believes that if the city, BFD, and the Billings Fire Union (Local 521) can work cooperatively
to reduce the number of Kelly Days that personnel now take as paid time off, there would be
sufficient added capacity from among current staffing to enable the operation of a Peak-
Period Aid Car that can support a Billings FD-MIH/CP Program.
MUTUAL AID/AUTOMATIC RESPONSE
Local governments use many types of intergovernmental agreements to enhance fire
protection and EMS services. These arrangements take various shapes and forms and range
from a simple automatic response agreement that will respond a single unit to a minor vehicle
accident or EMS call, to a more complex regional hazardous materials team or a helicopter
trauma service that involves multiple agencies and requires a high level of coordination.
It is important that fire departments are able to quickly access extra and/or specialized
resources to manage significant events. In addition, because these types of incidents do not
respect jurisdictional boundaries, they often require a coordinated response. Sharing resources
also helps departments reduce costs without impacting service delivery. All of these situations
point to the need for good working relationships with other fire and EMS organizations.

56
The City of Billings is the largest municipality in Montana; many of its neighboring communities
have much smaller fire services, oftentimes volunteer or combination departments.
Subsequently, BFD does not utilize mutual aid resources or maintain automatic response
agreements with these agencies. However, Yellowstone County has an active mutual aid
agreement for wildfire incidents and which involves agencies throughout the county. The city
plays a vital role in supporting many of its neighboring agencies, primarily Huntley.
The city also works with the U.S Forest Service and the Montana Department of Natural
Resources & Conservation (DNRC) in the exchange of resources for wildfire incidents both in the
city and the BUFSA, assists these agencies for responses on state and federal lands, and assists in
larger wildfire incidents throughout the region. BFD will also respond to incidents at the Billings
Logan International Airport, which is a municipal operation, although ARFF (Aircraft Rescue Fire
Fighting) is provided by a separate agency under the supervision of Airport Operations.
WORKLOAD ANALYSIS
The current workload being handled by the Billings Fire Department is significant, with many units
experiencing what can be classified as moderate to high call volumes. CPSM considers units
responding to more than 3,000 calls each year as having a high workload. Overall, BFD units are
responding to approximately 43 calls each day.
The BFD operates from seven fire stations with nine primary response units. Combined, these units
handled nearly 15,700 calls for service in the one-year period covered by this report. These
15,675 calls generated 18,881 runs or unit responses. On any given call there can be multiple unit
responses or “runs.” For example, a single structure fire call will typically generate seven runs. It
must be pointed out that of the 18,881-unit responses, a total of 4,776 of these (25.3 percent)
were canceled calls in which a BFD unit initiated a response but was canceled en route and
never arrived at the incident. There was only one BFD unit that responded to more than 3,000
calls in the 12-month evaluation period (Engine 1). Engine 3 and Engine 5, the next busiest units,
each responded to more than 2,500 calls (2,662 and 2,796, respectively).
However, given the relatively short call durations for both fire and EMS calls (average of 20.2
minutes), the cumulative in-service time associated with this call activity was not very high.
Tables 5-6 and 5-7 show the annual runs, call types, and deployed time for the primary BFD
response units. Of note is the column labeled “Deployed Min. per Day”, in Table 5-6, which shows
that Engine 5, for example, which is the busiest unit in the city, is only involved in emergency
response activities a total of 167 minutes (2.8 hours) each 24-hour duty day.
§ § §

57
TABLE 5-6: Call Workload by Unit
Station Unit Unit Type
Deployed
Minutes
per Run
Total
Annual
Hours
Deployed
Minutes
per Day
Total
Annual
Runs
Runs
per
Day
1
BC BC * 34.0 261.9 43.0 462 1.3
BR01 Brush 150.1 57.6 9.5 23 0.1
BR2297 Brush 151.7 30.3 5.0 12 0.0
EN01 Engine 16.2 914.9 150.4 3,387 9.3
EN11 Engine ** 73.7 41.8 6.9 34 0.1
TN01 Tender 91.5 18.3 3.0 12 0.0
TR01 Ladder 21.1 331.9 54.6 944 2.6
Total 20.4 1,656.6 272.3 4,874 13.4
2
BC2 BC * 52.5 7.9 1.3 9 0.0
EN02 Engine 17.3 600.5 98.7 2,079 5.7
RES2 Rescue 22.1 79.8 13.1 217 0.6
Total 17.9 688.1 113.1 2,305 6.3
3
EN03 Engine 18.2 801.0 131.7 2,647 7.3
EN33 Engine ** 15.1 3.8 0.6 15 0.0
Total 18.1 804.7 132.3 2,662 7.3
4
BR04 Brush 89.4 8.9 1.5 6 0.0
EN04 Engine 20.0 827.3 136.0 2,477 6.8
MAC4 MAC 86.4 7.2 1.2 5 0.0
Total 20.3 843.5 138.7 2,488 6.8
5
BR05 Brush 27.5 7.8 1.3 17 0.0
EN05 Engine 22.1 1,016.8 167.1 2,755 7.5
EN55 Engine ** 70.0 5.8 1.0 5 0.0
HAM5 Hazmat 101.1 11.8 1.9 7 0.0
TN05 Tender 37.5 7.5 1.2 12 0.0
Total 22.5 1,049.7 172.6 2,796 7.7
6
BR06 Brush 20.9 6.3 1.0 18 0.0
EN06 Engine 20.0 740.8 121.8 2,220 6.1
Total 20.0 747.1 122.8 2,238 6.1
7
BR07 Brush 32.2 11.8 1.9 22 0.1
EN07 Engine 22.3 555.2 91.3 1,496 4.1
Total 22.4 567.0 93.2 1,518 4.2
Total 20.2 6,356.7 1,044.9 18,881 51.7
Note: * Battalion Chief; ** Reserve engine.

58
TABLE 5-7: Annual Runs and Deployed Time by Run Type
Call Type
Deployed
Minutes
per Run
Annual
Hours
Percent
of Total
Hours
Deployed
Minutes
per Day
Annual
Runs
Runs
per Day
Breathing difficulty 21.0 228.2 3.6 37.5 651 1.8
Cardiac and stroke 22.3 337.3 5.3 55.5 906 2.5
Fall and injury 21.8 592.0 9.3 97.3 1,628 4.5
Illness and other 21.4 1,198.8 18.9 197.1 3,363 9.2
MVA 21.4 644.5 10.1 105.9 1,806 4.9
Overdose and psychiatric 22.9 88.2 1.4 14.5 231 0.6
Seizure and unconsciousness 22.1 421.2 6.6 69.2 1,146 3.1
EMS Total 21.6 3,510.2 55.2 577.0 9,731 26.7
False alarm 15.7 292.2 4.6 48.0 1,120 3.1
Good intent 19.4 235.9 3.7 38.8 731 2.0
Hazard 30.4 258.7 4.1 42.5 510 1.4
Outside fire 29.6 172.9 2.7 28.4 351 1.0
Public service 20.6 366.0 5.8 60.2 1,068 2.9
Structure fire 64.2 616.9 9.7 101.4 577 1.6
Fire Total 26.8 1,942.7 30.6 319.3 4,357 11.9
Canceled 10.4 827.0 13.0 136.0 4,776 13.1
Mutual aid 270.9 76.7 1.2 12.6 17 0.0
Other Total 11.3 903.8 14.2 148.6 4,793 13.1
Total 20.2 6,356.7 100.0 1,044.9 18,881 51.7
Observations:
Overall
■ Total deployed time for the year was 6,356.7 hours. The daily average deployed time was
17.4 hours for all units combined.
■ There were 18,881 runs, including 4,776 runs dispatched for canceled calls and 17 runs
dispatched for mutual aid calls. The daily average was 51.7 runs.
EMS
■ EMS runs accounted for 55 percent of the total workload.
■ The average deployed time for EMS runs was 21.6 minutes. The deployed time for all EMS runs
averaged 9.6 hours per day.
Fire
■ Fire runs accounted for 31 percent of the total workload.
■ The average deployed time for fire runs was 26.8 minutes. The deployed time for all fire runs
averaged 5.3 hours per day.
■ There were 928 runs for structure and outside fire calls combined, with a total workload of
789.8 hours. This accounted for 12 percent of the total workload.

59
■ The average deployed time for outside fire runs was 29.6 minutes per run, and the average
deployed time for structure fire runs was 64.2 minutes per run.
We also looked at the call distribution between the city and the BUFSA. Overall, calls into the
BUFSA accounted for just under 5 percent of the overall call activity, or roughly 3.3 unit responses
each day. However, for outside fires, the BUFSA is generating approximately 25 percent of the
call activity. Overall, about 8.4 percent of the BFD workload can be attributed to call activities in
the BUFSA. The following table shows the distribution of BFD workload when calls within the city
and those in the BUFSA are separated.
TABLE 5-8: Annual Workload by Call Location
Location Calls
Pct.
Annual
Calls
Runs
Runs
Per
Day
Deployed
Minutes
Per Run
Total
Annual
Hours
Pct.
Annual
Work
Deployed
Minutes
Per Day
Billings 14,889 95.0 17,671 48.4 19.5 5,741.2 90.3 943.8
BUFSA 773 4.9 1,191 3.3 26.8 531.3 8.4 87.3
Other 13 0.1 19 0.1 265.8 84.2 1.3 13.8
Total 15,675 100.0 18,881 51.7 20.2 6,356.7 100.0 1,044.9
Note: The 13 ‘Other’ calls include five calls in Shepherd, two calls in Huntley, two calls in Molt, and one call
each in Broadview, Park City, Pompeys Pillar, and Worden, respectively.
When we look at the availability rates of the responding units in Billings the pattern observed is
very positive and indicative of a system that is well-managed and maintains an appropriate
number of resources to manage the existing workload. Most systems attempt to achieve an
availability rate of between 85 and 90 percent. This means that on 85 to 90 percent of the calls, a
unit is available to respond to an incident originating in its first due area. Availability rates are
most often affected by simultaneous call activity, vehicle maintenance, meetings, or other
reasons for which a unit is unavailable to respond to a call in its primary response area.
The following table shows the availability rates for the responding units of the BFD. As can be
seen from this information, BFD units are available to respond to calls occurring in their primary
districts on average about 89.8 percent of the time. This is a significant achievement given the
size of the service area and the call volume.
TABLE 5-9: Station Availability to Respond to Calls
Station Calls in
Area
First Due
Responded
First Due
Arrived
First Due
First
Percent
Responded
Percent
Arrived
Percent
First
1 2,696 2,534 2,518 2,494 94.0 93.4 92.5
2 1,574 1,399 1,384 1,361 88.9 87.9 86.5
3 1,812 1,618 1,604 1,587 89.3 88.5 87.6
4 1,818 1,573 1,550 1,510 86.5 85.3 83.1
5 2,436 2,094 2,075 2,059 86.0 85.2 84.5
6 1,995 1,857 1,845 1,827 93.1 92.5 91.6
7 1,081 969 953 929 89.6 88.2 85.9
Total 13,412 12,044 11,929 11,767 89.8 88.9 87.7
Note: For each station, we count the number of calls within its first due area where at least one BFD unit
arrived. Next, we focus on units from the first due station to see if any unit responded, arrived, or arrived first.

60
Another indicator of workload is the frequency with which peak service demand is occurring.
Peak demand can occur when there are multiple calls occurring simultaneously or when there
are larger events that draw on the system’s resources and additional calls continue to occur
while resources are assigned to the larger incident. All systems experience peak service
demands that strain the available resources in the system. This is why it is necessary for mutual
aid and joint response agreements, which help mitigate these occurrences.
The key to any deployment strategy is to have sufficient resources to handle the day-to-day call
activities and have the system designed to adjust and respond effectively during those high-
demand periods. In the Billings system, given the area being covered and the overall call
volume, we would anticipate that throughout the year there would typically be five to six calls
occurring within the same hour on a regular basis. This call activity can easily double to 10 to 15
calls in an hour during periods of inclement weather, high traffic periods, and other times when
call volume is higher than normal.
The following table has a list of the ten busiest hours in the 12-month evaluation period and the
numbers of calls occurring during each of those hours. It must be pointed out that, given the
relatively short call duration in Billings (20.2 minutes), it is very likely that two calls can occur in an
hour in the same service area and not overlap one another.
TABLE 5-10: Top 10 Hours with the Most Calls Received
Hour Number
of Calls
Number
of Runs
Total
Deployed Hours
8/11/2019, 7:00 p.m. to 8:00 p.m. 15 27 10.6
4/18/2019, noon to 1:00 p.m. 15 20 3.5
8/22/2019, 7:00 p.m. to 8:00 p.m. 11 13 4.7
3/27/2019, 7:00 p.m. to 8:00 p.m. 10 11 3.0
10/24/2019, 5:00 p.m. to 6:00 p.m. 9 16 4.1
7/13/2019, 3:00 p.m. to 4:00 p.m. 9 14 5.3
8/2/2019, 6:00 p.m. to 7:00 p.m. 9 14 4.8
5/24/2019, 4:00 p.m. to 5:00 p.m. 9 14 3.2
1/23/2019, 3:00 p.m. to 4:00 p.m. 9 12 3.9
11/8/2019, 5:00 p.m. to 6:00 p.m. 8 15 4.1
Note: Total Deployed Hours is a measure of the total time spent responding to calls received in the hour,
and which may extend into the next hour or hours. The number of runs and deployed hours only includes
BFD units.
§ § §

61
TABLE 5-11: Frequency Distribution of the Number of Calls
Calls in an Hour Frequency Percentage
0 1,803 20.6
1 2,471 28.2
2 2,096 23.9
3 1,290 14.7
4 633 7.2
5 293 3.3
6 115 1.3
7+ 59 0.7
Total 8,760 100.0
There were frequent occurrences observed throughout the year in which a cluster of calls
occurred within a given hour. We observed a total of 1,100 times (12.6 percent of all hours) in
which four or more calls occurred in a given hour. These hourly call rates are indicative of the
moderately-high call volume in the Billings system. Again, given the frequency of short call
durations, it is likely that if two calls do occur in an hour in a station’s response area, there is a
high likelihood that any overlap of the calls is relatively short and the primary response unit is
able to respond to both calls with a minimal delay.
A number of fire officials with whom we spoke raised concerns regarding the workload and
levels of coverage in the areas service by Station 6, which is often referenced as the Heights
Area. Our analysis indicated that approximately 16 structure fires occurred in this service area
during our 12-month evaluation period. Of these, we estimated that three resulted in a fire loss in
excess of $25,000. It was also determined that the majority of run activities for Station 6
(97.9 percent) did not involve actual fires. In addition, Station 6 had the highest availability rate
to respond among the single unit response stations (93.1 percent availability to respond) and
was second lowest in terms of total responses (2,238). While Station 6 is in a periphery location,
we could not determine that the current workload would justify additional resources being
deployed in this area. Overall, CPSM has determined that the BFD is very effective in managing
its current workload.

62
SECTION 6. RESPONSE TIME ANALYSIS
Response times are typically the primary measurement used in evaluating fire and EMS services.
Most deployment models attempt to achieve a four-minute initial travel time for both Fire and
EMS calls and a full-force travel time of eight minutes for fire calls. A full-force travel time
indicates the time it takes for the initial response of all resources assigned to the call to arrive on
the scene.
While these times have validity, the actual impact of a speedy response time is limited to very
few incidents. For example, in a full cardiac arrest, analysis shows that successful outcomes are
rarely achieved if basic life support (CPR) is not initiated within four minutes of the onset of the
arrest. However, cardiac arrests occur very infrequently; on average these are 1 percent to
1.5 percent of all EMS incidents.42 There are also other EMS incidents that are truly life-threatening
and the time of response can clearly impact the outcome. These involve drownings,
electrocutions, and severe trauma (often caused by gunshot wounds, stabbings, and severe
motor vehicle accidents, etc.). Again, the frequency of life-threatening calls is limited, typically
not more than 10 to 15 percent of the overall EMS call activity.
Regarding response times for fire incidents, the frequency of actual fires in Billings (structure and
outside fires) is very low, approximately 1.7 percent of all incidents. Actual structure fires were
less than 1 percent of all calls, or 103 in the 12-month period evaluated.
The criterion for fire response is based on the concept of “flashover.” This is the state at which
super-heated gasses from a fire in an enclosed area results in a near-simultaneous ignition of the
combustible material in the area. In this situation, usually after an extended period of time
(upwards to ten minutes), the fire expands rapidly and is much more difficult to contain. When
the fire reaches this hazardous state, a larger and more destructive fire occurs.
Additional research is indicating that the speed of fire spread and the degradation to structural
components is occurring much faster in modern construction43. The introduction of lightweight
construction, increases in house size, open living areas that promote smoke and flame spread,
more flammable interior contents and construction materials, are all contributing to this
outcome. Figure 6-1 is a comparison in the time to flashover when comparing modern
construction with legacy or older construction methods.
Another important factor in the whole response time question is what we term “detection time.”
This is the time it takes to detect a fire or a medical situation and notify 911 to initiate the
response. In many instances, particularly at night or when automatic detection systems (fire
sprinklers and smoke detectors) are unavailable or inoperable, the detection process can be
extended. Fires that go undetected and are able to expand in size, become more destructive,
and are more difficult to extinguish.
§ § §
42. Myers, Slovis, Eckstein, Goodloe et al. (2007).” Evidence-based Performance Measures for Emergency
Medical Services System: A Model for Expanded EMS Benchmarking.” Pre-hospital Emergency Care. 43 https://link.springer.com/article/10.1007/s10694-011-0249-2

63
FIGURE 6-1: Times to Flashover-Modern vs Legacy Construction Methods
MEASURING RESPONSE TIMES
There have been no documented studies that have made a direct correlation between
response times and outcomes in Fire and EMS events. No one has been able to show that a four-
minute response time is measurably more effective than a six-minute response time. The logic
has been “faster is better,” but this has not been substantiated by any detailed analysis.
Furthermore, the ability to measure the difference in outcomes (patient saves, reduced fire
damage, or some other quantifiable measure) between a six-minute, eight-minute, or ten-
minute response is not a performance measure often utilized in the fire service.
For example, in Billings nearly 12 percent of those calls with measurable response times (1,282),
had an initial response time of 10 minutes or higher. Though this is a significant number of calls,
there is no indication that the outcomes on these calls were markedly worse than those calls
with faster arrivals. So, in looking at response times it is prudent to design a deployment strategy
around the actual circumstances that exist in the community and the fire problem that is
perceived to exist. This requires a “fire risk assessment” and a political determination as to the
desired level of protection for the community. It would be imprudent, and very costly, to build a
deployment strategy that is based solely upon response times.
For the purpose of this analysis, response time is a product of three components: dispatch time,
turnout time, and travel time.
■ Dispatch time is the time interval that begins when the alarm is received at the
communication center and ends when the response information is transmitted via voice or
electronic means to the emergency response facility or emergency response units in the field.
Dispatch time is typically the responsibility of the 911 Center.
■ Turnout time is the time interval that begins when the notification process to emergency
response facilities and emergency response begins through an audible alarm or visual
announcement or both and ends at the beginning point of travel time.
64
■ Travel time is the time interval that initiates when the unit is en route to the call and ends when
the unit arrives at the scene.
■ Response time, also known as total response time, is the time interval that begins when the call
is received by the primary dispatch center and ends when the dispatched unit arrives on the
scene to initiate action.
BILLINGS RESPONSE TIMES
For this study, and unless otherwise indicated, our response time calculations measure the first
arriving unit only. Typically, we track only those responses in which the unit is responding with
lights and sirens (hot). Out of the 15,675 total calls, our response time analysis was based on a
total of 10,192 calls. We excluded 13 mutual aid responses, 4,325 canceled calls, 81 calls where
no units recorded a valid on-scene time, 26 calls where the first arriving unit response was
greater than 30 minutes, and 498 calls where one or more segments of the first arriving unit’s
response time could not be calculated due to missing or faulty data. Our analysis also tracked
an additional 540 calls that were made into the BUFSA. We separated the calls from Billings and
BUFSA and analyzed the BFD’s response to each area.
On the basis of these calculations, we determined:
■ The average dispatch time was 1.6 minutes.
■ The average turnout time was 1.2 minutes.
■ The average travel time was 4.3 minutes.
■ The average total response time was 7.1 minutes.
■ The average response time was 6.8 minutes for EMS calls and 7.9 minutes for fire calls.
■ The average response time was 7.5 minutes for outside fires and 6.8 minutes for structure fires.
According to NFPA 1710, Standard for the Organization and Deployment of Fire Suppression
Operations, Emergency Medical Operations, and Special Operations to the Public by Career
Departments, 2020 Edition, the alarm processing time or dispatch time should be less than or
equal to 64 seconds 90 percent of the time. This standard also states that the turnout time should
be less than or equal to 80 seconds (1.33 minutes) for fire and special operations 90 percent of
the time, and a 60 second turnout for EMS calls. Travel times are recommended to be less than
or equal to 240 seconds (4 minutes) for the first arriving engine company 90 percent of the time
for both fire and EMS calls. Table 6-1 shows the average response time in minutes for the first
arriving unit, by call type, for the BFD.

65
TABLE 6-1: Average Response Time of First Arriving Unit, by Call Type
Call Type Time in Minutes Number of
Calls Dispatch Turnout Travel Total
Breathing difficulty 1.6 1.0 3.7 6.3 617
Cardiac and stroke 1.7 1.0 3.9 6.6 838
Fall and injury 1.6 1.1 4.5 7.3 1,483
Illness and other 1.5 1.1 4.2 6.9 3,010
MVA 1.7 1.1 3.4 6.2 744
Overdose and psychiatric 1.7 1.4 5.9 8.9 201
Seizure and unconsciousness 1.6 1.0 3.8 6.4 1,060
EMS Total 1.6 1.1 4.1 6.8 7,953
False alarm 1.3 1.7 4.7 7.7 986
Good intent 1.7 1.4 4.7 7.8 361
Hazard 1.7 1.7 5.2 8.6 316
Outside fire 1.4 1.8 4.3 7.5 158
Public service 1.8 1.4 4.9 8.0 868
Structure fire 1.7 1.5 3.5 6.8 90
Fire Total 1.6 1.6 4.7 7.9 2,779
Total 1.6 1.2 4.3 7.1 10,732
TABLE 6-2: 90th Percentile Response Times, by Call Type
Call Type Time in Minutes Number of
Calls Dispatch Turnout Travel Total
Breathing difficulty 2.8 2.3 6.0 8.7 617
Cardiac and stroke 3.0 2.3 6.3 9.6 838
Fall and injury 3.0 2.5 8.1 11.3 1,483
Illness and other 2.8 2.4 7.2 10.3 3,010
MVA 3.1 2.4 6.2 9.8 744
Overdose and psychiatric 2.8 2.7 10.2 14.2 201
Seizure and unconsciousness 2.8 2.1 6.6 9.3 1,060
EMS Total 2.9 2.4 7.2 10.2 7,953
False alarm 2.1 2.8 8.4 11.7 986
Good intent 3.1 2.6 8.6 12.1 361
Hazard 3.2 2.8 9.1 13.3 316
Outside fire 2.9 2.9 7.3 11.4 158
Public service 3.3 2.8 8.4 12.3 868
Structure fire 3.3 2.7 6.3 10.4 90
Fire Total 2.9 2.8 8.3 12.1 2,779
Total 2.9 2.5 7.5 10.8 10,732

66
Observations:
■ The average dispatch time was 1.6 minutes.
■ The average turnout time was 1.2 minutes.
■ The average travel time was 4.3 minutes.
■ The average total response time was 7.1 minutes.
■ The average response time was 6.8 minutes for EMS calls and 7.9 minutes for fire calls.
■ The average response time was 7.5 minutes for outside fires and 6.8 minutes for structure fires.
■ The 90th percentile dispatch time was 2.9 minutes.
■ The 90th percentile turnout time was 2.5 minutes.
■ The 90th percentile travel time was 7.5 minutes.
■ The 90th percentile total response time was 10.8 minutes.
■ The 90th percentile response time was 10.2 minutes for EMS calls and 12.1 minutes for fire calls.
■ The 90th percentile response time was 11.4 minutes for outside fires and 10.4 minutes for
structure fires.
TABLE 6-3: Average Response Time of First Arriving Unit, by Location
Location Call Type Time in Minutes
Count Dispatch Turnout Travel Total
Billings
EMS 1.6 1.1 4.0 6.6 7,575
Fire 1.6 1.6 4.6 7.7 2,617
Total 1.6 1.2 4.1 6.9 10,192
BUFSA
EMS 1.6 1.5 6.9 9.9 378
Fire 1.7 1.9 7.3 10.8 162
Total 1.6 1.6 7.0 10.2 540
Total 1.6 1.2 4.3 7.1 10,732
TABLE 6-4: 90th Percentile Response Time of First Arriving Unit, by Location
Location Call Type Time in Minutes
Count Dispatch Turnout Travel Total
Billings
EMS 2.9 2.3 6.8 9.8 7,575
Fire 2.9 2.8 8.0 11.7 2,617
Total 2.9 2.5 7.2 10.4 10,192
BUFSA
EMS 3.0 2.8 11.2 14.2 378
Fire 3.3 2.8 11.6 15.8 162
Total 3.1 2.8 11.2 14.6 540
Total 2.9 2.5 7.5 10.8 10,732
The NFPA 1710 standard further states the initial first alarm assignment (a total of 14 personnel for
a single-family residential structure) should be assembled on scene in 480 seconds (8 minutes), 90

67
percent of the time (not including dispatch and turnout time). BFD responds an initial assignment
of 16 personnel to a reported structure fire and this was addressed previously in this report.
However, in looking at the BFD statistics on an initial first alarm assignment to structure fires, we
found that of the 103 structure fires in which a first alarm assignment was dispatched, there were
a total of 45 times in which a total of 14 personnel arrived at the scene. We would assume that
for the remaining 58 incidents (103 – 45 = 58), the units were canceled en route most likely
because the full complement was not needed.
The next three tables provide an analysis of BFD’s response to structure fires and the number of
responders, including the arrival of the initial unit dispatched and the full assignment of
14 personnel. It is important to note that in 2020, NFPA 1710 was revised and the new criteria for
an initial full alarm assignment to a detached single-family residential structure fire has been
increased from 14 personnel to 16 personnel.44
TABLE 6-5: Average and 90th Percentile Travel Times, Structure Fires
Response Type Travel Time in Minutes
Average 90th Percentile
First Arriving Unit 4.0 7.1
Full Complement of 14 Personnel 12.5 19.6
TABLE 6-6: Number and Percentage of Calls Meeting NFPA 1710 Guidelines,
Structure Fires
Response Type Calls Meeting Standard
Number of Calls Number of Calls Percent of Calls
First Arriving Unit 57 56.4 101
Full Complement of 14 Personnel 17 37.8 45
§ § §
44 NFPA-1710, 5.2.4.1.1.(9), Single-Family Dwelling Initial Full Alarm Assignment Capability.

68
TABLE 6-7: Structure Fires by Number of Responders
Number of Responders Number of Calls
3 20
4 7
5 3
6 4
7 3
8 3
9 3
10 2
11 2
12 5
13 4
14 1
15 2
16 6
17 8
18 6
19 1
20 6
21 1
22 5
23 2
25 3
26 1
29 1
32 1
56 1
Total 101
Observations:
■ Of the 101 structure fire calls, 45 of them had a full arriving complement of at least 14
personnel.
■ The average travel time for the first arriving unit was 4.0 minutes, and the 90th percentile travel
time was 7.1 minutes.
■ The average travel time for the full arriving complement of at least 14 personnel was 12.5
minutes, and the 90th percentile travel time was 19.6 minutes.
■ Of the 101 structure fire calls, the first arriving unit arrived within 4 minutes 57 times, or 56
percent of the time.
■ Of the 45 structure fire calls that had a full arriving complement of at least 14 personnel, the
full complement arrived within 8 minutes 17 times, or 38 percent of the time.

69
NFPA 1710 response time criteria are utilized by CPSM as a benchmark for service delivery and
in the overall staffing and deployment of fire departments, and are not a CPSM
recommendation. It is also our observation that agencies are seldom able to achieve the
response time criteria established in this standard. The data observed in the Billings system are
indicative of a system that is extremely proficient in its service delivery, yet it still is unable to meet
the response time criteria espoused in NFPA 1710.
The fire station is a critical link in service delivery and where facilities are located is the single
most important factor in determining overall response times and workload distribution. As noted
previously, the fire department operates from seven fire stations. The BFD fire stations are located
as follows:
■ Station 1: 2305 8th Avenue N.
■ Station 2: 501 S. 28th Street.
■ Station 3: 1928 17th Street W.
■ Station 4: 476 6th Street W.
■ Station 5: 605 S. 24th St W.
■ Station 6: 1601 Saint Andrews
■ Station 7: 1501 54th St W.
The next three figures illustrate the BFD station locations and three travel distance projections
from all stations: 240 seconds (indicated by the green overlay), 360 seconds (indicated by the
amber overlay), and 480 seconds (indicated by the red overlay). These projections are based
on actual road travel distances and the posted speed limits on these roadways.
§ § §

70
FIGURE 6-2: Billings Station Locations with Travel Projection of 240 Seconds

71
FIGURE 6-3: Billings Station Locations with Travel Projection of 360 Seconds

72
FIGURE 6-4: Billings Station Locations with Travel Projection of 480 Seconds

73
FIGURE 6-5: Billings Station Locations with Composite Travel Projections
The preceding figures show that approximately 60 to 65 percent of the developed areas of the
city are covered under the 240-second benchmark. We would estimate that approximately 75
percent of the developed areas of the city are covered under the 360-second overlay and
approximately 85 to 90 percent of the city is covered under the 480-second benchmark. These
maps only depict travel distances and not actual response times.
The next three figures show the actual locations of fire, EMS, and other emergency responses
carried out by the Billings Fire Department during the year-long study period. It is apparent from
these graphics that most responses in Billings should result in travel times that are within six to
eight minutes. It also appears that the overall distribution of calls is generally concentrated in the
downtown core areas.

74
FIGURE 6-6: BFD Fire Runs
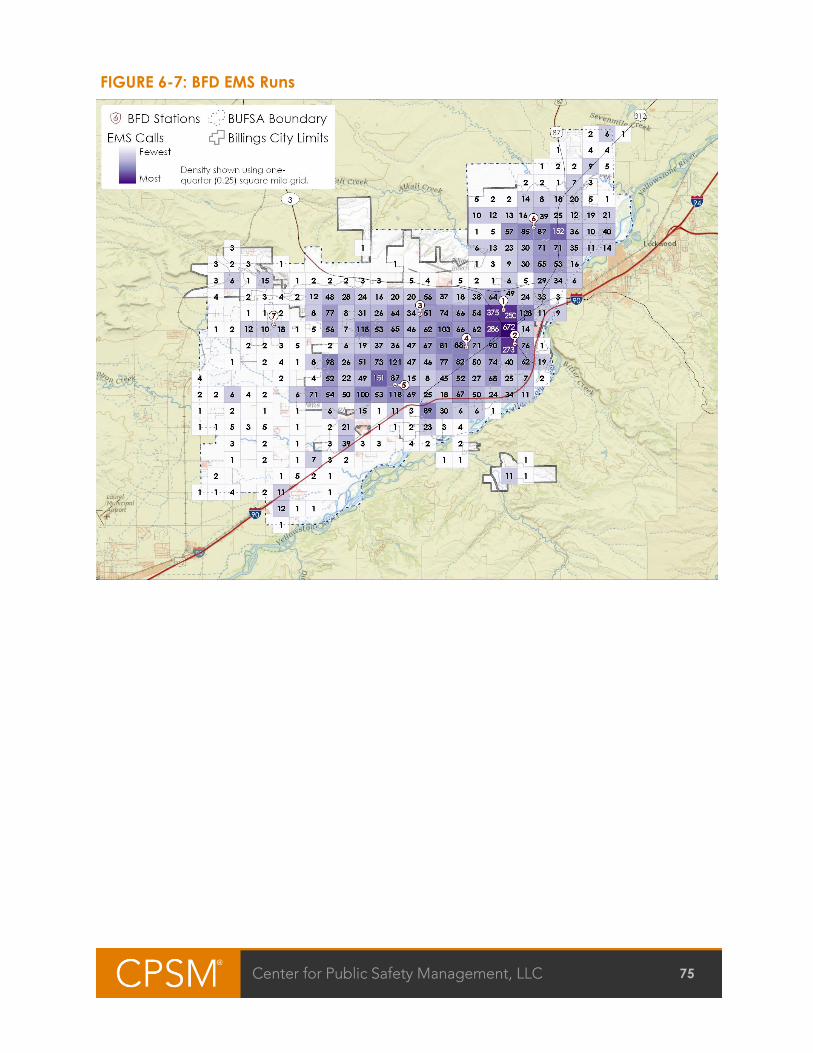
75
FIGURE 6-7: BFD EMS Runs

76
FIGURE 6-8: BFD Other Runs
In our analysis we also looked at those calls with extended total response times, that is, those
response times of 10 minutes or greater within city limits. We determined that approximately
12 percent of all responses resulted in a total response time of 10 minutes or longer. Outside of a
concentrated area between Stations 1 and 2, the majority of these calls were in those outlying
areas of the city with extended travel distances from the closest fire stations. The following figure
illustrates the location of the estimated 1,345 calls that had a total response time of 10 minutes or
greater.
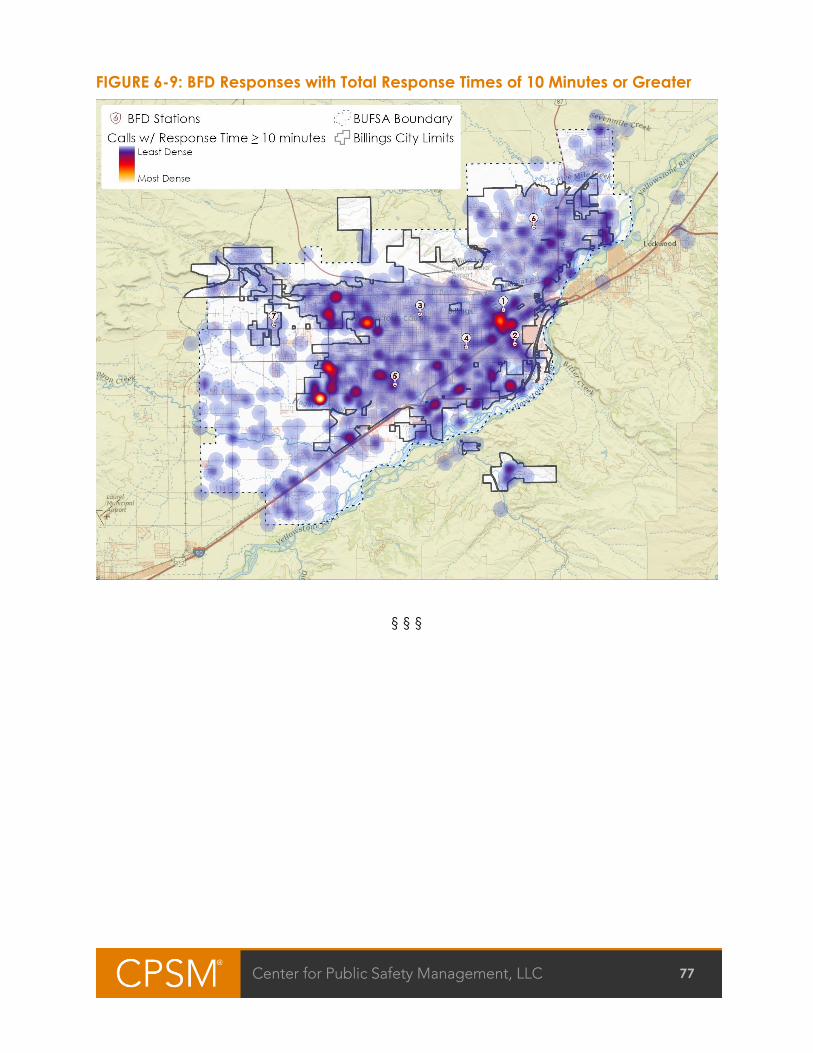
77
FIGURE 6-9: BFD Responses with Total Response Times of 10 Minutes or Greater
§ § §

78
SECTION 7. PERFORMANCE MEASUREMENT
Fire suppression, prevention programs, and EMS service delivery need to be planned and
managed so that these efforts achieve specific, agreed-upon results. This requires that a set of
goals be established for the activities that make up any given program. Determining how well
an organization or program is doing requires that these goals be measurable and that they are
measured against desired results. This is the goal of performance measurement.
Simply defined, performance measurement is the ongoing monitoring and reporting of progress
toward pre-established goals. It captures data about programs, activities, and processes, and
displays data in standardized ways that help communicate to service providers, customers, and
other stakeholders how well the agency is performing in key areas. Performance measurement
provides an organization with tools to assess performance and identify areas in need of
improvement. In short, what gets measured gets improved.
The need to continually assess performance requires adding new words and definitions to the
fire service lexicon. Fire administrators need to be familiar with the different tools available and
the consequences of their use. In Managing the Public Sector, business professor Grover Starling
applies the principles of performance measurement to the public sector. He writes that the
consequences to be considered for any given program include:
Administrative feasibility: How difficult will it be to set up and operate the program?
Effectiveness: Does the program produce the intended effect in the specified time? Does it
reach the intended target group?
Efficiency: How do the benefits compare with the costs?
Equity: Are the benefits distributed equitably with respect to region, income, gender, ethnicity,
age, and so forth?
Political feasibility: Will the program attract and maintain key actors with a stake in the program
area?45
Performance measurement systems vary significantly among different types of public agencies
and programs. Some systems focus primarily on efficiency and productivity within work units,
whereas others are designed to monitor outcomes produced by major public programs. Still
others track the quality of services provided by an agency and the extent to which citizens are
satisfied with these services.
Within the fire service, performance measures tend to focus on inputs (the amount of money
and resources spent on a given program or activity) and short-term outputs (the number of fires,
number of EMS calls, response times, etc.). One of the goals of any performance measurement
system should be also to include efficiency and cost-effectiveness indicators, as well as
explanatory information on how these measures should be interpreted. An explanation of these
types of performance measures are shown in the following table.
45. Grover Starling, Managing the Public Sector, (Cengage Learning), 396.

79
TABLE 7-1: The Five GASB Performance Indicators46
Category Definition
Input indicators These are designed to report the number of resources,
either financial or other (especially personnel), that
have been used for a specific service or program.
Output indicators These report the number of units produced or the
services provided by a service or program.
Outcome indicators These are designed to report the results (including
quality) of the service.
Efficiency (and cost-
effectiveness) indicators
These are defined as indicators that measure the cost
(whether in dollars or employee hours) per unit of output
or outcome.
Explanatory information This includes a variety of information about the
environment and other factors that might affect an
organization’s performance.
One of the most important elements of performance measurement within the fire service is to
describe service delivery performance in a way that both citizens and those providing the
service have the same understanding. The customer will ask, “Did I get what I expected?” the
service provider will ask, “Did I provide what was expected?”
Ensuring that the answer to both questions is “yes” requires alignment of these expectations and
the use of understandable terms. The author of the “Leadership” chapter of the 2012 edition of
ICMA’s Managing Fire and Emergency Services “Green Book” explains how jargon can get in
the way:
Too often, fire service performance measures are created by internal customers and
laden with jargon that external customers do not understand. For example, the
traditional fire service has a difficult time getting the public to understand the
implications of the “time temperature curve” or the value of particular levels of
staffing in the suppression of fires. Fire and emergency service providers need to be
able to describe performance in a way that is clear to customers, both internal and
external. In the end, simpler descriptions are usually better.47
The BFD does track a number of its operational and administrative activities. These
measurements include budget expenditures, call activities, concurrent incidents, and response
times. Results are published in the annual report.
At the same time, it is critical that BFD develop a series of internal reporting processes that
provide a direct link to department goals or specific target measures. It is also critical that these
measures be both quantitative and qualitative in nature and reflect on multiple areas of service
delivery within the organization. This type of ongoing analysis and the monitoring of trends are
most useful to justify program budgets and to measure service delivery levels.
46. From Harry P. Hatry et al., eds. Service Efforts and Accomplishments Reporting: Its Time Has Come
(Norwalk, CT: GASB, 1990).
47. I. David Daniels, “Leading and Managing,” in Managing Fire and Emergency Services (ICMA:
Washington, DC: 2012), 202.

80
Staff throughout the organization should participate in the development of any measures. In
addition to helping facilitate department wide buy-in, this could provide an opportunity for
upper management to better understand what the line staff believes to be critical goals—and
vice versa. For the same reason, the process of developing performance measures should
include citizen input, specifically with regard to service level preferences. Translating this advice
from the citizens into performance measures will link the citizens and business community to the
department, and will identify clearly if the public’s expectations are being met.
Recommendation: BFD should implement a series of performance measures
that enable ongoing review of service outcomes. The process of developing
these measures should utilize input from BFD members, the Fire Union, the
community, the City Council, and City Administration. (Recommendation
No. 22.)
Following are a number of performance measures that may be considered:
Operations:
■ Response times (fire and percentile/average/frequency of excessive times).
□ Alarm/dispatch handling times.
□ Turnout times.
□ Travel times.
□ On-scene time.
□ Call duration.
□ Canceled en route.
■ Workload measures
□ Emergency vs. nonemergency responses.
□ Number and frequency of EMS transports—ALS/BLS.
□ Response to automatic fire alarms/frequency and outcomes.
□ Company inspections/area occupancy familiarization.
□ Fire preplanning.
□ Public education: contact hours/numbers by age group.
■ Outcome measures
□ EMS/save rates/action taken.
□ Successful IVs and Intubations.
□ EMS protocol compliance.
□ Fire loss/limit of fire spread—point of origin, room of origin, etc.
□ On-duty injuries/worker’s comp claims.
□ Lost time—sick/injury.
□ Vehicle accidents.
□ Equipment lost or broken.
81
Training:
■ Fire and EMS hours.
■ Officer development.
■ Skills assessment compliance.
■ Specialty training.
■ Professional development/formal education/certifications.
■ Fitness performance.
Prevention:
■ Plans review (numbers/valuation amount/completion time).
■ Inspections (new and existing).
□ Numbers.
□ Completion time.
□ Violations (found/corrected).
□ Quantification by type of violation and occupancy type.
■ Fire investigations
□ Numbers and determinations.
□ Occupancy types, time of occurrence, ignition source.
□ Fire loss/structure and contents.
□ Arson arrests/convictions.
□ Fire deaths (demographics/occupancy type/cause and origin).
Miscellaneous:
■ Customer service surveys (by engine/by shift).
□ Following emergency response.
□ Public assist.
□ Inspections (prevention and company).
□ Public education.
□ In-service training (employee assessments).
■ Financial/budgetary.
□ Overtime expenditures and cause.
□ Apparatus repair costs and out-of-service time.
Key Performance Indicators for EMS
ESO is a company that is an industry leader in patient care reporting. It is a clinical data analytics
provider, and utilizes electronic patient care reports (ePCR) as its platform. In 2020, ESO released
its ESO EMS Index, which is an analysis of key performance indicators (KPIs) for EMS quality

82
metrics. The dataset is real-world data, compiled and aggregated from more than 1,300
agencies across the United States that use ESO’s products and services. These data are based
on 6.85 million patient encounters between January 1, 2019, and December 31, 2019. The Index
tracks performance of EMS agencies nationwide across five metrics:
■ Stroke assessment and documentation.
■ Overdose events.
■ End-tidal carbon dioxide (ETCO2) monitoring.
■ 12-lead electrocardiogram (EKG) use.
■ Aspirin administration for chest pain.
FIGURE 7-1: ESO EMS Index Example
BFD is using ImageTrend™ to provide its comparative analysis for EMS service delivery. CPSM
recognizes the use these types of national data bases as a necessary platform in making
comparisons. These comparisons should be reported on a regular basis (no less than quarterly),
distributed publicly, and used as a basis for continuous quality improvement.

83
SECTION 8. ESSENTIAL RESOURCES
FIRE PREVENTION AND CODE ENFORCEMENT
Ensuring that services are delivered effectively is paramount in any fire service organizational
mission. The functions of the fire marshal and fire prevention are most critical in that
organizational milieu. The foundation of a good risk management program is to prevent fires
before they occur and reduce the losses from those that do occur. The critical role of each
person assigned to enforcement activities is likely to avert more losses than is any single
firefighter and in some cases the fire department as a whole.
The fire departments that are most effective in reducing losses are those that have successfully
integrated prevention as a core value throughout the organization and continuously review the
impact of prevention on the overall services provided by the department. There are basic
approaches that can be used to ensure that prevention is treated as a paramount department-
wide priority. One way to accomplish this is to have that core value of an organization
referenced directly in the mission statement.
The Billings Fire Prevention Division provides fire prevention code enforcement, plans review,
public safety education, and cause and origin investigation services to City of Billings. Fire
prevention activities in Billings are supervised by a Fire Marshal. The Fire Prevention Division is
staffed with six full-time prevention personnel. Of these, one is an Assistant Fire Marshal and the
four others are Deputy Fire Marshals.
The City of Billings has adopted the International Fire Code (IFC) and the International Building
Code. As prescribed by the state of Montana Uniform Fire Code and Building Code, the city
currently uses the 2012 edition of the International Fire Code (IFC) and the International Building
Code (IBC). The state uniform fire and building code delineates the minimum code standards
that local jurisdictions must adopt.48 The Billings Fire Department is responsible for plan reviews,
fire inspections, and public fire education.
Under Section 14-302 of the city code, the Bureau of Fire Prevention (Fire Prevention Division) is
established with authority to enforce the adopted fire code and all its provisions and is granted
full power and authority to issue citations and take all measures necessary to fully enforce
these laws.49
The Fire Prevention Division has a wide range of duties. These include plans review and code
compliance regarding both new buildings while under construction, as well as ongoing
maintenance inspections after the building or business is occupied. A significant percentage of
these inspections are mandated as part of the Montana State Fire Marshal inspection guidelines
regarding the inspection of specific occupancies. The remainder are performed in accordance
with nationally recognized standards and best practices, with a large number being required as
part of the business licensing process. In total, it is estimated that there are more than 2,500
inspectable properties within the City of Billings.
Most fire and life-safety inspections in Billings are conducted through in-service fire company
inspections. BFD has a robust and effective In-service fire company inspection program that is
48. MCA 50-61-101.
49. City Code Billings, Montana: Sec. 14-302

84
coordinated through the Fire Marshal’s Office and carries out more than 1,800 fire inspections
annually. CPSM recognizes the BFD in-service fire inspection program as a Best Practice.
TABLE 8-1: BFD Fire Prevention Division Major Activity Statistics, 2016–2019
2016 2017 2018 2019
In-service fire company inspections 1,002 2,188 1,025 1,825
New construction plans review 314 250 280 285
New construction inspections 193 146 247 281
Reoccurring district & other inspections* 295 242 582 634
Total Inspections and Plans Reviews 1,804 2,826 2,134 3,025
Note: *Inspections involving new and existing business licenses, special events, schools and state-required
institutions, complaints, and reinspection’s.
Fire prevention costs exceed more than $900,000 annually; the majority of these services are
provided to business, manufacturing and processing entities. Many fire agencies have moved or
are moving to full cost recovery for fire prevention services including fire inspections, plans
review, and permitting services. These costs are passed on as development charges or as
ongoing business expenses. BFD is only recovering a small portion of these overall costs. CPSM
was advised that BFD recovers the cost of one Fire Inspector from building permit fees. We
believe that a larger percentage of these direct service-related costs should be captured
through fees generated from the fire inspection, plans review, and permitting process.
Recommendation: The City of Billings should increase its fire plans review,
inspection, and permitting fees in order to recover the full cost of providing
these services in the community. (Recommendation No. 23.)
Some of the costs associated with fire prevention activities (public education, fire investigations,
etc.) are generally costs that are not charged for and are provided from municipal taxation.
However, these costs make up a small percentage of the BFD fire prevention expenditures.
Residential Sprinkler Requirement
The International Fire Code (IFC) and the International Residential Code (IRC) provides
authorization for local jurisdictions to require automatic fire sprinklers in new one- and two-family
residential structures. However, the State of Montana has removed the fire sprinkler requirement
from the IFC and IRC adopted by the state. In Montana, municipalities are required to utilize the
fire code adopted at the state level.
Automatic fire sprinklers have proven to be very effective in reducing fire loss and minimizing fire
deaths in residential structures. Statistics reveal that there has never been any multiple loss of life
in a fully sprinklered building.50 Property losses are 85 percent less in residences with fire sprinklers
compared to those without sprinklers.51 Where sprinklers were present, flame damage was
confined to the room of origin in 97 percent of those fires.52 The average firefighter injury rate of
13 per 1,000 in reported home fires was 79 percent lower where sprinklers were present than in
fires with no automatic extinguishing systems.53
50. Tufts University-2019, https://publicsafety.tufts.edu/firesafety/myths-and-facts-about-sprinkler-systems/
51. Ibid.
52. NFPA-2017, https://www.nfpa.org/-/media/Files/News-and-Research/Fire-statistics-and-reports/Fact-
sheets/SprinklerHOmesFactSheet.pdf
53. Ibid.

85
According to the NFPA, the average cost nationally for installing automatic fire sprinklers in new,
single-family residential structures is estimated to be $1.35 per square foot.54 For a 2,000 square-
foot home, the estimated cost would be approximately $2,700. This can be less than the cost of
granite counter tops or a carpeting upgrade. In addition, many homeowner insurance policies
provide a discount (between 8 percent and 13 percent) for homes equipped with residential fire
sprinklers. Given the anticipated residential home expansion in the Billings area, CPSM believes
that the city should lobby the State of Montana Building Codes Council to allow local
jurisdictions to adopt amendments to the fire code that would reinstate the IFC and IRC
automatic fire sprinkler requirements in newly constructed single and two-family residential
structures.
Recommendation: The City of Billings should lobby the Montana Building
Codes Council to reinstate the International Residential Code (IRC)
requirements for automatic fire sprinklers in newly constructed single- and
two-family residential structures. (Recommendation No. 24.)
Wildland Urban Interface Code
Fire departments have long utilized the code management process to ensure life safety and
regulate construction practices. Many communities are now adopting wildland urban interface
(WUI) codes that address the dangers of wildfire. The International Code Council (ICC) has
developed a model wildland urban interface code that includes the key aspects of code
application related to wildfires.55 Areas that are covered include:
■ Defensible space and accessibility.
■ Water supply.
■ Road access and multiple means of egress.
■ Fire resistive construction, materials, and landscaping.
■ Hazardous fuel mitigation.
■ Smoke Management.
■ The impacts of slope on fire spread.
■ Fuel loads.
Billings has not adopted a wildland urban interface code for its jurisdiction; instead, it utilizes
provisions of the fire code to address specific wildfire considerations. One of the unique aspects
of the wildland interface code is that it does not have universal application throughout the
jurisdiction. Specific code provisions are applied to various sections of the community based on
the hazards that exist in these neighborhoods. Hazard assessments are done throughout the
jurisdiction and from this evaluation various vulnerability zones are created. More stringent code
provisions are applied to those zones with the greatest hazard. For example, for structures built in
the downtown areas where the threat of wildfire is minimal, few if any wildfire related code
restrictions apply. Areas that may be in proximity to hazardous fuels or where there are slope
considerations be subject to more stringent restrictions. From this perspective the code is
customized and its applications are applied depending on the hazard. In addition, the model
54. https://www.nfpa.org/News-and-Research/Data-research-and-tools/Suppression/Home-Fire-Sprinkler-
Cost-Assessment-Final-Report.
55. https://codes.iccsafe.org/content/IWUIC2018/effective-use-of-the-international-wildland-urban-
interface-code

86
interface code is much more comprehensive in addressing those critical concerns for
development in fire prone areas.
Recommendation: Billings should consider adopting a Wildland Urban
Interface Code for its service area. (Recommendation No. 25.)
It is very unlikely that the city can impose its wildland interface code on properties that are
developed outside city limits, primarily in the BUFSA. However, given the frequency of wildfire
events in these areas and the service contract between the city and Yellowstone County that
sets out provisions for these service responsibilities, it may be possible to expand the provision of
the BUFSA agreement to apply portions of the city’s WUI code in those areas of the BUFSA that
are most susceptible to wildfire events.
Fire Investigations
Fire investigations are conducted by four BFD personnel who have received specialized training
in this discipline. Personnel who are trained and certified to conduct fire investigations assume
other duties in the fire prevention division and are called out to investigate fires on a rotational
basis.
Over the four-year period of 2016 through 2019, the fire investigators from the Fire Prevention
Bureau averaged 60 investigations per year. These investigations resulted in multiple arrests for
arson and in seven juveniles being referred to court-sanctioned fire-setter intervention programs.
TABLE 8-2: Fire Investigations Bureau Statistics, 2016–2019
2016 2017 2018 2019
Fires investigated 56 57 59 66
Juvenile interventions/referrals n/a 2 2 3
ISO RATING
The ISO collects data for more than 48,000 communities and fire districts throughout the country.
These data are then analyzed using a proprietary Fire Suppression Rating Schedule (FSRS). This
analysis then results in a PPC (Public Protection Classification) score between 1 and 10 for a
community, with Class 1 representing "superior property fire protection" and Class 10 indicating
that an area does not meet the minimum criteria set by the ISO. In 2013, the revised FSRS was
released; it adds an emphasis on a community's effort to limit loss before an incident occurs (fire
prevention).
Since the 1800s, insurance companies have been involved in one way or another in “rating” fire
departments. As cities grew and buildings became larger and communities more industrialized,
insurance companies sometimes incurred large losses from fires. Much of the time, these losses
were due to inadequate water supplies and ineffective fire suppression capabilities. To help
reduce losses, insurance companies developed criteria to evaluate community fire suppression
capabilities and to quantify the level of fire services provided. Once quantified, insurance
companies used the information (rating) to determine and assign fire insurance rates. The
emphasis then, as now, was primarily to reduce dollar loss from fires. Though improving water
supplies and fire suppression can and does improve life safety, the purpose of rating fire
departments is to adjust insurance rates to lessen insurance company losses.

87
ISO uses data and information provided by each community to derive a Public Protection
Classification (PPC). Community evaluations are performed periodically or when there is reason
to believe there may be a change in the PPC. As it is intended, the PPC is only used to assess a
community’s fire protection—it does not consider other emergencies or important services
provided by the fire department such as EMS, wildfire mitigation, technical rescue, or hazmat
incident response. The ISO acknowledges the use of the PPC is limited to assessing fire
suppression capabilities and that fire departments do many more things to improve public
safety.56
In developing a PPC, the following major categories are evaluated:
■ Emergency Communications: Fire alarm and communication systems, including telephone
systems, telephone lines, staffing, and dispatching systems.
■ Fire Department: The fire department, including equipment, staffing, training, and geographic
distribution of fire companies.
■ Water Supply: The water supply system, including the condition and maintenance of hydrants
and the amount of available water compared to the amount needed to suppress fires.
■ Fire Prevention: Programs that contain plan review; certificate of occupancy inspections;
compliance follow-up; inspection of fire protection equipment; and fire prevention regulations
related to fire lanes on area roads, hazardous material routes, fireworks, barbecue grills, and
wildland-urban interface areas.
■ Public Fire Safety Education Programs: Fire safety education training and programs for schools,
private homes, and buildings with large loss potential or hazardous conditions, and a juvenile
fire-setter intervention program.
Billings was rated ISO Class 3/10 in 2017. The city’s score was 71.96, which is at the lower end of
the Class 3 rating (70.0 to 79.9). Billings received a Split-rating of 3/10. A split rating is applied to
those communities that have service areas in which properties are beyond 1,000 feet from a
creditable water supply (typically a fire hydrant). Billings scored exceptionally well in most areas
of the evaluation. CPSM recognizes the city’s achievement as a Class 3/10 ISO rating as a Best
Practice. Nationwide in 2017, only 3,782 communities were designated at an ISO rating of 3 or
better. The Billings rating places the community in the top 10 percent of those ratings in 2017.
It is also important to note that BFD received good scoring in the areas of fire training, receiving
8.22 points out of 9. In Emergency Communication (911), the review was scored at 8.86 points
out of a possible 10. The water utility system was scored at 30.21 out of a possible 40. In the area
of Company Personnel, BFD received 6.3 points out of a total of 15 points available.
EDUCATION AND TRAINING PROGRAMS
Training is one of the most important functions that a fire department should be performing on a
regular basis. One could even make the argument that training is, in some ways, more important
than emergency responses, because a department that is not well-trained, prepared, and
operationally ready will be unable to effectively and safely fulfill its emergency response
56. Flippin, P., Gaull E., Laun, J., Flicko, R., District of Columbia Fire and Emergency Medical Services Fleet
Management Audit and Assessment (District of Columbia Fire and Emergency Medical Services,
Washington, DC 2013).

88
obligations. A comprehensive, relative, and ongoing training program is absolutely critical to the
fire department’s level of success.
An effective fire department training program must cover all of the essential elements of that
department’s core missions and responsibilities. The program must include an appropriate
combination of technical/classroom training, manipulative or hands-on/practical evolutions,
and training assessment to gauge the effectiveness of these efforts. Most of the training, but
particularly the practical, hands-on training evolutions, should be developed based upon the
department’s own operating procedures while remaining cognizant of widely accepted
practices and standards.
Certain Occupational Safety and Health Administration (OSHA) regulations dictate that
minimum training covering various topics must be completed on an annual basis. This training
covers:
■ A review of the respiratory protection standard, self-contained breathing apparatus (SCBA)
refresher and user competency training, SCBA fit testing (29 CFR 1910.134).
■ Blood Borne Pathogens Training (29 CFR 1910.1030).
■ Hazardous Materials Training (29 CFR 1910.120).
■ Confined Space Training (29 CFR 1910.146).
■ Structural Firefighting Training (29 CFR 1910.156).
Education and training programs help to create the character of a fire service organization.
Agencies that place a real emphasis on their training have a tendency to be more proficient in
carrying out day-to-day duties. The prioritization of training also fosters an image of
professionalism and instills pride in the organization.
The training functions of the BFD are managed by a Training Section Battalion Chief who is
responsible for the development and delivery of all fire and EMS training activities. Training effort
is supported by an Assistant Training Chief and a Logistics Officer. One of the Training Officers, on
a rotational basis, responds to all major incidents to serve as the Safety Officer.
The Training Division handles the majority of all training activities for EMS and coordinates the
delivery of recertification requirements for EMT and paramedic refresher training as specified by
the Montana EMS & Trauma Systems Section requirements. Paramedics must achieve 72 hours of
continuing education training (CEs) every two years. EMTs must achieve 48 CEs to recertify. The
bulk of the EMS continuing education requirements are provided through designated
coursework that is offered both in-house and through outside agencies (ACSL, PALS, ITLS, and
CPR). National Registry allows upwards of 10 hours of online CEs for recertification. BFD utilizes the
on-line training curriculums offered through Target Solutions™ for both fire and EMS training.
Firefighter Recruit Training
Fire service agencies have traditionally trained new firefighters in-house utilizing the NFPA
guidelines. It is very common for smaller agencies, particularly those with a limited number of
position openings, to utilize an on-the-job training process and task-book progression to train and
qualify new employees or members for various assignments. Many municipal and county
organizations (including Billings) have traditionally utilized an internal firefighter recruit training
academy in which employees are hired as “recruit firefighters” or “firefighter trainees” while
undergoing this basic training.

89
Over the years, as the training requirements for firefighter have expanded and additional
subjects have been included in the basic training (EMT, CPR, Hazardous Materials Response,
Wildland Firefighting, Emergency Vehicle Operations, etc.), a number of technical schools and
community colleges have begun to offer this training to enrolled students. Montana State
University has established the MSU Fire Services Training School, which offers both Firefighter I and
Firefighter II training academies.57
BFD currently requires all new firefighter applicants to have obtained Basic EMT training as a
prerequisite for hiring. In addition, BFD is a member of the Montana Firefighter Testing
Consortium, which provides entry firefighter testing (written and practical-CPAT) for prospective
candidates. BFD will typically conduct a single recruit fire academy each year, in March. The
academy is a 12-week curriculum and typically four to six candidates are enrolled. At the
conclusion of the 12-week academy, new firefighters have completed Firefighter-1 training
along with the tactical and operational instruction necessary in the delivery of Fire, EMS and
other areas of emergency service delivery in the Billings system. Upon completion of the fire
academy, firefighters are placed into field assignments under the supervision of a Fire Captain
and a Task Book process is utilized to guide the new firefighter and their supervising officer in the
delivery and assessment of basic firefighter skills. Billings does not require the completion of its full
firefighting training curriculum (Firefighter-2) until 30-months after initial hiring. The Fire
Departments utilizes a 6-month probationary period for new Firefighters, so initial firefighting
training (Firefighter 1 & 2), is not achieved until the probationary period has concluded.
CPSM believes that the 12-week recruit training academy should be modified so that new
firefighters receive both Firefighter 1 & 2 as part of the curriculum. It is also recommended that
this basis training be completed prior to the completion of the Firefighter 6-month probationary
period. CPSM was advised by BFD officials that the 12-week academy could be modified so that
Firefighter 1 & 2 could be included and completed within the existing 12-week academy
structure.
Recommendation: BFD should restructure the format of its 12-week recruit
firefighter training academy and include both Firefighter 1 & 2 as part of this
curriculum. (Recommendation No. 26.)
Skills Assessment
The Training Division develops and distributes a very detailed and comprehensive training
calendar that provides guidance to the individual company officers and Battalion Chiefs
regarding daily and monthly training activities. The department allocates training blocks of 90
minutes for crew members on Mondays, Tuesdays, and Wednesdays. BFD requires 24 hours of fire
training annually for all its line employees. Much of the fire training is conducted online or
through interactive video formats.
CPSM believes it is essential that the training program ensure consistency in the competencies of
its employees so they can perform those activities that are needed to operate successfully in
emergency settings. This requires a comprehensive review of training activities and a more
regimented process in the BFD to ensure that all employees receive consistent updates and
refresher training in those activities that are not regularly performed in day-to-day operations.
Many aspects of the EMS training curriculum require a skills assessment in order to obtain the
necessary continuing education credits required for certification. Fire and other related service
57 https://www.montana.edu/wwwfire/FF1.html, https://www.montana.edu/wwwfire/FF2.html

90
training typically does not include a skills assessment and a recorded scoring to determine
individual proficiency.
Recommendation: The Billings Fire Department should institute written and
practical skills testing as part of the department’s comprehensive fire training
program. (Recommendation No. 27.)
Monitoring and recording training test scores is beneficial from an overall proficiency standpoint.
In addition, training scores should be incorporated into the annual performance appraisal
process for both the employee, the supervisor, and the training staff. In addition, the concept of
adding a testing process to each training evolution adds to the importance, consistency, and
seriousness with which these activities are carried out.
Physical Fitness Evaluation
Employee physical fitness is necessary for fire and EMS personnel to do their jobs effectively while
avoiding injuries. Rigid fitness standards are typically required in many fire departments
throughout the nation. NFPA 1583, Standard on Health-Related Fitness Programs for Fire
Department Members, is a recognized industry standard for monitoring and maintaining
firefighter fitness. BFD does not have a fitness standard for its emergency response personnel.
Though employees are encouraged to maintain appropriate levels of fitness, and current
firefighting job descriptions include language requiring good physical conditioning, a formal
organizational fitness assessment does not exist.
Recommendation: BFD should institute an annual physical fitness evaluation
process for all emergency response personnel, including chief officers.
(Recommendation No. 28.)
BFD requires new firefighters to pass a physical fitness evaluation that is based on the Candidate
Physical Ability Test (CPAT). This testing utilizes a number of firefighter skill components (stair
climb, hose drag, equipment carries, ladder raise, forcible entry, rescue drag, and ceiling pull)
that are completed in a sequential order and as a timed event. BFD should consider the use of a
modified CPAT exam as the annual fitness qualification for all emergency response personnel. In
addition, BFD personnel operate within a wildland environment. Most wildland firefighter
certifications utilize The Pack Test-Work Capacity Testing for Wildland Fire Fighting as an annual
fitness qualification. This may also be considered as an annual fitness requirement for all BFD
personnel.
Annual Medical Evaluations
Closely aligned with the need for firefighter fitness assessment is the need for firefighters to have
an annual medical evaluation to insure employee well-being and health status so they can
safely perform their duties.
Firefighters are susceptible to developing hypertension, diabetes, high cholesterol, and obesity.
According to the NFPA, 43 percent of firefighter deaths are caused by overexertion and stress. In
2017, the Firefighter Cancer Support Network revealed that 61 percent of career firefighter line-
of-duty deaths occurred as a result of cancer from 2002 to 2017. Periodic and directed medical
testing and screening are vital to the well-being of firefighters and are effective in identifying
problems at early stages in order to facilitate treatment. NFPA 1582, Standard on Comprehensive
Occupational Medical Program for Fire Departments, outlines an occupational medical program
for firefighters aimed at reducing health risks and provides guidance for periodic screening and
91
medical evaluations. The following medical testing is recommended under the provisions of
NFPA 1582:
■ Blood analysis.
■ Urinalysis.
■ Pulmonary function test.
■ Chest X-ray (every five years).
■ EKG.
■ Infectious disease screening.
■ Cancer screening.
■ Audiometric exam.
■ Vision testing.
Billings does not conduct annual medical evaluations for its firefighters.
Recommendation: BFD should institute annual medical physicals in
accordance with NFPA 1582 for all emergency response personnel, including
chief officers. (Recommendation No. 29.)
Firefighters may encounter injury and illnesses that are not job related and which can lead to
extended absences and disabilities. Upon returning to work after an off-the-job injury or illness, it
is essential that an employee be evaluated under the criteria established in NFPA 1582.
Injury Prevention
Closely aligned with training and education is employee safety and injury prevention. Typically,
fire department injuries are among the most common among all city employees. The costs
associated with OSHA recordable injuries in terms of medical costs, lost time, and worker’s
compensation insurance are very significant. In most cases line-of-duty injuries for firefighter are
preventable. There is little internal review regarding the causes of these injuries and no effort is
being made to address recurring injuries and implement directed policies to reduce these
occurrences. In our experience we have found that most line-of-duty injuries are a product of
improper lifting or not properly utilizing personal protection and safety equipment.
CPSM believes that the BFD, working in close cooperation with the city’s Risk Management
office, should develop a health and safety program, with a goal of reducing firefighter injuries.
The program should use statistical analysis to isolate the high-frequency injury type and then
build efforts that are aimed at reducing injuries into department training and policy directives.
Recommendation: BFD should institute an Employee Safety and Injury
Avoidance Program aimed reducing the number of line-of-duty injuries and
lost time. (Recommendation No. 30.)
Injury prevention is an organizational objective. From this perspective it is critical that supervisory
personnel, specifically Captains and Battalion Chiefs, must have a more active role in the efforts
to reduce injuries. Though injuries in the fire service are avoided at all costs, there is a very strong
sentiment that when a firefighter is injured in the line of duty, it is viewed with praise, as a sense of
bravery, or heroism. In reality, most fire ground injuries are the result of some failure to follow a
prescribed safety procedure or a lapse in judgment. From this perspective, it is critical that every

92
injury be evaluated on the basis of why it occurred and more importantly, how it could have
been avoided. The supervisor has a critical role in this process. In our estimation, their actions or
more importantly inactions, should be evaluated in determining the cause of the injury.
EMERGENCY MANAGEMENT
Emergency management is the discipline and profession of applying science, technology,
planning, and management to deal with extreme events that can injure or kill large numbers of
people, do extensive damage to property, and disrupt community life. When such events occur
and cause extensive harm, they are called disasters.58
Yellowstone County and its regional partners—the City of Billings, City of Laurel, Town of
Broadview—have jointly created an Emergency Operations Plan (EOP). The EOP is an integrated
plan based on the National Incident Management System; it provides an all-hazards approach
in managing larger emergency incidents. The plan outlines a concept for emergency
operations, assigns roles and responsibilities, and prescribes management and procedures for
the Emergency Operations Center. Yellowstone County has a total area of nearly 2,649 square
miles and a population in 2019 estimated at 161,300. It is the most populous county in Montana.
The EOP provides emergency management coordination, planning, and training activities in a
cooperative effort. This plan is issued in accordance with, and under the provisions of, the
Montana Code Annotate (MCA) 10-3, which establishes the authority for jurisdictions to guide
their operations during a major disaster. The agreement specifies a scope of services that
include the maintenance of the adopted County Emergency Operations Plan, the staffing of
the Yellowstone County Emergency Operations Center, yearly exercises and training,
coordination with public and private agencies, and regular reporting to the County Commission
The EOP is a usable and thorough document that was last updated and distributed in 2019. The
Emergency Operations Center (EOC) provides the forum in which procedures for single-agency
or joint operations are executed, including a description of the site and procedures for initiating,
conducting, and terminating operations. The EOP is designed to work in cooperation with
federal, state, local, and tribal governments. It provides guidance for the development,
implementation, and sustainment of Montana’s emergency management and coordination
efforts.
The EOP is organized to address the following:
■ Organization and Assignment of Responsibilities.
■ Administration and Logistics.
■ Plan Development and Maintenance.
■ Transportation.
■ Communications.
■ Public Works and Engineering.
■ Firefighting.
58. Emergency Management: Principles and Practice for Local Government. Eds. Thomas E. Drabek,
Gerard J. Hoetmer. International City Management Association, 1991. p. xvii

93
■ Emergency Management.
■ Mass Care, Emergency Assistance, Housing and Human Services.
■ Logistics Management and Resource Support.
■ Public Health and Medical Services.
■ Search and Rescue.
■ Oil and Hazardous Material Response.
■ Agricultural and Natural Resources.
■ Energy.
■ Public Safety and Security.
■ Long-Term Community Recovery.
■ External Affairs.
■ Debris Management.
■ Mass Fatalities Management.
While the Yellowstone County EOP and its coordination with the City of Billings is well-designed
and comprehensive in its organization, there appears to be an unrealistic reliance on the limited
capacity of the county’s DES resources. Many of the functional duties are assigned to the
county’s DES staff, which in reality is a single person. In addition, some key organizational
resources are not included in the planning process and the design of its operations. The Billings
Public Schools, Montana State University, BNSF Railroad, Montana Department of Transportation,
the Salvation Army, AMR, and Billings MET Transit, are just some of the key community
organizations and agencies that have not been identified in the planning process nor have they
been assigned to key support functions in the plan of operations. In addition, the public
information process and the establishment of a viable and sufficient Public Call Center has not
been fully planned and established as a key responsibility of the emergency planning effort.
Recommendation: The City of Billings should initiate an effort with the City of
Laurel, the Town of Broadview, and Yellowstone County to establish an
Emergency Management Leadership Team to support planning and
operational assignments in the joint County-Municipal Emergency
Management process. (Recommendation No. 31.)
Since the City of Billings is the largest population and commercial center in Yellowstone County,
it should assume a larger role in the planning efforts and should maintain key representatives in
the emergency management process from within the organization. CPSM believes that the City
of Billings should have a designated City Emergency Manager who is assigned to either the Fire
or Police Department or City Administrator’s Office and who would be responsible for
emergency management planning, and operational and financial coordination, with
Yellowstone County DES. It is also our recommendation that the City’s Emergency Manager
serve as the Alternate County Emergency Manager and be assigned key functional duties when
the county EOC is activated.
Recommendation: The City of Billings should designate a City Emergency
Manager from a key department (Police, Fire, or City Administrator’s Office)
who is responsible for implementing the city’s emergency management

94
planning and operational efforts in cooperation with Yellowstone County.
(Recommendation No. 32.)
The City of Billings has not developed a municipal continuity of operations plan (COOP). It is vital
that each department within the city develop a detailed plan for the continuity of its specific
operations, the succession of leadership, and the preservation of records.
Recommendation: The City of Billings should initiate an effort in which every
city department develops and exercises a Continuity of Operations Plan
(COOP). (Recommendation No. 33.)
A Continuity of Operations Plan details how a particular agency will continue to operate under
adverse conditions including under circumstances where its primary operating locations are no
longer functional or the normal staffing levels have been reduced so that an altered service
model is required. FEMA provides a very functional guide in developing agency-specific COOP
planning documents. (See:
http://www.fema.gov/pdf/about/org/ncp/coop/continuity_plan_federal_d_a.pdf). The Butte /
Silver Bow County COOP document could serve as a model for this planning document.59
An EOC provides the physical setting for coordinating emergency management activities during
activations and training exercises. EOCs must have a design and the space necessary to
facilitate agency interactions and the logical transfer of information. An EOC must be a secure
environment that utilizes multiple technology resources to access information and it must have
the capability of retaining and transferring this information in multiple formats. The EOC must be
a secure structure that can remain operational during power outages and in an inhospitable
environment.
The current EOC for Billings and Yellowstone County is located in the basement of BFD Station 1,
located at 2305 8th Ave. North. The EOC is situated in a series of rooms and open spaces that
were not originally designed for this purpose. There are multiple structural and operational
shortcomings in this facility. An effort should be made to either renovate the space to make it
more functional as an EOP or relocate this key facility to a more functional location.
Recommendation: The City of Billings and Yellowstone County should
conduct an operational and architectural review of the EOC facility and
make immediate plans to either initiate a comprehensive renovation of the
facility or begin an effort to relocate the Joint County-City EOC to a more
functional facility. (Recommendation No. 34.)
The city recently received nearly $13 million from the Federal CARES Act. A portion of these
funds combined with funding provided through Yellowstone County and State Emergency
Preparedness grant programs could be utilized to renovate or relocate the EOC facility.
EMERGENCY COMMUNICATIONS CENTER (911)
The Billings City/County 911 Dispatch Center provides 911 emergency communications for the
Billings Fire Department and is responsible for the dispatching and radio communications
throughout the City of Billings and Yellowstone County. The Center is operated under the
direction of Fire Department’s Administrative Division; it provides dispatching services for the
59. https://www.co.silverbow.mt.us/DocumentCenter/View/4842/Annex--COOP?bidId=

95
Yellowstone County Sherriff’s Office, Logan International Airport-ARFF, 15 rural fire departments,
4 ambulance services, and the city’s animal control services.
The 911 Center Director is very knowledgeable in the field of public safety communications and
understands the advantages and challenges of the next generation of 911 (NextGen911) in the
U.S. She has surrounded herself with a staff that are highly capable and efficient in managing
emergency communications and who have a long working history in the unit.
The Center is staffed 24 hours a day, seven days a week, with a minimum staffing of five
personnel. During peak periods the Center’s staffing will increase to nine positions. Dispatchers
work 10-hour shifts. Peak times are 2:00 p.m. to 10:00 p.m. During major incidents, it is common
practice for additional personnel to be brought in to assist in operations. On major events, a
dispatcher will be assigned specifically to the incident. All dispatchers are cross-trained and can
take up any position in the Center, be it fire, law enforcement, or as a telephone call taker. Initial
training for dispatchers includes 16 weeks of combined classroom and supervised positional
training for the various dispatch assignments (call taker, police, and fire). All dispatch personnel
receive Association of Public Safety Communications Officials (APCO) 911 certification.
All voice and radio transmissions are recorded. The Center uses a Phase II triangulation system to
identify the location of cell phone calls that are received. All critical dispatch equipment is on
an uninterrupted power supply (UPS). The Center is fully backed up with an auxiliary generator
that is tested monthly; however, an alternative site in case of major outages has not been
established and exercises to practice a transfer of operations have not been attempted.
Emergency Medical Dispatching (EMD) is not being done at the Billings Center. When a call is
identified to be EMS-related, the Center does not determine the call severity and then alter
response protocols on the basis of this determination. Subsequently, BFD units are responding
with lights and sirens to most incidents. BFD has empowered its officers to modify their mode of
response; however, when or if the response mode is altered this information is not captured in
the response time calculations.
In discussions with both the department’s leadership and the 911 Center’s manager, we found
that an effort is underway to institute 911 Call Screening and Dispatch Call Prioritization. In
Section 5 of this report, CPSM recommended that this initiative be pursued.

96
SECTION 9. DATA ANALYSIS
This data analysis examines all calls for service between January 1, 2019, and January 1, 2020, as
recorded in the BFD’s computer-aided dispatch (CAD) system and National Fire Incident
Reporting System (NFIRS).
This analysis is made up of four parts. The first part focuses on call types and dispatches. The
second part explores the time spent and the workload of individual units. The third part presents
an analysis of the busiest hours in the year studied. The fourth and final part provide a response
time analysis of BFD units.
During the year covered by this study, the Billings Fire Department provided life-safety services to
about 110,000 city residents within a 43 square-mile city area, and as well served residents under
a contractual agreement with Yellowstone County in the Billings Urban Fire Service Area (BUFSA),
which is an additional 47 square miles. In 2019, the BFD staff was composed of 124 personnel
operating out of seven fire stations. The department utilizes seven frontline engines and three
reserve engines, six brush trucks, a frontline ladder truck, a Haz-Mat unit, a rescue unit, and two
tenders.
During the study period, the Billings Fire Department responded to 15,675 calls, of which
53 percent were EMS calls. The total combined workload (deployed time) for BFD units was
6,356.7 hours. When responding to calls within the city, the BPD’s average dispatch time was
1.6 minutes and the average total response time was 6.9 minutes. The 90th percentile dispatch
time was 2.9 minutes and the 90th percentile total response time was 10.4 minutes. When
responding to calls in BUFSA, the BPD’s average dispatch time was 1.6 minutes and the average
total response time was 10.2 minutes. The 90th percentile dispatch time was 3.1 minutes and the
90th percentile total response time was 14.6 minutes;
METHODOLOGY
In this report, CPSM analyzes calls and runs. A call is an emergency service request or incident. A
run is a dispatch of a unit (i.e., a unit responding to a call). Thus, a call may include multiple runs.
We received CAD data and NFIRS data for the Billings Fire Department. We first matched the
NFIRS and CAD data based on incident numbers provided. Then, we classified the calls in a
series of steps. We first used the NFIRS incident type to identify canceled calls and to assign EMS,
motor vehicle accident (MVA), and fire category call types. EMS calls were then assigned
detailed categories based on their EMS Clawson codes.
We received records for 16,402 calls in 2019. We removed 727 calls for various reasons. Based
upon their call type descriptions, 433 test calls were removed. An additional 55 calls that lacked
a responding BFD unit were removed. Finally, we removed all runs that did not have at least an
en route or an arrival time. This led us to exclude another 237 calls. In addition, two calls involved
only administrative units. The work associated with these calls is included in the analysis of
additional personnel in Attachment II.
In this report, canceled and mutual aid calls are included in all analyses other than the response
time analyses.
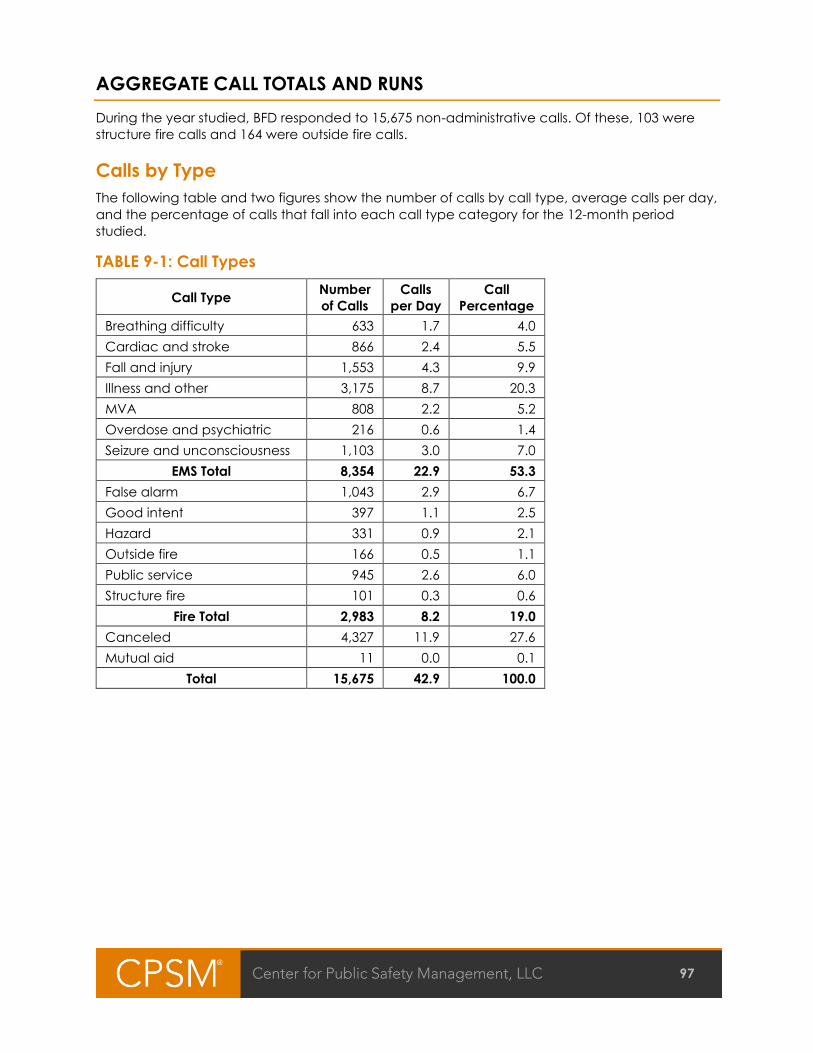
97
AGGREGATE CALL TOTALS AND RUNS
During the year studied, BFD responded to 15,675 non-administrative calls. Of these, 103 were
structure fire calls and 164 were outside fire calls.
Calls by Type
The following table and two figures show the number of calls by call type, average calls per day,
and the percentage of calls that fall into each call type category for the 12-month period
studied.
TABLE 9-1: Call Types
Call Type Number
of Calls
Calls
per Day
Call
Percentage
Breathing difficulty 633 1.7 4.0
Cardiac and stroke 866 2.4 5.5
Fall and injury 1,553 4.3 9.9
Illness and other 3,175 8.7 20.3
MVA 808 2.2 5.2
Overdose and psychiatric 216 0.6 1.4
Seizure and unconsciousness 1,103 3.0 7.0
EMS Total 8,354 22.9 53.3
False alarm 1,043 2.9 6.7
Good intent 397 1.1 2.5
Hazard 331 0.9 2.1
Outside fire 166 0.5 1.1
Public service 945 2.6 6.0
Structure fire 101 0.3 0.6
Fire Total 2,983 8.2 19.0
Canceled 4,327 11.9 27.6
Mutual aid 11 0.0 0.1
Total 15,675 42.9 100.0

98
FIGURE 9-1: EMS Calls by Type
FIGURE 9-2: Fire Calls by Type

99
Observations:
Overall
■ The department received an average of 42.9 calls per day, including 11.9 canceled calls
(28 percent of all calls) and less than 0.1 mutual aid call.
EMS
■ EMS calls for the year totaled 8,354 (53 percent of all calls), an average of 22.9 calls per day.
■ Illness and other calls were the largest category of EMS calls at 38 percent of EMS calls, an
average of 8.7 calls per day.
■ Cardiac and stroke calls made up 10 percent of EMS calls, an average of 2.4 calls per day.
■ Motor vehicle accidents made up 10 percent of EMS calls, an average of 2.2 calls per day.
Fire
■ Fire calls for the year totaled 2,983 (19 percent of all calls), an average of 8.2 calls per day.
■ False alarm calls were the largest category of fire calls at 35 percent of fire calls, an average
of 2.9 calls per day.
■ Structure and outside fire calls combined made up 9 percent of fire calls, an average of
0.7 calls per day, or about one call per day.

100
Calls by Type and Duration
The following table shows the duration of calls by type using four duration categories: less than
30 minutes, 30 minutes to one hour, one to two hours, and more than two hours.
TABLE 9-2: Calls by Type and Duration
Call Type Less than
30 Minutes
30 Minutes
to One Hour
One to
Two Hours
More Than
Two Hours Total
Breathing difficulty 550 72 11 0 633
Cardiac and stroke 722 120 23 1 866
Fall and injury 1,320 212 17 4 1,553
Illness and other 2,800 330 37 8 3,175
MVA 526 222 48 12 808
Overdose and psychiatric 168 45 3 0 216
Seizure and unconsciousness 931 148 23 1 1,103
EMS Total 7,017 1,149 162 26 8,354
False alarm 939 92 11 1 1,043
Good intent 342 39 13 3 397
Hazard 193 89 33 16 331
Outside fire 104 38 19 5 166
Public service 846 81 12 6 945
Structure fire 30 22 21 28 101
Fire Total 2,454 361 109 59 2,983
Canceled 4,233 81 9 4 4,327
Mutual aid 0 2 1 8 11
Total 13,704 1,593 281 97 15,675

101
Observations:
EMS
■ On average, there were 0.5 EMS calls per day that lasted more than one hour.
■ A total of 8,166 EMS calls (98 percent) lasted less than one hour, 162 EMS calls (2 percent)
lasted one to two hours, and 26 EMS calls (less than1 percent) lasted two or more hours.
■ A total of 842 cardiac and stroke calls (97 percent) lasted less than one hour, 23 cardiac and
stroke calls (3 percent) lasted one to two hours, and one cardiac and stroke call (less than
1 percent) lasted two or more hours.
■ A total of 748 motor vehicle accidents (93 percent) lasted less than one hour, 48 motor vehicle
accidents (6 percent) lasted one to two hours, and 12 motor vehicle accidents (1 percent)
lasted two or more hours.
Fire
■ On average, there were 0.5 fire calls per day that lasted more than one hour.
■ A total of 2,815 fire calls (94 percent) lasted less than one hour, 109 fire calls (4 percent) lasted
one to two hours, and 59 fire calls (2 percent) lasted two or more hours.
■ A total of 1,031 false alarm calls (99 percent) lasted less than one hour, 11 false alarm calls
(1 percent) lasted one to two hours, and one false alarm call (less than 1 percent) lasted two
or more hours.
■ A total of 142 outside fire calls (86 percent) lasted less than one hour, 19 outside fire calls
(11 percent) lasted one to two hours, and 5 outside fire calls (3 percent) lasted two or more
hours.
■ A total of 52 structure fire calls (51 percent) lasted less than one hour, 21 structure fire calls
(21 percent) lasted one to two hours, and 28 structure fire calls (28 percent) lasted two or
more hours.
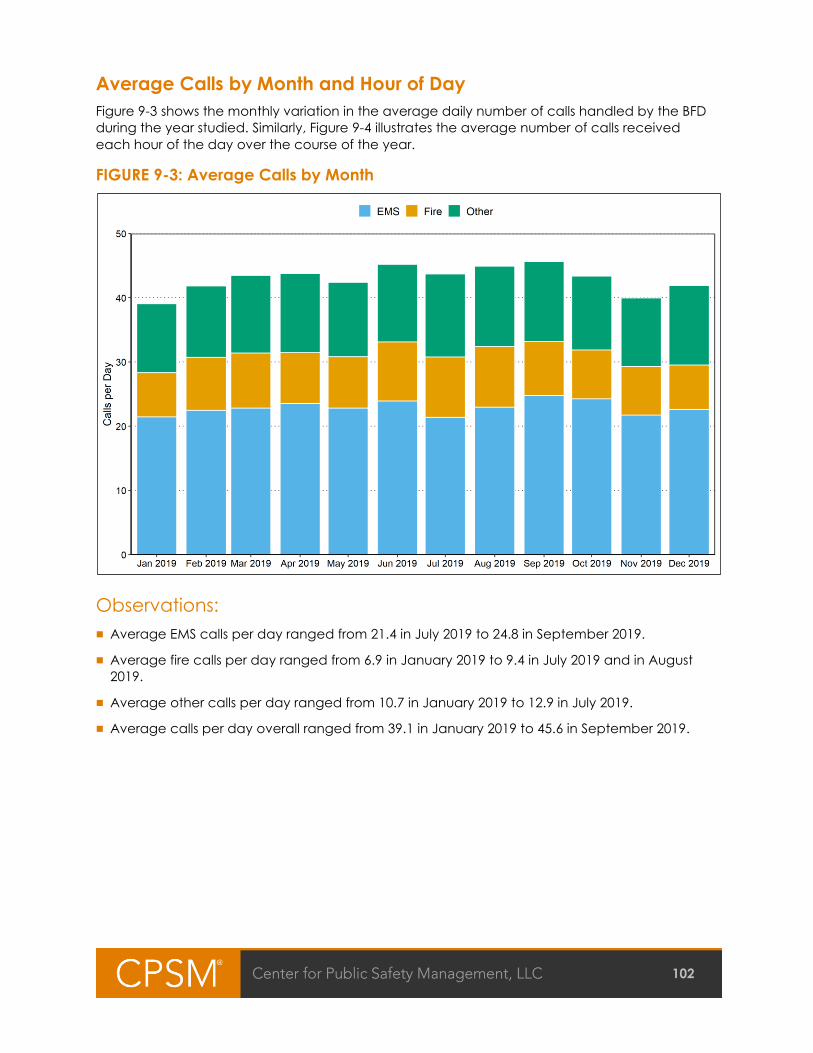
102
Average Calls by Month and Hour of Day
Figure 9-3 shows the monthly variation in the average daily number of calls handled by the BFD
during the year studied. Similarly, Figure 9-4 illustrates the average number of calls received
each hour of the day over the course of the year.
FIGURE 9-3: Average Calls by Month
Observations:
■ Average EMS calls per day ranged from 21.4 in July 2019 to 24.8 in September 2019.
■ Average fire calls per day ranged from 6.9 in January 2019 to 9.4 in July 2019 and in August
2019.
■ Average other calls per day ranged from 10.7 in January 2019 to 12.9 in July 2019.
■ Average calls per day overall ranged from 39.1 in January 2019 to 45.6 in September 2019.

103
FIGURE 9-4: Calls by Hour of Day
Observations:
■ Average EMS calls per hour ranged from 0.4 between 4:00 a.m. and 5:00 a.m. to 1.4 between
5:00 p.m. and 6:00 p.m.
■ Average fire calls per hour ranged from 0.1 between 4:00 a.m. and 5:00 a.m. to 0.5 between
5:00 p.m. and 6:00 p.m.
■ Average other calls per hour ranged from 0.2 between 6:00 a.m. and 7:00 a.m. to
0.7 between 6:00 p.m. and 7:00 p.m.
■ Average calls per hour overall ranged from 0.8 between 4:00 a.m. and 5:00 a.m. to
2.5 between 5:00 p.m. and 6:00 p.m.
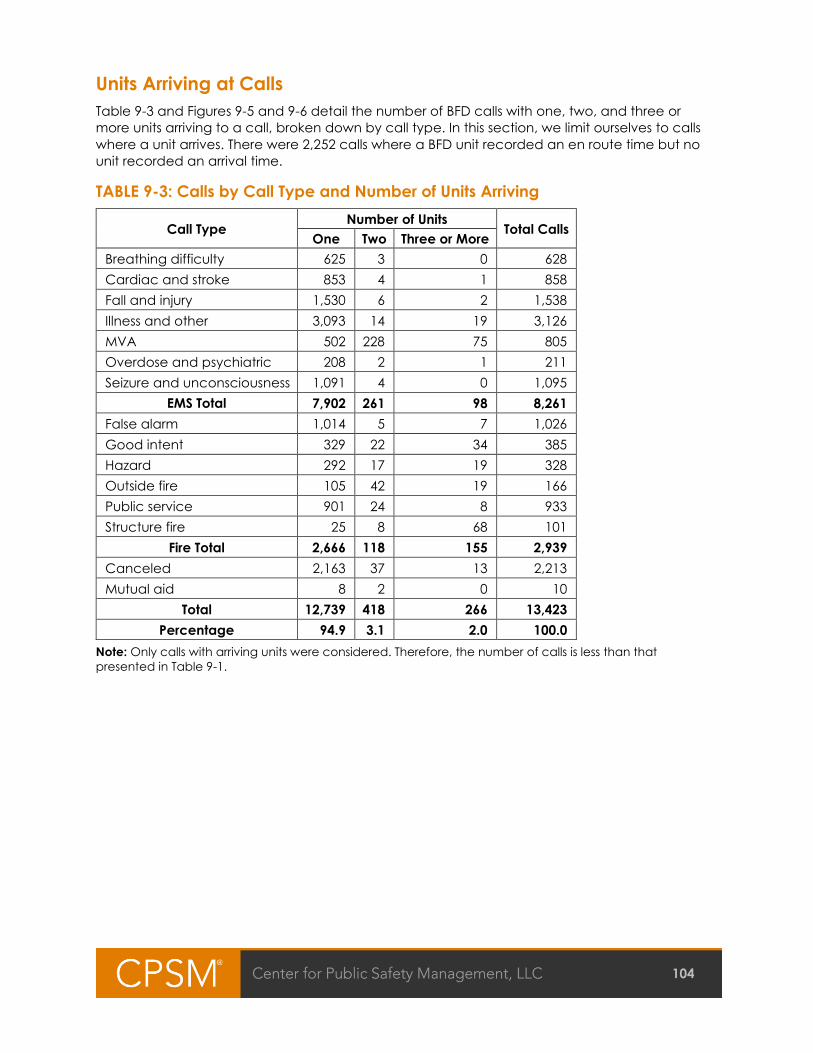
104
Units Arriving at Calls
Table 9-3 and Figures 9-5 and 9-6 detail the number of BFD calls with one, two, and three or
more units arriving to a call, broken down by call type. In this section, we limit ourselves to calls
where a unit arrives. There were 2,252 calls where a BFD unit recorded an en route time but no
unit recorded an arrival time.
TABLE 9-3: Calls by Call Type and Number of Units Arriving
Call Type Number of Units
Total Calls One Two Three or More
Breathing difficulty 625 3 0 628
Cardiac and stroke 853 4 1 858
Fall and injury 1,530 6 2 1,538
Illness and other 3,093 14 19 3,126
MVA 502 228 75 805
Overdose and psychiatric 208 2 1 211
Seizure and unconsciousness 1,091 4 0 1,095
EMS Total 7,902 261 98 8,261
False alarm 1,014 5 7 1,026
Good intent 329 22 34 385
Hazard 292 17 19 328
Outside fire 105 42 19 166
Public service 901 24 8 933
Structure fire 25 8 68 101
Fire Total 2,666 118 155 2,939
Canceled 2,163 37 13 2,213
Mutual aid 8 2 0 10
Total 12,739 418 266 13,423
Percentage 94.9 3.1 2.0 100.0
Note: Only calls with arriving units were considered. Therefore, the number of calls is less than that
presented in Table 9-1.

105
FIGURE 9-5: Calls by Number of Units Arriving – EMS
FIGURE 9-6: Calls by Number of Units Arriving – Fire

106
Observations:
Overall
■ On average, 1.1 units arrived at all calls; for 95 percent of calls only one unit arrived.
■ Overall, three or more units arrived at 2 percent of calls.
EMS
■ On average, 1.1 units arrived per EMS call.
■ For EMS calls, one unit arrived 96 percent of the time, two units arrived 3 percent of the time,
and three or more units arrived 1 percent of the time.
Fire
■ On average, 1.2 units arrived per fire call.
■ For fire calls, one unit arrived 91 percent of the time, two units arrived 4 percent of the time,
and three or more units arrived 5 percent of the time.
■ For outside fire calls, three or more units arrived 11 percent of the time.
■ For structure fire calls, three or more units arrived 67 percent of the time.

107
WORKLOAD: RUNS AND TOTAL TIME SPENT
The workload of each unit is measured in two ways: runs and deployed time. The deployed time
of a run is measured from the time a unit is dispatched through the time the unit is cleared.
Because multiple units respond to some calls, there are more runs than calls and the average
deployed time per run varies from the total duration of calls.
Runs and Deployed Time – All Units
Deployed time, also referred to as deployed hours, is the total deployment time of all units
deployed on all runs. Table 9-4 shows the total deployed time, both overall and broken down by
type of run, for BFD units during the year studied. Table 9-5 and Figure 9-7 present the average
deployed minutes by hour of day.
TABLE 9-4: Annual Runs and Deployed Time by Run Type
Call Type
Deployed
Minutes
per Run
Annual
Hours
Percent
of Total
Hours
Deployed
Minutes
per Day
Annual
Runs
Runs
per Day
Breathing difficulty 21.0 228.2 3.6 37.5 651 1.8
Cardiac and stroke 22.3 337.3 5.3 55.5 906 2.5
Fall and injury 21.8 592.0 9.3 97.3 1,628 4.5
Illness and other 21.4 1,198.8 18.9 197.1 3,363 9.2
MVA 21.4 644.5 10.1 105.9 1,806 4.9
Overdose and psychiatric 22.9 88.2 1.4 14.5 231 0.6
Seizure and unconsciousness 22.1 421.2 6.6 69.2 1,146 3.1
EMS Total 21.6 3,510.2 55.2 577.0 9,731 26.7
False alarm 15.7 292.2 4.6 48.0 1,120 3.1
Good intent 19.4 235.9 3.7 38.8 731 2.0
Hazard 30.4 258.7 4.1 42.5 510 1.4
Outside fire 29.6 172.9 2.7 28.4 351 1.0
Public service 20.6 366.0 5.8 60.2 1,068 2.9
Structure fire 64.2 616.9 9.7 101.4 577 1.6
Fire Total 26.8 1,942.7 30.6 319.3 4,357 11.9
Canceled 10.4 827.0 13.0 136.0 4,776 13.1
Mutual aid 270.9 76.7 1.2 12.6 17 0.0
Other Total 11.3 903.8 14.2 148.6 4,793 13.1
Total 20.2 6,356.7 100.0 1,044.9 18,881 51.7

108
Observations:
Overall
■ Total deployed time for the year was 6,356.7 hours. The daily average was 17.4 hours for all
units combined.
■ There were 18,881 runs, including 4,776 runs dispatched for canceled calls and 17 runs
dispatched for mutual aid calls. The daily average was 51.7 runs.
EMS
■ EMS runs accounted for 55 percent of the total workload.
■ The average deployed time for EMS runs was 21.6 minutes. The deployed time for all EMS runs
averaged 9.6 hours per day.
Fire
■ Fire runs accounted for 31 percent of the total workload.
■ The average deployed time for fire runs was 26.8 minutes. The deployed time for all fire runs
averaged 5.3 hours per day.
■ There were 928 runs for structure and outside fire calls combined, with a total workload of
789.8 hours. This accounted for 12 percent of the total workload.
■ The average deployed time for outside fire runs was 29.6 minutes per run, and the average
deployed time for structure fire runs was 64.2 minutes per run.

109
TABLE 9-5: Average Deployed Minutes by Hour of Day
Hour EMS Fire Other Total
0 16.8 10.1 6.7 33.7
1 14.5 11.1 6.7 32.2
2 13.1 10.1 5.2 28.4
3 11.4 13.0 3.8 28.2
4 10.2 10.8 3.3 24.3
5 10.9 9.0 3.7 23.6
6 12.5 8.6 2.8 24.0
7 17.6 9.9 3.3 30.7
8 25.6 11.2 4.0 40.7
9 27.2 11.6 4.6 43.4
10 25.4 13.5 6.9 45.9
11 29.3 17.0 6.6 52.8
12 33.8 17.6 5.9 57.3
13 32.3 17.3 7.5 57.1
14 32.5 17.2 7.4 57.1
15 31.4 17.3 8.8 57.5
16 32.8 18.1 8.0 58.9
17 39.3 17.4 7.7 64.4
18 33.3 13.6 8.6 55.5
19 32.3 13.6 7.6 53.5
20 24.7 14.2 7.6 46.5
21 27.8 16.6 8.1 52.5
22 24.7 12.1 7.0 43.8
23 17.7 8.6 6.7 33.0
Daily Avg. 577.2 319.4 148.5 1,045.1

110
FIGURE 9-7: Average Deployed Minutes by Hour of Day
Observations:
■ Hourly deployed time was highest during the day from noon to 6:00 p.m., averaging between
57 minutes and 64 minutes.
■ Average deployed time peaked between 5:00 p.m. and 6:00 p.m., averaging 64 minutes.
■ Average deployed time was lowest between 3:00 a.m. and 6:00 a.m., averaging 24 minutes.

111
Workload by Location
Table 9-6 breaks down the workload of BFD by location of the call. Table 9-7 provides further
detail on the workload associated with structure and outside fires calls, also broken down by
location.
TABLE 9-6: Annual Workload by Call Location
Location Calls
Percent
Annual
Calls
Runs
Runs
Per
Day
Deployed
Minutes
Per Run
Annual
Hours
Pct.
Annual
Work
Deployed
Minutes
Per Day
Billings 14,889 95.0 17,671 48.4 19.5 5,741.2 90.3 943.8
BUFSA 773 4.9 1,191 3.3 26.8 531.3 8.4 87.3
Other 13 0.1 19 0.1 265.8 84.2 1.3 13.8
Total 15,675 100.0 18,881 51.7 20.2 6,356.7 100.0 1,044.9
Note: *The 13 other calls include five calls in Shepherd, two calls in Huntley, two calls in Molt, and one call
each in Broadview, Park City, Pompeys Pillar, and Worden, respectively.
TABLE 9-7: Runs for Structure and Outside Fires by Call Location
Location Structure
Fire Runs
Structure Fires
Deployed
Min. per Run
Outside
Fire
Runs
Outside Fires
Deployed
Min. per Run
Total Hours
for Structure
and Outside
Fires
Pct. of
Structure and
Outside Fire
Workload
Billings 526 62.6 259 27.5 668.0 82.0
BUFSA 51 79.8 92 35.2 121.8 15.0
Other 0 NA 7 207.9 24.3 3.0
Total 577 64.2 358 33.0 814.1 100.0
Note: The 7 other outside fire runs include four to Shepherd, two to Huntley, and one to Park City.
Observations:
Billings
■ Total deployed time for the year was 5,741.2 hours, or 90 percent of the total annual workload.
The daily average was 15.7 hours for all units combined.
■ There were 17,671 runs, including 4,510 runs dispatched for canceled calls. The daily average
was 48.4 runs.
BUFSA – Billings Urban Fire Service Area
■ Total deployed time for the year was 531.3 hours, or 8 percent of the total annual workload.
The daily average was 87.3 minutes for all units combined.
■ There were 1,191 runs, including 264 runs dispatched for canceled calls. The daily average was
3.3 runs.
Other
■ Total deployed time for the year was 84.2 hours, or 1 percent of the total annual workload.
■ There were 19 runs, including 2 runs dispatched for canceled calls and 17 runs dispatched for
mutual aid calls.

112
Workload by Unit
Table 9-8 provides a summary of each unit’s workload overall. Tables 9-9 and 9-10 provide a
more detailed view of workload, showing each unit’s runs broken out by run type (Table 9-9) and
the resulting daily average deployed time by run type (Table 9-10).
TABLE 9-8: Call Workload by Unit
Station Unit Unit Type
Deployed
Minutes
per Run
Total
Hours
Deployed
Minutes
per Day
Total
Runs
Runs
per
Day
1
BC BC* 34.0 261.9 43.0 462 1.3
BR01 Brush 150.1 57.6 9.5 23 0.1
BR2297 Brush 151.7 30.3 5.0 12 0.0
EN01 Engine 16.2 914.9 150.4 3,387 9.3
EN11 Engine** 73.7 41.8 6.9 34 0.1
TN01 Tender 91.5 18.3 3.0 12 0.0
TR01 Ladder 21.1 331.9 54.6 944 2.6
Total 20.4 1,656.6 272.3 4,874 13.4
2
BC2 BC* 52.5 7.9 1.3 9 0.0
EN02 Engine 17.3 600.5 98.7 2,079 5.7
RES2 Rescue 22.1 79.8 13.1 217 0.6
Total 17.9 688.1 113.1 2,305 6.3
3
EN03 Engine 18.2 801.0 131.7 2,647 7.3
EN33 Engine** 15.1 3.8 0.6 15 0.0
Total 18.1 804.7 132.3 2,662 7.3
4
BR04 Brush 89.4 8.9 1.5 6 0.0
EN04 Engine 20.0 827.3 136.0 2,477 6.8
MAC4 MAC 86.4 7.2 1.2 5 0.0
Total 20.3 843.5 138.7 2,488 6.8
5
BR05 Brush 27.5 7.8 1.3 17 0.0
EN05 Engine 22.1 1,016.8 167.1 2,755 7.5
EN55 Engine** 70.0 5.8 1.0 5 0.0
HAM5 Hazmat 101.1 11.8 1.9 7 0.0
TN05 Tender 37.5 7.5 1.2 12 0.0
Total 22.5 1,049.7 172.6 2,796 7.7
6
BR06 Brush 20.9 6.3 1.0 18 0.0
EN06 Engine 20.0 740.8 121.8 2,220 6.1
Total 20.0 747.1 122.8 2,238 6.1
7
BR07 Brush 32.2 11.8 1.9 22 0.1
EN07 Engine 22.3 555.2 91.3 1,496 4.1
Total 22.4 567.0 93.2 1,518 4.2
Total 20.2 6,356.7 1,044.9 18,881 51.7
Note: *Battalion chief; **Reserve engine.

113
TABLE 9-9: Total Annual Runs by Run Type and Unit
Station Unit Unit Type EMS Structure
Fire
Outside
Fire
Other
Fire Canceled
Mutual
Aid Total
1
BC BC* 184 87 21 123 42 5 462
BR01 Brush 3 2 6 4 5 3 23
BR2297 Brush 1 0 1 2 4 4 12
EN01 Engine 1,697 66 47 496 1,081 0 3,387
EN11 Engine** 14 8 1 5 6 0 34
TN01 Tender 0 5 2 4 1 0 12
TR01 Ladder 397 83 25 219 220 0 944
Total 2,296 251 103 853 1,359 12 4,874
2
BC2 BC* 7 1 0 1 0 0 9
EN02 Engine 1,128 61 46 282 562 0 2,079
RES2 Rescue 190 0 2 10 14 1 217
Total 1,325 62 48 293 576 1 2,305
3
EN03 Engine 1,298 61 36 547 705 0 2,647
EN33 Engine** 9 1 0 2 3 0 15
Total 1,307 62 36 549 708 0 2,662
4
BR04 Brush 0 2 1 3 0 0 6
EN04 Engine 1,238 78 56 393 712 0 2,477
MAC4 MAC 0 3 0 1 1 0 5
Total 1,238 83 57 397 713 0 2,488
5
BR05 Brush 3 0 5 6 3 0 17
EN05 Engine 1,527 53 46 583 546 0 2,755
EN55 Engine* 3 1 0 0 1 0 5
HAM5 Hazmat 2 0 0 5 0 0 7
TN05 Tender 1 5 3 1 2 0 12
Total 1,536 59 54 595 552 0 2,796
6
BR06 Brush 3 2 3 8 2 0 18
EN06 Engine 1,229 25 17 414 534 1 2,220
Total 1,232 27 20 422 536 1 2,238
7
BR07 Brush 0 0 7 5 9 1 22
EN07 Engine 797 33 26 315 323 2 1,496
Total 797 33 33 320 332 3 1,518
Total 9,731 577 351 3,429 4,776 17 18,881
Note: *Battalion chief; **Reserve engine. The ‘Other Fire’ column includes false alarm, good intent, hazard,
and public service calls.
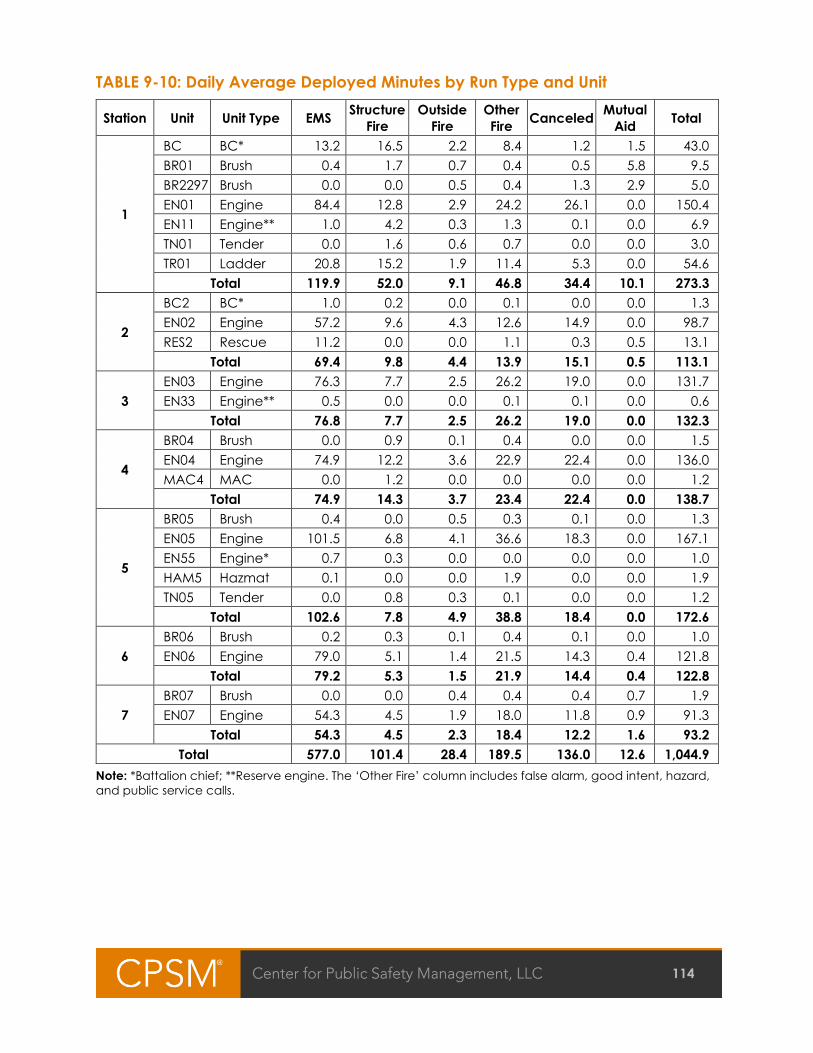
114
TABLE 9-10: Daily Average Deployed Minutes by Run Type and Unit
Station Unit Unit Type EMS Structure
Fire
Outside
Fire
Other
Fire Canceled
Mutual
Aid Total
1
BC BC* 13.2 16.5 2.2 8.4 1.2 1.5 43.0
BR01 Brush 0.4 1.7 0.7 0.4 0.5 5.8 9.5
BR2297 Brush 0.0 0.0 0.5 0.4 1.3 2.9 5.0
EN01 Engine 84.4 12.8 2.9 24.2 26.1 0.0 150.4
EN11 Engine** 1.0 4.2 0.3 1.3 0.1 0.0 6.9
TN01 Tender 0.0 1.6 0.6 0.7 0.0 0.0 3.0
TR01 Ladder 20.8 15.2 1.9 11.4 5.3 0.0 54.6
Total 119.9 52.0 9.1 46.8 34.4 10.1 273.3
2
BC2 BC* 1.0 0.2 0.0 0.1 0.0 0.0 1.3
EN02 Engine 57.2 9.6 4.3 12.6 14.9 0.0 98.7
RES2 Rescue 11.2 0.0 0.0 1.1 0.3 0.5 13.1
Total 69.4 9.8 4.4 13.9 15.1 0.5 113.1
3
EN03 Engine 76.3 7.7 2.5 26.2 19.0 0.0 131.7
EN33 Engine** 0.5 0.0 0.0 0.1 0.1 0.0 0.6
Total 76.8 7.7 2.5 26.2 19.0 0.0 132.3
4
BR04 Brush 0.0 0.9 0.1 0.4 0.0 0.0 1.5
EN04 Engine 74.9 12.2 3.6 22.9 22.4 0.0 136.0
MAC4 MAC 0.0 1.2 0.0 0.0 0.0 0.0 1.2
Total 74.9 14.3 3.7 23.4 22.4 0.0 138.7
5
BR05 Brush 0.4 0.0 0.5 0.3 0.1 0.0 1.3
EN05 Engine 101.5 6.8 4.1 36.6 18.3 0.0 167.1
EN55 Engine* 0.7 0.3 0.0 0.0 0.0 0.0 1.0
HAM5 Hazmat 0.1 0.0 0.0 1.9 0.0 0.0 1.9
TN05 Tender 0.0 0.8 0.3 0.1 0.0 0.0 1.2
Total 102.6 7.8 4.9 38.8 18.4 0.0 172.6
6
BR06 Brush 0.2 0.3 0.1 0.4 0.1 0.0 1.0
EN06 Engine 79.0 5.1 1.4 21.5 14.3 0.4 121.8
Total 79.2 5.3 1.5 21.9 14.4 0.4 122.8
7
BR07 Brush 0.0 0.0 0.4 0.4 0.4 0.7 1.9
EN07 Engine 54.3 4.5 1.9 18.0 11.8 0.9 91.3
Total 54.3 4.5 2.3 18.4 12.2 1.6 93.2
Total 577.0 101.4 28.4 189.5 136.0 12.6 1,044.9
Note: *Battalion chief; **Reserve engine. The ‘Other Fire’ column includes false alarm, good intent, hazard,
and public service calls.

115
Observations:
■ At the station level, Station 1 made the most runs (4,874 or an average of 13.4 runs per day)
and had the highest total annual deployed time (1,656.6 hours or an average of 4.5 hours per
day).
□ EMS calls accounted for 47 percent of runs and 44 percent of total deployed time.
□ Structure and outside fire calls accounted for 7 percent of runs and 22 percent of total
deployed time.
■ At the station level, Station 5 made the second most runs (2,796 or an average of 7.7 runs per
day) and had the second highest total annual deployed time (1,049.7 hours or an average of
2.9 hours per day).
□ EMS calls accounted for 55 percent of runs and 59 percent of total deployed time.
□ Structure and outside fire calls accounted for 4 percent of runs and 7 percent of total
deployed time.
■ At the unit level, Engine EN01 made the most runs (3,387 or an average of 9.3 runs per day)
and had the second highest total annual deployed time (914.9 hours or an average of
2.5 hours per day).
□ EMS calls accounted for 50 percent of runs and 56 percent of total deployed time.
□ Structure and outside fire calls accounted for 3 percent of runs and 10 percent of total
deployed time.
■ At the unit level, Engine EN05 made the second most runs (2,755 or an average of 7.5 runs per
day) and had the highest total annual deployed time (1,016.8 hours or an average of
2.8 hours per day).
□ EMS calls accounted for 55 percent of runs and 61 percent of total deployed time.
□ Structure and outside fire calls accounted for 4 percent of runs and 6 percent of total
deployed time.

116
ANALYSIS OF BUSIEST HOURS
There is significant variability in the number of calls from hour to hour. One special concern
relates to the resources available for hours with the heaviest workload. We tabulated the data
for each of the 8,760 hours in the year. Table 9-11 shows the number of hours in the year in which
there were zero to four or more calls during the hour. Table 9-12 shows the 10 one-hour intervals
which had the most calls during the year. Table 9-13 examines the number of times a call within
a station’s first due area overlapped with another call within the same area. Table 9-14 examines
the availability of a unit at a station to respond to calls within its first due area.
TABLE 9-11: Frequency Distribution of the Number of Calls
Calls in an Hour Frequency Percentage
0 1,803 20.6
1 2,471 28.2
2 2,096 23.9
3 1,290 14.7
4 633 7.2
5 293 3.3
6 115 1.3
7+ 59 0.7
Total 8,760 100.0
TABLE 9-12: Top 10 Hours with the Most Calls Received
Hour Number
of Calls
Number
of Runs
Deployed
Hours
8/11/2019, 7:00 p.m. to 8:00 p.m. 15 27 10.6
4/18/2019, noon to 1:00 p.m. 15 20 3.5
8/22/2019, 7:00 p.m. to 8:00 p.m. 11 13 4.7
3/27/2019, 7:00 p.m. to 8:00 p.m. 10 11 3.0
10/24/2019, 5:00 p.m. to 6:00 p.m. 9 16 4.1
7/13/2019, 3:00 p.m. to 4:00 p.m. 9 14 5.3
8/2/2019, 6:00 p.m. to 7:00 p.m. 9 14 4.8
5/24/2019, 4:00 p.m. to 5:00 p.m. 9 14 3.2
1/23/2019, 3:00 p.m. to 4:00 p.m. 9 12 3.9
11/8/2019, 5:00 p.m. to 6:00 p.m. 8 15 4.1
Note: Total deployed hours is a measure of the total time spent responding to calls received in the hour,
and which may extend into the next hour or hours. The number of runs and deployed hours only includes
BFD units.

117
TABLE 9-13: Frequency of Overlapping Calls
Station Scenario Number
of Calls
Percent of
All Calls
Total
Hours
1
No overlapped call 2,982 91.0 761.2
Overlapped with one call 276 8.4 40.7
Overlapped with two calls 20 0.6 2.2
2
No overlapped call 1,746 94.4 532.0
Overlapped with one call 99 5.4 28.6
Overlapped with two calls 5 0.3 0.7
3
No overlapped call 1,949 92.3 630.2
Overlapped with one call 153 7.2 31.3
Overlapped with two calls 8 0.4 0.8
Overlapped with three calls 1 0.0 0.3
4
No overlapped call 1,970 91.5 670.9
Overlapped with one call 170 7.9 29.8
Overlapped with two calls 13 0.6 1.8
5
No overlapped call 2,413 88.5 883.6
Overlapped with one call 286 10.5 53.7
Overlapped with two calls 26 1.0 4.0
Overlapped with three calls 1 0.0 0.0
Overlapped with four calls 1 0.0 0.0
6
No overlapped call 2,174 92.5 728.9
Overlapped with one call 165 7.0 31.6
Overlapped with two calls 11 0.5 2.0
7
No overlapped call 1,088 91.2 1,332.3
Overlapped with one call 99 8.3 29.2
Overlapped with two calls 6 0.5 1.0

118
Table 9-14 focuses on each station’s availability to respond to calls within its first due area. At the
same time, it focuses on calls where a BFD unit eventually arrived and ignores calls where no unit
arrived. Out of 15,662 calls within BFD’s jurisdiction, there were 2,250 calls where a BFD unit went
en route but no unit arrived. For this reason, the individual rows and the total in Table 9-14’s
second column do not match corresponding values for Table 9-13.
TABLE 9-14: Station Availability to Respond to Calls
Station Calls in
Area
First Due
Responded
First Due
Arrived
First Due
First
Percent
Responded
Percent
Arrived
Percent
First
1 2,696 2,534 2,518 2,494 94.0 93.4 92.5
2 1,574 1,399 1,384 1,361 88.9 87.9 86.5
3 1,812 1,618 1,604 1,587 89.3 88.5 87.6
4 1,818 1,573 1,550 1,510 86.5 85.3 83.1
5 2,436 2,094 2,075 2,059 86.0 85.2 84.5
6 1,995 1,857 1,845 1,827 93.1 92.5 91.6
7 1,081 969 953 929 89.6 88.2 85.9
Total 13,412 12,044 11,929 11,767 89.8 88.9 87.7
Note: For each station, we count the number of calls within its first due area where at least one BFD unit
arrived. Next, we focus on units from the first due station to see if any unit responded, arrived, or arrived first.
Observations:
■ During 59 hours (1 percent of all hours), seven or more calls occurred; in other words, the
department responded to seven or more calls in an hour about once a week.
■ The highest number of calls to occur in an hour was 15, which happened twice.
■ The hour with the most calls and the most associated runs was 7:00 p.m. to 8:00 p.m. on
August 11, 2019. There was a hailstorm at that time.
□ The hour’s 15 calls involved 27 individual dispatches resulting in 10.6 hours of deployed time.
These 15 calls included six canceled calls, four hazard calls, two false alarm calls, one illness
and other call, one accident call, and one public service call.
■ Another hour with the most calls was noon to 1:00 p.m. on April 18, 2019. There was a major
power outage on that day.
□ The hour’s 15 calls involved 20 individual dispatches resulting in 3.5 hours of deployed time.
These 15 calls included seven false alarm calls, two illness and other calls, two public service
calls, one canceled call, one good intent call, one accident call, and one seizure and
unconsciousness call.

119
RESPONSE TIME
In this part of the analysis we present response time statistics for different call types. We separate
response time into its identifiable components. Dispatch time is the difference between the time
a call is received and the time a unit is dispatched. Dispatch time includes call processing time,
which is the time required to determine the nature of the emergency and types of resources to
dispatch. Turnout time is the difference between dispatch time and the time a unit is en route to
a call’s location. Travel time is the difference between the time en route and arrival on scene.
Response time is the total time elapsed between receiving a call to arriving on scene.
In this analysis, we included all calls within the primary response area of the Billings Fire
Department to which at least one non-administrative unit from BFD was dispatched and at least
one unit from BFD or American Medical Response (AMR) arrived, while excluding canceled calls.
In addition, calls with a total response time of more than 30 minutes were excluded. Finally, we
focused on units that had complete time stamps, that is, units with all components recorded, so
that we could calculate each segment of response time.
Based on the methodology above, we excluded 13 calls that were not within BFD’s jurisdiction,
4,325 canceled calls, 81 calls where no units recorded a valid on-scene time, 26 calls where the
first arriving unit response was greater than 30 minutes, and 498 calls where one or more
segments of the first arriving unit’s response time could not be calculated due to missing or faulty
data. As a result, in this section, a total of 10,732 calls are included in the analysis, in which 10,192
calls occurred within Billings and 540 calls were located within the BUFSA.
In this analysis, we first analyzed the response times to calls in BFD’s overall jurisdiction. Then, we
separated the calls from Billings and BUFSA and analyzed the BFD’s response to each area.

120
Response Time by Type of Call
Table 9-15 breaks down the average dispatch, turnout, travel, and total response times by call
type for all calls within the primary service area of Billings (including the BUFSA), and Table 9-16
does the same for 90th percentile response times. A 90th percentile means that 90 percent of
calls had response times at or below that number. For example, Table 9-16 shows a 90th
percentile response time of 10.8 minutes, which means that 90 percent of the time, a call had a
response time of no more than 10.8 minutes. Figures 9-8 and 9-9 illustrate the same information.
TABLE 9-15: Average Response Time of First Arriving Unit, by Call Type
Call Type Time in Minutes Number
of Calls Dispatch Turnout Travel Total
Breathing difficulty 1.6 1.0 3.7 6.3 617
Cardiac and stroke 1.7 1.0 3.9 6.6 838
Fall and injury 1.6 1.1 4.5 7.3 1,483
Illness and other 1.5 1.1 4.2 6.9 3,010
MVA 1.7 1.1 3.4 6.2 744
Overdose and psychiatric 1.7 1.4 5.9 8.9 201
Seizure and unconsciousness 1.6 1.0 3.8 6.4 1,060
EMS Total 1.6 1.1 4.1 6.8 7,953
False alarm 1.3 1.7 4.7 7.7 986
Good intent 1.7 1.4 4.7 7.8 361
Hazard 1.7 1.7 5.2 8.6 316
Outside fire 1.4 1.8 4.3 7.5 160
Public service 1.8 1.4 4.9 8.0 868
Structure fire 1.8 1.5 3.5 6.8 88
Fire Total 1.6 1.6 4.7 7.9 2,779
Total 1.6 1.2 4.3 7.1 10,732

121
FIGURE 9-8: Average Response Time of First Arriving Unit, by Call Type – EMS
FIGURE 9-9: Average Response Time of First Arriving Unit, by Call Type – Fire

122
TABLE 9-16: 90th Percentile Response Time of First Arriving Unit, by Call Type
Call Type Time in Minutes Number
of Calls Dispatch Turnout Travel Total
Breathing difficulty 2.8 2.3 6.0 8.7 617
Cardiac and stroke 3.0 2.3 6.3 9.6 838
Fall and injury 3.0 2.5 8.1 11.3 1,483
Illness and other 2.8 2.4 7.2 10.3 3,010
MVA 3.1 2.4 6.2 9.8 744
Overdose and psychiatric 2.8 2.7 10.2 14.2 201
Seizure and unconsciousness 2.8 2.1 6.6 9.3 1,060
EMS Total 2.9 2.4 7.2 10.2 7,953
False alarm 2.1 2.8 8.4 11.7 986
Good intent 3.1 2.6 8.6 12.1 361
Hazard 3.2 2.8 9.1 13.3 316
Outside fire 2.8 2.9 7.3 11.3 160
Public service 3.3 2.8 8.4 12.3 868
Structure fire 3.3 2.7 6.5 10.5 88
Fire Total 2.9 2.8 8.3 12.1 2,779
Total 2.9 2.5 7.5 10.8 10,732
Observations:
■ The average dispatch time was 1.6 minutes.
■ The average turnout time was 1.2 minutes.
■ The average travel time was 4.3 minutes.
■ The average total response time was 7.1 minutes.
■ The average response time was 6.8 minutes for EMS calls and 7.9 minutes for fire calls.
■ The average response time was 7.5 minutes for outside fires and 6.8 minutes for structure fires.
■ The 90th percentile dispatch time was 2.9 minutes.
■ The 90th percentile turnout time was 2.5 minutes.
■ The 90th percentile travel time was 7.5 minutes.
■ The 90th percentile total response time was 10.8 minutes.
■ The 90th percentile response time was 10.2 minutes for EMS calls and 12.1 minutes for fire calls.
■ The 90th percentile response time was 11.4 minutes for outside fires and 10.4 minutes for
structure fires.

123
Response Time by Hour
Average dispatch, turnout, travel, and total response time by hour for calls in the jurisdiction of
Billings are shown in the following table and figure. The table also shows 90th percentile response
times.
TABLE 9-17: Average and 90th Percentile Response Time of First Arriving Unit, by
Hour of Day
Hour
Time in Minutes Number
of Calls Dispatch Turnout Travel Response 90th Percentile
Response
0 1.6 1.6 4.7 8.0 12.7 305
1 1.7 1.6 4.1 7.5 10.5 252
2 1.6 1.7 4.8 8.1 12.8 233
3 1.5 1.9 4.7 8.2 11.2 233
4 1.6 1.7 5.0 8.4 11.8 198
5 1.7 1.8 4.8 8.2 12.3 224
6 1.5 1.5 4.4 7.5 11.2 270
7 1.5 1.3 4.3 7.0 10.8 398
8 1.6 1.2 4.2 6.9 10.6 482
9 1.6 1.1 4.2 6.9 10.4 515
10 1.7 1.0 4.1 6.8 10.6 504
11 1.7 1.0 4.5 7.2 11.6 569
12 1.6 1.1 3.9 6.6 10.1 589
13 1.7 1.0 4.2 6.9 11.0 619
14 1.7 1.0 4.2 6.9 10.7 566
15 1.5 1.0 4.1 6.7 9.9 585
16 1.5 1.1 4.0 6.7 10.2 596
17 1.5 1.1 4.2 6.8 10.5 650
18 1.7 1.1 4.3 7.0 10.9 574
19 1.6 1.0 4.1 6.7 10.0 600
20 1.5 1.1 4.0 6.6 9.6 513
21 1.4 1.3 4.5 7.2 10.8 516
22 1.5 1.5 4.6 7.6 11.5 427
23 1.7 1.4 4.2 7.4 11.1 314
Total 1.6 1.2 4.3 7.1 10.8 10,732

124
FIGURE 9-10: Average Response Time of First Arriving Unit, by Hour of Day
Observations:
■ Average dispatch time was between 1.4 minutes (9:00 p.m. to 10:00 p.m.) and 1.7 minutes
(11:00 p.m. to midnight).
■ Average turnout time was between 1.0 minutes (2:00 p.m. to 3:00 p.m.) and 1.9 minutes
(3:00 a.m. to 4:00 a.m.).
■ Average travel time was between 3.9 minutes (noon to 1:00 p.m.) and 5.0 minutes (4:00 a.m.
to 5:00 a.m.).
■ Average response time was between 6.6 minutes (noon to 1:00 p.m.) and 8.4 minutes
(4:00 a.m. to 5:00 a.m.).
■ The 90th percentile response time was between 9.6 minutes (8:00 p.m. to 9:00 p.m.) and
12.8 minutes (2:00 a.m. to 3:00 a.m.).

125
Response Time Distribution
Here, we present a more detailed look at how response times to calls are distributed. The
cumulative distribution of total response time for the first arriving unit to EMS calls is shown in
Figure 9-11 and Table 9-18. Figure 9-11 shows response times for the first arriving unit to EMS calls
as a frequency distribution in whole-minute increments, and Figure 9-12 shows the same for the
first arriving unit to outside and structure fire calls.
The cumulative percentages here are read in the same way as a percentile. In Figure 9-11, the
90th percentile of 10.2 minutes means that 90 percent of EMS calls had a response time of 10.2
minutes or less. In Table 9-18, the cumulative percentage of 75.6, for example, means that
75.6 percent of EMS calls had a response time under 8 minutes.
FIGURE 9-11 Cumulative Distribution of Response Time – First Arriving Unit – EMS

126
FIGURE 9-12: Cumulative Distribution of Response Time – First Arriving Unit –
Outside and Structure Fires
TABLE 9-18: Cumulative Distribution of Response Time – First Arriving Unit – EMS
Response Time
(minute) Frequency
Cumulative
Percentage
1 1 0.0
2 27 0.4
3 163 2.4
4 672 10.9
5 1,353 27.9
6 1,490 46.6
7 1,334 63.4
8 973 75.6
9 647 83.7
10 421 89.0
11 264 92.4
12 169 94.5
13 127 96.1
14 70 97.0
15 70 97.8
16+ 172 100.0

127
TABLE 9-19: Cumulative Distribution of Response Time – First Arriving Unit –
Outside and Structure Fires
Response Time
(minute) Frequency
Cumulative
Percentage
1 0 0.0
2 0 0.0
3 1 0.4
4 18 7.7
5 26 18.1
6 50 38.3
7 49 58.1
8 28 69.4
9 24 79.0
10 13 84.3
11 14 89.9
12 12 94.8
13 5 96.8
14 2 97.6
15 1 98.0
16+ 5 100.0
Observations:
■ For 76 percent of EMS calls, the response time of the first arriving unit was less than 8 minutes.
■ For 69 percent of fire calls, the response time of the first arriving unit was less than 8 minutes.

128
Response Time by Location
Table 9-20 provides the average dispatch, turnout, travel, and total response times for all calls
within BFD’s jurisdiction, broken out by the location of the call. Table 9-21 gives the
corresponding 90th percentile response times broken out in the same manner. Tables 9-22 and
9-23 break down the average dispatch, turnout, travel, total response, and 90th percentile
response times by call type for all calls within Billings and BUFSA, respectively.
TABLE 9-20: Average Response Time of First Arriving Unit, by Location
Location Call Type Time in Minutes
Count Dispatch Turnout Travel Total
Billings
EMS 1.6 1.1 4.0 6.6 7,575
Fire 1.6 1.6 4.6 7.7 2,617
Total 1.6 1.2 4.1 6.9 10,192
BUFSA
EMS 1.6 1.5 6.9 9.9 378
Fire 1.7 1.9 7.3 10.8 162
Total 1.6 1.6 7.0 10.2 540
Total 1.6 1.2 4.3 7.1 10,732
TABLE 9-21: 90th Percentile Response Time of First Arriving Unit, by Location
Location Call Type Time in Minutes
Count Dispatch Turnout Travel Total
Billings
EMS 2.9 2.3 6.8 9.8 7,575
Fire 2.9 2.8 8.0 11.7 2,617
Total 2.9 2.5 7.2 10.4 10,192
BUFSA
EMS 3.0 2.8 11.2 14.2 378
Fire 3.3 2.8 11.6 15.8 162
Total 3.1 2.8 11.2 14.6 540
Total 2.9 2.5 7.5 10.8 10,732
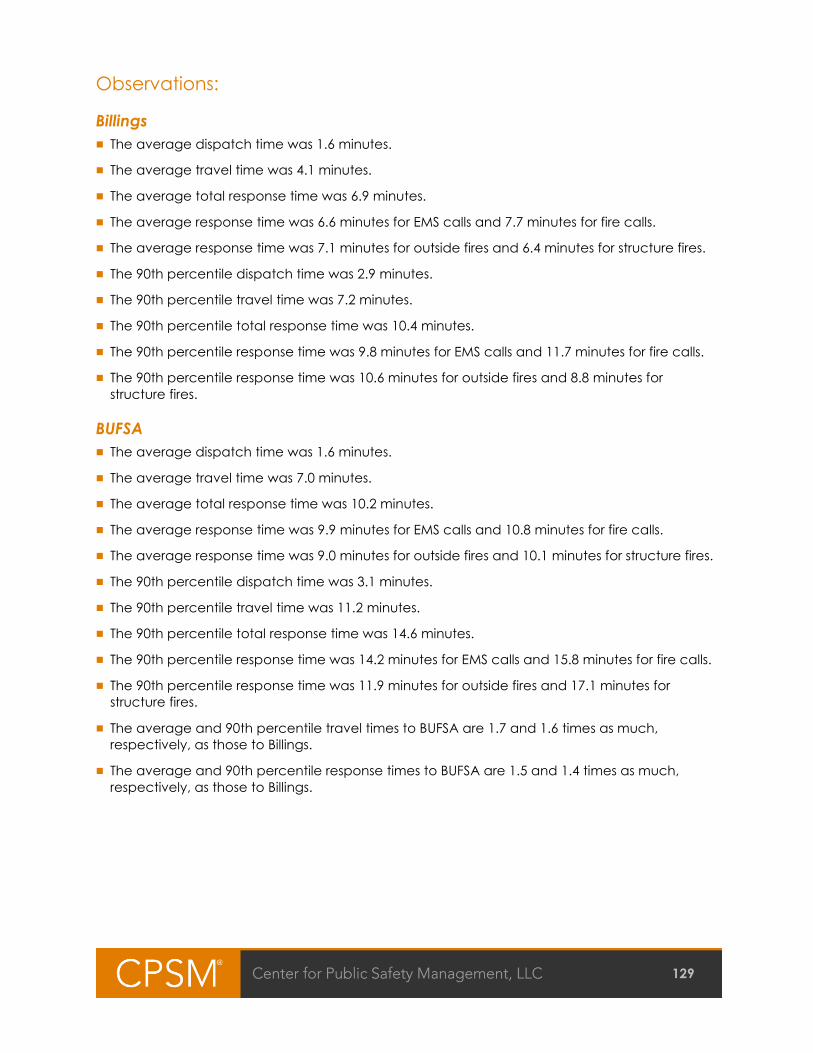
129
Observations:
Billings
■ The average dispatch time was 1.6 minutes.
■ The average travel time was 4.1 minutes.
■ The average total response time was 6.9 minutes.
■ The average response time was 6.6 minutes for EMS calls and 7.7 minutes for fire calls.
■ The average response time was 7.1 minutes for outside fires and 6.4 minutes for structure fires.
■ The 90th percentile dispatch time was 2.9 minutes.
■ The 90th percentile travel time was 7.2 minutes.
■ The 90th percentile total response time was 10.4 minutes.
■ The 90th percentile response time was 9.8 minutes for EMS calls and 11.7 minutes for fire calls.
■ The 90th percentile response time was 10.6 minutes for outside fires and 8.8 minutes for
structure fires.
BUFSA
■ The average dispatch time was 1.6 minutes.
■ The average travel time was 7.0 minutes.
■ The average total response time was 10.2 minutes.
■ The average response time was 9.9 minutes for EMS calls and 10.8 minutes for fire calls.
■ The average response time was 9.0 minutes for outside fires and 10.1 minutes for structure fires.
■ The 90th percentile dispatch time was 3.1 minutes.
■ The 90th percentile travel time was 11.2 minutes.
■ The 90th percentile total response time was 14.6 minutes.
■ The 90th percentile response time was 14.2 minutes for EMS calls and 15.8 minutes for fire calls.
■ The 90th percentile response time was 11.9 minutes for outside fires and 17.1 minutes for
structure fires.
■ The average and 90th percentile travel times to BUFSA are 1.7 and 1.6 times as much,
respectively, as those to Billings.
■ The average and 90th percentile response times to BUFSA are 1.5 and 1.4 times as much,
respectively, as those to Billings.

130
ATTACHMENT I: ACTIONS TAKEN
TABLE 9-22: Actions Taken Analysis for Structure and Outside Fire Calls
Action Taken Number of Calls
Outside Fire Structure Fire
Assist animal 0 1
Control traffic 2 1
Establish safe area 2 4
Extinguishment by fire service personnel 118 48
Fire control or extinguishment, other 18 12
Forcible entry 1 1
Hazardous materials spill control and confinement 1 0
Incident command 30 27
Investigate 72 61
Notify other agencies 1 1
Provide apparatus 2 2
Provide basic life support (BLS) 2 0
Provide equipment 2 4
Provide information to public or media 1 0
Provide manpower 8 14
Provide water 2 2
Remove hazard 1 0
Salvage & overhaul 6 9
Search 0 2
Search & rescue, other 0 2
Shut down system 0 1
Standby 1 0
Ventilate 2 18
Note: Totals are higher than the total number of structure and outside fire calls because some calls
recorded multiple actions taken.
Observations:
■ Out of 166 outside fires, 118 were extinguished by fire service personnel, which accounted for
71 percent of outside fires.
■ Out of 101 structure fires, 48 were extinguished by fire service personnel, which accounted for
48 percent of structure fires.

131
ATTACHMENT II: ADDITIONAL PERSONNEL
TABLE 9-23: Workload of Administrative Units
Unit ID Unit Type Annual
Hours
Annual
Runs
F20 Fire Chief 1.6 1
F22 Asst. Fire Chief 4.6 2
F31 Training/Safety Chief 104.6 60
F32 Asst. Training/Safety Chief 86.1 42
FM23 Fire Marshal 14.8 5
FM24 Assistant Fire Marshal 34.3 10
FM25 Assistant Fire Marshal 34.5 21
FM26 Assistant Fire Marshal 33.5 16
FM27 Assistant Fire Marshal 31.1 12
FM29 Assistant Fire Marshal 34.8 14
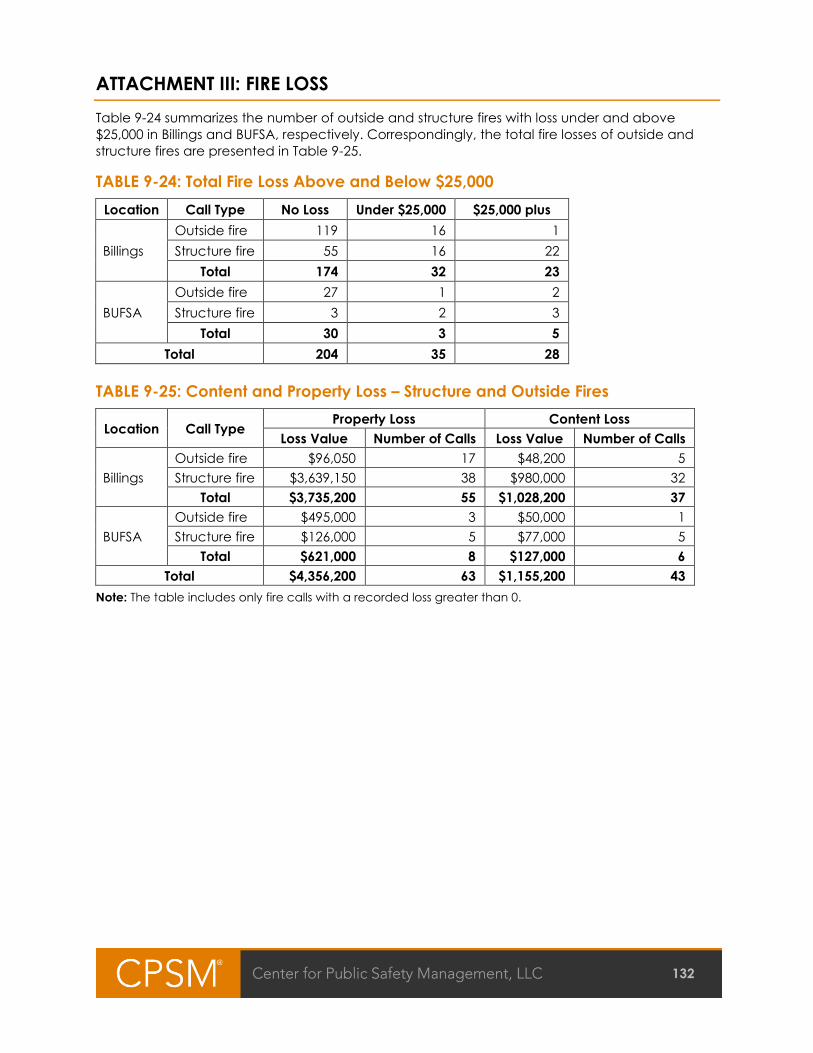
132
ATTACHMENT III: FIRE LOSS
Table 9-24 summarizes the number of outside and structure fires with loss under and above
$25,000 in Billings and BUFSA, respectively. Correspondingly, the total fire losses of outside and
structure fires are presented in Table 9-25.
TABLE 9-24: Total Fire Loss Above and Below $25,000
Location Call Type No Loss Under $25,000 $25,000 plus
Billings
Outside fire 119 16 1
Structure fire 55 16 22
Total 174 32 23
BUFSA
Outside fire 27 1 2
Structure fire 3 2 3
Total 30 3 5
Total 204 35 28
TABLE 9-25: Content and Property Loss – Structure and Outside Fires
Location Call Type Property Loss Content Loss
Loss Value Number of Calls Loss Value Number of Calls
Billings
Outside fire $96,050 17 $48,200 5
Structure fire $3,639,150 38 $980,000 32
Total $3,735,200 55 $1,028,200 37
BUFSA
Outside fire $495,000 3 $50,000 1
Structure fire $126,000 5 $77,000 5
Total $621,000 8 $127,000 6
Total $4,356,200 63 $1,155,200 43
Note: The table includes only fire calls with a recorded loss greater than 0.

133
Observations:
■ 146 outside fires and 58 structure fires had no recorded loss.
■ Three outside fires and 25 structure fires had $25,000 or more in loss.
■ Structure fires:
□ The highest total loss for a structure fire was $806,000.
□ The average total loss for all structure fires was $112,143.
□ 37 structure fires had content loss with a combined $1,057,000 in losses.
□ Out of 101 structure fires, 43 had recorded property loss, with a combined $3,765,150 in
losses.
■ Outside fires:
□ The highest total loss for an outside fire was $390,000.
□ The average total loss for outside fires with loss was $34,463.
□ Six outside fires had content loss with a combined $98,200 in losses.
□ Out of 166 outside fires, 20 had recorded property loss, with a combined $591,050 in losses.
■ 86 percent and 14 percent of structure and outside fire incidents happened in the city area
and BUFSA, respectively.
■ The structure and outside fire incidents in the city made up 86 percent of total fire losses and
incidents in the BUFSA made up 14 percent of total fire losses.

134
ATTACHMENT IV: WILDLAND, GRASS, AND BRUSH FIRES
In the 12-month evaluation period, BFD responded to 36 incidents that were categorized in NFIRS
as wildfires, grass fires, or brush fires. Eight out of these 36 incidents had a recorded number of
acres burned. Table 9-26 presents these incidents broken out by the size in acres in Billings
(including the city of Billings and BUFSA) and neighboring mutual aid jurisdictions.
TABLE 9-26: Wildland, Grass, and Brush Fires by Location and Acres Burned
Location Acres Burned Number of Calls
Shepherd 316 1
Shepherd 113 1
Park City 4 1
Billings 3 1
Shepherd 3 1
Billings 1 1
BUFSA 1 2
Billings N/A 19
BUFSA N/A 7
Huntly N/A 2

135
ATTACHMENT V: NFPA 1710 ANALYSIS
In this section, we further examine structure fire responses using the guidelines established in the
National Fire Protection Association’s standard 1710 (NFPA 1710). Included in these guidelines is
a set of standards for the travel time of units responding to a structure fire, where travel time is
defined as beginning when the first unit goes en route and ending when it arrives on scene. The
first arriving unit should arrive in 4 minutes, and a minimum full complement of 14 suppression
personnel should arrive in 8 minutes.
Overall, there were 101 structure fires in Billings, and a full complement of 14 personnel arrived in
45 of them. Table 9-27 shows the average and 90th percentile travel times for both the first
arriving unit and for the arrival of the full complement. Table 9-28 presents the number and
percentage of calls meeting the standards delineated in NFPA 1710. Table 9-29 breaks down
structure fires by the number of responders.
In this section, travel time is calculated differently than in Tables 9-16 and 9-17. In those tables, an
individual unit’s en route and arrive timestamps were used to calculate the travel time for that
unit, yielding a unit-level travel time. Here, in contrast, NFPA defines travel time as beginning
from when the first unit goes en route – even if it is not the same unit that arrived first. Thus, this
travel time corresponds to the travel time of an entire call, and not for a specific unit responding
to a given call.
TABLE 9-27: Average and 90th Percentile Travel Times
Response Type Travel Time in Minutes
Average 90th Percentile
First Arriving Unit 4.0 7.1
Full Complement of 14 Personnel 12.5 19.6
TABLE 9-28: Number and Percentage of Calls Meeting NFPA 1710
Response Type Calls Meeting Standard
Number of Calls Number of Calls Percent of Calls
First Arriving Unit 57 56.4 101
Full Complement of 14 Personnel 17 37.8 45

136
TABLE 9-29: Structure Fires by Number of Responders
Number of Responders Number of Calls
3 20
4 7
5 3
6 4
7 3
8 3
9 3
10 2
11 2
12 5
13 4
14 1
15 2
16 6
17 8
18 6
19 1
20 6
21 1
22 5
23 2
25 3
26 1
29 1
32 1
56 1
Total 101
Observations:
■ Of the 101 structure fire calls, 45 of them had a full arriving complement of at least
14 personnel.
■ The average travel time for the first arriving unit was 4.0 minutes, and the 90th percentile travel
time was 7.1 minutes.
■ The average travel time for the full arriving complement of at least 14 personnel was
12.5 minutes, and the 90th percentile travel time was 19.6 minutes.
■ Of the 101 structure fire calls, the first arriving unit arrived within 4 minutes 57 times, or
56 percent of the time.
■ Of the 45 structure fire calls that had a full arriving complement of at least 14 personnel, the
full complement arrived within 8 minutes 17 times, or 38 percent of the time.
- END -