operational and statutory capacity of local health departments in
TRANSCRIPT
John Amson Capitman, PhD Marlene I. Bengiamin, PhD
Central Valley Health Policy InstituteCalifornia State University, Fresno
Operational and Statutory Capacity of Local Health Departments in
the San Joaquin Valley


San Joaquin Valley Public Health Consortium
1
Acknowledgment
The San Joaquin Valley Public Health Consortium is a forum for County Public Health Directors, Health Officers, and invited members to explore and exchange ideas and information and to develop strategies for addressing pressing public health issues faced by the counties and the region. The Consortium engages in strategic planning, training, action oriented policy development and research to improve the quality and responsiveness of public health programs in the Central California region. The vision of the Consortium is to achieve health equity for all residents in the San Joaquin Valley and the mission is to provide leadership for a regional health agenda that addresses the social determinants of health in the San Joaquin Valley. The San Joaquin Valley Public Health Consortium’s core values are to help all residents in the San Joaquin Valley to lead healthy and productive lives through focusing on prevention by addressing the social determinants of health. The consortium continually works on building capacity of expert workforce, engaging communities, and utilizing evidence based practice to inform and advocate for health equity in all policies.
This report is the result of collaboration between Consortium members including the eight San Joaquin Valley Counties’ Public Health Departments located in Fresno, Madera, Merced, Kings, Kern, Stanislaus, San Joaquin, and Tulare Counties; Adventist Health Central Valley Network, University of California Merced, California State University, Fresno and the Central Valley Health Policy Institute at Fresno State. Funding for this publication was made possible by a grant from The California Endowment.
The authors would especially like to thank Donna DeRoo, Ashley Hart, and Charles Felix who took the time to edit the report and facilitate the process. You are a gift and we deeply appreciate your work.
We would like to extend a special acknowledgment to Dr. Jody Hironaka-Juteau, David Pomaville, David Luchini, Bill Mitchell, Cathy Volpa, Charles Sandefur, Dr. Claudia Jonah Elizabeth Gazarek, Dr. John Walker, Dr. Karen Furst, Dr. Karen Haught, Kathleen Grassi, Keith Winkler, Dr. Miguel A. Perez, Dr. Paul Brown, Dr. Steve Roussos, Dr. Tim Livermore, and Van Do Reynoso for providing insights, excellent and extensive advice throughout the project and peer review comments before publication.
Operational and Statutory Capacity of Local Health Departments in the San Joaquin Valley
2
Executive Summary
Background: Current discussions on the role of county Public Health Departments in California are shaped by ongoing fiscal crises and extraordinary demands on county and state budgets. At the same time, public health policy priorities are shifting to emphasize primary prevention and self-management of chronic disease. In this context, there is increasing need for a clear assessment of the capacity and impacts of public health on the communities they serve. This need is perhaps most pronounced for residents of the eight San Joaquin Valley (SJV) counties since they experience greater socio-economic and environmental barriers to population health and higher rates of morbidity and mortality than other California regions. Nationally, a growing literature shows how the programmatic and statutory capacities of local health departments (LHDs) differ and how these differences impact population health outcomes. No prior study in California examines these aspects of capacity across LHDs serving populations of similar size. This brief compares the operational capacity of the eight SJV LHDs to their peers across the state and explores how relative budget constraint and unclear statutory context influence their perceived effectiveness.
Methods: All quantitative, numerical data is based on 2010 data from the National Association of County and City Local Health Officials (NACCHO). With 82 percent of LHDs having completed their surveys, the data collected are the most comprehensive and accurate source of information about LHD infrastructure and practice in the United States. This high response rate provides the information needed to update the picture of local public health. This data is useful to practitioners and policymakers at the local, state, and federal level; researchers; the media and the public. With information on LHD governance, funding, workforce, activities, services and more, the data can be used to make local and regional comparisons, drive policymaking, and educate the workforce about local public health practice. Qualitative, narrative data is based on interviews with the eight San Joaquin Valley Local Health Departments’ directors and their designees. Incomplete or inconsistent NACCHO data elements were updated if appropriate with additional county data from interviews or electronic resource.
Findings: California’s future economic well-being and quality of life rest on promoting population health and reducing the costs of chronic disease. Increased access to health services alone has been deemed insufficient to yield population level shifts in epidemics such as heart disease, diabetes, and asthma. This brief shows that SJV counties, despite their high levels of poverty and relatively poorer health outcomes are receiving less in state/federal population health revenues compared to other counties with similar population size.
Despite the importance of non-communicable disease primary prevention initiatives, California statutes and regulations fail to establish an expectation that LHDs prioritize these concerns. As California implements both the Affordable Care Act and budget reduction initiatives, there have been calls to review and adjust the relationships between the state and the counties with respect to roles in financing and delivery of personal health care services. This brief indicates the need for a broader discussion of LHD roles and better alignment between new expectations to prevent and manage non-communicable diseases, public health statutes and regulations, and LHD financing for population health activities. Several recommendations are suggested by these findings.
Recommendations: As California implements both the Affordable Care Act and budget reduction initiatives, there have been calls to review and adjust the relationships between the state and the counties with respect to roles in financing and delivery of personal health care services. This brief indicates the need for a broader discussion of LHD roles and better alignment between new expectations to prevent and manage non-communicable diseases, public health statutes and regulations, and LHD financing for population health activities. Several recommendations are suggested by these findings, including: a) Education of local leaders on emerging roles; b) Assess the adequacy of Realignment program funding and other public health funding levels to ensure local capacity to meet primary prevention needs as well as health care for the uninsured. Funding must be adequate for LHDs to meet the 10 essential public health services; c) Simplify funding process and categorical programs; d) Create greater alignment in California public health statutes/regulation to reinforce the primary prevention roles of LHDs in the context of the Affordable Care Act.
San Joaquin Valley Public Health Consortium
3
Overview
Current discussions on the role of county Public Health Departments in California are shaped by ongoing fiscal crises and extraordinary demands on county and state budgets. At the same time, public health policy priorities are shifting to emphasize primary prevention and self-management of chronic disease. In this context, there is increasing need for a clear assessment of the capacity and impacts of public health on the communities they serve. This need is perhaps most pronounced for residents of the eight San Joaquin Valley (SJV) counties since they experience greater socio-economic and environmental barriers to population health and higher rates of morbidity and mortality than other California regions. Nationally, a growing literature shows how the programmatic and statutory capacities of local health departments (LHDs) differ and how these differences impact population health outcomes. No prior study in California examines these aspects of capacity across LHDs serving populations of similar size. This brief compares the operational capacity of the eight SJV LHDs to their peers across the state and explores how relative budget constraint and unclear statutory context influence their perceived effectiveness.
Changing Context for Public Health
Because health care services for preventable conditions form a large and growing share of United States health expenditures, changes in medical care financing and delivery alone will not adequately reduce rising costs or improve our nation’s health. According to the Institute of Medicine (2012), achieving the long-term goals of the Affordable Care Act and other personal health service financing reforms depends on bending the cost curve and thus requires more attention to the social and environmental determinants of health. In California as in other states, there are calls to adopt a “health in all policies” approach, in part to restrain growth in public costs for personal health services. Yet they conclude that LHDs lack the financing, organization, and statutory authority to mount effective primary prevention initiatives1.
Concerns with the adequacy of existing funding to provide public health core services and meet new demands have been raised in California and nationally.2 California is ranked 37th in per capita spending by the Centers for Disease Control and 8th in state per capita spending.
For 2011-2102, 82% of state and federal funds were distributed to LHDs. These funds are allocated to the LHDs through multiple agreements and categorical contracts, each with discrete funding rules and reporting requirements.3 California LHDs also receive state realignment funds for both indigent health services and public health, with local policymakers determining to what extent these funds are directed to population health programs. The recently passed California budget calls for significant reductions to Realignment funding over the next several years.4 LHDs can receive funding directly through local county general fund appropriations and other sources.5 In this complex funding context, there is considerable uncertainty about how actual investments in population health programming differ across California counties.
Although many factors influence population health, a growing literature links the financing and structure of local public health agencies to community health outcomes. Mays et al (2006) used data from LHDS in seven states to show that per capita spending was the most consistent predictor of public health system
Much has been learned about the actual or distal (as opposed to the proximal) causes of death and disease, including social and economic conditions that impair health and make it hard to avoid health risks. Therefore, it is no longer sufficient to expect that reforms in the medical care delivery system (for example, changes in payment, access and quality) alone will improve the public’s health. Large proportions of the U.S. disease burden are preventable. The failure of the health system (which includes medical care and governmental public health) to develop and deliver effective preventive strategies is taking a large and growing toll not only on health, but on the nation’s economy.
Institute of Medicine. (2012). For the Public’s Health: Investing in a Healthier Future.
Operational and Statutory Capacity of Local Health Departments in the San Joaquin Valley
4
performance6. Using the National Association of County and City Health Officers (NACCHO) data for 1973-2005, Erwin et al found that mortality rates were correlated with local health department expenditures: for each $10 increase in per capita expenditures, infectious disease mortality decreased by 7.4% and premature mortality decreased by 1.5%7. During that same timeframe, increasing local health department expenditure was associated with decreasing cardiovascular disease mortality.8 Grembowski, Bekemeier, Conrad, and Kreuter (2010) found that greater local health department expenditures per capita were also associated with lower racial/ethnic inequalities in mortality.9
Other scholars have highlighted other determinants of LHD impacts on public health. For example, Rodriguez et al (2012) found that after controlling for community characteristics and the governance and organizational linkages of local health departments, revenues were unrelated to STD prevalence. Local health departments with independent governance and broad sharing of responsibilities with local organizations were associated with lower STD rates. 10 Other studies have highlighted overall LHD staffing, governance, state policies, and the level of local vs. state/federal investment as determinants of public health impacts.
Public Health Core Functions and Policy
The core activities and indicators of LHD performance have been explored in several contexts. A set of 10 core public health services was detailed in 1994 (and shown in Figure 1) and has been the basis for subsequent research and performance measurement.11 Early descriptions used examples from environmental health, communicable disease control and maternal/child health services to exemplify these core functions.12 More recently, the National Public Health Performance Standards Program (NPHPSP) has released new aspirational measures after testing in many localities and states.13 Embracing and extending the NPHPSP, the Public Health Accreditation Board (PHAB) has also established new expectations for LHDs and the San Joaquin Valley LHDs, like many in the state and nation are seeking to meet these standards.14 Still using the framework of 10 essential public health functions, the new performance expectations highlight comprehensive data, community mobilization, policy making and research focused on primary prevention of non-communicable disease, promoting optimal provision of clinical preventive services, and encouraging self-management of chronic conditions.
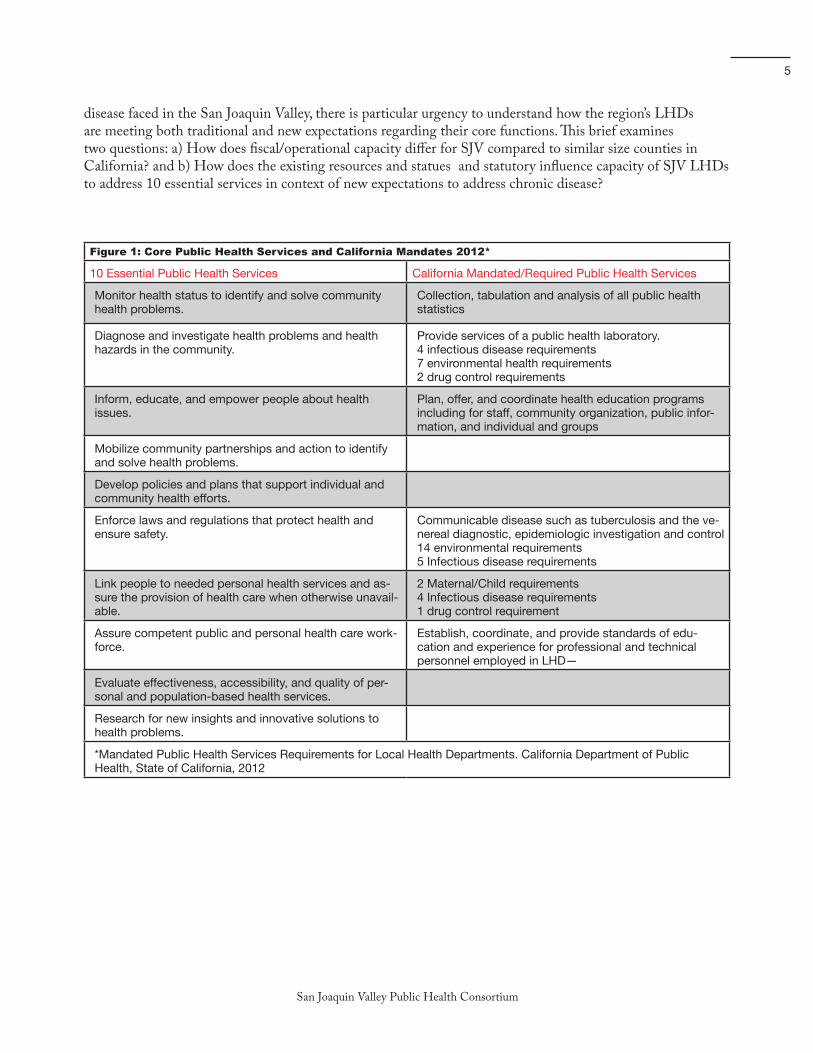
California has been a national leader in promoting primary prevention of non-communicable disease and control of chronic health conditions as major goals for public health.15 From early successes in tobacco control to recent initiatives throughout the state such as the Central California Regional Obesity Prevention Program, successful initiatives combine policy and systems change and community mobilization strategies to address primary prevention of non-communicable disease. California implements “safe and active communities” initiatives in several domains, though maintaining an adequate infrastructure is viewed as a key challenge.16 Nonetheless, as shown in Figure 1, existing California statutes and regulations do not explicitly assign responsibility to LHDs for the community mobilization, policy development, and evaluation/research core public health functions and are more likely to specify functions around environmental quality, communicable disease monitoring and control, and maternal/child health services17. These statutes and regulations provide broad latitude and authority to county boards of supervisors and county health officers to monitor and control conditions and outcomes relevant to the public’s health.
Figure 1 may suggest that California’s statutory and regulatory requirements do not explicitly promote emergent professional, federal, and state policy objectives regarding LHD provision of community mobilization, policy development, and research/evaluation focused on primary prevention and effective management of non-communicable, chronic conditions. Given the particular burden of non-communicable
San Joaquin Valley Public Health Consortium
5
disease faced in the San Joaquin Valley, there is particular urgency to understand how the region’s LHDs are meeting both traditional and new expectations regarding their core functions. This brief examines two questions: a) How does fiscal/operational capacity differ for SJV compared to similar size counties in California? and b) How does the existing resources and statues and statutory influence capacity of SJV LHDs to address 10 essential services in context of new expectations to address chronic disease?
Figure 1: Core Public Health Services and California Mandates 2012*
10 Essential Public Health Services California Mandated/Required Public Health Services
Monitor health status to identify and solve community health problems.
Collection, tabulation and analysis of all public health statistics
Diagnose and investigate health problems and health hazards in the community.
Provide services of a public health laboratory.4 infectious disease requirements7 environmental health requirements 2 drug control requirements
Inform, educate, and empower people about health issues.
Plan, offer, and coordinate health education programs including for staff, community organization, public infor-mation, and individual and groups
Mobilize community partnerships and action to identify and solve health problems.
Develop policies and plans that support individual and community health efforts.
Enforce laws and regulations that protect health and ensure safety.
Communicable disease such as tuberculosis and the ve-nereal diagnostic, epidemiologic investigation and control 14 environmental requirements5 Infectious disease requirements
Link people to needed personal health services and as-sure the provision of health care when otherwise unavail-able.
2 Maternal/Child requirements4 Infectious disease requirements 1 drug control requirement
Assure competent public and personal health care work-force.
Establish, coordinate, and provide standards of edu-cation and experience for professional and technical personnel employed in LHD—
Evaluate effectiveness, accessibility, and quality of per-sonal and population-based health services.
Research for new insights and innovative solutions to health problems.
*Mandated Public Health Services Requirements for Local Health Departments. California Department of Public Health, State of California, 2012
Operational and Statutory Capacity of Local Health Departments in the San Joaquin Valley
6
DATA SOURCES
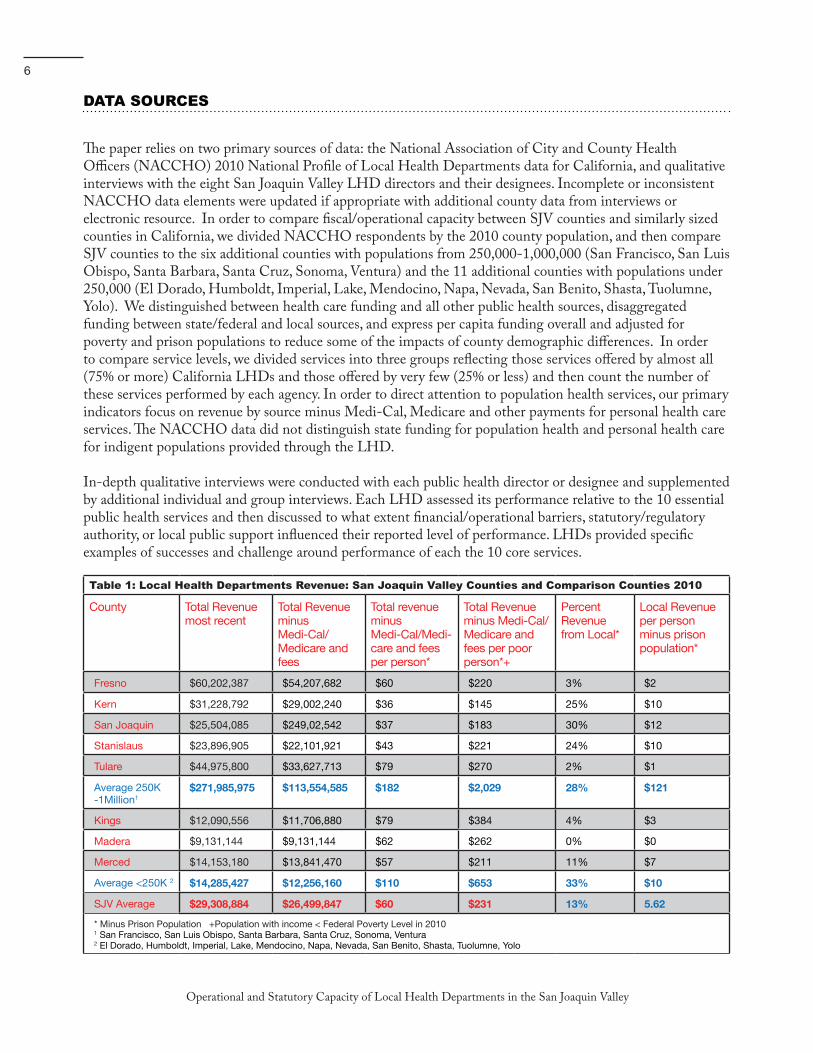
The paper relies on two primary sources of data: the National Association of City and County Health Officers (NACCHO) 2010 National Profile of Local Health Departments data for California, and qualitative interviews with the eight San Joaquin Valley LHD directors and their designees. Incomplete or inconsistent NACCHO data elements were updated if appropriate with additional county data from interviews or electronic resource. In order to compare fiscal/operational capacity between SJV counties and similarly sized counties in California, we divided NACCHO respondents by the 2010 county population, and then compare SJV counties to the six additional counties with populations from 250,000-1,000,000 (San Francisco, San Luis Obispo, Santa Barbara, Santa Cruz, Sonoma, Ventura) and the 11 additional counties with populations under 250,000 (El Dorado, Humboldt, Imperial, Lake, Mendocino, Napa, Nevada, San Benito, Shasta, Tuolumne, Yolo). We distinguished between health care funding and all other public health sources, disaggregated funding between state/federal and local sources, and express per capita funding overall and adjusted for poverty and prison populations to reduce some of the impacts of county demographic differences. In order to compare service levels, we divided services into three groups reflecting those services offered by almost all (75% or more) California LHDs and those offered by very few (25% or less) and then count the number of these services performed by each agency. In order to direct attention to population health services, our primary indicators focus on revenue by source minus Medi-Cal, Medicare and other payments for personal health care services. The NACCHO data did not distinguish state funding for population health and personal health care for indigent populations provided through the LHD.
In-depth qualitative interviews were conducted with each public health director or designee and supplemented by additional individual and group interviews. Each LHD assessed its performance relative to the 10 essential public health services and then discussed to what extent financial/operational barriers, statutory/regulatory authority, or local public support influenced their reported level of performance. LHDs provided specific examples of successes and challenge around performance of each the 10 core services.
Table 1: Local Health Departments Revenue: San Joaquin Valley Counties and Comparison Counties 2010
County Total Revenue most recent
Total Revenue minus Medi-Cal/ Medicare and fees
Total revenue minus Medi-Cal/Medi-care and fees per person*
Total Revenue minus Medi-Cal/Medicare and fees per poor person*+
Percent Revenue from Local*
Local Revenue per person minus prison population*
Fresno $60,202,387 $54,207,682 $60 $220 3% $2
Kern $31,228,792 $29,002,240 $36 $145 25% $10
San Joaquin $25,504,085 $249,02,542 $37 $183 30% $12
Stanislaus $23,896,905 $22,101,921 $43 $221 24% $10
Tulare $44,975,800 $33,627,713 $79 $270 2% $1
Average 250K -1Million1
$271,985,975 $113,554,585 $182 $2,029 28% $121
Kings $12,090,556 $11,706,880 $79 $384 4% $3
Madera $9,131,144 $9,131,144 $62 $262 0% $0
Merced $14,153,180 $13,841,470 $57 $211 11% $7
Average <250K 2 $14,285,427 $12,256,160 $110 $653 33% $10
SJV Average $29,308,884 $26,499,847 $60 $231 13% 5.62
* Minus Prison Population +Population with income < Federal Poverty Level in 20101 San Francisco, San Luis Obispo, Santa Barbara, Santa Cruz, Sonoma, Ventura2 El Dorado, Humboldt, Imperial, Lake, Mendocino, Napa, Nevada, San Benito, Shasta, Tuolumne, Yolo
San Joaquin Valley Public Health Consortium
7
FINDINGS
As shown in Table 1, the San Joaquin Valley LHDs receive lower total revenue for population health services than do their peer counties in California. One factor is that these counties have a much greater proportion of their total agency revenue for population health and less revenue associated with direct service delivery. Nonetheless, focusing on only population health targeted revenues, the mid-size SJV counties receive notably less per capita than their peer counties, while the smaller SJV counties receive somewhat lower revenues. But when the population with incomes less than 150% of the Federal poverty level is considered, all San Joaquin Valley counties have revenues per low income person that are notably lower than for their peer counties. There was considerable variation in revenues for population health services, with one major difference among counties being whether or not they included environmental health services within the same agency as public health, with three of the eight SJV counties (San Joaquin, Stanislaus, and Madera) performing environmental health through a separate agency. It should be noted that the comparison counties demonstrate as much variation in these measures as do the San Joaquin Valley counties, with San Francisco showing the largest per poor person expenditure at $1125 and Ventura the lowest at $174.
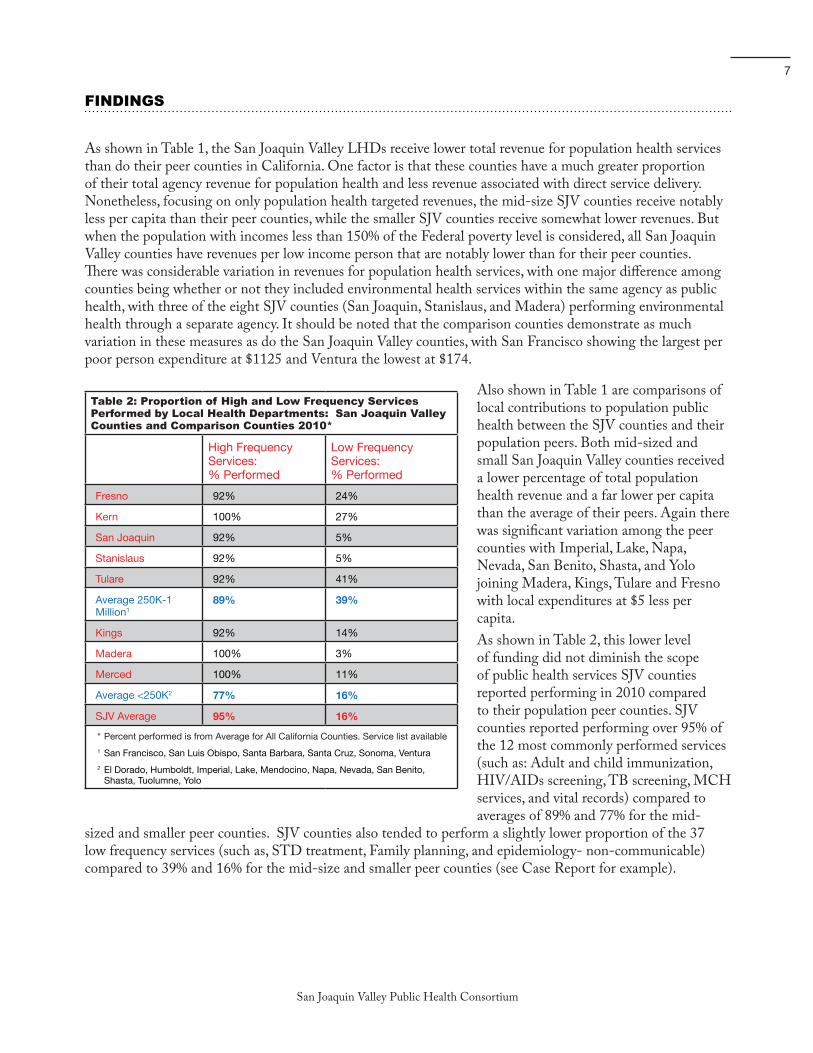
Table 2: Proportion of High and Low Frequency Services Performed by Local Health Departments: San Joaquin Valley Counties and Comparison Counties 2010*
High Frequency Services: % Performed
Low Frequency Services: % Performed
Fresno 92% 24%
Kern 100% 27%
San Joaquin 92% 5%
Stanislaus 92% 5%
Tulare 92% 41%
Average 250K-1 Million1
89% 39%
Kings 92% 14%
Madera 100% 3%
Merced 100% 11%
Average <250K2 77% 16%
SJV Average 95% 16%
* Percent performed is from Average for All California Counties. Service list available1 San Francisco, San Luis Obispo, Santa Barbara, Santa Cruz, Sonoma, Ventura2 El Dorado, Humboldt, Imperial, Lake, Mendocino, Napa, Nevada, San Benito,
Shasta, Tuolumne, Yolo
Also shown in Table 1 are comparisons of local contributions to population public health between the SJV counties and their population peers. Both mid-sized and small San Joaquin Valley counties received a lower percentage of total population health revenue and a far lower per capita than the average of their peers. Again there was significant variation among the peer counties with Imperial, Lake, Napa, Nevada, San Benito, Shasta, and Yolo joining Madera, Kings, Tulare and Fresno with local expenditures at $5 less per capita.As shown in Table 2, this lower level of funding did not diminish the scope of public health services SJV counties reported performing in 2010 compared to their population peer counties. SJV counties reported performing over 95% of the 12 most commonly performed services (such as: Adult and child immunization, HIV/AIDs screening, TB screening, MCH services, and vital records) compared to averages of 89% and 77% for the mid-
sized and smaller peer counties. SJV counties also tended to perform a slightly lower proportion of the 37 low frequency services (such as, STD treatment, Family planning, and epidemiology- non-communicable) compared to 39% and 16% for the mid-size and smaller peer counties (see Case Report for example).
Operational and Statutory Capacity of Local Health Departments in the San Joaquin Valley
8
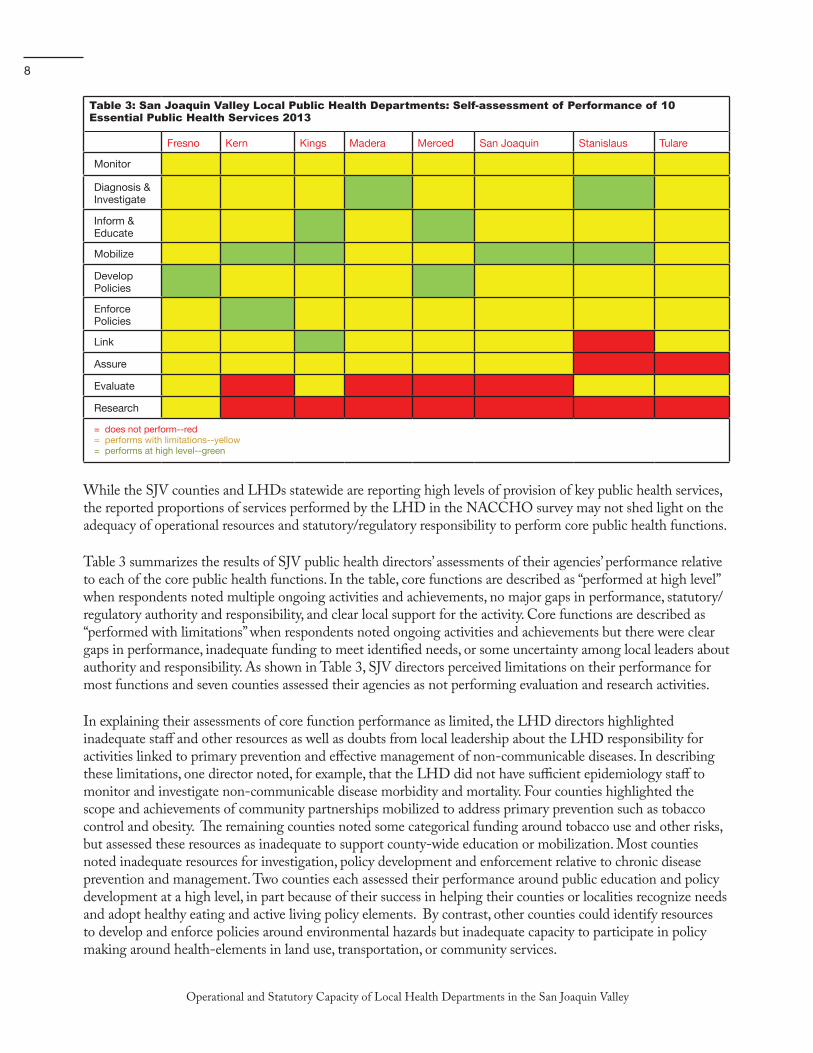
Table 3: San Joaquin Valley Local Public Health Departments: Self-assessment of Performance of 10 Essential Public Health Services 2013
Fresno Kern Kings Madera Merced San Joaquin Stanislaus Tulare
Monitor
Diagnosis & Investigate
Inform & Educate
Mobilize
Develop Policies
Enforce Policies
Link
Assure
Evaluate
Research
= does not perform--red= performs with limitations--yellow= performs at high level--green
While the SJV counties and LHDs statewide are reporting high levels of provision of key public health services, the reported proportions of services performed by the LHD in the NACCHO survey may not shed light on the adequacy of operational resources and statutory/regulatory responsibility to perform core public health functions.
Table 3 summarizes the results of SJV public health directors’ assessments of their agencies’ performance relative to each of the core public health functions. In the table, core functions are described as “performed at high level” when respondents noted multiple ongoing activities and achievements, no major gaps in performance, statutory/regulatory authority and responsibility, and clear local support for the activity. Core functions are described as “performed with limitations” when respondents noted ongoing activities and achievements but there were clear gaps in performance, inadequate funding to meet identified needs, or some uncertainty among local leaders about authority and responsibility. As shown in Table 3, SJV directors perceived limitations on their performance for most functions and seven counties assessed their agencies as not performing evaluation and research activities.
In explaining their assessments of core function performance as limited, the LHD directors highlighted inadequate staff and other resources as well as doubts from local leadership about the LHD responsibility for activities linked to primary prevention and effective management of non-communicable diseases. In describing these limitations, one director noted, for example, that the LHD did not have sufficient epidemiology staff to monitor and investigate non-communicable disease morbidity and mortality. Four counties highlighted the scope and achievements of community partnerships mobilized to address primary prevention such as tobacco control and obesity. The remaining counties noted some categorical funding around tobacco use and other risks, but assessed these resources as inadequate to support county-wide education or mobilization. Most counties noted inadequate resources for investigation, policy development and enforcement relative to chronic disease prevention and management. Two counties each assessed their performance around public education and policy development at a high level, in part because of their success in helping their counties or localities recognize needs and adopt healthy eating and active living policy elements. By contrast, other counties could identify resources to develop and enforce policies around environmental hazards but inadequate capacity to participate in policy making around health-elements in land use, transportation, or community services.
San Joaquin Valley Public Health Consortium
9
SUMMARY AND RECOMMENDATIONS
There is broad agreement that California’s future economic well-being and qualities of life rest on achieving the dual goals of promoting population health and reducing the costs associated with chronic disease. Central to obtaining both goals and realizing the full potential of the Affordable Care Act are thriving public health initiatives that address the community, environmental, and policy as well as cultural and attitudinal determinants of chronic conditions. Increased access to health services alone has been deemed insufficient to yield population level shifts in epidemics such as heart disease, diabetes, and asthma. The brief sheds some light on two questions:
1) How does fiscal/operational capacity differ for SJV LHDs compared to LHDs in similar size California counties? This brief shows that SJV counties, despite their high levels of poverty and relatively poorer health outcomes are receiving less in state/federal population health revenues compared to other counties with similar population size. Although SJV counties report an impressive range of public health activities, relative to their peers, county directors often assess their performance of these as less than needed by their communities because of inadequate staffing levels and other resources.
2) How do current resources and statutes influence the capacity of SJV LHDs to address the 10 essential public health services in context of new expectations to address chronic disease? Despite the importance of non-communicable disease primary prevention initiatives, California statutes and regulations fail to establish an expectation that LHDs prioritize these concerns. Provisions of these activities are not made explicit responsibilities in statute nor are they supported in current state/federal funding directed to the counties.
As California implements both the Affordable Care Act and budget reduction initiatives, there have been calls to review and adjust the relationships between the state and the counties with respect to roles in financing and delivery of personal health care services. This brief indicates the need for a broader discussion of LHD roles and better alignment between new expectations to prevent and manage non-communicable diseases, public health statutes and regulations, and LHD financing for population health activities. Several recommendations are suggested by these findings, including:
Education of local leaders on emerging roles
This briefing paper shows that the SJV public health agencies are receiving less on average in local revenue than their population size peer counties. It also shows that SJV Directors sometimes find relatively little public support and engagement in ensuring adequate funding for population health services and primary prevention activities in particular. The region’s political culture has often emphasized individual responsibility and small government, yet there may be little recognition of the human and economic costs of inadequate attention to public health faced by SJV communities. There is an ongoing need for education and dialogue among diverse regional leaders about the environmental and economic determinants of health. Successful implementation of current federal projects, such as the Community Transformation Grants, and attracting other public and private funding for infrastructure projects and other key development initiatives in the Valley can be strengthened by better shared recognition and planning around potential health consequences.
• AssesstheadequacyofRealignmentprogramfundingandotherpublichealthfundinglevelstoensure local capacity to meet primary prevention needs as well as health care for the uninsured
Most county costs for indigent personal health care and some costs of population public health are financed by California’s Realignment program. By imposing significant cuts to the Realignment program
Operational and Statutory Capacity of Local Health Departments in the San Joaquin Valley
10
in the current and upcoming years, the recently passed budget reflects confidence in the belief that persons receiving local indigent health care will become eligible and enrolled in Medi-Cal or through Covered California, offsetting the need for current levels of state funding for indigent care. Even with a reduced need for local indigent personal health care services, Realignment funding cuts can impact other core public health activities and key services funded through the program as shown in the briefing paper example of funding for TB related services. The planned reductions in Realignment funding appear to neglect the documented need for additional resources in LHDs in the SJV and other California regions to enhance their capacity to promote population health and reduce chronic illness through policy and systems change approaches. Counties with greater proportions of their populations in poverty and those with greater burdens of chronic disease should receive a greater share of remaining funds. Independent of decisions around financing personal health care for indigent populations who remain ineligible, California’s implementation of the ACA presents an opportunity to reinvest funding directed to primary prevention while sustaining traditional public health core functions at consistently high levels statewide.
• Simplifyfundingprocessandcategoricalprograms
The findings suggest the continued value of the 2008 California Performance Review Project recommendations to continue consolidation of federal and state categorical funding from California to the LHDs into simplified application and contracting processes. Program funding consolidation may also be a context to clarify roles in primary prevention of non-communicable disease. While the ongoing initiatives involving LHD and state officials to simplify contracting have identified barriers at multiple levels of government, consolidation of funding and reporting remains an important goal.
• CreategreateralignmentinCaliforniapublichealthstatutes/regulationtoreinforcetheprimaryprevention roles of LHDs in the context of the Affordable Care Act
From a long-term perspective, the success of California’s implementation of the ACA is dependent on building healthy communities with lower rates of chronic health conditions. Without this achievement, reigning in the costs of personal health care will be difficult. Yet our findings suggest that there is notable misalignment of California statutory responsibilities and funding for LHDs and the significant leadership role for LHDs in promoting population health and prevention and effective management of chronic illness through community mobilization, research and evaluation, and policy functions. Like efforts to re-work the responsibilities of California and the counties for financing and delivery of care to indigent populations not insured through the ACA, there is an equally important need to clarify responsibility.
San Joaquin Valley Public Health Consortium
11
CASE REPORT: Realignment & Tuberculosis Services in the San Joaquin Valley
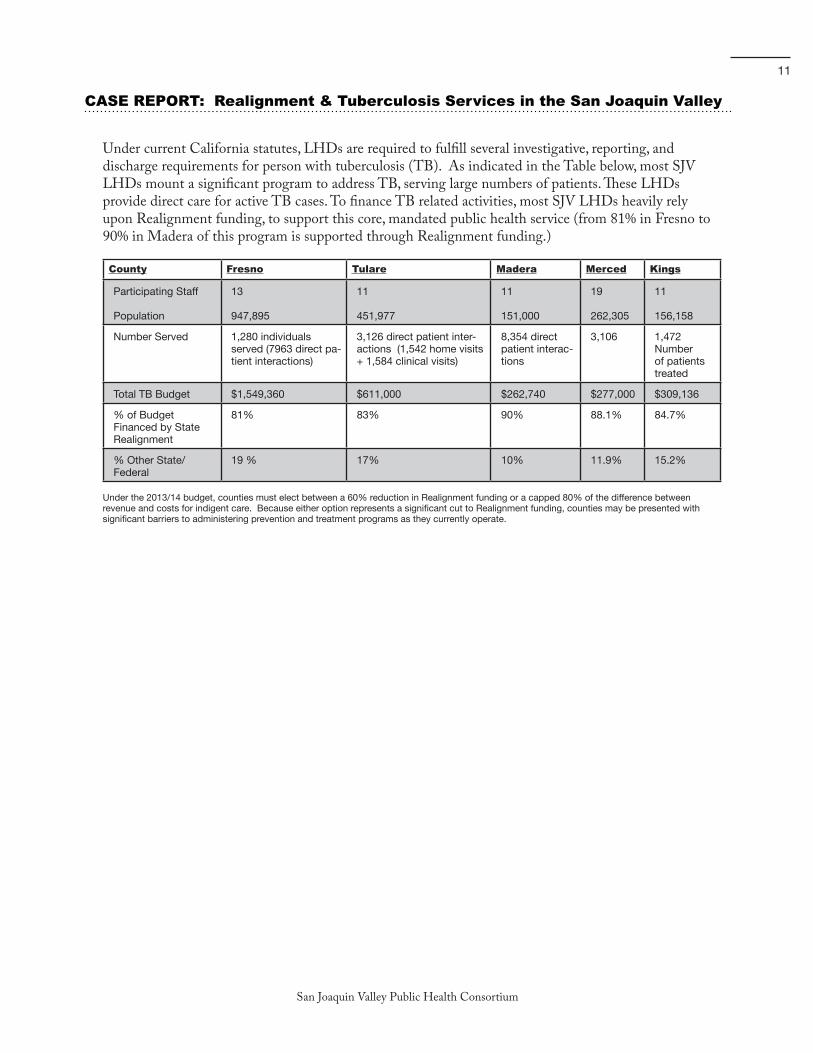
Under current California statutes, LHDs are required to fulfill several investigative, reporting, and discharge requirements for person with tuberculosis (TB). As indicated in the Table below, most SJV LHDs mount a significant program to address TB, serving large numbers of patients. These LHDs provide direct care for active TB cases. To finance TB related activities, most SJV LHDs heavily rely upon Realignment funding, to support this core, mandated public health service (from 81% in Fresno to 90% in Madera of this program is supported through Realignment funding.)
County Fresno Tulare Madera Merced Kings
Participating Staff
Population
13
947,895
11
451,977
11
151,000
19
262,305
11
156,158
Number Served 1,280 individuals served (7963 direct pa-tient interactions)
3,126 direct patient inter-actions (1,542 home visits + 1,584 clinical visits)
8,354 direct patient interac-tions
3,106 1,472Number of patients treated
Total TB Budget $1,549,360 $611,000 $262,740 $277,000 $309,136
% of Budget Financed by State Realignment
81% 83% 90% 88.1% 84.7%
% Other State/ Federal
19 % 17% 10% 11.9% 15.2%
Under the 2013/14 budget, counties must elect between a 60% reduction in Realignment funding or a capped 80% of the difference between revenue and costs for indigent care. Because either option represents a significant cut to Realignment funding, counties may be presented with significant barriers to administering prevention and treatment programs as they currently operate.
Operational and Statutory Capacity of Local Health Departments in the San Joaquin Valley
12
REFERENCES
1 IOM (Institute of Medicine). 2012. For the Public’s Health: Investing in a Healthier Future. Washington, DC: The National Academies Press.
2 Trust for America’s Health (2013). Investing In America’s Health: A State-by-State at Public Health Funding and Key Health Facts. Washington,DC. http://www.healthyamericans.org/assets/files/TFAH2013InvstgAmrcsHlth05%20FINAL.pdf
3 California Performance Review Report (2007). http://cpr.ca.gov/CPR_Report/Issues_and_Recommendations/Chapter_2_Health_and_Human_Services/HHS12.html
4 California Department of Finance (2013). Health Care Reform. Sacramento, CA. http://www.ebudget.ca.gov/2013-14/pdf/Enacted/BudgetSummary/HealthCareReform.pdf
5 Connolly J (2013). Redefining The Relationship between California’s State and County Governments: Creating Healthier Communities through Innovative Collaboration and Financing. Insure the Uninsured Project. http://itup.org/wp-content/uploads/downloads/2013/04/StateCo_PubHealth040313.pdf
6 Mays GP, McHugh M, Shim K. et al (2006) “Institute and economic determinants of public health system performance.” American Journal of Public Health, 96(3) 523.531.
7 Erwin PC, Mays GP, and Riley WJ (2012) “Resources that matter: the impact of local health department expenditures on health status.” Public Health Reports.. 127: 89-95.
8 Erwin PC, Greene SB, Mays GP et al (2011. “The association of changes in local health department resources with changes in state-level health outcomes.” American Journal of Public Health.101:609–615..
9 Grembowski D, Bekemeier B, Conrad D/ and Kreuter W. (2010). “Are local health department expenditures related to racial disparities in mortality?” Social Science and Medicine 7(12): 2057-2065,
10 Rodriguez H, Chen J, Owusu-Edusei K. et al. (20100. “Local Public Health Systems and the Incidence of Sexually Transmitted Diseases.” American Journal of Public Health. 102: 1773-1781
11 US Department of Health and Human Services, Centers for Disease Control and Prevention, Core Public Health Functions Steering Committee. National public health performance standards program: Orientation to the essential public health services [slides]. 1994.
12 US Department of Health and Human Services, Centers for Disease Control and Prevention, Core Public Health Functions Steering Committee. National public health performance standards program: Orientation to the essential public health services [slides]. 1994.
13 US Department of Health and Human Services, Centers for Disease Control and Prevention. (2008) National Public Health Performance Standards Project. Local Public Health System Performance Assessment, Instrument Version 2.0. http://www.cdc.gov/od/ocphp/nphpsp/documents/07_110300%20Local%20Booklet.pdf
14 Public Health Accreditation Board. (2011). Standards and Measures: Version 1.0. Alexandria, VA. http://www.phaboard.org/wp-content/uploads/PHAB-Standards-and-Measures-Version-1.0.pdf
15 California Strategic Growth Council. (2010) Health in All Policies Task Force: Report to the Strategic Growth Council. Sacramento. CA. http://www.sgc.ca.gov/hiap/docs/publications/HiAP_Task_Force_Report.pdf
16 California Department of Public Health, Safe and Active Communities Branch (2010). Filling the Gaps: Strategic Directions for a Safe California 2010-2014. Sacramento, CA.
17 Table 1 summary of California statutory and regulatory requirements for LHDs is based on a 2012 summary by California Department of Public Health Assistant Chief Council. It should be noted that County Counsels may interpret requirements differently and there may be ongoing policy changes not reflected.


Central California Center for Health and Human Services1625 East Shaw Avenue, Suite 146
Fresno, CA 93710-8106Phone: 559.228.2150 Fax: 559.228.2168
www.cvhpi.org