operational forum meeting - national grid plc
TRANSCRIPT

Place your chosen image
here. The four corners
must just cover the
arrow tips. For covers,
the three pictures should
be the same size and in a
straight line.
Operational Forum Meeting
16 November 2016, 10:30AM
Radisson Grafton Hotel, 130 Tottenham Court Road, London.
1
Place your chosen image
here. The four corners
must just cover the
arrow tips. For covers,
the three pictures should
be the same size and in a
straight line.
System Management Principles Statement
Summary of balancing actions and breaches for September and October 2016
Performance compared to last year
2
3
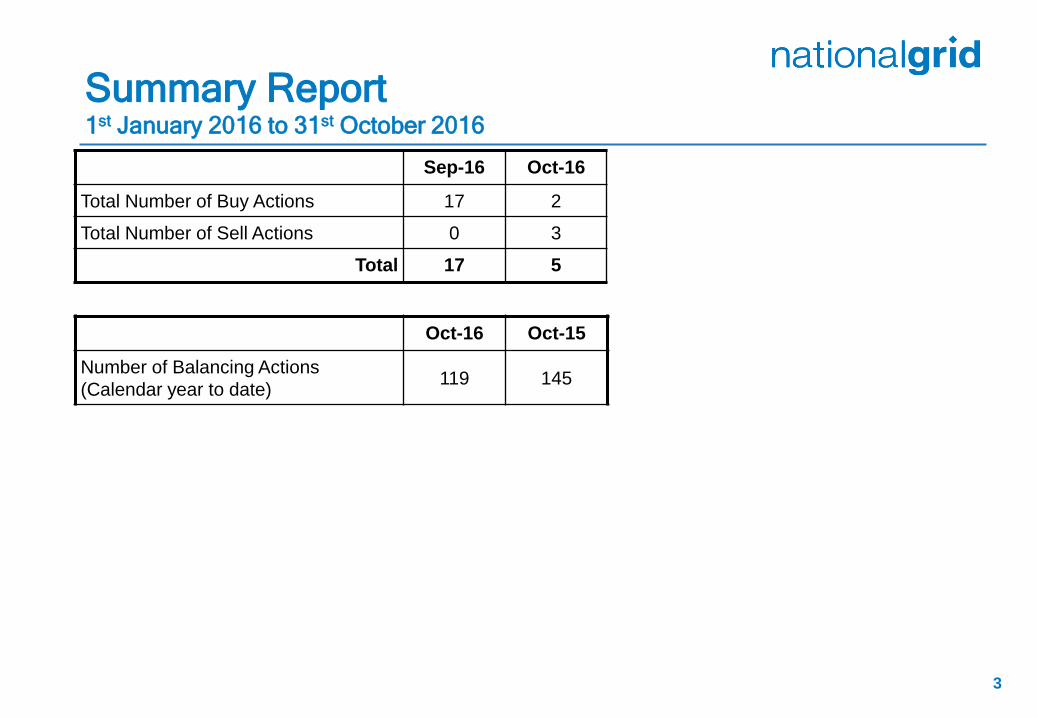
1st January 2016 to 31st October 2016
Summary Report
Sep-16 Oct-16
Total Number of Buy Actions 17 2
Total Number of Sell Actions 0 3
Total 17 5
Oct-16 Oct-15
Number of Balancing Actions
(Calendar year to date) 119 145
Place your chosen image
here. The four corners
must just cover the
arrow tips. For covers,
the three pictures should
be the same size and in a
straight line.
Operational Overview
4
Place your chosen image
here. The four corners
must just cover the
arrow tips. For covers,
the three pictures should
be the same size and in a
straight line.
Demands
6
6
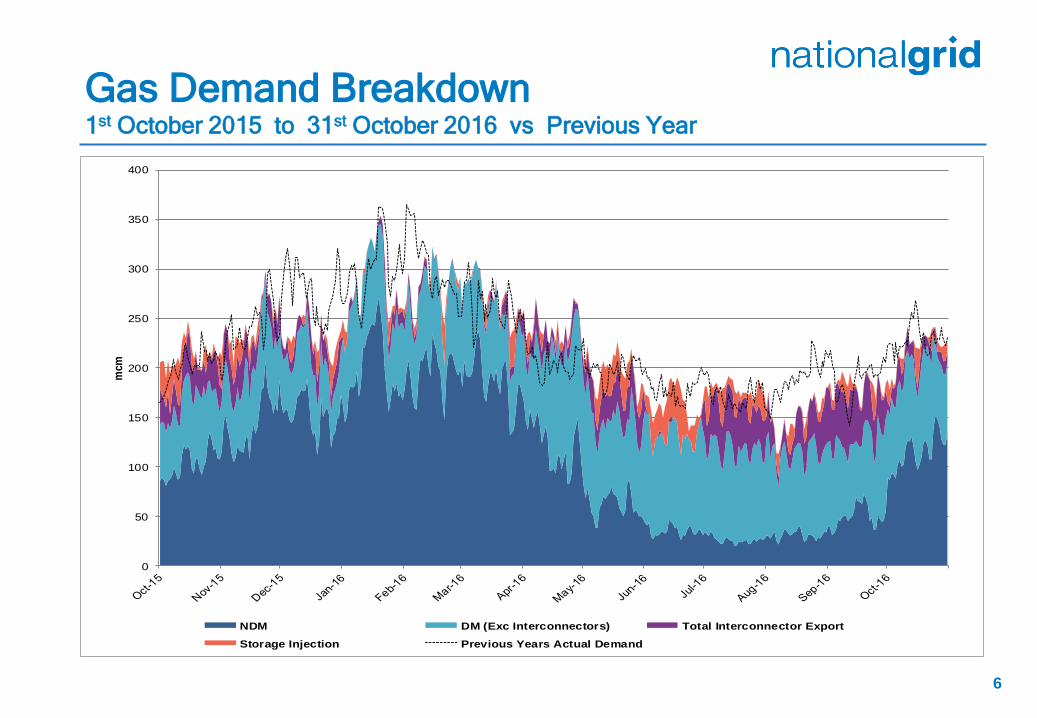
1st October 2015 to 31st October 2016 vs Previous Year
Gas Demand Breakdown
0
50
100
150
200
250
300
350
400
mcm
NDM DM (Exc Interconnectors) Total Interconnector Export
Storage Injection Previous Years Actual Demand

47% 44%
63%57%
51% 50% 52%
22%24%
17%
17%22%
18%
29%
23% 25%
8%
12% 15%20%
10%
5% 3%6% 11% 7% 8% 4%
4% 5% 5% 4% 4% 4% 5%
0%
10%
20%
30%
40%
50%
60%
70%
80%
90%
100%
2010 2011 2012 2013 2014 2015 2016
7
1st October to 31st October 2016 vs Same Period in Previous Years
Gas Demand Breakdown
Interconnector demand increased
slightly with a similar reduction seen
in LDZ demand
Interconnectors Power Station Industrial LDZ Storage
8
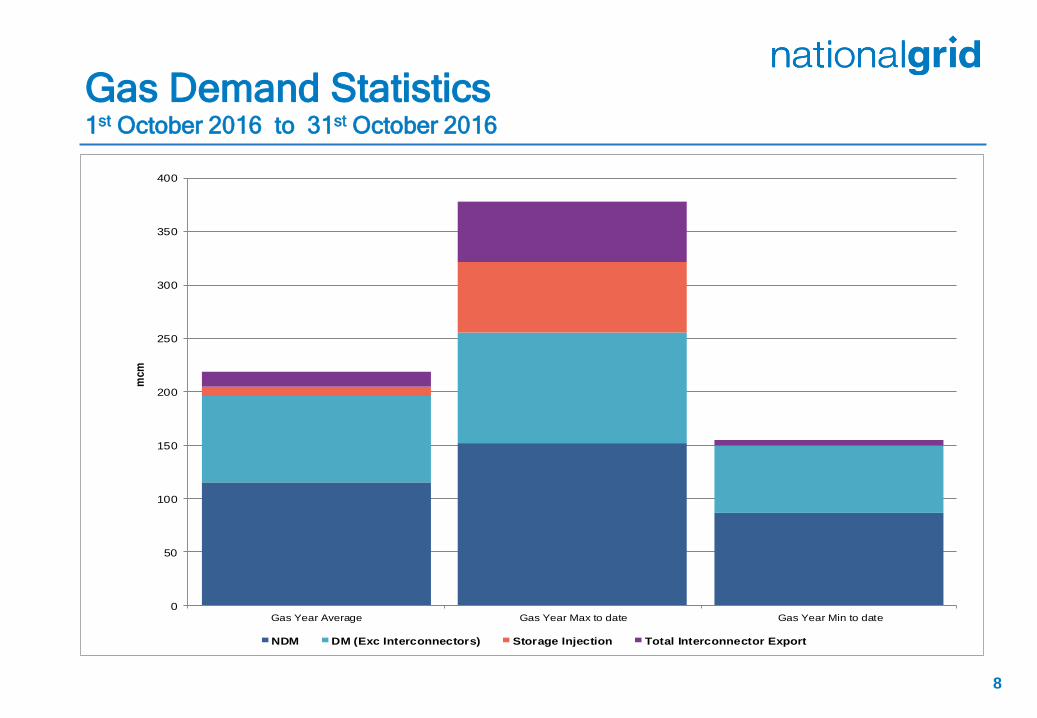
1st October 2016 to 31st October 2016
Gas Demand Statistics
0
50
100
150
200
250
300
350
400
Gas Year Average Gas Year Max to date Gas Year Min to date
mcm
NDM DM (Exc Interconnectors) Storage Injection Total Interconnector Export
9
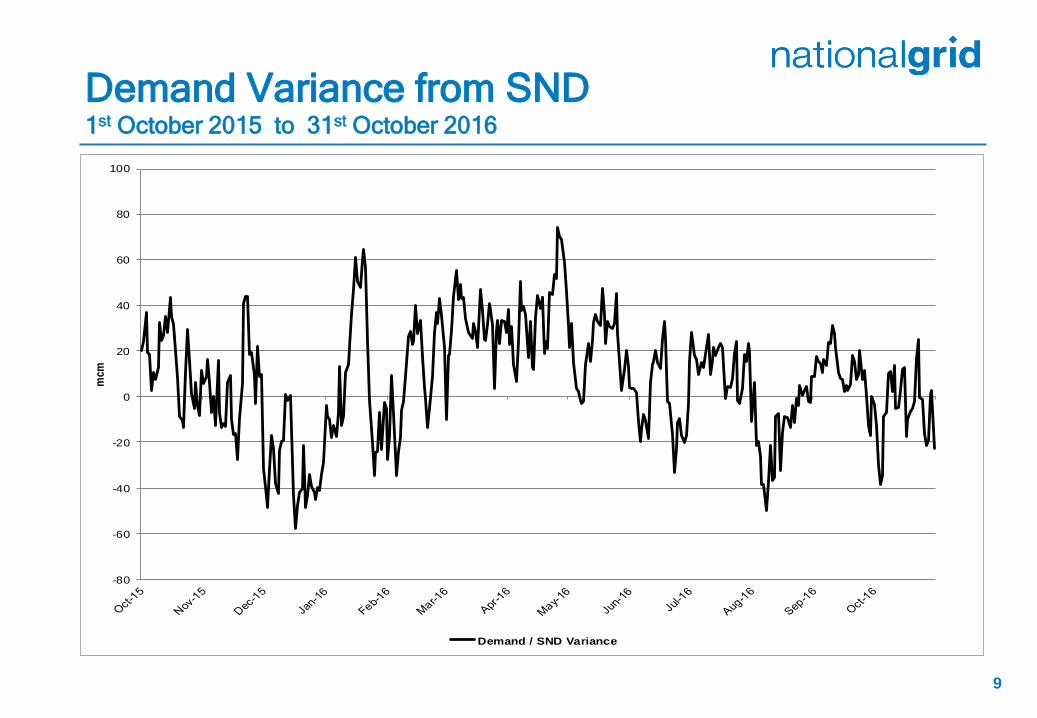
1st October 2015 to 31st October 2016
Demand Variance from SND
-80
-60
-40
-20
0
20
40
60
80
100
mcm
Demand / SND Variance

10
1st October 2015 to 31st October 2016
Gas Demand Vs SND / Cold / Warm
0
50
100
150
200
250
300
350
400
mcm
Total Demand SND Cold Warm
11
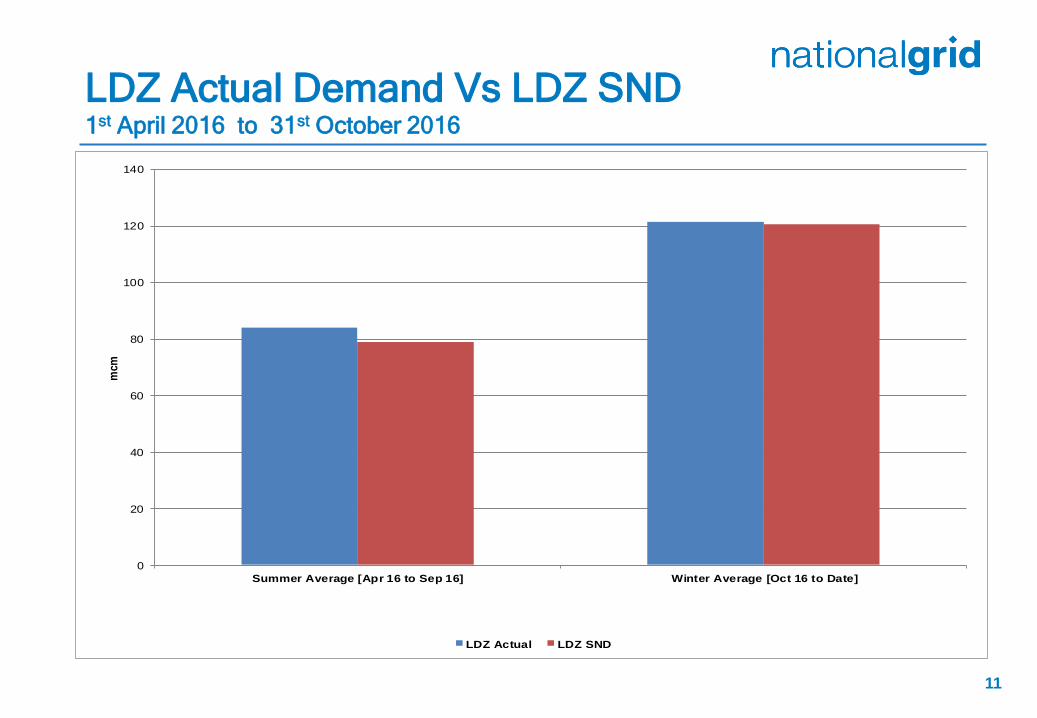
1st April 2016 to 31st October 2016
LDZ Actual Demand Vs LDZ SND
0
20
40
60
80
100
120
140
Summer Average [Apr 16 to Sep 16] Winter Average [Oct 16 to Date]
mcm
LDZ Actual LDZ SND
12
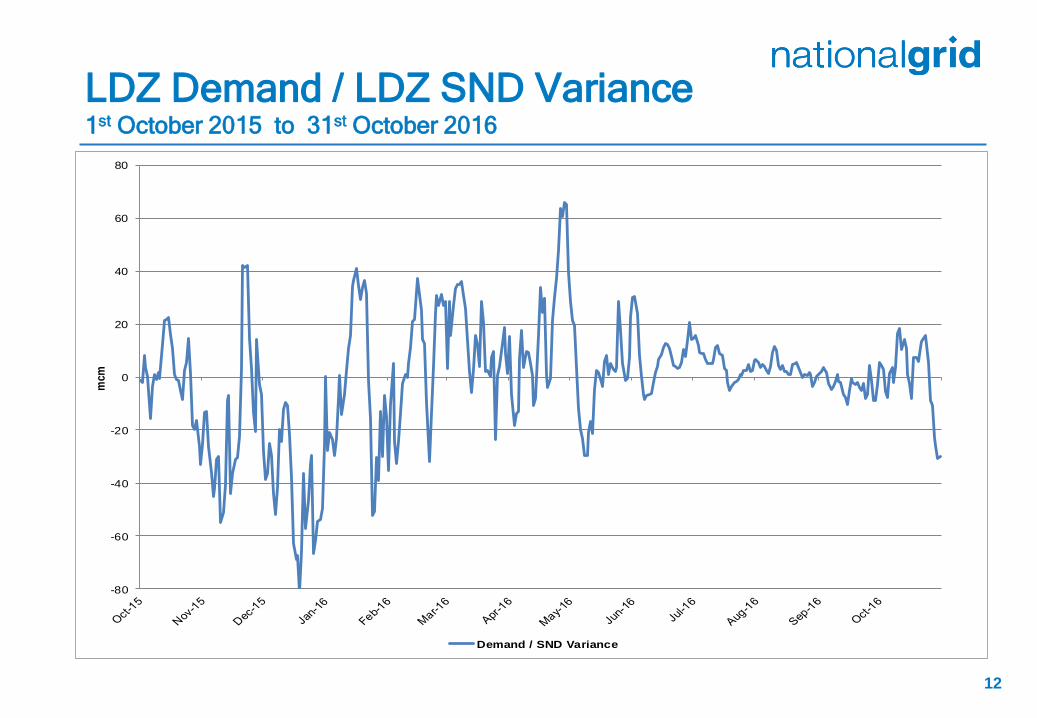
1st October 2015 to 31st October 2016
LDZ Demand / LDZ SND Variance
-80
-60
-40
-20
0
20
40
60
80
mcm
Demand / SND Variance

13
1st October 2015 to 31st October 2016
Gas Consumption for Power Generation
0
10
20
30
40
50
60
70
80
90
mcm
Actual for Power Generation Previous Year
Place your chosen image
here. The four corners
must just cover the
arrow tips. For covers,
the three pictures should
be the same size and in a
straight line.
Supplies
14
15
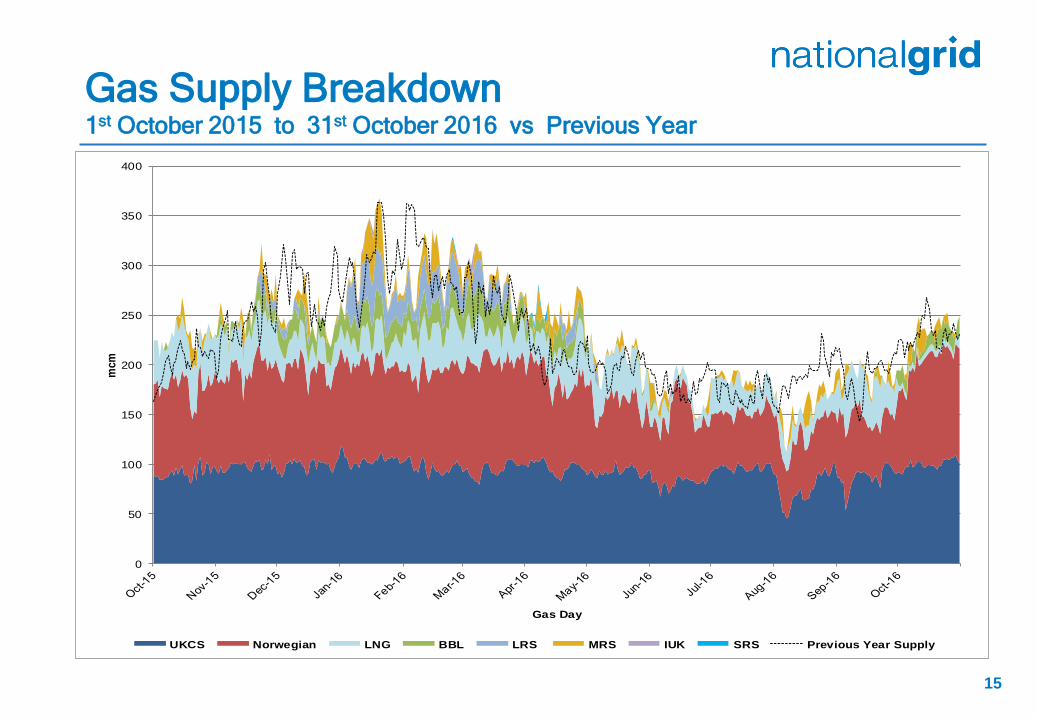
1st October 2015 to 31st October 2016 vs Previous Year
Gas Supply Breakdown
0
50
100
150
200
250
300
350
400
mcm
Gas Day
UKCS Norwegian LNG BBL LRS MRS IUK SRS Previous Year Supply
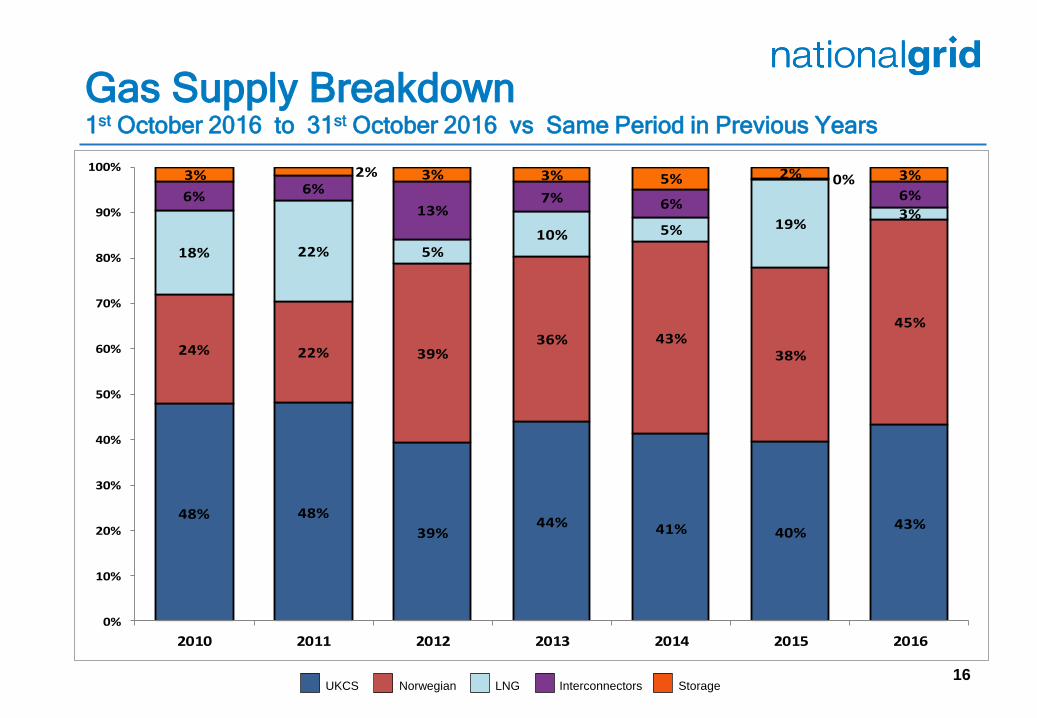
48% 48%
39%44% 41% 40%
43%
24% 22% 39%36% 43%
38%
45%
18% 22% 5%10% 5% 19%
3%6%
6%
13%7% 6%
0%6%
3% 2% 3% 3% 5% 2% 3%
0%
10%
20%
30%
40%
50%
60%
70%
80%
90%
100%
2010 2011 2012 2013 2014 2015 2016
16
1st October 2016 to 31st October 2016 vs Same Period in Previous Years
Gas Supply Breakdown
Interconnectors UKCS LNG Norwegian Storage
17
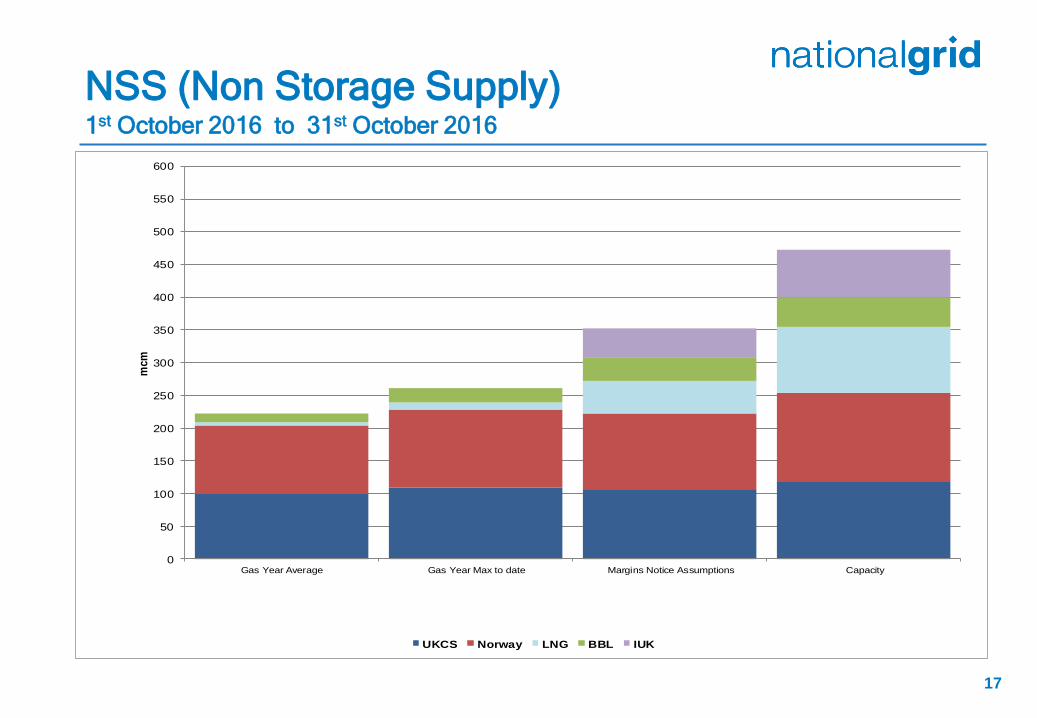
1st October 2016 to 31st October 2016
NSS (Non Storage Supply)
0
50
100
150
200
250
300
350
400
450
500
550
600
Gas Year Average Gas Year Max to date Margins Notice Assumptions Capacity
mcm
UKCS Norway LNG BBL IUK
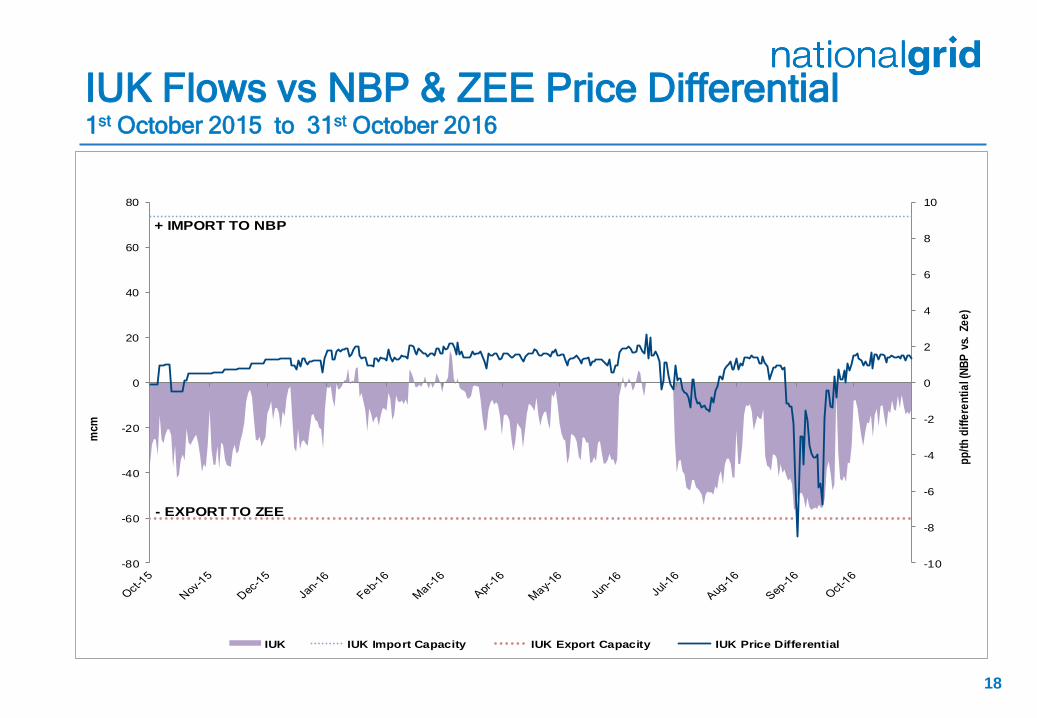
18
1st October 2015 to 31st October 2016
IUK Flows vs NBP & ZEE Price Differential
-10
-8
-6
-4
-2
0
2
4
6
8
10
-80
-60
-40
-20
0
20
40
60
80
pp
/th
dif
fere
nti
al (
NB
P v
s. Z
ee
)
mcm
IUK IUK Import Capacity IUK Export Capacity IUK Price Differential
+ IMPORT TO NBP
- EXPORT TO ZEE
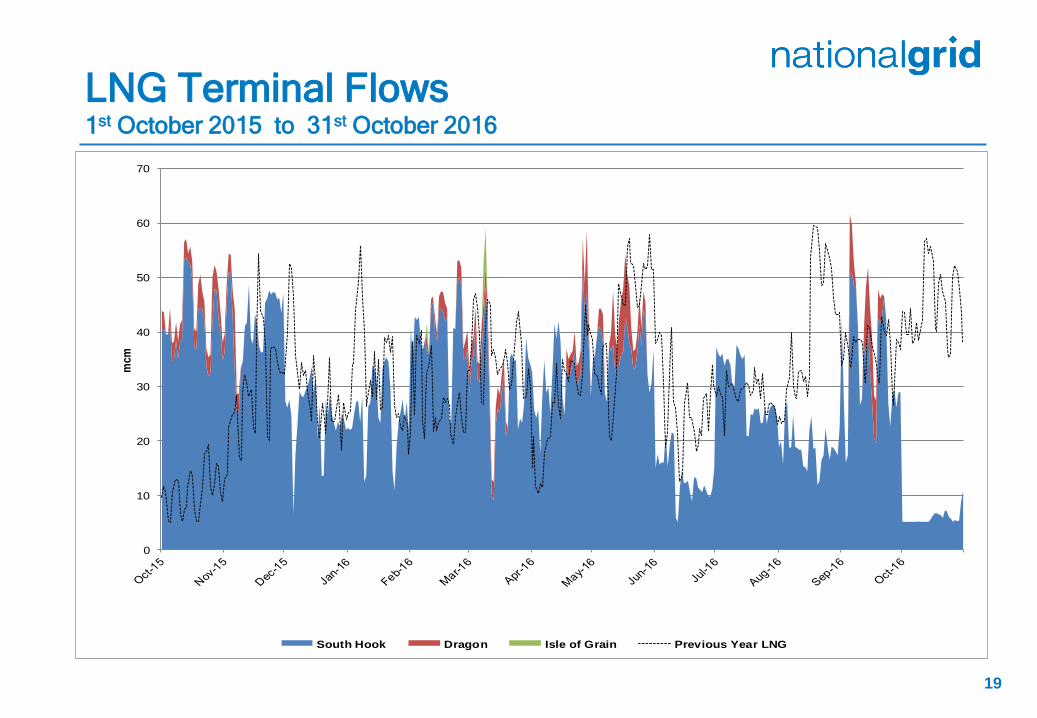
19
1st October 2015 to 31st October 2016
LNG Terminal Flows
0
10
20
30
40
50
60
70
mcm
South Hook Dragon Isle of Grain Previous Year LNG
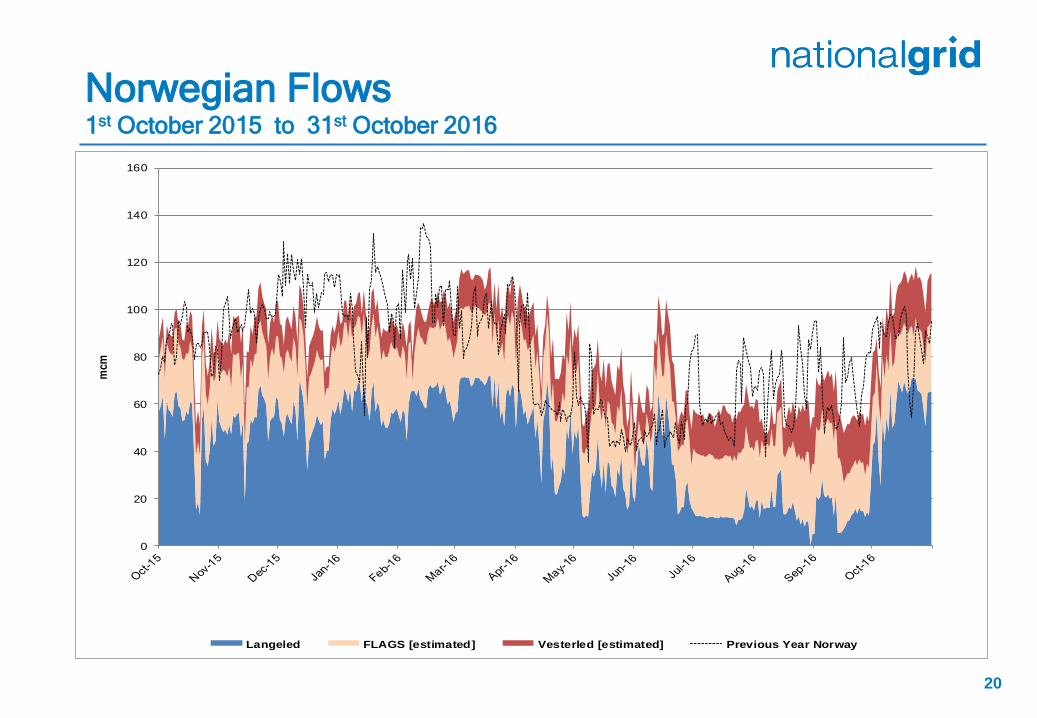
20
1st October 2015 to 31st October 2016
Norwegian Flows
0
20
40
60
80
100
120
140
160
mcm
Langeled FLAGS [estimated] Vesterled [estimated] Previous Year Norway
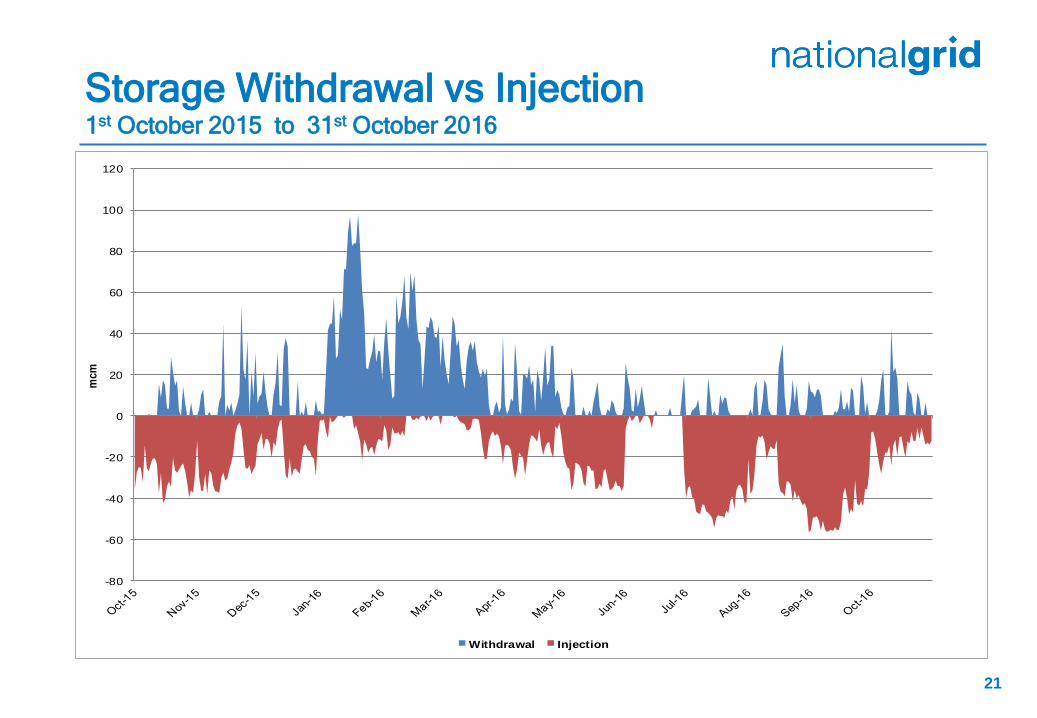
21
1st October 2015 to 31st October 2016
Storage Withdrawal vs Injection
-80
-60
-40
-20
0
20
40
60
80
100
120
mcm
Withdrawal Injection
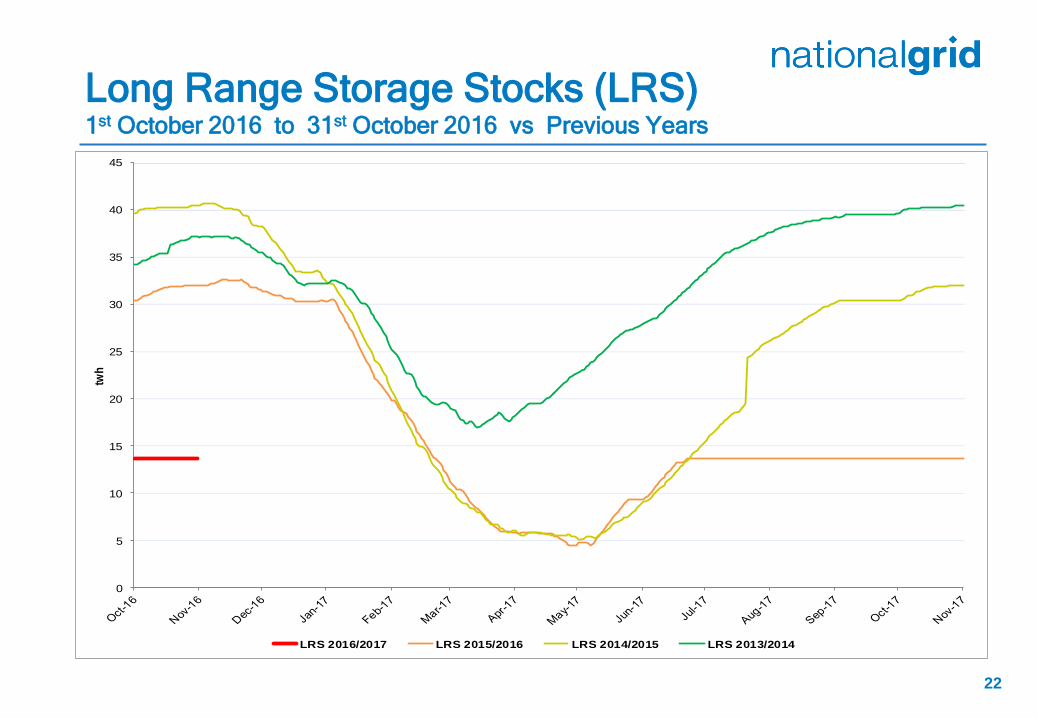
22
1st October 2016 to 31st October 2016 vs Previous Years
Long Range Storage Stocks (LRS)
0
5
10
15
20
25
30
35
40
45
twh
LRS 2016/2017 LRS 2015/2016 LRS 2014/2015 LRS 2013/2014

23
1st October 2016 to 31st October 2016 vs Previous Years
Medium Range Storage Stocks (MRS)
0
2
4
6
8
10
12
14
16
twh
MRS 2016/2017 MRS 2015/2016 MRS 2014/2015 MRS 2013/2014
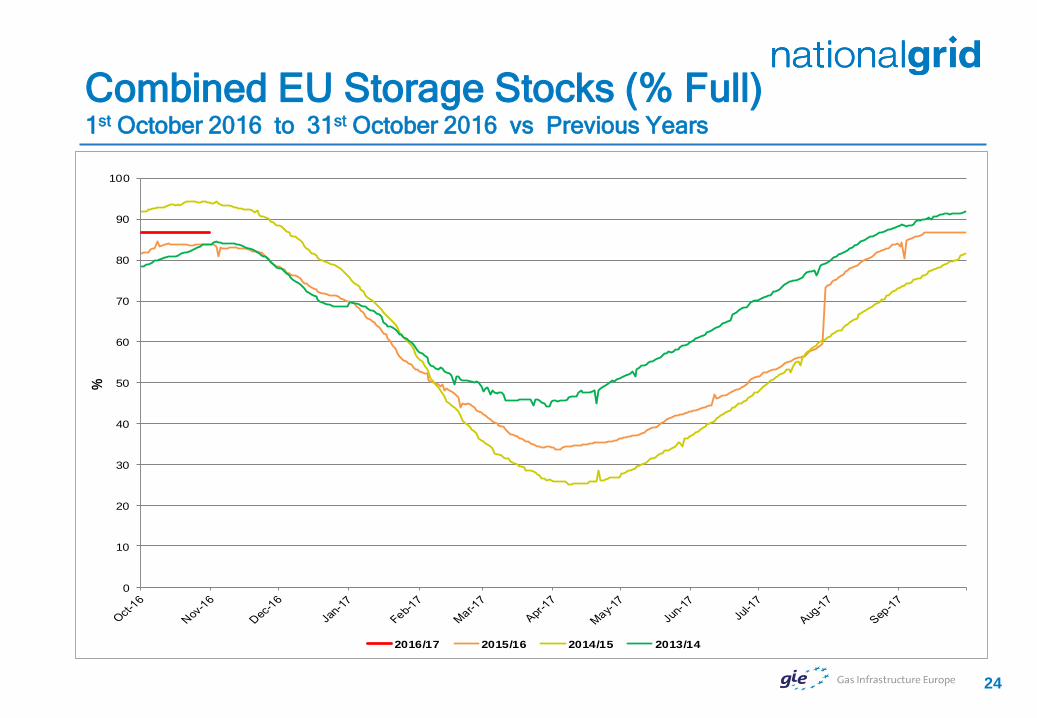
24
1st October 2016 to 31st October 2016 vs Previous Years
Combined EU Storage Stocks (% Full)
0
10
20
30
40
50
60
70
80
90
100
%
2016/17 2015/16 2014/15 2013/14
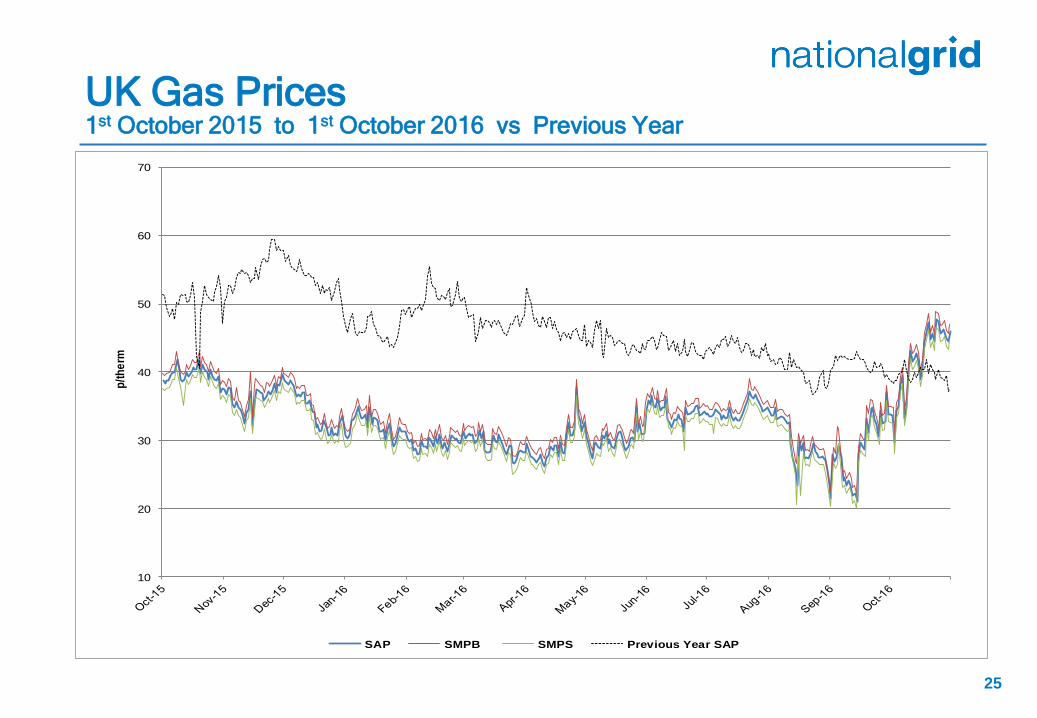
25
1st October 2015 to 1st October 2016 vs Previous Year UK Gas Prices
10
20
30
40
50
60
70
p/t
he
rm
SAP SMPB SMPS Previous Year SAP
26
What Operational Issues Affected Users?

Place your chosen image
here. The four corners
must just cover the
arrow tips. For covers,
the three pictures should
be the same size and in a
straight line.
Transporter Actions and Neutrality
Energy Balancing
Capacity
28

28
October 2015 to October 2016 vs Previous Year
Transporter Energy Traded on the OCM NGG Monthly Buys and Sells
-700
-600
-500
-400
-300
-200
-100
0
100
200
300
400
500
600
700
-700
-600
-500
-400
-300
-200
-100
0
100
200
300
400
500
600
700
Gw
h
Buy 2015/16 Buy Prev Year Sell 2015/16 Sell Prev Year

29
October 2015 to October 2016
Days of Default SMP Prices (SMPB)
0
10
20
30
40
50
60
70
80
90
100
%
SMPB [NG Set Price] SMPB [Default Marginal]
30
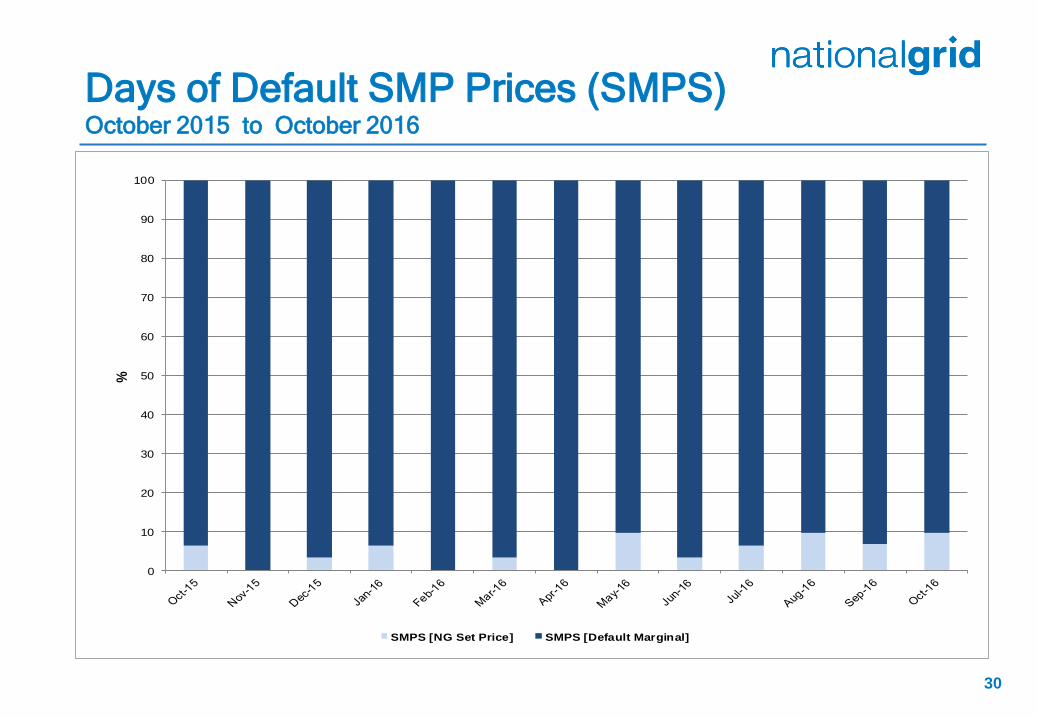
October 2015 to October 2016
Days of Default SMP Prices (SMPS)
0
10
20
30
40
50
60
70
80
90
100
%
SMPS [NG Set Price] SMPS [Default Marginal]
17,449,223
519,749
1,636,378
14,783,287
3,688,152
0
5,000,000
10,000,000
15,000,000
20,000,000
25,000,000
Credits Debits
£
31
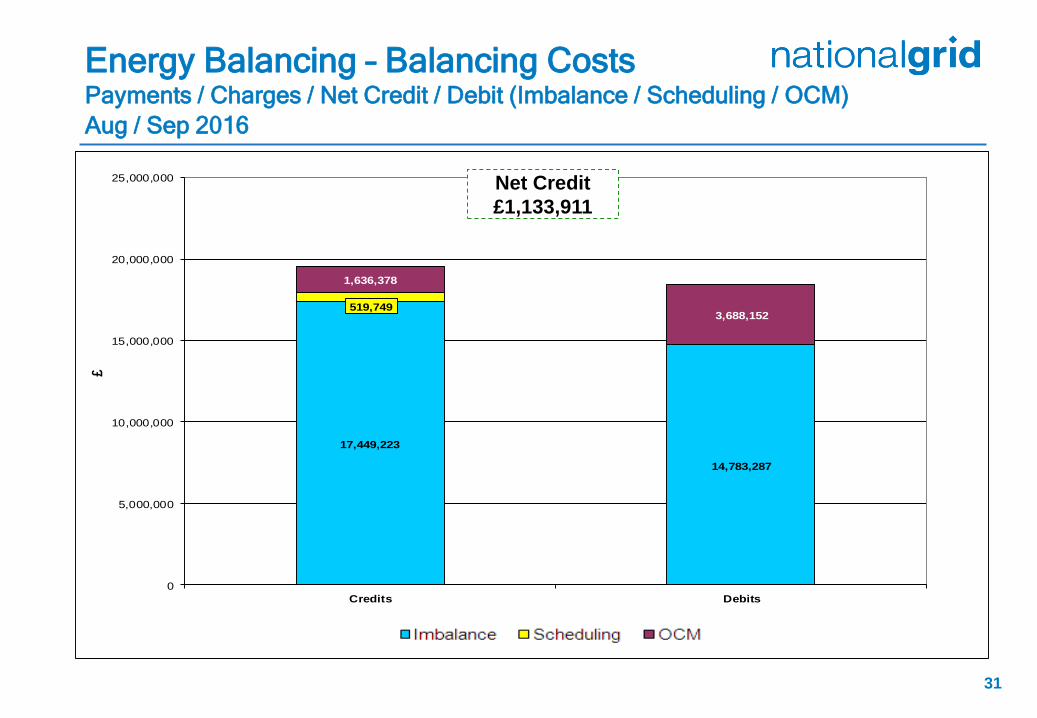
Aug / Sep 2016
Energy Balancing – Balancing Costs Payments / Charges / Net Credit / Debit (Imbalance / Scheduling / OCM)
Net Credit
£1,133,911
32
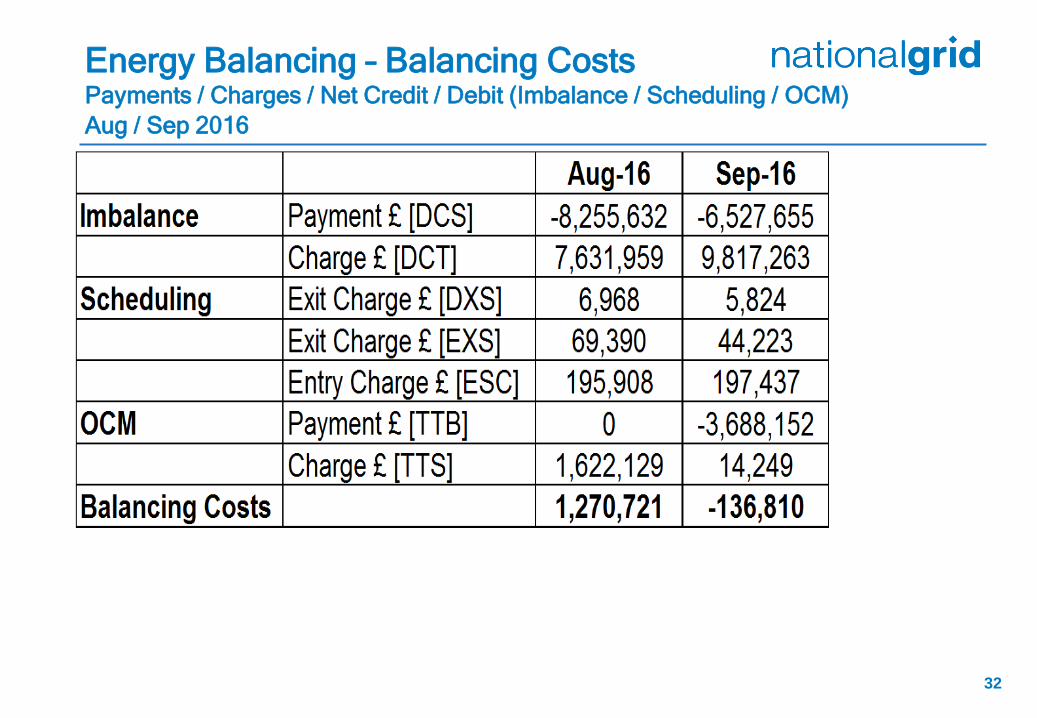
Aug / Sep 2016
Energy Balancing – Balancing Costs Payments / Charges / Net Credit / Debit (Imbalance / Scheduling / OCM)
33
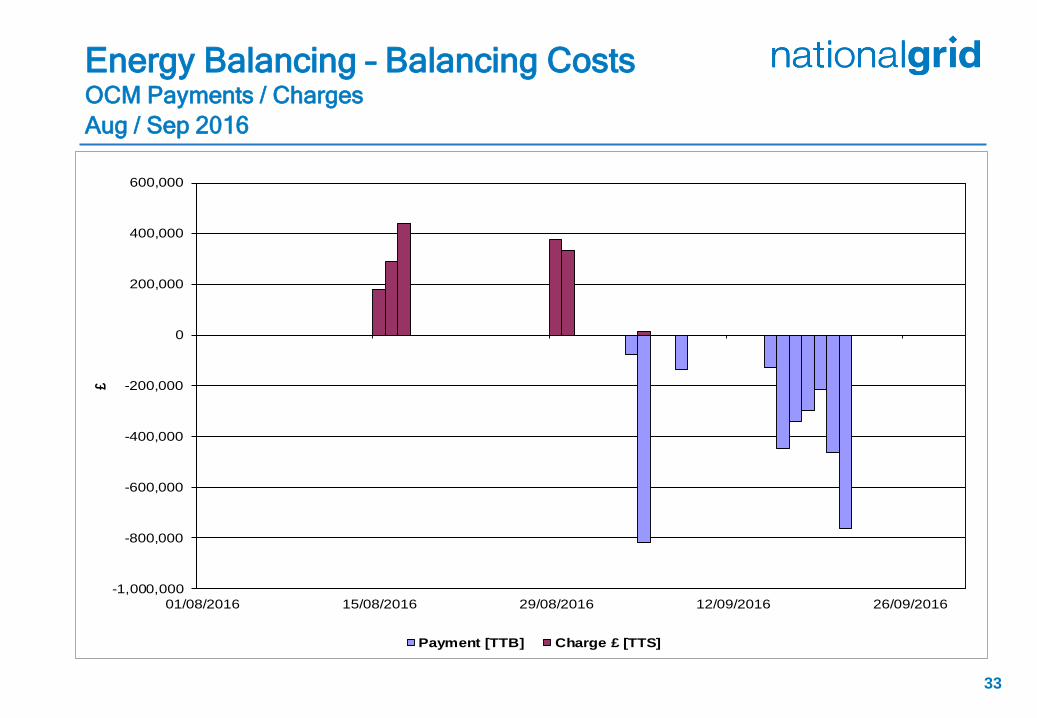
Aug / Sep 2016
Energy Balancing – Balancing Costs OCM Payments / Charges
-1,000,000
-800,000
-600,000
-400,000
-200,000
0
200,000
400,000
600,000
01/08/2016 15/08/2016 29/08/2016 12/09/2016 26/09/2016
£
Payment [TTB] Charge £ [TTS]
34
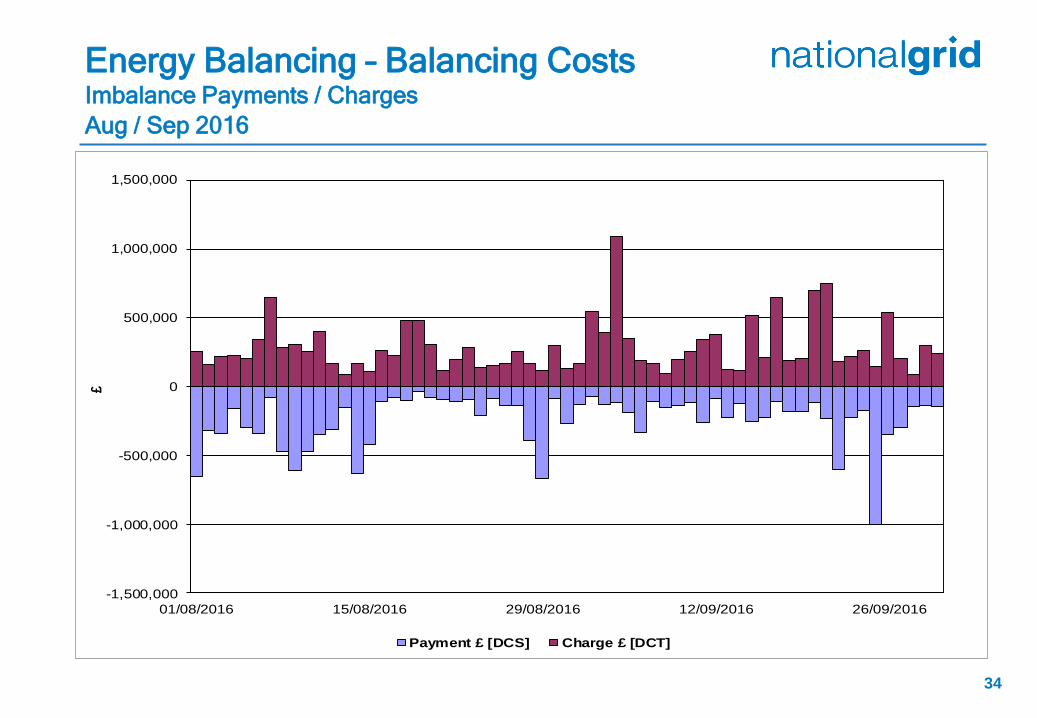
Aug / Sep 2016
Energy Balancing – Balancing Costs Imbalance Payments / Charges
-1,500,000
-1,000,000
-500,000
0
500,000
1,000,000
1,500,000
01/08/2016 15/08/2016 29/08/2016 12/09/2016 26/09/2016
£
Payment £ [DCS] Charge £ [DCT]
35
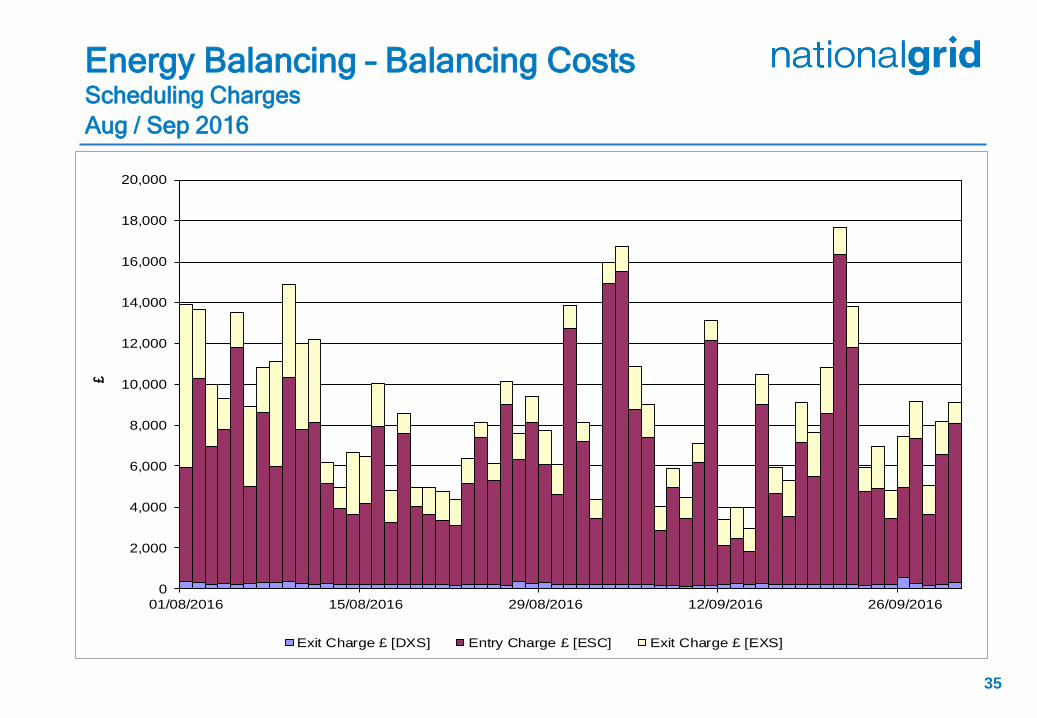
Aug / Sep 2016
Energy Balancing – Balancing Costs Scheduling Charges
0
2,000
4,000
6,000
8,000
10,000
12,000
14,000
16,000
18,000
20,000
01/08/2016 15/08/2016 29/08/2016 12/09/2016 26/09/2016
£
DayExit Charge £ [DXS] Entry Charge £ [ESC] Exit Charge £ [EXS]
36
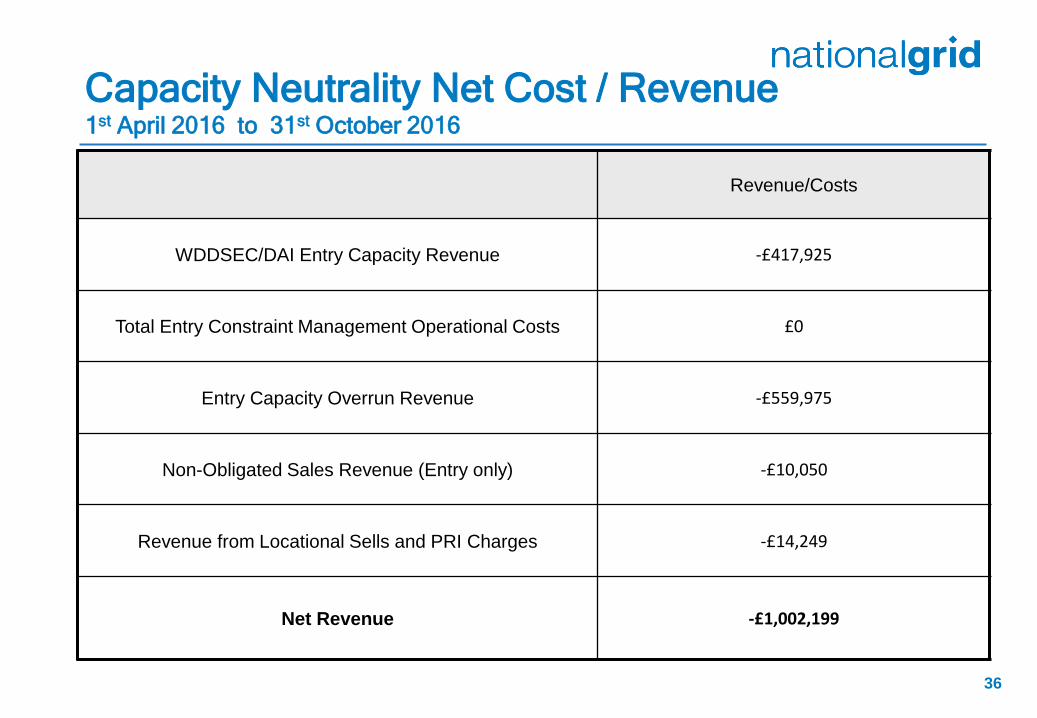
1st April 2016 to 31st October 2016
Capacity Neutrality Net Cost / Revenue
Revenue/Costs
WDDSEC/DAI Entry Capacity Revenue -£417,925
Total Entry Constraint Management Operational Costs £0
Entry Capacity Overrun Revenue -£559,975
Non-Obligated Sales Revenue (Entry only) -£10,050
Revenue from Locational Sells and PRI Charges -£14,249
Net Revenue -£1,002,199
37
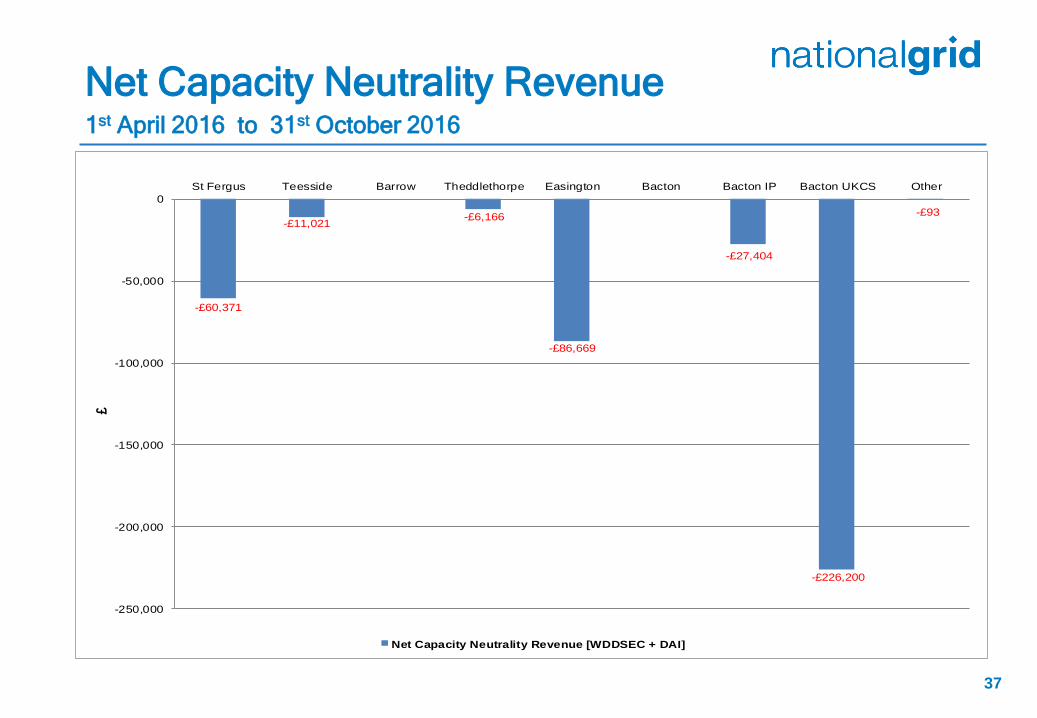
1st April 2016 to 31st October 2016
Net Capacity Neutrality Revenue
-£60,371
-£11,021-£6,166
-£86,669
-£27,404
-£226,200
-£93
-250,000
-200,000
-150,000
-100,000
-50,000
0
St Fergus Teesside Barrow Theddlethorpe Easington Bacton Bacton IP Bacton UKCS Other
£
Net Capacity Neutrality Revenue [WDDSEC + DAI]

38
1st April 2016 to 31st October 2016
Month Locational Sells and PRI
charges revenue
Apr-16 £0
May-16 £0
Jun-16 £0
Jul-16 £0
Aug-16 £0
Sep-16 -£14,249
Oct-16 £0
Nov-16
Dec-16
Jan-17
Feb-17
Mar-17
Total £0 (FY16/17)
Month Entry Cap Overrun
Revenue
Non-obligated sales
revenue (entry)
Apr-16 -£110,246 -£148
May-16 -£79,691 -£21
Jun-16 -£193,290 -£188
Jul-16 £-59,400 -£1,740
Aug-16 -£78,428 -£32
Sep-16 -£38,921 -£495
Oct-16 £0 -£7,426
Nov-16
Dec-16
Jan-17
Feb-17
Mar-17
Total -£559,975 (FY16-17) -£10,050 (FY16-17)
Capacity Neutrality