operational modal analysis of operating wind turbines ... · operational modal analysis of...
TRANSCRIPT

XXIX International Modal Anaylsis Conference (2011), Jacksonville, FL 1
Operational Modal Analysis of Operating Wind Turbines: Application to Measured
Data
S. Chauhan+, D. Tcherniak+, Jon Basurko#, Oscar Salgado#, Iker Urresti#
Carlo E. Carcangiu‡, Michele Rossetti‡
+ Bruel & Kjaer Sound and Vibration Measurement A/S
Skodsborgvej 307, DK-2850, Naerum, Denmark
‡ Alstom Wind, Spain
# Ikerlan-IK4, Spain
Email: [email protected]
ABSTRACT
Previous works by the authors have shown that though Operational Modal Analysis (OMA) techniques are suitable for global
dynamic analysis of a wind turbine under parked conditions, there are several issues in their application to operational wind
turbines. These issues including time varying nature of the structure, presence of harmonic content in the loading (due to
rotor rotation), considerable aerodynamic damping etc. prevent straightforward application of OMA to operational wind
turbines. The authors have further proposed a strategy to combat these issues and modify OMA methodology to tune it for
operational wind turbines. A successful implementation of this strategy was employed and demonstrated to work
satisfactorily on simulated vibration response data for a 3MW wind turbine.
Work presented in the current paper in an extension of the pervious work and describes the details of the measurement
campaign aimed at identifying modal parameters of ALSTOM’s ECO 100 wind turbine. Since measuring on an operational
wind turbine is a challenging job in itself, the paper also describes measurement planning and execution phases. The paper
illustrates various key aspects related to practical measurements on an actual wind turbine and underlines the importance of
proper planning and experiment design. The importance of a priori knowledge provided by finite element model based
simulations is also underlined.
1. INTRODUCTION
Current focus of designing bigger and efficient wind turbines to meet the growing energy demands has put several challenges
in front of wind turbine designers and manufacturers. A thorough understanding of wind turbine dynamics is necessary to
meet these requirements. In this regard, use of Operational Modal Analysis (OMA), as a tool to understand wind turbine
dynamics based on measured data, seems very promising.
Work presented in this paper builds on the studies showcased in [1-3]. While application of OMA is quite straight forward in
case of parked wind turbines [4], several challenges are posed in case of operational wind turbines. Study [1] discussed the
applicability limits of OMA to operational wind turbines. This work showed, based on analytical and simulation studies, that
presence of considerable aeroelastic effects and rotational components in the excitation along with time varying nature of
wind turbine structure restricts application of OMA to operational wind turbines as they stretch the basic OMA assumptions.
XXIX International Modal Anaylsis Conference (2011), Jacksonville, FL 2
It is shown that since a wind turbine structure consists of several substructures that move with respect to each other (yawing
of nacelle, pitching of blades, rotor rotation etc), the assumption regarding time invariance of the structure is not valid
anymore. Additionally, it is further observed that aeroelastic forces exciting an operational wind turbine are characterized
with prominent peaks which are accompanied with thick tails, there by not fulfilling the OMA requirement that excitation
forces should have uniform broadband spectra. These forces are also found to be quite correlated at the rotational frequency
and its harmonics. This nature of excitation forces also results in violation of basic OMA assumptions. This work was carried
forward in [2] by combining the knowledge gained on the basis of these investigations and the recommendations that have
been suggested to perform OMA on operational wind turbines.
In [2] it is shown by means of simulated data, how the above mentioned challenges can be overcome and OMA can be
applied to operational wind turbines using careful planning and techniques such as multi-blade coordinate (MBC)
transformation. The feasibility of OMA approach for understanding dynamics of operational wind turbines was shown by
means of simulations on a model of ALSTOM WIND ECO 100 wind turbine; a 3 MW turbine.
Work presented in this paper is in continuation of the work presented in [2] and focuses on the experiment phase of the
overall OMA campaign on ECO 100 turbine installed in La Collada, Tarragona, Spain. It is important to note that overall
goal of this ongoing project is to utilize the strategies (formulated and consolidated by means of simulated data in [2]) to
perform OMA on data acquired on ECO 100 turbine in operation for its dynamic characterization.
The paper is organized as follows. Section 2 describes the main motivation behind the project and lays down the goals and
objectives for the two campaigns, short term and long term, in which the project is split. Section 3 discusses the design of the
measurement campaigns, including test set up planning keeping in view the goals of the project, understanding gained from
simulation based studies and limitations of OMA. The instrumentation and data acquisition phase is described in section 4.
Main goal of this section is to not only provide the details of instrumentation and test layouts for short term and long term
campaigns, but also share practical issues and challenges during this task and measures taken to overcome the same.
Following this some preliminary results are presented and finally conclusions are drawn.
2. OBJECTIVES
The main motivation of this project is to obtain a reliable dynamic model of the wind turbine. Typically there exist several
numeric models (such as aeroelastic models, finite element models etc) of a wind turbine to characterize its dynamics.
However, it is imperative from dynamics point of view to validate these models by means of experimentation in order to
prove and improve their reliability. Based on its suitability and applicability on large real-life structures and its ability to
characterize the dynamics of large structures, Operational Modal Analysis (OMA) is chosen as a technique for experiment
based characterization of wind turbine dynamics. The choice of OMA as a preferred technique for this task was validated by
means of a pre study whose results are already published in [2].
The objectives of this project can be viewed from three different perspectives;
• Structural: To get an understanding of the dynamic behavior of the wind turbine and the interaction between the
main structural elements (systems and subsystems) of the turbine (i.e. tower, drive train, rotor and main frame) with
other mechanical and electrical subsystems (i.e. generator, transformer, gearbox and inverter). This understanding is
expected to aid in the overall design process of these structural elements by means of verification of existing design
and redesigning if necessary. Yet another objective in this respect is to correlate the experimentally identified system
with FE/Multibody analysis based simulations.
• Controls: Use the OMA based system identification for better controller design by using results from system
identification and extracting linear models from real experiments and compare them with linear models extracted
from the simulations. This is important since control performance is dependent on accuracy of these linear models
and hence it’s important to validate these models for achieving optimal control [5].
• Mechanical: Validation of models of drive train and elastic mounts of mechanical components (gearbox and
generator).
To accomplish the goals and objectives of characterizing the dynamics of wind turbine structure and substructures under the
variety of operational conditions, it is decided to carry out the project in two stages; a long term campaign and a short term
campaign.
The aim of the long term campaign is to experimentally determine the modes of the main structural components of the wind
turbine; i.e. estimation of tower modes, rotor modes, drive train mode and mainframe modes for a number of operational
working points that collectively represent the complete operational conditions of the wind turbine. Since this requires data
acquisition for a long period of time (that is deemed sufficient in order to ensure that data corresponding to various
XXIX International Modal Anaylsis Conference (2011), Jacksonville, FL 3
operational conditions is acquired), this campaign is termed long term campaign. In addition to the above mentioned modes,
the gearbox and generator modes are also required to be estimated when turbine is operating at nominal power and when it’s
operating at 1/3 of nominal power. On the other hand, the short term campaign is aimed at identification of modes of other
mechanical and electrical subsystems (transformer and electrical cabinets) and understanding their interaction with nacelle
and mainframe. The details of these campaigns, keeping in view the overall objectives of the project, are provided in the next
section, which describes the design and planning of experiments pertaining to the two campaigns.
3. DESIGN OF EXPERIMENTS
The results of the long term campaign are to be presented in the form of a Campbell diagram [6] which is a representation of
wind turbine dynamics in its operating regime, typically given in terms of varying wind speeds. Thus, to characterize the
dynamics of the operational turbine, operational working points are chosen in the wind speed range of 3 m/s to 25 m/s in
steps of 2 m/s. For the short term campaign, aimed at identification of modes of other mechanical and electrical subsystems,
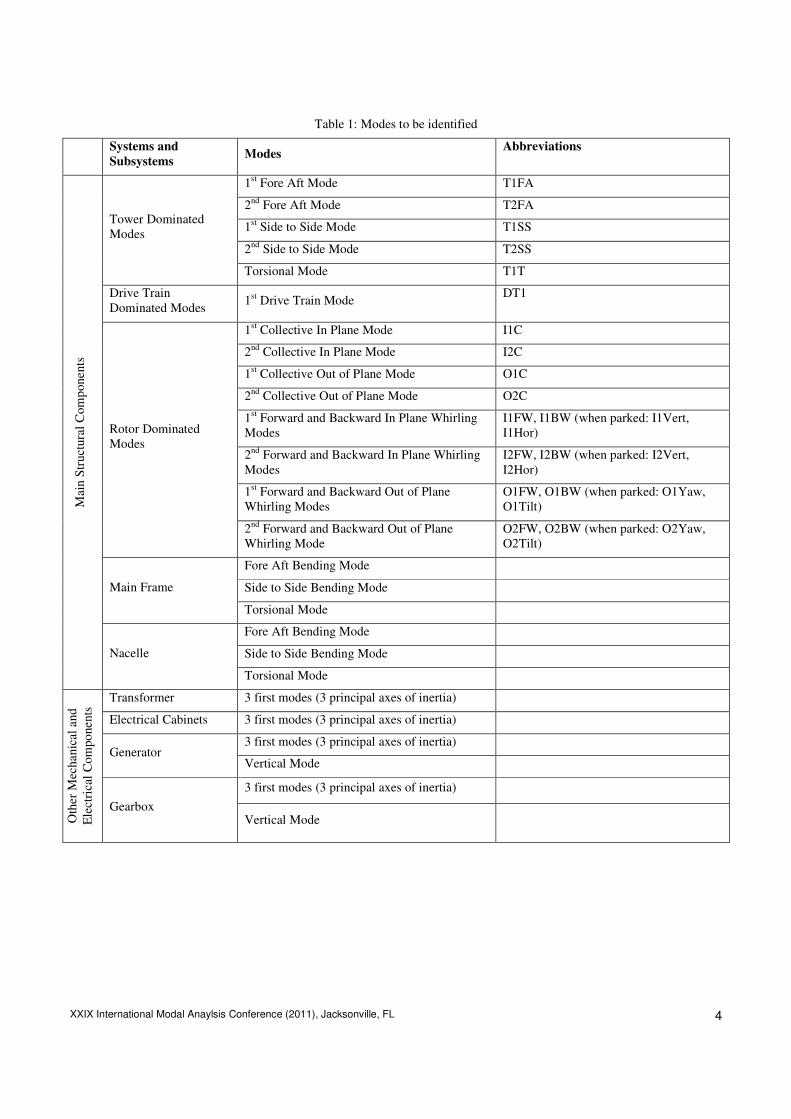
the identification procedure is independent of turbine operating conditions. The modes of interest (for both campaigns) are
listed in Table 1.
While designing an experiment of this kind, one has to keep in mind the practical constraints which play a significant role in
terms of what is measurable and what is not. One of the foremost practical issues associated with this experimental campaign
is that measurement on the turbine blades is quite difficult. From the observability point of view, it would have been ideal to
instrument the three blades at various sections (along the length) as that would have significantly enhanced the chances of
observing and estimating the rotor modes. However, in this project, this was not a possibility as only a limited section of the
blades was approachable for sensor instrumentation and that too would have required special arrangements with regards to
measured data transfer and synchronization. However it was expected that the rotor-related modes will affect dynamics of the
tower and nacelle, thus these modes can be detected from the tower and nacelle measurements. This supposition was partly
confirmed by OMA performed on simulated data: the rotor modes were found in tower measurements, although it was
comparatively difficult to distinguish and classify them.
Significance of simulation studies in test planning is further underlined by the fact that the simulations provide considerable
aid in choosing the sensor locations so as to observe all the modes of interest.
Large size of the turbine also makes it important to plan the placement of various data acquisition systems. There are other
considerations as well, with regards to the data acquisition system, which are important from test planning perspective. A
measurement campaign along the lines of this project puts the following requirements on the design of data acquisition
system; a high quality data acquisition system that
o can continuously acquire data for a long period of time (several months),
o can be used as a distributed and synchronized system,
o can support a large number of measurement channels,
o can support auxiliary channels (such as wind speed, yaw angle, tacho signals etc), and
o can be remotely monitored and operated.
Since the measurement system is a distributed system, placement of data acquisition front ends plays an important role in
optimizing the required cable length and also effective management of the cables, thus aiding in minimizing the workload
related to wind turbine instrumentation.
The demands of a robust data acquisition system also emerge from the need of long term campaign. Since the project aims at
characterizing the dynamics of an operational turbine under various operating conditions, it is necessary that the data is
acquired over a long period of time. This requires data acquisition system to be remotely monitored, capable of automatic
operation and needs of emergency backup in case of power shutdowns. These points are also taken into consideration while
planning the measurement phase. It is further decided, keeping in view these requirements that the duration of long term
campaign is 3 months from August, 2010 to October, 2010. The choice of this period is governed by the fact that the site at
which the wind turbine prototype is installed is expected to experience sufficient wind during this timeframe, and that three
months time period should suffice in terms of capturing all the operational modes of the turbine.
XXIX International Modal Anaylsis Conference (2011), Jacksonville, FL 4
Table 1: Modes to be identified
Systems and
Subsystems Modes
Abbreviations
1st Fore Aft Mode T1FA
2nd
Fore Aft Mode T2FA
1st Side to Side Mode T1SS
2nd
Side to Side Mode T2SS
Tower Dominated
Modes
Torsional Mode T1T
Drive Train
Dominated Modes 1
st Drive Train Mode
DT1
1st Collective In Plane Mode I1C
2nd
Collective In Plane Mode I2C
1st Collective Out of Plane Mode O1C
2nd
Collective Out of Plane Mode O2C
1st Forward and Backward In Plane Whirling
Modes
I1FW, I1BW (when parked: I1Vert,
I1Hor)
2nd
Forward and Backward In Plane Whirling
Modes
I2FW, I2BW (when parked: I2Vert,
I2Hor)
1st Forward and Backward Out of Plane
Whirling Modes
O1FW, O1BW (when parked: O1Yaw,
O1Tilt)
Rotor Dominated
Modes
2nd
Forward and Backward Out of Plane
Whirling Mode
O2FW, O2BW (when parked: O2Yaw,
O2Tilt)
Fore Aft Bending Mode
Side to Side Bending Mode Main Frame
Torsional Mode
Fore Aft Bending Mode
Side to Side Bending Mode
Mai
n S
truct
ura
l C
om
ponents
Nacelle
Torsional Mode
Transformer 3 first modes (3 principal axes of inertia)
Electrical Cabinets 3 first modes (3 principal axes of inertia)
3 first modes (3 principal axes of inertia) Generator
Vertical Mode
3 first modes (3 principal axes of inertia)
Oth
er M
echanic
al a
nd
Ele
ctri
cal
Com
po
nents
Gearbox Vertical Mode

XXIX International Modal Anaylsis Conference (2011), Jacksonville, FL 5
4. INSTRUMENTATION AND MEASUREMENTS
The measurements are performed on ALSTOM ECO 100 prototype located in La Collada, Tarragona, Spain (Fig. 1). ECO
100 is a three bladed turbine with a rated power output of 3 MW and has rotor diameter of 100.8 m [7].
Figure 1: The ECO 100 Wind Turbine
4.1 Control Signals
As previously stated, the project is run in two stages aiming at different set of objectives. Since the project comprises of two
separate measurement campaigns, the choice of locations where acceleration signals are to be measured differ in case of long
term and short term campaigns. However, there are several control signals that are to be measured in case of both campaigns.
These control signals are required in order to define the turbine operating conditions or status, as one of the project objectives
requires measurement of turbine dynamic characteristics under various operating conditions. The control signals measured in
this project are: wind direction, wind speed, convertor torque, torque reference, yaw angle, low speed shaft rotation, high
speed shaft rotation, pitch angle and active power. While all of these signals help in characterizing the operating conditions of
the turbine, they also serve a very useful purpose of classifying the vast amount of data collected during the project. At this
point, it is important to realize that the combined time span of both campaigns is close to 3.5 months during which the
acquisition system will be continuously acquiring data. Hence an effective means of classifying this data is paramount to
thoroughly exploit the acquired data for dynamic analysis. Further, yaw angle signal is also used for coordinate
transformation in order to correctly align the nacelle and the tower when the turbine is yawing, as explained in section 3.5.
4.2 Data Acquisition System and Transducers
Keeping in view the demands of the project and based on the criterion listed in previous section, four Bruel & Kjaer PULSE
IDA Frontends (Type 3560) are used. These frontends are capable of being configured for functioning as a distributed system
by means of a synchronization cable. An important reason for choosing this particular type of frontends is the need to have a
wide dynamic range so as to cover all the possible vibration levels during the entire measurement campaign. The frontends
are also capable of handling the auxiliary signals coming from the control system of the turbine.
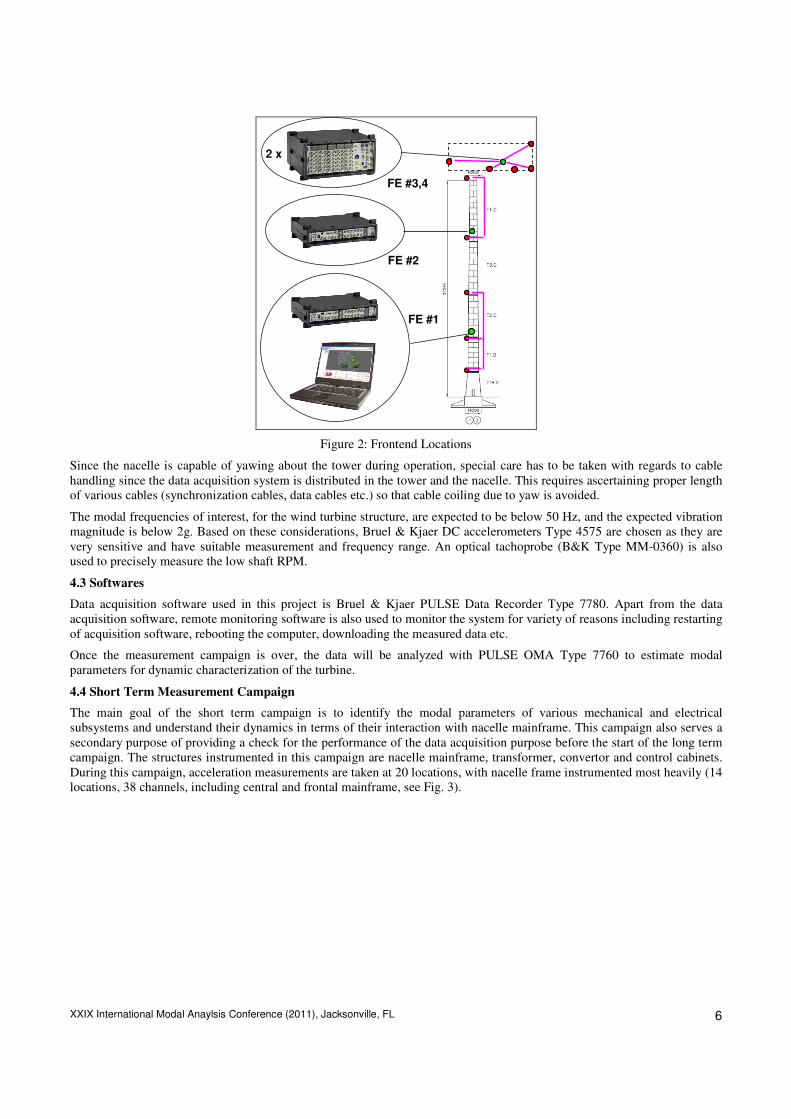
Fig. 2 shows the location of Frontends in the turbine during the measurement phase. Two frontends are placed in the tower
and other two are placed in the nacelle. The two frontends in the tower, with 6 channels each, are located at 24m and 62m
level platforms and are only used for tower acceleration measurements during long term campaign. These are not utilized in
the short term campaign during which data is acquired by means of two frontends in the nacelle only.
XXIX International Modal Anaylsis Conference (2011), Jacksonville, FL 6
FE #1
FE #2
FE #3,4
2 x
Figure 2: Frontend Locations
Since the nacelle is capable of yawing about the tower during operation, special care has to be taken with regards to cable
handling since the data acquisition system is distributed in the tower and the nacelle. This requires ascertaining proper length
of various cables (synchronization cables, data cables etc.) so that cable coiling due to yaw is avoided.
The modal frequencies of interest, for the wind turbine structure, are expected to be below 50 Hz, and the expected vibration
magnitude is below 2g. Based on these considerations, Bruel & Kjaer DC accelerometers Type 4575 are chosen as they are
very sensitive and have suitable measurement and frequency range. An optical tachoprobe (B&K Type MM-0360) is also
used to precisely measure the low shaft RPM.
4.3 Softwares
Data acquisition software used in this project is Bruel & Kjaer PULSE Data Recorder Type 7780. Apart from the data
acquisition software, remote monitoring software is also used to monitor the system for variety of reasons including restarting
of acquisition software, rebooting the computer, downloading the measured data etc.
Once the measurement campaign is over, the data will be analyzed with PULSE OMA Type 7760 to estimate modal
parameters for dynamic characterization of the turbine.
4.4 Short Term Measurement Campaign
The main goal of the short term campaign is to identify the modal parameters of various mechanical and electrical
subsystems and understand their dynamics in terms of their interaction with nacelle mainframe. This campaign also serves a
secondary purpose of providing a check for the performance of the data acquisition purpose before the start of the long term
campaign. The structures instrumented in this campaign are nacelle mainframe, transformer, convertor and control cabinets.
During this campaign, acceleration measurements are taken at 20 locations, with nacelle frame instrumented most heavily (14
locations, 38 channels, including central and frontal mainframe, see Fig. 3).
XXIX International Modal Anaylsis Conference (2011), Jacksonville, FL 7
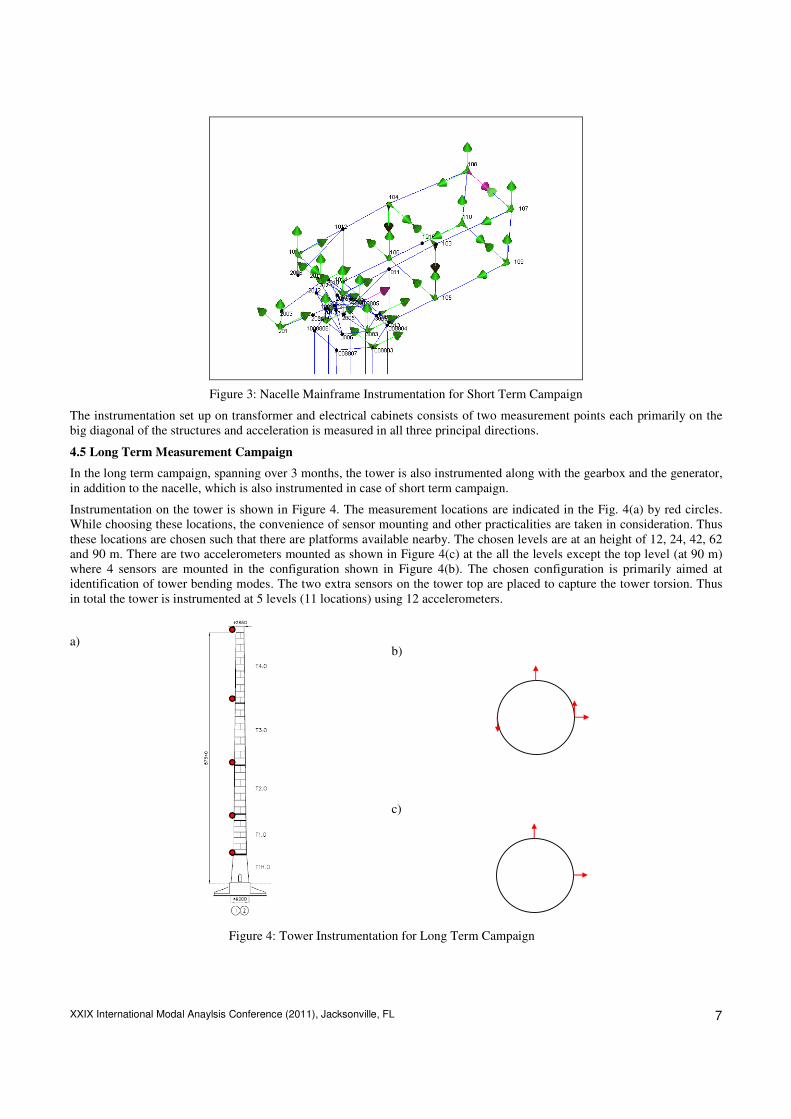
Figure 3: Nacelle Mainframe Instrumentation for Short Term Campaign
The instrumentation set up on transformer and electrical cabinets consists of two measurement points each primarily on the
big diagonal of the structures and acceleration is measured in all three principal directions.
4.5 Long Term Measurement Campaign
In the long term campaign, spanning over 3 months, the tower is also instrumented along with the gearbox and the generator,
in addition to the nacelle, which is also instrumented in case of short term campaign.
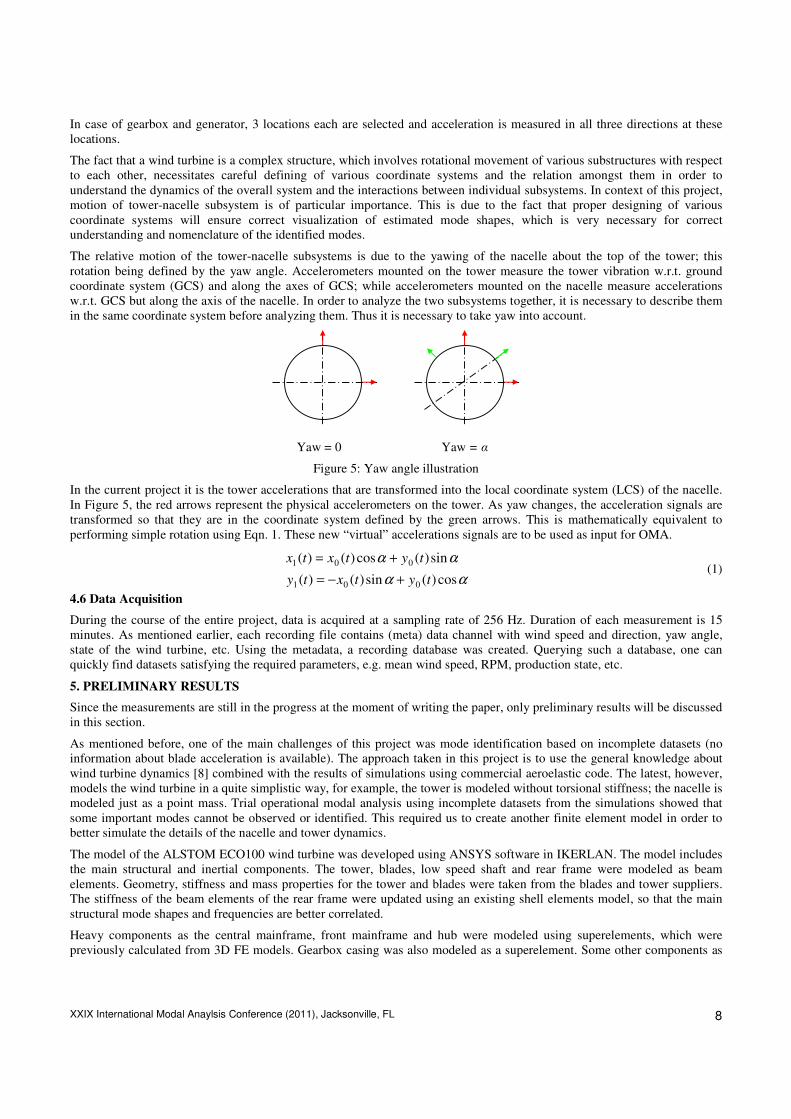
Instrumentation on the tower is shown in Figure 4. The measurement locations are indicated in the Fig. 4(a) by red circles.
While choosing these locations, the convenience of sensor mounting and other practicalities are taken in consideration. Thus
these locations are chosen such that there are platforms available nearby. The chosen levels are at an height of 12, 24, 42, 62
and 90 m. There are two accelerometers mounted as shown in Figure 4(c) at the all the levels except the top level (at 90 m)
where 4 sensors are mounted in the configuration shown in Figure 4(b). The chosen configuration is primarily aimed at
identification of tower bending modes. The two extra sensors on the tower top are placed to capture the tower torsion. Thus
in total the tower is instrumented at 5 levels (11 locations) using 12 accelerometers.
b)
a)
c)
Figure 4: Tower Instrumentation for Long Term Campaign
XXIX International Modal Anaylsis Conference (2011), Jacksonville, FL 8
In case of gearbox and generator, 3 locations each are selected and acceleration is measured in all three directions at these
locations.
The fact that a wind turbine is a complex structure, which involves rotational movement of various substructures with respect
to each other, necessitates careful defining of various coordinate systems and the relation amongst them in order to
understand the dynamics of the overall system and the interactions between individual subsystems. In context of this project,
motion of tower-nacelle subsystem is of particular importance. This is due to the fact that proper designing of various
coordinate systems will ensure correct visualization of estimated mode shapes, which is very necessary for correct
understanding and nomenclature of the identified modes.
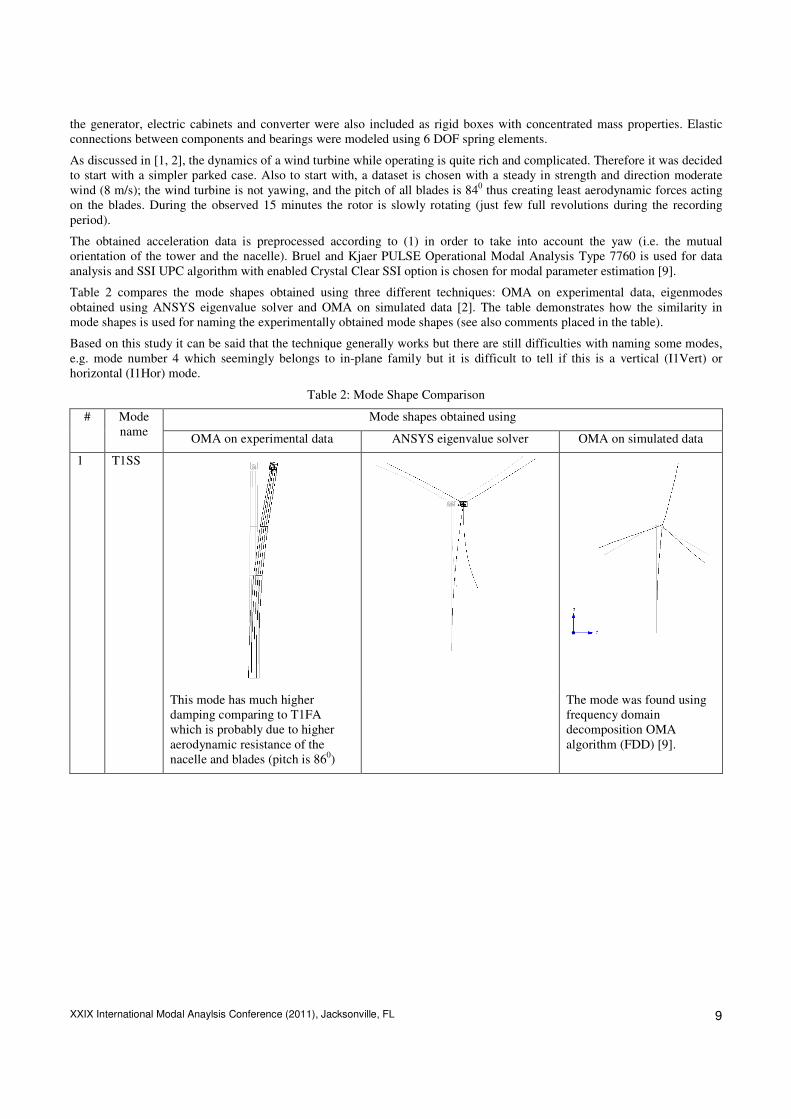
The relative motion of the tower-nacelle subsystems is due to the yawing of the nacelle about the top of the tower; this
rotation being defined by the yaw angle. Accelerometers mounted on the tower measure the tower vibration w.r.t. ground
coordinate system (GCS) and along the axes of GCS; while accelerometers mounted on the nacelle measure accelerations
w.r.t. GCS but along the axis of the nacelle. In order to analyze the two subsystems together, it is necessary to describe them
in the same coordinate system before analyzing them. Thus it is necessary to take yaw into account.
Yaw = 0 Yaw = α
Figure 5: Yaw angle illustration
In the current project it is the tower accelerations that are transformed into the local coordinate system (LCS) of the nacelle.
In Figure 5, the red arrows represent the physical accelerometers on the tower. As yaw changes, the acceleration signals are
transformed so that they are in the coordinate system defined by the green arrows. This is mathematically equivalent to
performing simple rotation using Eqn. 1. These new “virtual” accelerations signals are to be used as input for OMA.
αα
αα
cos)(sin)()(
sin)(cos)()(
001
001
tytxty
tytxtx
+−=
+=
(1)
4.6 Data Acquisition
During the course of the entire project, data is acquired at a sampling rate of 256 Hz. Duration of each measurement is 15
minutes. As mentioned earlier, each recording file contains (meta) data channel with wind speed and direction, yaw angle,
state of the wind turbine, etc. Using the metadata, a recording database was created. Querying such a database, one can
quickly find datasets satisfying the required parameters, e.g. mean wind speed, RPM, production state, etc.
5. PRELIMINARY RESULTS
Since the measurements are still in the progress at the moment of writing the paper, only preliminary results will be discussed
in this section.
As mentioned before, one of the main challenges of this project was mode identification based on incomplete datasets (no
information about blade acceleration is available). The approach taken in this project is to use the general knowledge about
wind turbine dynamics [8] combined with the results of simulations using commercial aeroelastic code. The latest, however,
models the wind turbine in a quite simplistic way, for example, the tower is modeled without torsional stiffness; the nacelle is
modeled just as a point mass. Trial operational modal analysis using incomplete datasets from the simulations showed that
some important modes cannot be observed or identified. This required us to create another finite element model in order to
better simulate the details of the nacelle and tower dynamics.
The model of the ALSTOM ECO100 wind turbine was developed using ANSYS software in IKERLAN. The model includes
the main structural and inertial components. The tower, blades, low speed shaft and rear frame were modeled as beam
elements. Geometry, stiffness and mass properties for the tower and blades were taken from the blades and tower suppliers.
The stiffness of the beam elements of the rear frame were updated using an existing shell elements model, so that the main
structural mode shapes and frequencies are better correlated.
Heavy components as the central mainframe, front mainframe and hub were modeled using superelements, which were
previously calculated from 3D FE models. Gearbox casing was also modeled as a superelement. Some other components as
XXIX International Modal Anaylsis Conference (2011), Jacksonville, FL 9
the generator, electric cabinets and converter were also included as rigid boxes with concentrated mass properties. Elastic
connections between components and bearings were modeled using 6 DOF spring elements.
As discussed in [1, 2], the dynamics of a wind turbine while operating is quite rich and complicated. Therefore it was decided
to start with a simpler parked case. Also to start with, a dataset is chosen with a steady in strength and direction moderate
wind (8 m/s); the wind turbine is not yawing, and the pitch of all blades is 840 thus creating least aerodynamic forces acting
on the blades. During the observed 15 minutes the rotor is slowly rotating (just few full revolutions during the recording
period).
The obtained acceleration data is preprocessed according to (1) in order to take into account the yaw (i.e. the mutual
orientation of the tower and the nacelle). Bruel and Kjaer PULSE Operational Modal Analysis Type 7760 is used for data
analysis and SSI UPC algorithm with enabled Crystal Clear SSI option is chosen for modal parameter estimation [9].
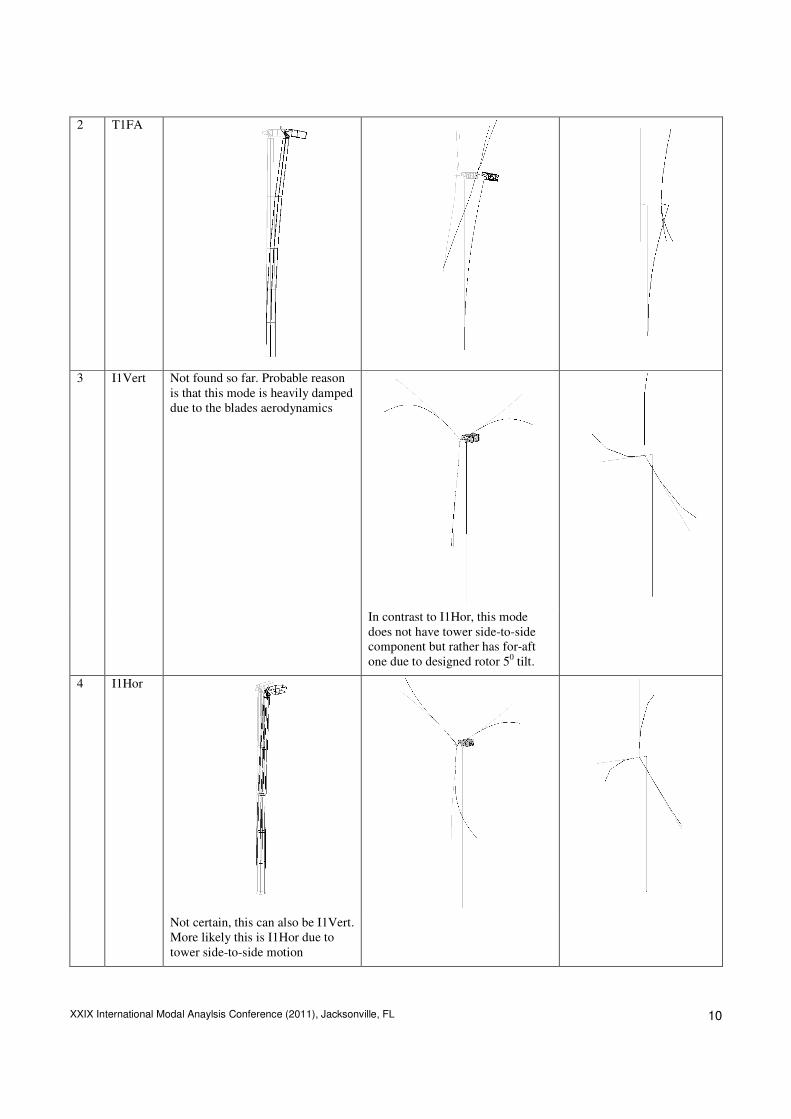
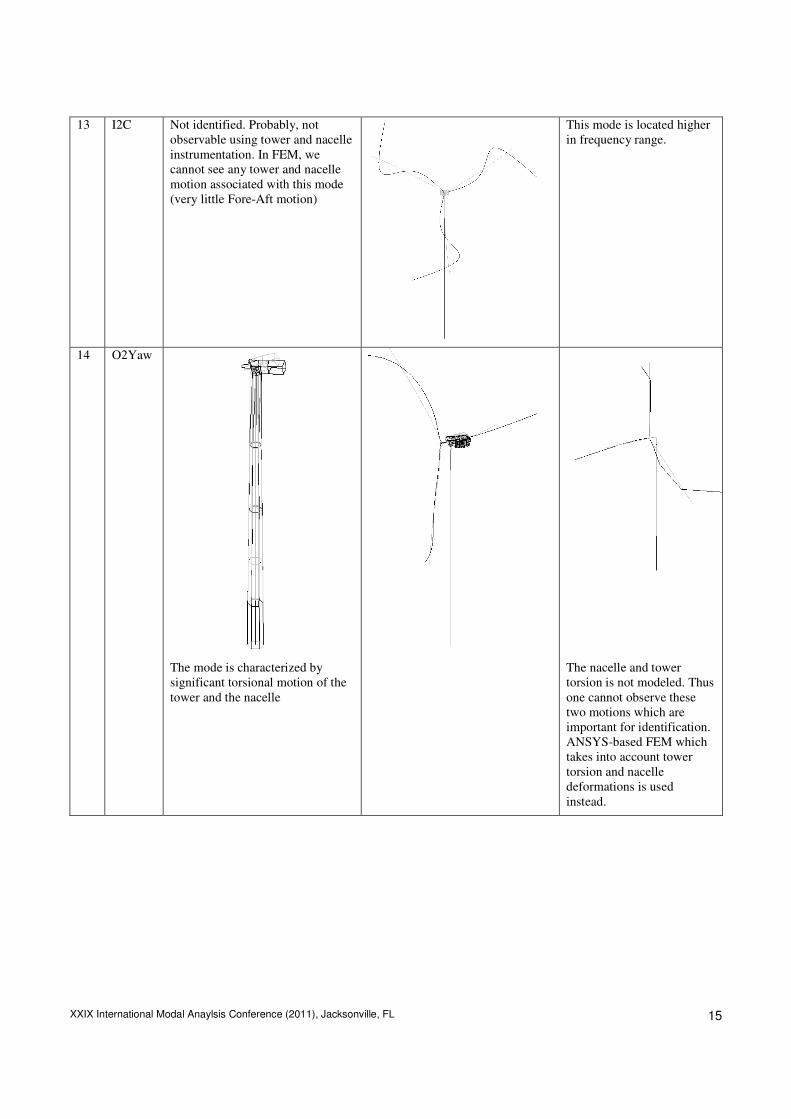
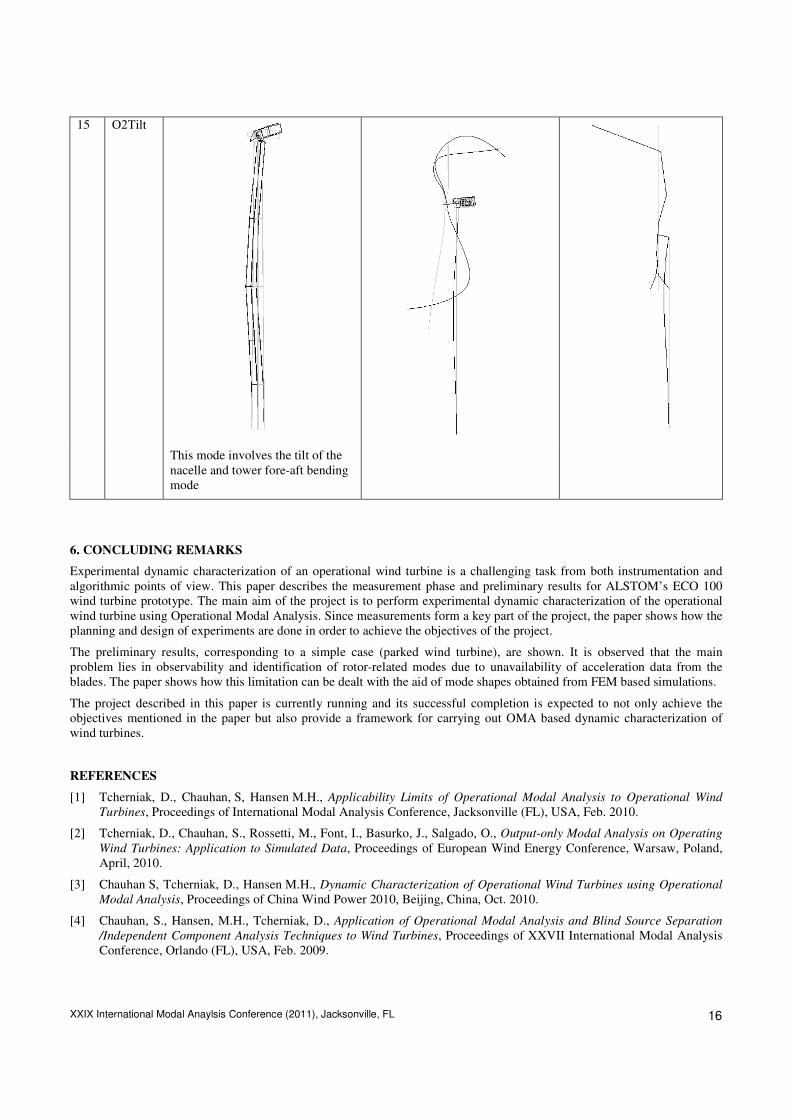
Table 2 compares the mode shapes obtained using three different techniques: OMA on experimental data, eigenmodes
obtained using ANSYS eigenvalue solver and OMA on simulated data [2]. The table demonstrates how the similarity in
mode shapes is used for naming the experimentally obtained mode shapes (see also comments placed in the table).
Based on this study it can be said that the technique generally works but there are still difficulties with naming some modes,
e.g. mode number 4 which seemingly belongs to in-plane family but it is difficult to tell if this is a vertical (I1Vert) or
horizontal (I1Hor) mode.
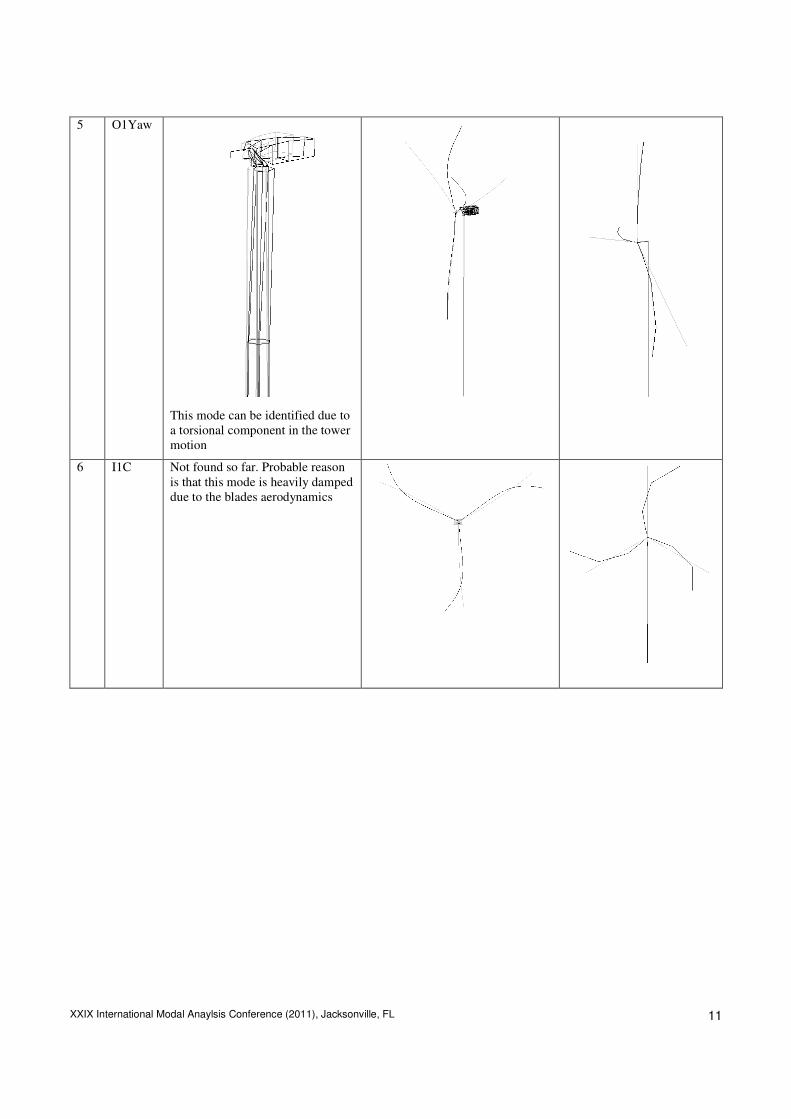
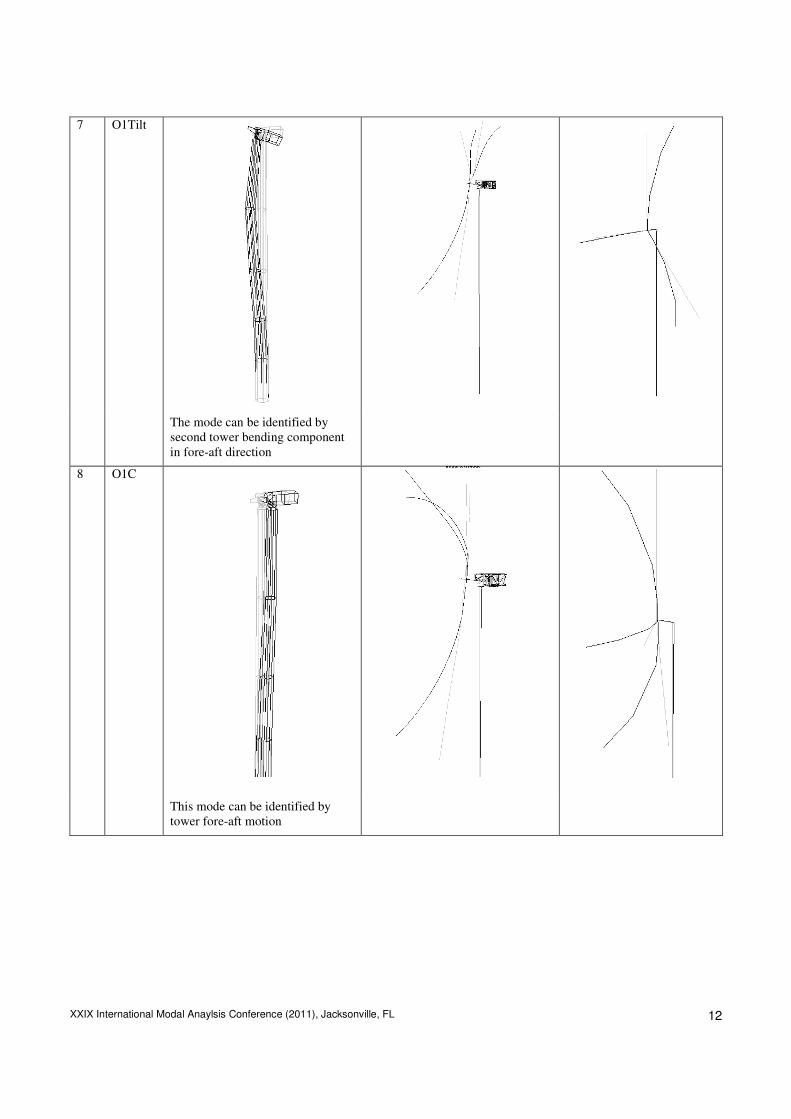
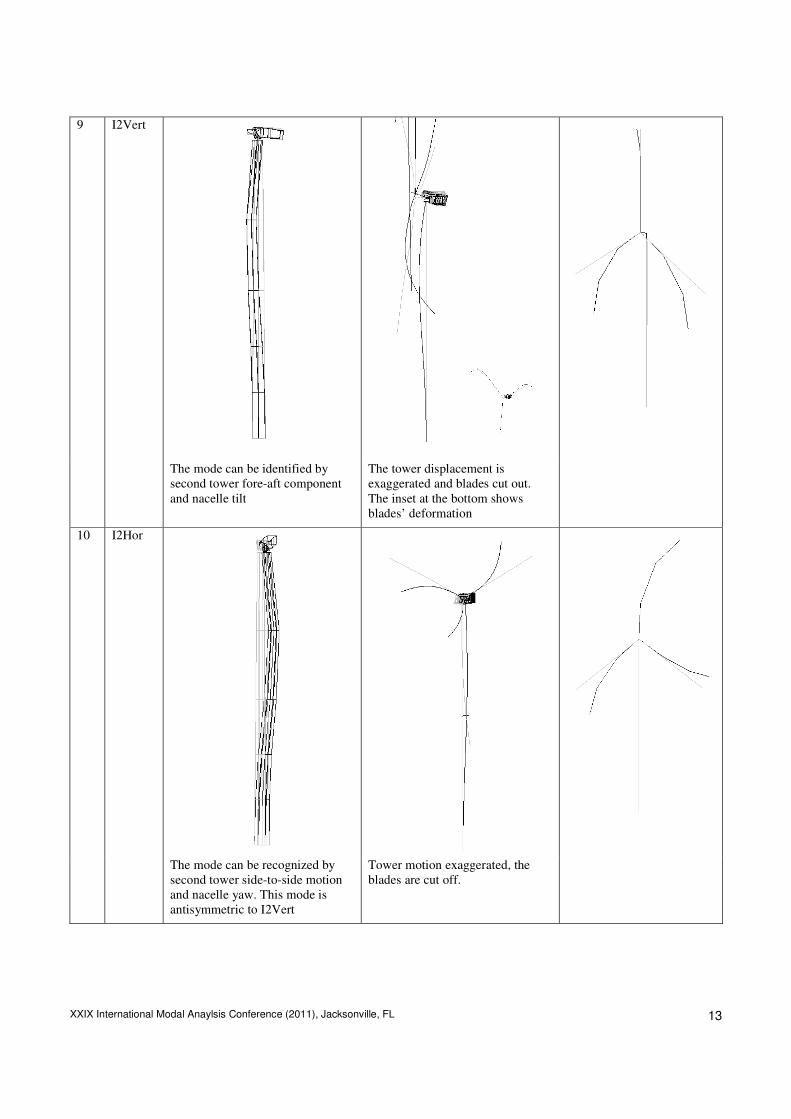
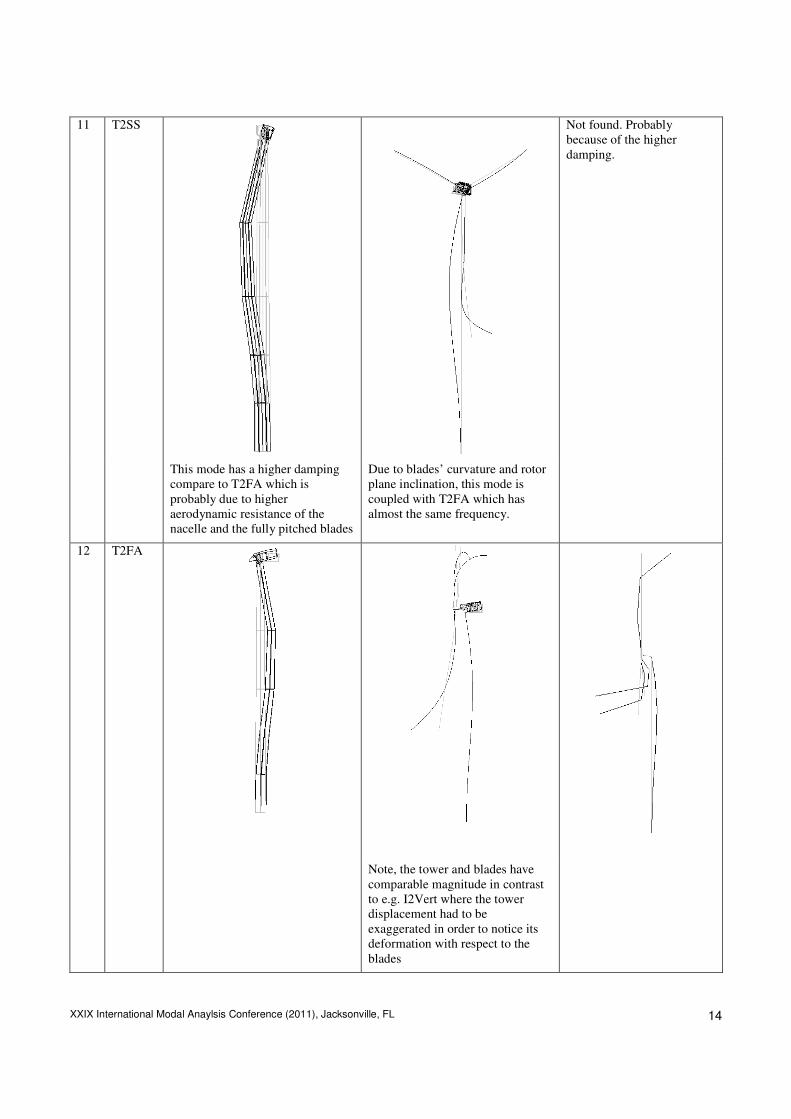
Table 2: Mode Shape Comparison
Mode shapes obtained using # Mode
name OMA on experimental data ANSYS eigenvalue solver OMA on simulated data
1 T1SS
This mode has much higher
damping comparing to T1FA
which is probably due to higher
aerodynamic resistance of the
nacelle and blades (pitch is 860)
The mode was found using
frequency domain
decomposition OMA
algorithm (FDD) [9].
XXIX International Modal Anaylsis Conference (2011), Jacksonville, FL 10
2 T1FA
3 I1Vert Not found so far. Probable reason
is that this mode is heavily damped
due to the blades aerodynamics
In contrast to I1Hor, this mode
does not have tower side-to-side
component but rather has for-aft
one due to designed rotor 50 tilt.
4 I1Hor
Not certain, this can also be I1Vert.
More likely this is I1Hor due to
tower side-to-side motion
XXIX International Modal Anaylsis Conference (2011), Jacksonville, FL 11
5 O1Yaw
This mode can be identified due to
a torsional component in the tower
motion
6 I1C Not found so far. Probable reason
is that this mode is heavily damped
due to the blades aerodynamics
XXIX International Modal Anaylsis Conference (2011), Jacksonville, FL 12
7 O1Tilt
The mode can be identified by
second tower bending component
in fore-aft direction
8 O1C
This mode can be identified by
tower fore-aft motion
XXIX International Modal Anaylsis Conference (2011), Jacksonville, FL 13
9 I2Vert
The mode can be identified by
second tower fore-aft component
and nacelle tilt
The tower displacement is
exaggerated and blades cut out.
The inset at the bottom shows
blades’ deformation
10 I2Hor
The mode can be recognized by
second tower side-to-side motion
and nacelle yaw. This mode is
antisymmetric to I2Vert
Tower motion exaggerated, the
blades are cut off.
XXIX International Modal Anaylsis Conference (2011), Jacksonville, FL 14
11 T2SS
Not found. Probably
because of the higher
damping.
This mode has a higher damping
compare to T2FA which is
probably due to higher
aerodynamic resistance of the
nacelle and the fully pitched blades
Due to blades’ curvature and rotor
plane inclination, this mode is
coupled with T2FA which has
almost the same frequency.
12 T2FA
Note, the tower and blades have
comparable magnitude in contrast
to e.g. I2Vert where the tower
displacement had to be
exaggerated in order to notice its
deformation with respect to the
blades
XXIX International Modal Anaylsis Conference (2011), Jacksonville, FL 15
13 I2C Not identified. Probably, not
observable using tower and nacelle
instrumentation. In FEM, we
cannot see any tower and nacelle
motion associated with this mode
(very little Fore-Aft motion)
This mode is located higher
in frequency range.
14 O2Yaw
The mode is characterized by
significant torsional motion of the
tower and the nacelle
The nacelle and tower
torsion is not modeled. Thus
one cannot observe these
two motions which are
important for identification.
ANSYS-based FEM which
takes into account tower
torsion and nacelle
deformations is used
instead.
XXIX International Modal Anaylsis Conference (2011), Jacksonville, FL 16
15 O2Tilt
This mode involves the tilt of the
nacelle and tower fore-aft bending
mode
6. CONCLUDING REMARKS
Experimental dynamic characterization of an operational wind turbine is a challenging task from both instrumentation and
algorithmic points of view. This paper describes the measurement phase and preliminary results for ALSTOM’s ECO 100
wind turbine prototype. The main aim of the project is to perform experimental dynamic characterization of the operational
wind turbine using Operational Modal Analysis. Since measurements form a key part of the project, the paper shows how the
planning and design of experiments are done in order to achieve the objectives of the project.
The preliminary results, corresponding to a simple case (parked wind turbine), are shown. It is observed that the main
problem lies in observability and identification of rotor-related modes due to unavailability of acceleration data from the
blades. The paper shows how this limitation can be dealt with the aid of mode shapes obtained from FEM based simulations.
The project described in this paper is currently running and its successful completion is expected to not only achieve the
objectives mentioned in the paper but also provide a framework for carrying out OMA based dynamic characterization of
wind turbines.
REFERENCES
[1] Tcherniak, D., Chauhan, S, Hansen M.H., Applicability Limits of Operational Modal Analysis to Operational Wind
Turbines, Proceedings of International Modal Analysis Conference, Jacksonville (FL), USA, Feb. 2010.
[2] Tcherniak, D., Chauhan, S., Rossetti, M., Font, I., Basurko, J., Salgado, O., Output-only Modal Analysis on Operating
Wind Turbines: Application to Simulated Data, Proceedings of European Wind Energy Conference, Warsaw, Poland,
April, 2010.
[3] Chauhan S, Tcherniak, D., Hansen M.H., Dynamic Characterization of Operational Wind Turbines using Operational
Modal Analysis, Proceedings of China Wind Power 2010, Beijing, China, Oct. 2010.
[4] Chauhan, S., Hansen, M.H., Tcherniak, D., Application of Operational Modal Analysis and Blind Source Separation
/Independent Component Analysis Techniques to Wind Turbines, Proceedings of XXVII International Modal Analysis
Conference, Orlando (FL), USA, Feb. 2009.

XXIX International Modal Anaylsis Conference (2011), Jacksonville, FL 17
[5] Font, I., Kanev, S., Tcherniak, D., Rossetti, M., System Identification Methods on Alstom ECO 100 Wind Turbine,
Proceedings of 3rd Torque conference, Heraklion, Crete, Greece, June, 2010.
[6] Burton, T., Sharpe, D., Jenkins, N., Bossanyi, E., Wind Energy Handbook, John Wiley & Sons, Chichester, U.K., 2001.
[7] ECO 100 Platform, http://www.power.alstom.com/_eLibrary/presentation/upload_99947.pdf
[8] Hansen, M.H., Aeroelastic Instability Problems for Wind Turbines, Wind Energy, Vol. 10, pp. 551-577, 2007.
[9] Operational Modal Analysis – Type 7760, http://www.bksv.com/doc/bp1889.pdf