operational performance evaluation of 9 at the tamu …
TRANSCRIPT

OPERATIONAL PERFORMANCE EVALUATION OF BOILER 9 AT THE TAMU POWER PLANT AT COLLEGE
STATION
Submitted to the Power Plant of Texas A&M University
by the Energy Systems Laboratory
Guanghua Wei Bryan Veteto
Mingsheng Liu
August 1996

Operational Performance Evaluation of Boiler 9 p. i
Executive Summary
As part of the engineering assistance project, the ESL staff worked with operating staff at the
power plant: (1) to evaluate the boiler efficiency of boiler 9 by using combustion analysis; (2) to
evaluate gas and steam meters by using measured air flow rate; (3) to identify air leakage through
the pre-heater by balancing 0, before and after the pre-heater; and (4) to correct air and steam
metered data.
Boiler efficiency was measured to be 77 * 2% when the load ratio was 59% on June 20,
1996. The boiler efficiency varied from 73% to 79% when the load ratio increased from 55% to
90%. It is recommended the load ratio should be maintained higher than 60% to maintain
efficiency higher than 77%.
The measured gas consumption from Westinghouse agreed with the predicted value. It
appears that the gas meter are now operating properly after the calibration. The actual air flow
rate was 10 times higher than the meter measured data. The predicted steam production was 20%
lower than the measured value which caused an unrealistic boiler efficiency value of 104%. A
temporary correction factor of 0.797 is suggested until new steam meters can be installed.
The air leakage through air pre-heater was found to be 27% using an oxygen balance method
and 29% using a carbon dioxide balance method. Over 579,000 k W y r electricity can be saved
by reducing air leakage to the 10% level.
Energy Systems Laboratory Texas A&M University

Operational Performance Evaluation of Boiler 9 p . i i
TABLE OF CONTENTS
EXECUTIVE SUMMARY ........................................................................................................ i
1 . INTRODUCTION ................................................................................................................. 1
2 . GENERAL INFORMATION OF BOILER 9 ................................................................. 1
3 . BOILER EFFICIENCY EVALUATION ............................................................................. 4
3.1 METHOD ..................................................................................................................... 4
3.2 MEASURED DATA AND RESULTS ........................................................................... 5
4 . EVALUATION OF GAS AND STEAM METER ACCURACY ........................................ 6
5 . DATA CORRECTION ........................................................................................................ 7
6 . AIR LEAKAGE THROUGH THE AIR PREHEATER: ...................................................... 9
7 . CONCLUSIONS ................................................................................................................. 11
ACKNOWLEDGMENTS ................................................................................................. 12
APPENDIX A: MEASURED GAS FLOW CORRECTION ................................................ 13
APPENDIX B: BOILER EFFICIENCY DETERMINATION .............................................. 14
APPENDIX C-1 : MEASURED DATA AND VELOCITY PROFILES ............................... 20
APPENDIX C-2: VELOCITY CALCULATION AND ERROR ANALYSIS ..................... 23
APPENDIX C-3: AIR FLOW RATE CALCULATION ....................................................... 25
APPENDIX D: ERROR ANALYSIS FOR STEAM CORRECTION FACTOR ................. 26
APPENDIX E: COMPUTER PROGRAM ............................................................................ 28
Energy Systems Laboratory Texas A&M University

Operational Performance Evaluation of Boiler 9 p. I
OPERATIONAL PERFORMANCE EVALUATION OF BOILER 9 AT
THE TAMU POWER PLANT AT COLLEGE STATION
1. INTRODUCTION
As part of the engineering assistance project, the ESL staff worked with the operating staff
at the power plant: (1) to evaluate the boiler efficiency of boiler 9 using a combustion analysis;
(2) to evaluate gas and steam meters using measured air flow rates; (3) to identify air leakage
through the pre-heater by balancing O2 before and after the pre-heater; and (4) to make
recommendations to correct air and steam metered data. The results can be used by the
operation staff to evaluate the daily operation and improve the pre-heater operation, which can
potentially.reduce fan power consumption by 579,000 kWhlyr. This report presents the method
and results.
2. GENERAL INFORMATION FOR BOILER 9
Boiler 9 was installed in 1962 with a rated capacity of 175,000 lbs/hr. The electric driven
feedwater pump has a capacity of 468 GPM (234,300 lbs/hr). The supply air fan has a capacity
of 63,750 CFM. A VFD is used to control the fan speed to accommodate the load change. The
boiler is equipped with an air preheater to warm the air by using the flue gas. A metal wheel is
used to transfer the waste heat to the incoming air. A superheater heats the steam after the
steam leaves the drum (See Figure 1 for detail).
Boiler 9 is equipped with extensive metering devices to measure the boiler production and
evaluate the performance. The key parameters measured are boiler feedwater flow and
temperature, steam pressure and temperature, steam production, natural gas consumption, air
Energy Systems Laboratory Texas A&M University

Operational Performance Evaluation of Boiler 9 p. 2
flow, flue gas temperature, and O2 level. These data were also recorded by the Westinghouse
control system.
To Stack -
Figure 1 : Systematic Diagram of Boiler 9
B a d on the measured steam flow rate, the monthly average load ratio varied from 10% to
80%. Figure 2 presents the measured monthly average load ratio, maximum load ratio, and
operation frequency. The boiler was operated 100% of the time from September 1995 to
December 1995. The load ratio is defined as actual load divided by theoretical maximum load
for the month, the load ratio varied from 65% to 125%. During January and February 1996, the
boiler was used only 15% and 37%, respectively.
Energy Systems Laboratory Texas A&M University

Operational Performance Evaluation of Boiler 9 p. 3
140% ......... .. - 1 Avaage load ratio I
120% n HY. of operational time
gMaximum Ioad ratio
Figure 2: Monthly average and maximum load ratio and the operation frequency.
Figure 3 presents the boiler efficiency determined by the measured steam and the gas
consumption from August 22,1995 through January 5,1996. Apparently, significant error exists
in the measurement because the calculated "boiler efficiency" was higher than 100%. The gas
meter was calibrated during February and March 1996, the old data was corrected by applying
the new calibrated meter constant (See Appendix A for detail). The boiler efficiency was then
calculated and the results are presented in Figure 4.
Figure 3: Daily average boiler efficiency (uncorrected).
After gas data correction, the calculated "boiler efficiency" was still higher than 90%, and
exceeded 100% during some periods, which is impossible for this type of boiler. Therefore, it
appears that significant metering errors still exist.
Energy Systems Laboratory Texas A&M University

Operational Performance Evaluation of Boiler 9 p. 4
8122195 9/6/95 1012 1195 11/22/95 12/8/95 1/4/96
Figure 4: Daily average boiler efficiency (based on corrected gas flow rate).
3. BOILER EFFICIENCY EVALUATION
The boiler efficiency can be determined by measuring gas consumption and steam
production. However, it was impossible to obtain accurate steam and gas data due to metering
errors. In this study, the boiler efficiency was determined using a combustion analysis. The
method and the results are presented below.
3.1 METHOD
Boiler efficiency can be determined by subtracting all the losses from a 100% efficient or an
ideal system. The boiler losses include dry flue gas loss, he1 hydrogen loss, air moisture loss,
radiation loss, blowdown loss, and other losses if there are any.
q = 1 - dry flue gas loss - he1 hydrogen loss - air moisture loss - radiation loss
- blowdown loss - other losses
The dry flue gas loss represents the sensible heat lost from the flue gas leaving the air
preheater. It depends on the amount of excess air and flue gas temperature at the stack. Fuel
hydrogen loss is due to the combustion.of hydrogen. This produces moisture that leaves the air
preheater as water vapor, therefore, the latent heat is lost. Moisture that is carried into the
boiler by the combustion air is heated to the stack temperature, and the heat lost is called air
Energy Systems Laboratory Texas A&M University

Operational Performance Evaluation of Boiler 9 p. 5
moisture loss. Radiation loss is due to the heat loss from the hot boiler envelope to the ambient
air. Blowdown loss represents the heat loss due to the blowdown of saturated water in the
boiler drum in order to control the water quality. Other losses include incomplete combustion
and other unaccounted for losses.
Generally, for gas-fired boilers, dry flue gas loss and the fuel hydrogen loss are the main
sources of efficiency loss.
3.2 Measured Data and Results
It is necessary to measure flue gas composition to determine the dry flue gas loss, fuel
hydrogen loss, air moisture loss, etc. A flue gas measurement was performed on June 20, 1996.
The measured results are summarized in Table 1. Other boiler operation parameters were also
recorded d&ng the test period. The results are summarized in Table 2.
Based on the measured results, the heat losses were determined. The results are
summarized in Table 3. The detailed analysis is attached in Appendix B.
Table 1 : Flue gases analysis @ 2:25 pm , June 20, 1996.
** Due to air preheater leakage, actual stack temperature was 399 OF. (see Appendix E)
Measured by
Troy
Table 2: Westinghouse system data recorded for test period.
0 2
('w 4.6
Table 3: Summary of boiler losses.
Energy Systems Laboratory Texas A&M University
Steam flow
(Ibihr) 102,776
CO (PPM)
0
Steam temperature
(OF) 724
C02 (%I 9.1
Steam pressure
( P W 60 1
Stack temperature ("F)
338.1**
Combustible (PPM)
0
Feedwater flow
(Ibihr) 9 5
Feedwater temperature
( OF) 260
Air flow
(SCFH) 169,075
Fuel flow (SCFH)
109,296
-1
Load
59%
Operational Performance Evaluation of Boiler 9 p. 6
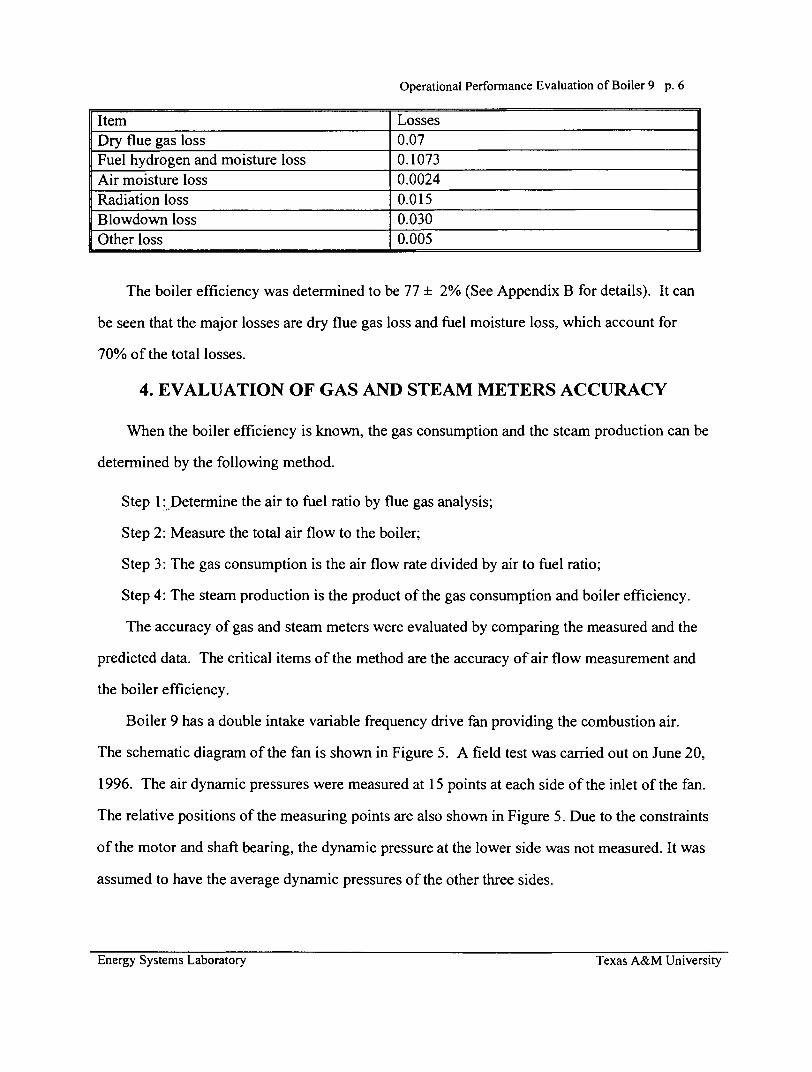
Item Losses Dry flue gas loss 0.07 Fuel hydrogen and moisture loss I 0.1073 II
1
Other loss I 0.005 11
Air moisture loss Radiation loss Blowdown loss
The boiler efficiency was determined to be 77 * 2% (See Appendix B for details). It can
be seen that the major losses are dry flue gas loss and fuel moisture loss, which account for
70% of the total losses.
4. EVALUATION OF GAS AND STEAM METERS ACCURACY
0.0024 0.0 15 0.030
When the boiler efficiency is known, the gas consumption and the steam production can be
determined by the following method.
Step 1 :;Determine the air to fuel ratio by flue gas analysis;
Step 2: Measure the total air flow to the boiler;
Step 3: The gas consumption is the air flow rate divided by air to fuel ratio;
Step 4: The steam production is the product of the gas consumption and boiler efficiency.
The accuracy of gas and steam meters were evaluated by comparing the measured and the
predicted data. The critical items of the method are the accuracy of air flow measurement and
the boiler efficiency.
Boiler 9 has a double intake variable frequency drive fan providing the combustion air.
The schematic diagram of the fan is shown in Figure 5. A field test was carried out on June 20,
1996. The air dynamic pressures were measured at 15 points at each side of the inlet of the fan.
The relative positions of the measuring points are also shown in Figure 5. Due to the constraints
of the motor and shaft bearing, the dynamic pressure at the lower side was not measured. It was
assumed to have the average dynamic pressures of the other three sides.
Energy Systems Laboratory Texas A&M University

Operational Performance Evaluation of Boiler 9 p. 7
Figure 5: Schematic of forced draft fan of boiler 9
The dynamic pressures were measured by a standard pitot-static tube with a resolution of
0.01 inH20. The measured dynamic pressure varied from 0.1 inH20 to 0.5 inH20. The
dynamic pressure was converted into air velocity with a range from 22 ft/s to 50 ft/s. The total
air flow was determined to be 1928 KCFH with an error of 3.21% (See Appendix C for details).
According to the measured air to fuel ratio and the boiler efficiency, the gas consumption
and the steam production were calculated. Since the heating value of natural gas for the test
day was unavailable, the heating value was assumed to be 1045 BtuJSCF based on historical
data from the Lone Star company. Table 4 compares the field measured air flow and predicted
gas consumption and steam production with the meter measured data.
Table 4: Comparison of the field measured air flow and predicted gas consumption and
steam production with meter measured data.
Energy Systems Laboratory Texas A&M University
Field Measurement Meter Measured Difference Percentage difference
Air kCFH 1928 169 1759 1040%
Gas KCFH 108.6 109.3 -0.7 -0.6%
Steam Iblhr 8 1,922
102,776 -20,854 -20.3%
Efficiency 77% 104%

Operational Performance Evaluation of Boiler 9 p. 8
It appears that the actual air flow rate was 10 times higher than the measured data from the
Westinghouse system. The measured gas consumption agreed with the predicted value. It
therefore seems that the gas meter is in good condition at the temperature and pressure levels
experienced during the test. The predicted steam production was 20.3% lower than the
measured value which caused an unrealistic boiler efficiency value of 104%.
5. DATA CORRECTIONS
Both steam and air flow data need to be corrected. The air flow can be corrected by a
factor of 10. Although a correction factor of 0.797 for steam flow was identified under 59% of
load condition, the correction factor has to be investigated carehlly for other load conditions.
To correct the steam production under other load conditions, the following approaches
were used. .. The first approach assumed a constant bias of 20,854 l b h regardless of the load
ratio. In other words, the steam production was determined by subtracting 20,854 l b s h from
the metered steam production. The boiler efficiency was then determined by this steam
production and the measured gas consumption. A second approach assumed that the actual
steam production was 20.3% lower than the measured steam production. In other words, the
steam production was determined to be 79.7% of the metered production. Then, the boiler
efficiency was determined by using this corrected steam production and the gas consumption.
The results are shown in Figure 6.
Energy Systems Laboratory Texas A&M University

Operational Performance Evaluation of Boiler 9 p. 9
50% 55% 60% 65% 70% 75% 80% 85% 90% 95%
Boiler Load
Figure 6: Boiler efficiency vs. load using constant and proportional steam corrections.
Figure 6 shows that when the constant steam flow rate bias was assumed, boiler efficiency
increased more than 10% as the load varied from 60% to 90%. This is impossible for a gas
fired boiler with nearly constant excess air. Thus this assumption was not used.
When the proportional bias was used, the boiler efficiency varied fiom 74% to 80% and
was almost constant as the load varied fiom 65% to 90%. This trend is consistent with the
manufacturer's curve. It appears that the steam flow meter should be corrected with a
correction factor of 0.797*0.032 (See Appendix D for the uncertainty analysis).
In summary, the air flow rate meter reading has to be multiplied by a factor of 10, a
multiplication factor of 0.797 should be applied to the steam meter, and the gas meter is
accurate. However, gas meter data recorded before the calibration should be corrected by
multiplying by a factor of 1.09. Figure 7 presents the corrected daily air flow, steam flow, and
gas flow.
Energy Systems Laboratory Texas A&M University

Operational Performance Evaluation of Boiler 9 p. 10
z E 1,000
Figure 7: Corrected daily air, gas and steam flow rate for boiler 9.
500
6. AIR LEAKAGE THROUGH THE AIR PREHEATER
corrected steam flow --
A Ljwgstrom-type air preheater is used to preheat the incoming combustion air by the flue
gas. Figure 8 presents the systematic diagram. A heavy metal wheel slowly rotates to transfer
heat from the flue gas to the incoming air. The static pressure on the incoming air side is much
higher than that of the flue gas side. Unfortunately, this leads to significant air bypass and
consumes unnecessary fan power. When the incoming air bypasses to the flue gas side, the flue
gas temperature decreases. The lower stack temperature due to air leakage gives a false
indication that the boiler is operating efficiently.
.- 60,000 c E,
-- 40,000 $
0 , /'-/
-, 0
8/23/95 9/6/95 911 7/95 10/3 1/95 1 1/28/95 12/1 1/95 1/5/96
Day
- fuel flow - \ -
Energy Systems Laboratory Texas A&M University
-- 20,000

Operational Performance Evaluation of Boiler 9 p. 1 1
Housing 7
- Axial Seal
Figure 8: Schematic of regenerative air preheater
The air leakage can be determined by balancing the 0, or CO, components before and after
the pre-heater. The 0, and C02 concentration in the flue gas and air can be measured by flue
gas analyzer. Three flue gas analyses were taken. One before the air preheater, another at the
stack outlet, the other one right after the air preheater. The oxygen concentration was much
higher right after the preheater than at the stack outlet, which indicated that the gas sample right
after the preheater was not thoroughly mixed. Thus, the gas composition at the stack outlet was
used to calculate the air leakage rate. The leakage rate was found to be 27% using an oxygen
balance method and 29% using a carbon dioxide balance method. Table 5 is a summary of the
gas analysis before and after the air preheater. Appendix E is the University of Wisconsin's
Engineering Equation Solver (EES) program used to calculate the leakage rate.
Table 5: Summary of gas analysis before and after the air preheater.
Energy Systems Laboratory Texas A&M University
O2 concentration C 0 2 concentration
Before air preheater 4.6% 9.1%
After air preheater 8.9% 6.5%
Ambient air 21% 0%
Leakage rate 27% 29%

Operational Performance Evaluation of Boiler 9 p. 12
If the air leakage rate can be reduced from 27% to lo%, the fan power can be reduced to
(1 - 0.1 713 % = 57.2%, or 42.8% of the fan power can be saved. If the boiler is used at an
annual average load of 70% , the potential electricity savings are:
270hpx0.736k~/hpx0.73x0.428x8760hr/yr = 579,090 kWh/yr.
7. CONCLUSIONS
The boiler efficiency varied from 73% to 79% when the load increased from 55% to 90%.
The load ratio should be maintained above 60%, or 100,000 l b h in order to obtain high
efficiency.
The natural gas meter seems to be working properly after calibration. The air flow meter
should be corrected by a factor of 10. The steam flow meter should be corrected by a factor of
0.797. Thecalculations in the Westinghouse air metering algorithm should be checked to
determine what goes wrong. There is 27% air leakage in the air preheater. Seals for the air
preheater should be inspected and replaced during the next scheduled maintenance. This can
save 579,090 kWh/yr, or about $1 7,000lyr at $0.03/kWh.
Energy Systems Laboratory Texas A&M University

Operational Performance Evaluation of Boiler 9 p. 13
ACKNOWLEDGMENTS
Many people contributed to the completion of this work. We would like to thank Dr.
Darren Habetz for his help in performing the test. Help from Troy, Roy, and Steve of the
power plant are greatly appreciated. Thanks also to our colleagues, Jason Fleming, Eliezer
Maldonado, and Timothy Giebler. Special thanks goes to Mr. Thomas Hagge, Associate
Director for Utilities Physical Plant, for his enthusiasm and support in this project. We would
also like to thank Jean Mahoney for her editing assistance.
Energy Systems Laboratory Texas A&M University

Operational Performance Evaluation of Boiler 9 p. 14
APPENDIX A: MEASURED GAS FLOW CORRECTION
Figure A1 shows the gas consumption versus Steam production for boiler 9 from August
1995 to March 1996. It can be seen that there are two distinct lines. The upper line
corresponds to data recorded after the gas meter was calibrated in February 1996. Since the "as
found" condition for the meter when it was calibrated was not available, and these two lines are
parallel, the pre-calibration gas data was corrected by a factor of 1.09. The result is shown in
Figure A2. As indicated, all data cluster around a narrow band. Thus the correction factor of
1.09 was assumed to be valid.
90 1 10 130 150
Steam Production (10001bslhr)
Figure A1 : Relationship between gas consumption and steam production.
Sterm Production (1000 Ibslhr)
Figure A2: Relationship between corrected gas consumption and steam production.
Energy Systems Laboratory Texas A&M University

Operational Performance Evaluation of Boiler 9 p. 15
APPENDIX B: BOILER EFFICIENCY DETERMINATION
1. CHEMICAL FORMULA FOR NATURAL GAS:
XI CA HB l+X2CMHB2+...+XnCAnHBn+a IN2+a2H20+a302+a4C+a5H2+a6s+a7c02
For gas currently used in the power plant:
0.9 105CH4+0.0557C2H6+0.003 1C3H8+0.0001C4H10+0.0001 C6HI4+0.0089N2+0.02 1 602
2. THE EQUIVALENT HYDROCARBON:
Where
a = mole fraction of equivalent hydrocarbon fuel
= 0.91 O5+0.O557+O.OO3 1+0.000 1+0.0001
= 0.9695
A = number of atoms of carbon
= a"[0.9105+0.0557~2+0.0031 ~3+0.0001~4+0.0001 x6]
= 1.0647
B = number of atoms of hydrogen
= a"[0.9l05x4+0.0557~6+0.003 1 x8+0.0001 x 10+0.0001 x 141
= 4.1293
Thus,
~ C A H B = 0.9695C 1 .0647H4.1293 Energy Systems Laboratory Texas A&M University

Opt iona l Performance Evaluation of Boiler 9 p. 16
3. MOLECULAR WEIGHT OF CAHs:
4. MOLECULAR WEIGHT OF FUEL:
Specific heat of the fuel: X WiiCp,CAita)i
CP,F = WF
Density of the he1
EnWpy of formation of the fuel
hp - HHV - [169297(aA+a7) + 61485(aB)] + W,
= 1026 + 0.04575 - [169297(0.%95~ 1.0647+0.O216) + 61485(0.9695~4.1293)]
t17.5894
Energy Systems Labommy Texas A&M University

Operational Performance Evaluation of Boiler 9 p. 17
5. COMBUSTION EQUATION:
aCAHB +alN2 +a7C02 +a(02+3.76N2) + (aA+a7)C02 + 0.5aBH20 + (a1+3.76a)N2
Oxygen balance gives
2a + 2 a, = 2(aA+a7) + 0.5aB
a = aA+0.25aB=2.033066
Theoretical air to fuel ratio isAF = 4.76a = 9.6773 mole-airlmole-fuel
6. DETERMINE THE EXCESS AIR:
Oxygen balance gives
a7 + aA+0.25aB + y = aA+a7-m + 0.5m + 0.25aB + b 3 by- + 0.5m
Measured carbon monoxide concentration in the dry flue gas can be expressed as
CO% = 1 OOm
a A + a 7 - m + m + a , +(aA+0.25uB)x3.76 + y + 0.5m + 3 . 7 6 ~
thus,
Measured oxygen concentration in the dry flue gas is
Energy Systems Laboratory Texas A&M University

Operational Performance Evaluation of Boiler 9 p. 18
Substitute into the above equation, rearrange to get
Excess air
7. EFFICIENCY CALCULATION:
1 .) Dry flue gas loss
L I = Cp x(AFx( 1 +EA)x pair +phe1 ) x (Tg - Ta)/ HHV
2.) Fuel hydrogen and moisture loss
Lz = (9 H +Water) x (hwv - hw) 1 HHV
= (9xaB+WF + 0) x (1239.9-65)/(1026*.04575)
= (9~0.9695~4.1293t17.5894) x (1239.9-65)/(1026+0.04575)
= 0.1073
3.) Air moisture loss
L3 = 0.46 x W(1b-waterllb-dry-air) x Qai, x (hwv - hv)/ (HHVx Q ,, )
= 0.46~0.01 x AF x(l+EA) x 0.075 x (1239.9-1 103.4)/1026
= 0.0024
Energy Systems Laboratory Texas A&M University

Operational Performance Evaluation of Boiler 9 p. 19
4.) Radiation loss
L4 = 0.0 1 5(estimate)
5.) Blowdown loss
L5 = 0.03
6.) Other loss
L6 = 0.005 (e:
Efficiency
The probable accuracy of each measurement is as follows:
1 .) Dry flue gas loss
Approximate accuracy
0 2 determination *5 .O% Specific heat *1.0% (Tg - Ta) *3 .O% HHV *0.35%
Net Accrued Error = NAE = Js2 + l2 + 32 + 0 . 3 5 ~ = 5.93 %
2.) Wet flue gas loss
Hydrogen 35.0% (Tg - Ta) *3.0% HHV *0.35%
Net Accrued Error = NAE = Js2 + 32 + 0 . 3 5 ~ = 5.84 %
Energy Systems Laboratory Texas A&M University

Operational Performance Evaluation of Boiler 9 p. 20
3.) Air moisture loss
Humidity ratio Tg-Ta HHV
Net Accrued Error = NAE = 45' + 3' + 0.35' = 5.84%
4.) Radiation and unaccounted loss *50%
5.) Blowdown loss *50%
Total tolerance error
=f losses
The cumulative total measurement error = * 100-77'03 ~ 8 . 0 7 = f 2.41% 77.03
The effect of compounding the errors = * 77.03x2.41 = % 100
So the efficiency is probably within the range 77 It 2 O h
Energy Systems Laboratory Texas A&M University

Operational Performance Evaluation of Boiler 9 p. 2 1
APPENDIX C-1: MEASURED DATA AND VELOCITY PROFILES
Table C 1 : Measured data for left intake side.
I I left I right I U P
Table C2: Measured data for right intake side.
point 1 2 3 4 5 6 7 8 9
10 11 12 13 14 15 16
left right UP
point Ap (in.wc) velocity (Ws) Ap (in.wc) velocity (Ws) Ap (in.wc) velocity (Ws) 1 0.205 3 1.08 0.18 29.12 0.18 29.12
Energy Systems Laboratory Texas A&M University
Ap (in.wc) 0.145
0.14 0.135 0.145 0.155 0.172 0.175
0.19 0.198 0.225 0.252 0.295 0.325 0.36 0.37
-
velocity (Ws) 25.22 26.59 26.14 27.29 29.12 30.3 1 30.70 31.31 33.06 34.46 37.72 39.73 42.59 45.79
Ap (in.wc) 0.105 0.105
0.1 1 0.12
0.132 0.145 0.15
0.158 0.162 0.192 0.204 0.225 0.244 0.264 0.275
' 0.345
velocity (Ws) 26.14 25.68 25.22 26.14 27.03 28.47 28.72 29.92 30.54 32.56 34.46 37.28 39.13 41.19 4 1.75
velocity (Ws) 22.24 22.24 22.77 23.78 24.94 26.14 26.59 27.29 27.63 30.08 3 1 .OO 32.56 33.91 3 5.27 36.00 40.32
I
Ap (in.wc) 0.135 0.15
0.145 0.158
0.18 0.195
0.2 0.208 0.232 0.252 0.302 0.335 0.385 0.445

Operational Performance Evaluation of Boiler 9 p. 22
Figure C 1 : Left side
40 --
h U) . 5 30 -- C .-
Distance from shaft (in)
20 - 9
10
Figure C2: Right side
--
-- y = 0.0025x3 - 0.0382x2 + 0.9236~ + 18.55 R2 = 0.9896
0 5 10 15 20
Distance from shaft (in)
0 , >
0 5 10 15 2 0
Distance from shaft (in)
Figure C3: Upper side
Energy Systems Laboratory Texas A&M University

Operational Performance Evaluation of Boiler 9 p. 23
0 5 10 15
Distance from shaft (in)
Figure C4: Left side
5 10 15
Distance from shaft (in)
Figure C5: Right side
0 5 10 15 20
Distance from shaft (in)
Figure C6: Upper side
Energy Systems Laboratory Texas A&M University

Operational Performance Evaluation of Boiler 9 p. 24
APPENDIX C-2: VELOCITY CALCULATION AND ERROR ANALYSIS
Determine the velocity uncertainty when Ap = 0.2 inches of water:
The velocity of air entering the fan is calculated as:
where Ap = Velocity pressure at entering point; p = Density of air; T = Air temperature; p = Air pressure.
It is a function of Ap, T, and p and can be expressed as
where wv = f( WA,, WT, WP)
WAp, WT, Wp are the uncertainties of velocity pressure, air temperature and pressure
measurements.
Wp = 0.05 psi.
Wv can be determined by
Where
Energy Systems Laboratory Texas A&M University

Operational Performance Evaluation of Boiler 9 p. 25
Root mean square error of regression is Wr = 0.6 165 Ms.
Total error is = 40.776~ + 0.6 1 652 = 0.99 1 1 Ms.
Total percentage error is 09911 =3.2 1 % 30.92
Energy Systems Laboratory Texas A&M University

Operational Performance Evaluation o f Boiler 9 p. 26
APPENDIX C-3: AIR FLOW RATE CALCULATION
FlowL,, , FlowL, and FlowL, were flow rates of the left, right and upper quarters of the left
intake side, Flowk, , FlowR, and Flowku were flow rates of the left, right and upper quarters of
the right intake side. The followings are the integration equations.
'(2 . 3.14 . x . (0.0025 . x3 -0.0382 . x2 + 0.9236 - x + 18.55) dx) Flowu = 0.25 . .3600
144
l ( 2 . 3.14 . x . (0.0055 . x3 -0.1111 . x2 + 1.4513 . x + 20.83) dx) FlowL,, = 0.25 . ,3600
144
'(2 . 3.14 . x . (-0.0036 . x3 + 0.2022 . x2 - 1.9027 . x + 30.657) dx) FlowLmu = 0.25 . .3600
144
j ( 2 . 3.14 . x . (-0.0011 . x3 + 0.0753 . x2 + 0.0637 . x + 29.266) dx) FlowRI = 0.25 . ,3600
144
j ( 2 - 3.14. x . (0.0032. x3 -0.0344. x2 + 0.6728. x + 27.172) dx) FlowRu = 0.25 - .3600
144
Below is the results in actual CFH (ft3/hr)
Total flow rate is
(207,574+235,191+226,577+278,586+235,897+262,117)x4+3=1,928,000 CFH
Convert to standard cubic feet,
1,928,000 x 460 +" = 1,790,000 SCFH 460 + 97
Consider 26.8% leakage to the flue gas, actual air flow rate to the boiler is
1,790,000x0.73=1,308,000 SCFH.
Energy Systems Laboratory Texas A&M University

Operational Performance Evaluation o f Boiler 9 p. 27
APPENDIX D: ERROR ANALYSIS FOR STEAM CORRECTION FACTOR
The correction factor is defined as
where
S, = predicted steam flow;
S, = measured steam flow;
q = boiler efficiency;
G = gas flow;
HHV = gas higher heating value;
Ah = enthalpy change of steam.
It can be expressed as
F= F*W,
where
Wf = fW,, w,, W,wv,Wsrn,W*)
W,, WG, Wm,Wsm,and W* are uncertainties of efficiency, gas flow, heating value,
measured steam flow and steam enthalpy change. Their values are obtained by multiply the
uncertainty with measured value.
W, = 0.0185~0.7703 = 0.01425
WG = 0.025~109296 = 2732.4 SCFH
WHHV = 0.0035~1026 = 3.591 BtdSCF
Energy Systems Laboratory Texas ALM University

Operational Performance Evaluation o f Boiler 9 p. 28
Ws, = 0 . 2 ~ 102776 = 20555 l b h
WAh = 0.03~1133 = 34 Btdlb
Wf can be determined by
= 0.0322
Percentage uncertainty is 5 = x 1 00% = 4% F 0.797
Energy Systems Laboratory Texas A&M University

Operational Performance Evaluation o f Boiler 9 p. 29
APPENDIX E: COMBUSTION EFFICIENCY AND AIR PREHEATER
LEAKAGE RATE CALCULATION (EES PROGRAM)
EQUATIONS:
{ Fuel analysis)
{composition)
CH4=O.9105
C2H6-0.0557
C3H8-0.003 1
C4H1030.0001
C6H14-0.0001
Alpha-N210.0089
Alpha-CO2-0.02 16
{Fonnula)
{Molecule weight)
W-CAHB-12*A+B
W-hel-Alpha* W-CAHB+28*Alpha-N2+44*Alpha-C02
{property)
pZ14.5
Rho-ai~0.075
omega-0.02
W-ai1=0.79*28+0.21*32
Energy Systems Laboratory Texas A&M University

Operational Performance Evaluation of Boiler 9 p. 30
{Flue gas analysis)
V-02-14.046
V-C02-14.091
v-co-14 V-N2-1=1 -V-02-1 -V-(202-1 -V-CO-1
T-1=545
T-1 -actual=T-1 +T-ambient
T-ambient= 100
{W~1=32*V~O2~1+44*V~C02~1+28*V~CO~1+28*V~N2~1)
V-02-2~0.089
V~CO2~2=0.065
v - c o - 2 4
V-N2-2=1 -V - 02-2-V-C02-2-V-CO - 2
T - 2=223.6
T-2-leak=T-2+T - ambient
W-2=3 2* V-02-2+44* V-CO2-2+28 *VVCO02+28 * V - N2 - 2
{Theoretical AIF for combustion equation
Energy Systems Laboratory Texas A&M University

Operational Performance Evaluation of Boiler 9 p. 3 1
{ Excess air for combustion equation
+(Alpha*A+O.25*Alpha*B)*3.76+y+OS*m+3.76*y)
V-02-1 =(y+c-0.25 *Alpha*B-0.5 * m - Alpha* A)/(Alpha*A+Alpha-C02+Alpha-N2
+(~l~ha*~+0.25*~l~ha*~)*3.76+~+0.5*m+3.76*~)
{Combustion Efficiency)
M-air-to-hel=4.76* (c+y)* W-air/W-he1
M~dryflue~to~hel=((Alpha*A+Alpha~CO2-m)*44+m*28+(AlphaN2+3.76*c+3.76*y)*28
+(y+OS *m)* 3 2)/W_hel
M-h.20-to-hel=(0.5 *Alpha* B * W-h20+4.76* (c+y)* omega* W-air)/W-he1
+ENTHALPY(H20,t=77)))
Energy Systems Laboratory Texas A&M University

Operational Performance Evaluation of Boiler 9 p. 32
{leakage)
Q-air=1928{1000 CFH)
m-ail-air *Rho-air*(460+60)/(460+T-ambient)
Q-fuel-((m-air-m-1eak)IRho-air)/(( 1 +ExcessAir/ 1 OO)* Ratio-air-to-fkl) { 1 000 SCFH )
m-fuel*-fuel* Rho-fuel
Q-air-to-boiler4m-air-m-leak)/Rho-air
{02 balance)
A= 1.065
Alpha=0.970
Alpha - C02=0.022
Alpha-N2=0.009
B=4.129
c=2.033
C2H6=0.056
Energy Systems Laboratory Texas A&M University

Operational Performance Evaluation of Boiler 9 p. 33
C3H8=0.003
C4H 10=0.000
C6H l4=O.OOO
CH4=0.9 1 1
eta-c=0.807
ExcessAir-25.223
HHV=1026.000
h-l=-l7OO.767
h - 2=-2 1 94.226
h - 3=-22003.7 12
h - formation=-1 71 0.707
m=-0.000
m air-134~995
M-air-to-fbel=19.869
M - dryflue-to-fbel=l8.82 1
m - fbel=4.968
M_h2o_to - fbel=2.446
m - leak=36.308
omega=0.020
P=14.500
Q-air-1928.000
Q-air-to-boiler-13 15.823
Q-fbel=108.582
Ratio-air-to-fbel=9.677
ratio - leak=0.269
Rho-air=O.O75
Energy Systems Laboratory Texas A&M University

Operational Performance Evaluation of Boiler 9 p. 34
Rho-hel=0.046
Rho - specific=0.6 1 0
T - 1=545.000
T - 1 -actual=642.000
T-2=223.6OO
T-2 - leak=320.600
T-2-unleak=398.922
T-arnbient=97.000
V - C02-1 =0.09 1
V-C02-2=0.065
v-CO-1 =o.ooo
v ~ C 0 ~ 2 = 0 . 0 0 0
V-N2- 1 =O. 863
V - N22=0.846
V-02-1=0.046
V-02-2=0.089
W - 1=29.696
W - 2=29.396
W - air=28.840
W - CAHB=16.905
W - hel=17.589
W - h20= 18.000
y=OS 13
Energy Systems Laboratory Texas A&M University