operational risk report - garrulus
TRANSCRIPT

Operational Risk ReportDate: 2005-10-18 14:57:15
Author: John Doe
Institution: ACME Inc.

Summary
2005-10-18 14:57:15 2 Garrulus::Operilda v.20051017
Number of Simulations: 1000000, Confidence level: 0.999
Total Risk Capital net of insurance: 676.316
95% Confidence limits: [672.235 , 680.397 ]
Total Risk Capital gross: 707.417
Insurance mitigation: 4.4%

Loss distributionGrand total loss
2005-10-18 14:57:15 3 Garrulus::Operilda v.20051017
Number of Simulations: 1000000, Confidence level: 0.999
Legend:
VaR: Value at Risk
ES: Expected shortfall
Stdev: Standard deviation
0 100 200 300 4000.0
0.2
0.4
0.6
0.8
1.0
Loss amount
Pro
babi
lity
netgross
0.00
0.05
0.10
0.15
Fre
quen
cy
0.00
0.05
0.10
0.15
Fre
quen
cy
Item AmountGross VaR 707.417Net VaR 676.316Gross ES 707.417Net ES 676.316Gross allocated risk 1Net allocated risk 1Scale effect 31.0579Mix effect 0Mean total gross 88.0978Mean total net 78.26Stdev total gross 64.167Stdev total net 60.1125

AllocationRisk Capital
2005-10-18 14:57:15 4 Garrulus::Operilda v.20051017
Number of Simulations: 1000000, Confidence level: 0.999
InternalExternalEmploymentClientsPhysicalDisruptionExecutionExtreme
CaR
5.5513.35.999.66220.2.3125.3395.
Share [%]
0.8211.97
0.8851.4332.5
0.3413.7358.3
CorporateTradingRetailCommercialPaymentServicesAssetBrokerage
CaR
37.496.7170.186.35.235.732.083.4
Share [%]
5.5314.325.227.45.215.284.7212.3
Capital allocation
2005-10-18 14:57:15 5 Garrulus::Operilda v.20051017

CaR AllocationBy Events, gross
2005-10-18 14:57:15 6 Garrulus::Operilda v.20051017
Number of Simulations: 1000000, Confidence level: 0.999
0 0
100
100
200
200
300
300
400
400
Exp
ecte
d S
hort
fall
Gro
ss
Internal
External
Employment
ClientsPhysical
Disruption
Execution
Extreme
InternalExternalEmploymentClientsPhysicalDisruptionExecutionExtreme
CaR
6.6213.56.0811.7239.2.7426.8401.
Share [%]
0.9361.91
0.8591.6633.8
0.3883.7856.6
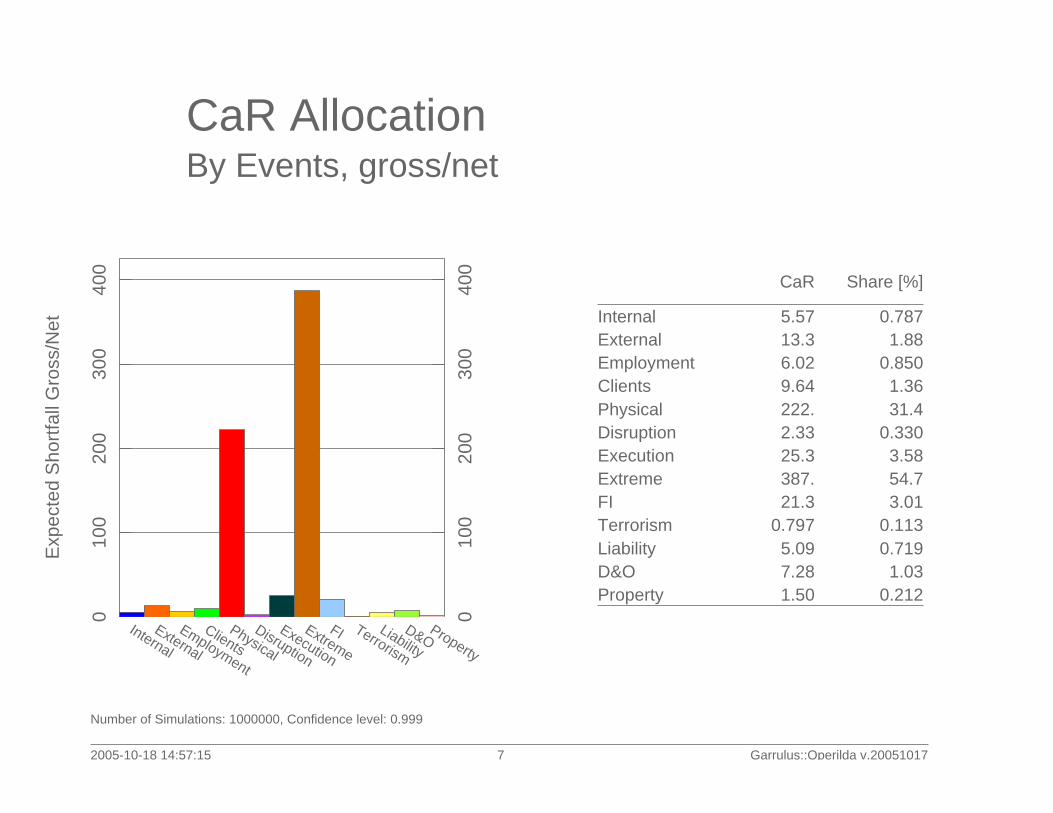
CaR AllocationBy Events, gross/net
2005-10-18 14:57:15 7 Garrulus::Operilda v.20051017
Number of Simulations: 1000000, Confidence level: 0.999
0 0
100
100
200
200
300
300
400
400
Exp
ecte
d S
hort
fall
Gro
ss/N
et
Internal
External
Employment
ClientsPhysical
Disruption
Execution
Extreme
FI Terrorism
Liability
D&OProperty
InternalExternalEmploymentClientsPhysicalDisruptionExecutionExtremeFITerrorismLiabilityD&OProperty
CaR
5.5713.36.029.64222.2.3325.3387.21.3
0.7975.097.281.50
Share [%]
0.7871.88
0.8501.3631.4
0.3303.5854.73.01
0.1130.719
1.030.212

CaR AllocationBy Events, net
2005-10-18 14:57:15 8 Garrulus::Operilda v.20051017
Number of Simulations: 1000000, Confidence level: 0.999
0 0
100
100
200
200
300
300
400
400
Exp
ecte
d S
hort
fall
Net
Internal
External
Employment
ClientsPhysical
Disruption
Execution
Extreme
InternalExternalEmploymentClientsPhysicalDisruptionExecutionExtreme
CaR
5.5513.35.999.66220.2.3125.3395.
Share [%]
0.8211.97
0.8851.4332.5
0.3413.7358.3
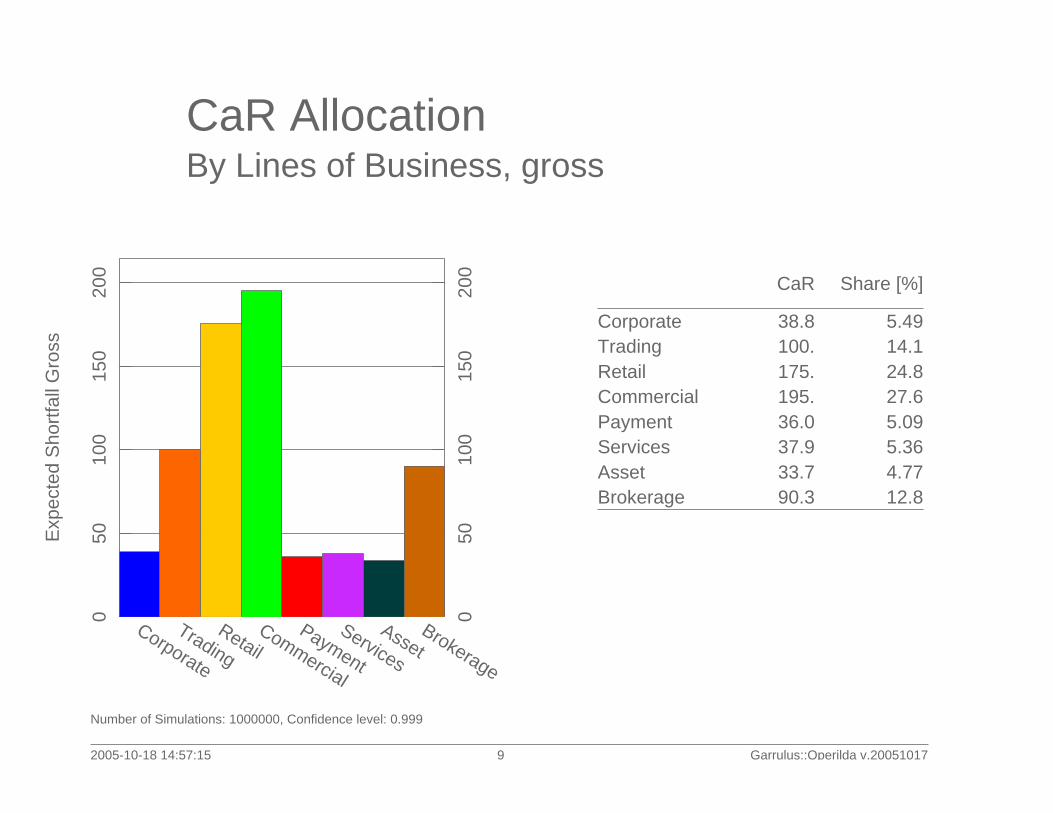
CaR AllocationBy Lines of Business, gross
2005-10-18 14:57:15 9 Garrulus::Operilda v.20051017
Number of Simulations: 1000000, Confidence level: 0.999
0 0
50 50
100
100
150
150
200
200
Exp
ecte
d S
hort
fall
Gro
ss
Corporate
Trading
RetailCommercial
Payment
Services
AssetBrokerage
CorporateTradingRetailCommercialPaymentServicesAssetBrokerage
CaR
38.8100.175.195.36.037.933.790.3
Share [%]
5.4914.124.827.65.095.364.7712.8
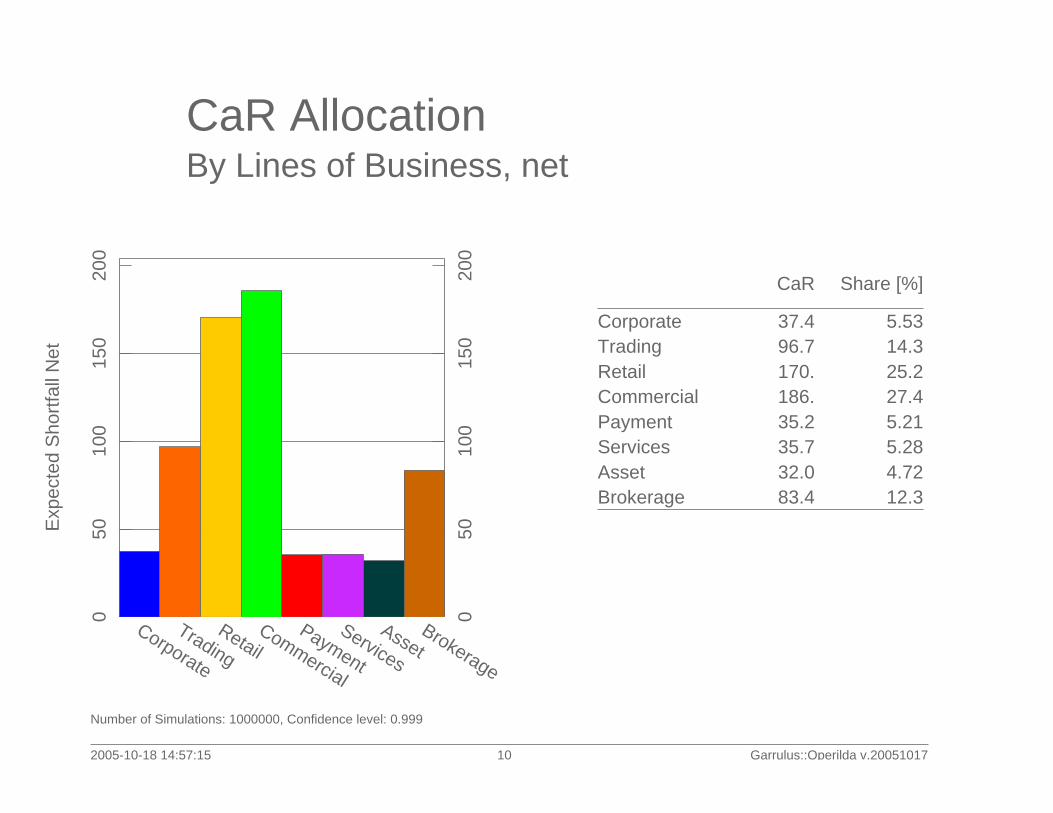
CaR AllocationBy Lines of Business, net
2005-10-18 14:57:15 10 Garrulus::Operilda v.20051017
Number of Simulations: 1000000, Confidence level: 0.999
0 0
50 50
100
100
150
150
200
200
Exp
ecte
d S
hort
fall
Net
Corporate
Trading
RetailCommercial
Payment
Services
AssetBrokerage
CorporateTradingRetailCommercialPaymentServicesAssetBrokerage
CaR
37.496.7170.186.35.235.732.083.4
Share [%]
5.5314.325.227.45.215.284.7212.3

Analysis by Events
2005-10-18 14:57:15 11 Garrulus::Operilda v.20051017
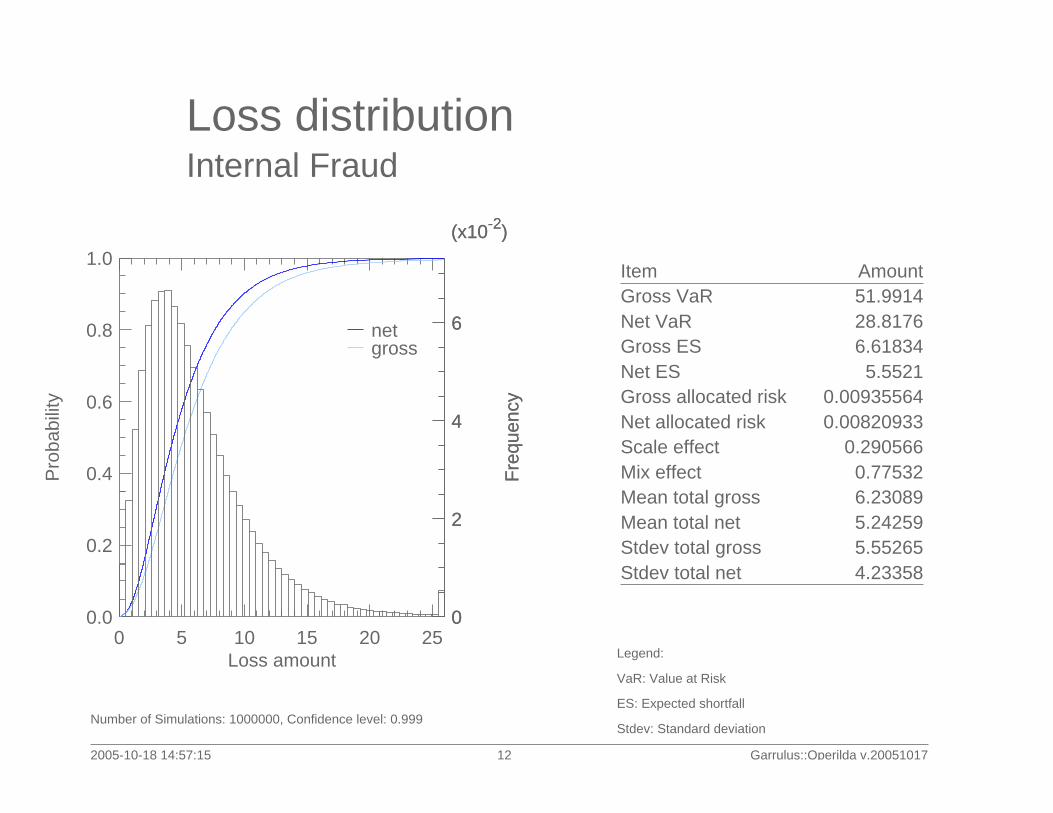
Loss distributionInternal Fraud
2005-10-18 14:57:15 12 Garrulus::Operilda v.20051017
Number of Simulations: 1000000, Confidence level: 0.999
Legend:
VaR: Value at Risk
ES: Expected shortfall
Stdev: Standard deviation
0 5 10 15 20 250.0
0.2
0.4
0.6
0.8
1.0
Loss amount
Pro
babi
lity
netgross
0
2
4
6
(x10-2)
Fre
quen
cy
0
2
4
6
(x10-2)
Fre
quen
cy
Item AmountGross VaR 51.9914Net VaR 28.8176Gross ES 6.61834Net ES 5.5521Gross allocated risk 0.00935564Net allocated risk 0.00820933Scale effect 0.290566Mix effect 0.77532Mean total gross 6.23089Mean total net 5.24259Stdev total gross 5.55265Stdev total net 4.23358

Loss distributionExternal Fraud
2005-10-18 14:57:15 13 Garrulus::Operilda v.20051017
Number of Simulations: 1000000, Confidence level: 0.999
Legend:
VaR: Value at Risk
ES: Expected shortfall
Stdev: Standard deviation
0 10 20 300.0
0.2
0.4
0.6
0.8
1.0
Loss amount
Pro
babi
lity
netgross
0
2
4
6
(x10-2)
Fre
quen
cy
0
2
4
6
(x10-2)
Fre
quen
cy
Item AmountGross VaR 38.3511Net VaR 37.3914Gross ES 13.5248Net ES 13.3249Gross allocated risk 0.0191185Net allocated risk 0.0197021Scale effect 0.593781Mix effect -0.394738Mean total gross 13.4058Mean total net 13.195Stdev total gross 4.71827Stdev total net 4.63113
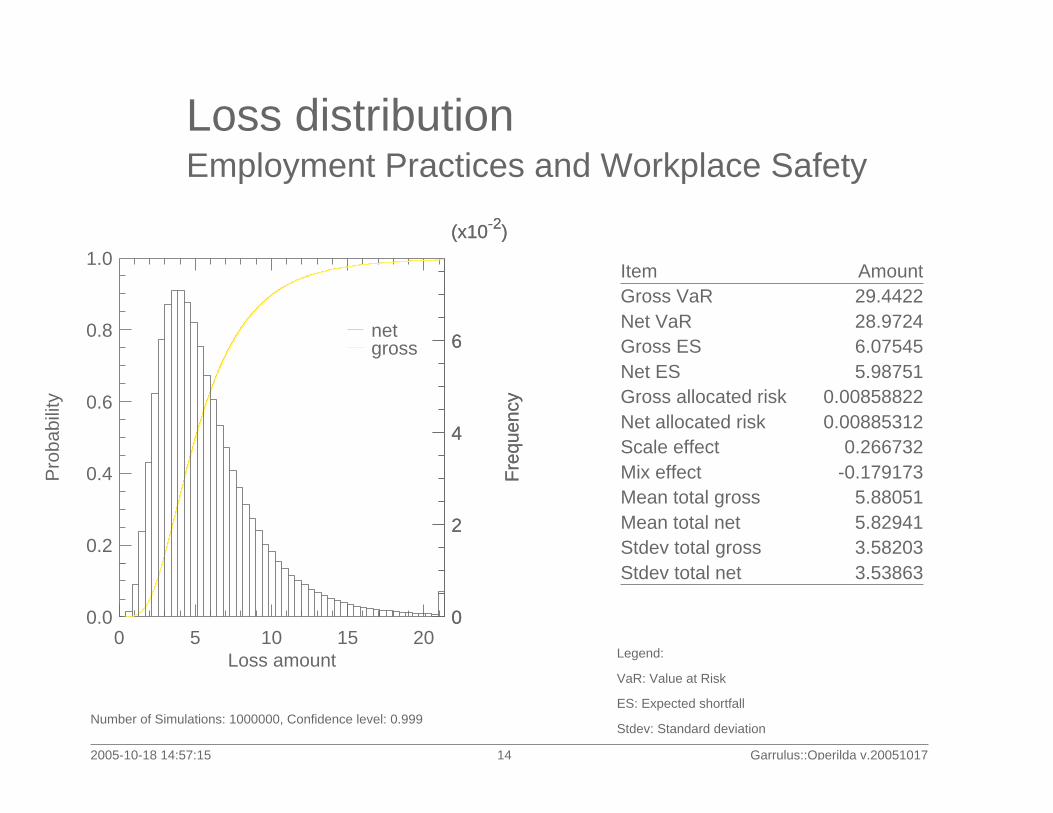
Loss distributionEmployment Practices and Workplace Safety
2005-10-18 14:57:15 14 Garrulus::Operilda v.20051017
Number of Simulations: 1000000, Confidence level: 0.999
Legend:
VaR: Value at Risk
ES: Expected shortfall
Stdev: Standard deviation
0 5 10 15 200.0
0.2
0.4
0.6
0.8
1.0
Loss amount
Pro
babi
lity
netgross
0
2
4
6
(x10-2)
Fre
quen
cy
0
2
4
6
(x10-2)
Fre
quen
cy
Item AmountGross VaR 29.4422Net VaR 28.9724Gross ES 6.07545Net ES 5.98751Gross allocated risk 0.00858822Net allocated risk 0.00885312Scale effect 0.266732Mix effect -0.179173Mean total gross 5.88051Mean total net 5.82941Stdev total gross 3.58203Stdev total net 3.53863
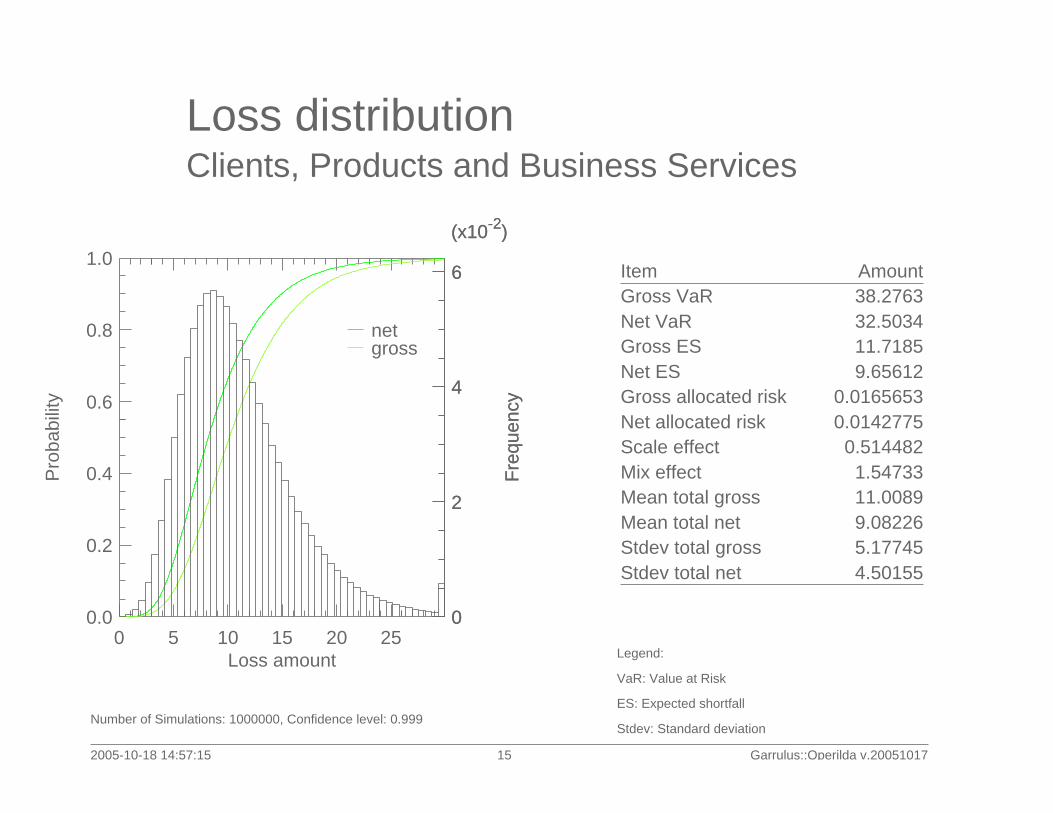
Loss distributionClients, Products and Business Services
2005-10-18 14:57:15 15 Garrulus::Operilda v.20051017
Number of Simulations: 1000000, Confidence level: 0.999
Legend:
VaR: Value at Risk
ES: Expected shortfall
Stdev: Standard deviation
0 5 10 15 20 250.0
0.2
0.4
0.6
0.8
1.0
Loss amount
Pro
babi
lity
netgross
0
2
4
6
(x10-2)
Fre
quen
cy
0
2
4
6
(x10-2)
Fre
quen
cy
Item AmountGross VaR 38.2763Net VaR 32.5034Gross ES 11.7185Net ES 9.65612Gross allocated risk 0.0165653Net allocated risk 0.0142775Scale effect 0.514482Mix effect 1.54733Mean total gross 11.0089Mean total net 9.08226Stdev total gross 5.17745Stdev total net 4.50155
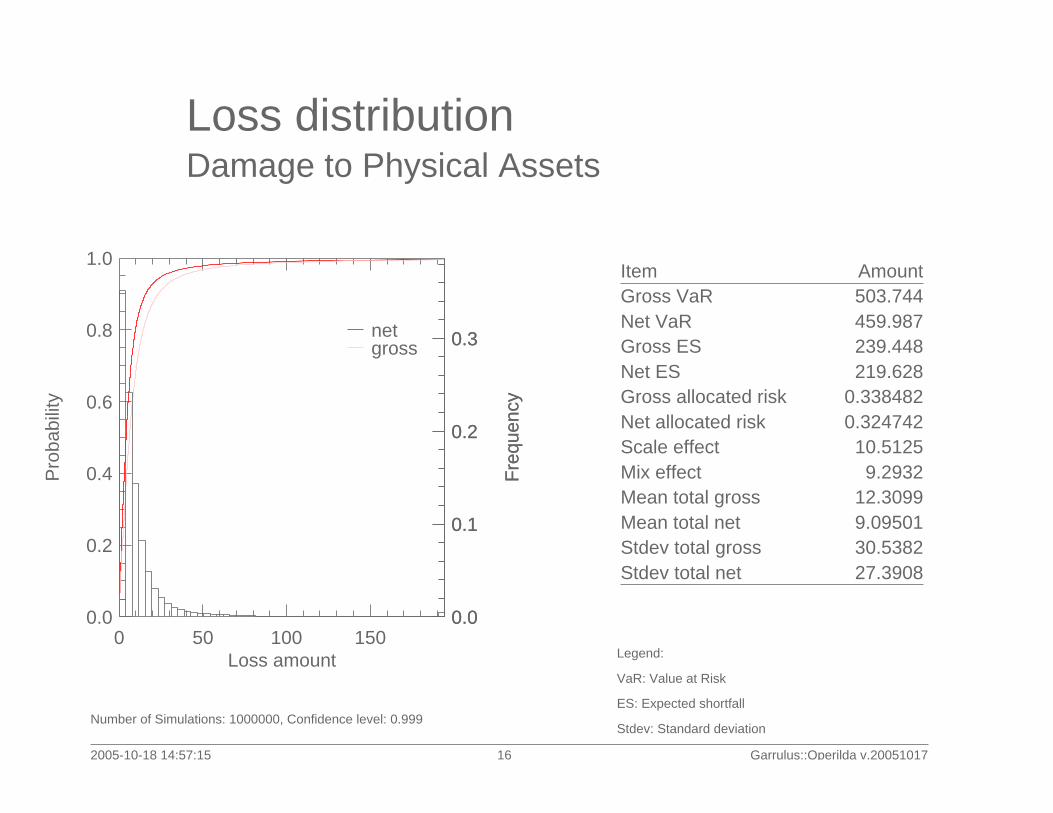
Loss distributionDamage to Physical Assets
2005-10-18 14:57:15 16 Garrulus::Operilda v.20051017
Number of Simulations: 1000000, Confidence level: 0.999
Legend:
VaR: Value at Risk
ES: Expected shortfall
Stdev: Standard deviation
0 50 100 1500.0
0.2
0.4
0.6
0.8
1.0
Loss amount
Pro
babi
lity
netgross
0.0
0.1
0.2
0.3
Fre
quen
cy
0.0
0.1
0.2
0.3
Fre
quen
cy
Item AmountGross VaR 503.744Net VaR 459.987Gross ES 239.448Net ES 219.628Gross allocated risk 0.338482Net allocated risk 0.324742Scale effect 10.5125Mix effect 9.2932Mean total gross 12.3099Mean total net 9.09501Stdev total gross 30.5382Stdev total net 27.3908

Loss distributionBusiness Disruption and System Failures
2005-10-18 14:57:15 17 Garrulus::Operilda v.20051017
Number of Simulations: 1000000, Confidence level: 0.999
Legend:
VaR: Value at Risk
ES: Expected shortfall
Stdev: Standard deviation
0 2 4 6 8 100.0
0.2
0.4
0.6
0.8
1.0
Loss amount
Pro
babi
lity
netgross
0
2
4
6
(x10-2)
Fre
quen
cy
0
2
4
6
(x10-2)
Fre
quen
cy
Item AmountGross VaR 16.8831Net VaR 12.0316Gross ES 2.74374Net ES 2.3089Gross allocated risk 0.00387854Net allocated risk 0.00341394Scale effect 0.120459Mix effect 0.314236Mean total gross 2.30668Mean total net 1.92721Stdev total gross 1.96868Stdev total net 1.49883

Loss distributionExecution, Delivery and Process Management
2005-10-18 14:57:15 18 Garrulus::Operilda v.20051017
Number of Simulations: 1000000, Confidence level: 0.999
Legend:
VaR: Value at Risk
ES: Expected shortfall
Stdev: Standard deviation
0 20 40 60 800.0
0.2
0.4
0.6
0.8
1.0
Loss amount
Pro
babi
lity
netgross
0
2
4
6
(x10-2)
Fre
quen
cy
0
2
4
6
(x10-2)
Fre
quen
cy
Item AmountGross VaR 111.758Net VaR 107.355Gross ES 26.7673Net ES 25.2588Gross allocated risk 0.037838Net allocated risk 0.0373476Scale effect 1.17517Mix effect 0.331713Mean total gross 25.4193Mean total net 23.7281Stdev total gross 15.9477Stdev total net 15.5122

Loss distributionExtremal Events
2005-10-18 14:57:15 19 Garrulus::Operilda v.20051017
Number of Simulations: 1000000, Confidence level: 0.999
Legend:
VaR: Value at Risk
ES: Expected shortfall
Stdev: Standard deviation
0 50 100 150 200 2500.0
0.2
0.4
0.6
0.8
1.0
Loss amount
Pro
babi
lity
netgross
0.0
0.2
0.4
0.6
0.8
Fre
quen
cy
0.0
0.2
0.4
0.6
0.8
Fre
quen
cy
Item AmountGross VaR 608.908Net VaR 590.076Gross ES 400.519Net ES 394.599Gross allocated risk 0.566171Net allocated risk 0.583453Scale effect 17.5841Mix effect -11.6889Mean total gross 11.5348Mean total net 10.1619Stdev total gross 52.1198Stdev total net 49.7258

Analysis by Lines of Business
2005-10-18 14:57:15 20 Garrulus::Operilda v.20051017
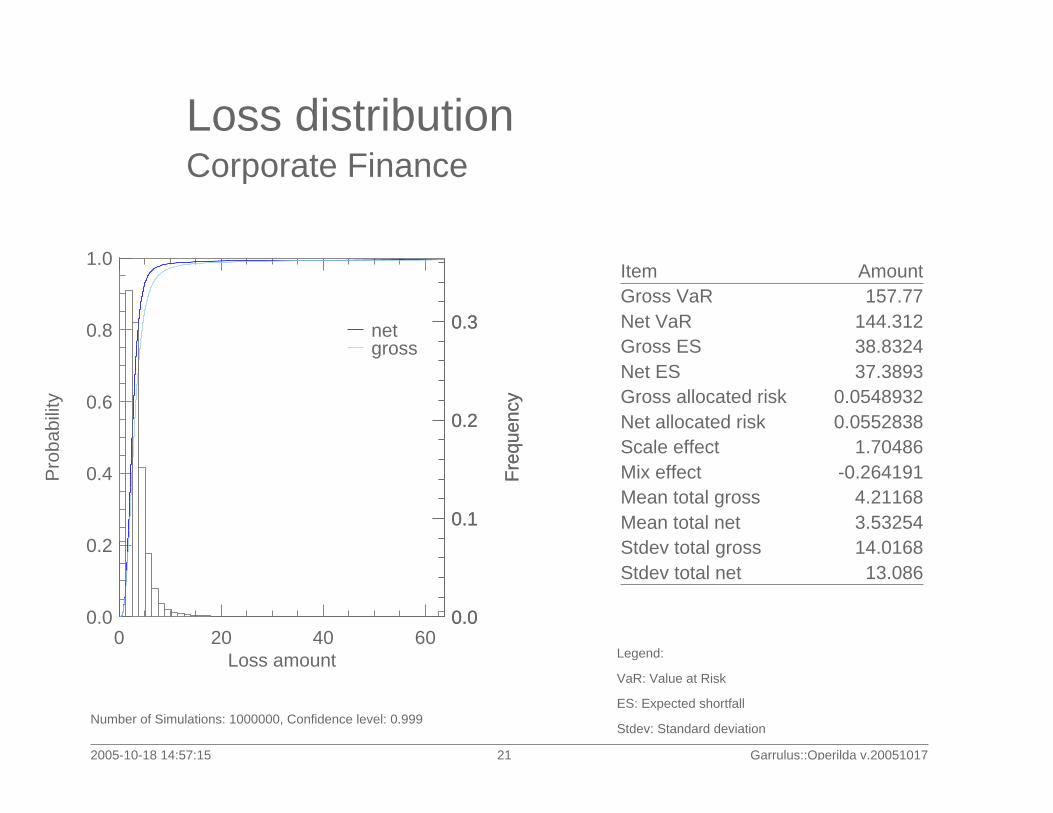
Loss distributionCorporate Finance
2005-10-18 14:57:15 21 Garrulus::Operilda v.20051017
Number of Simulations: 1000000, Confidence level: 0.999
Legend:
VaR: Value at Risk
ES: Expected shortfall
Stdev: Standard deviation
0 20 40 600.0
0.2
0.4
0.6
0.8
1.0
Loss amount
Pro
babi
lity
netgross
0.0
0.1
0.2
0.3
Fre
quen
cy
0.0
0.1
0.2
0.3
Fre
quen
cy
Item AmountGross VaR 157.77Net VaR 144.312Gross ES 38.8324Net ES 37.3893Gross allocated risk 0.0548932Net allocated risk 0.0552838Scale effect 1.70486Mix effect -0.264191Mean total gross 4.21168Mean total net 3.53254Stdev total gross 14.0168Stdev total net 13.086

Loss distributionTrading and Sales
2005-10-18 14:57:15 22 Garrulus::Operilda v.20051017
Number of Simulations: 1000000, Confidence level: 0.999
Legend:
VaR: Value at Risk
ES: Expected shortfall
Stdev: Standard deviation
0 20 40 60 80 100 1200.0
0.2
0.4
0.6
0.8
1.0
Loss amount
Pro
babi
lity
netgross
0.00
0.05
0.10
0.15
0.20
Fre
quen
cy
0.00
0.05
0.10
0.15
0.20
Fre
quen
cy
Item AmountGross VaR 286.491Net VaR 271.459Gross ES 100.034Net ES 96.6932Gross allocated risk 0.141407Net allocated risk 0.14297Scale effect 4.39179Mix effect -1.05761Mean total gross 14.9802Mean total net 13.4944Stdev total gross 24.8038Stdev total net 23.4448
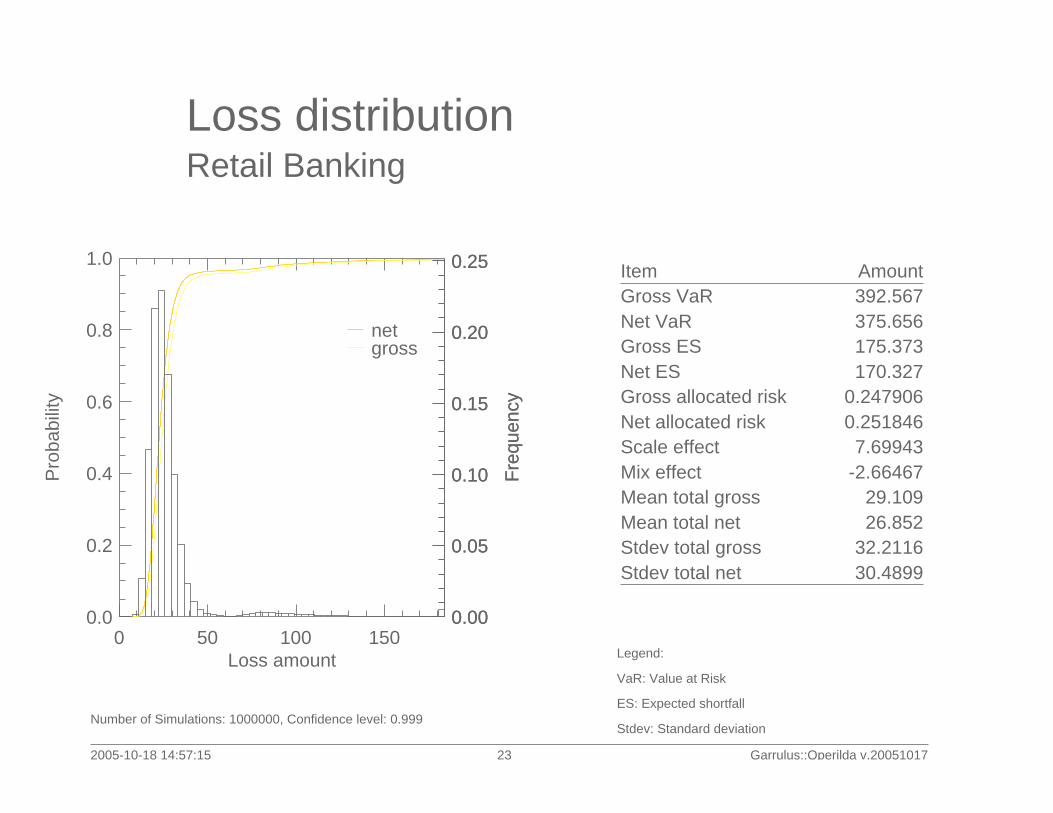
Loss distributionRetail Banking
2005-10-18 14:57:15 23 Garrulus::Operilda v.20051017
Number of Simulations: 1000000, Confidence level: 0.999
Legend:
VaR: Value at Risk
ES: Expected shortfall
Stdev: Standard deviation
0 50 100 1500.0
0.2
0.4
0.6
0.8
1.0
Loss amount
Pro
babi
lity
netgross
0.00
0.05
0.10
0.15
0.20
0.25
Fre
quen
cy
0.00
0.05
0.10
0.15
0.20
0.25
Fre
quen
cy
Item AmountGross VaR 392.567Net VaR 375.656Gross ES 175.373Net ES 170.327Gross allocated risk 0.247906Net allocated risk 0.251846Scale effect 7.69943Mix effect -2.66467Mean total gross 29.109Mean total net 26.852Stdev total gross 32.2116Stdev total net 30.4899
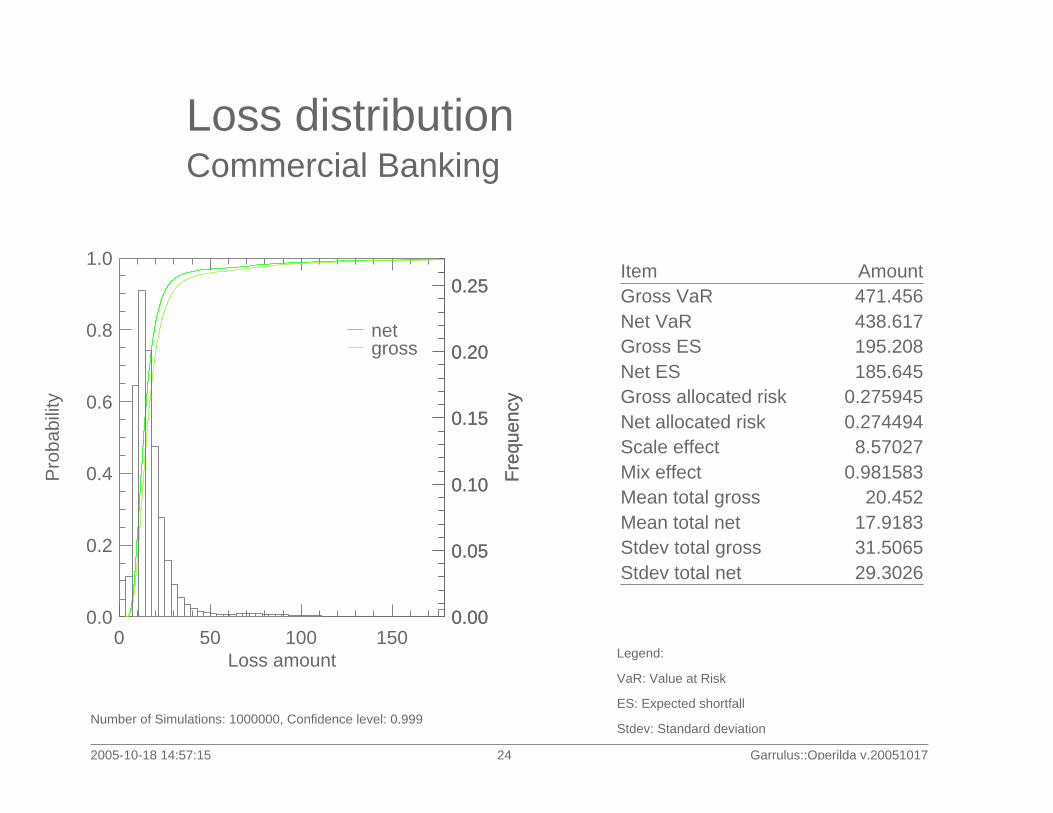
Loss distributionCommercial Banking
2005-10-18 14:57:15 24 Garrulus::Operilda v.20051017
Number of Simulations: 1000000, Confidence level: 0.999
Legend:
VaR: Value at Risk
ES: Expected shortfall
Stdev: Standard deviation
0 50 100 1500.0
0.2
0.4
0.6
0.8
1.0
Loss amount
Pro
babi
lity
netgross
0.00
0.05
0.10
0.15
0.20
0.25
Fre
quen
cy
0.00
0.05
0.10
0.15
0.20
0.25
Fre
quen
cy
Item AmountGross VaR 471.456Net VaR 438.617Gross ES 195.208Net ES 185.645Gross allocated risk 0.275945Net allocated risk 0.274494Scale effect 8.57027Mix effect 0.981583Mean total gross 20.452Mean total net 17.9183Stdev total gross 31.5065Stdev total net 29.3026

Loss distributionPayment and Settlement
2005-10-18 14:57:15 25 Garrulus::Operilda v.20051017
Number of Simulations: 1000000, Confidence level: 0.999
Legend:
VaR: Value at Risk
ES: Expected shortfall
Stdev: Standard deviation
0 20 40 600.0
0.2
0.4
0.6
0.8
1.0
Loss amount
Pro
babi
lity
netgross
0.0
0.1
0.2
0.3
0.4
Fre
quen
cy
0.0
0.1
0.2
0.3
0.4
Fre
quen
cy
Item AmountGross VaR 157.442Net VaR 143.774Gross ES 36.0271Net ES 35.234Gross allocated risk 0.0509277Net allocated risk 0.052097Scale effect 1.58171Mix effect -0.790874Mean total gross 3.59859Mean total net 3.13489Stdev total gross 13.778Stdev total net 12.9357
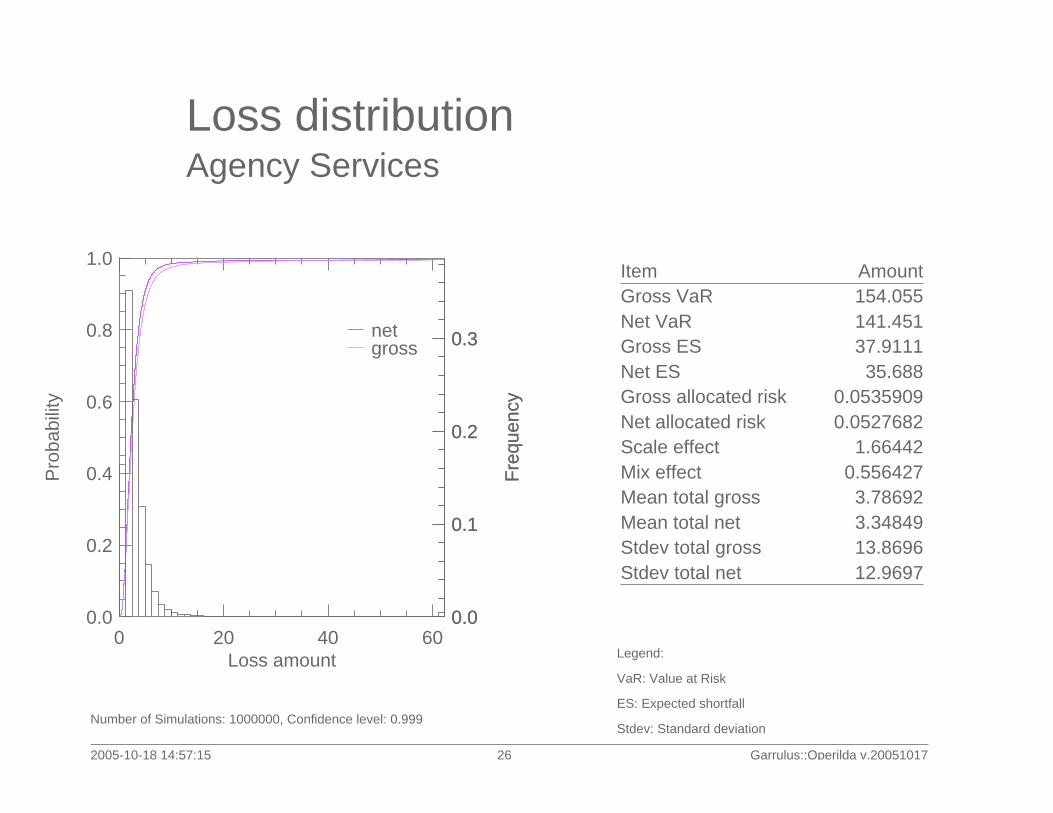
Loss distributionAgency Services
2005-10-18 14:57:15 26 Garrulus::Operilda v.20051017
Number of Simulations: 1000000, Confidence level: 0.999
Legend:
VaR: Value at Risk
ES: Expected shortfall
Stdev: Standard deviation
0 20 40 600.0
0.2
0.4
0.6
0.8
1.0
Loss amount
Pro
babi
lity
netgross
0.0
0.1
0.2
0.3
Fre
quen
cy
0.0
0.1
0.2
0.3
Fre
quen
cy
Item AmountGross VaR 154.055Net VaR 141.451Gross ES 37.9111Net ES 35.688Gross allocated risk 0.0535909Net allocated risk 0.0527682Scale effect 1.66442Mix effect 0.556427Mean total gross 3.78692Mean total net 3.34849Stdev total gross 13.8696Stdev total net 12.9697
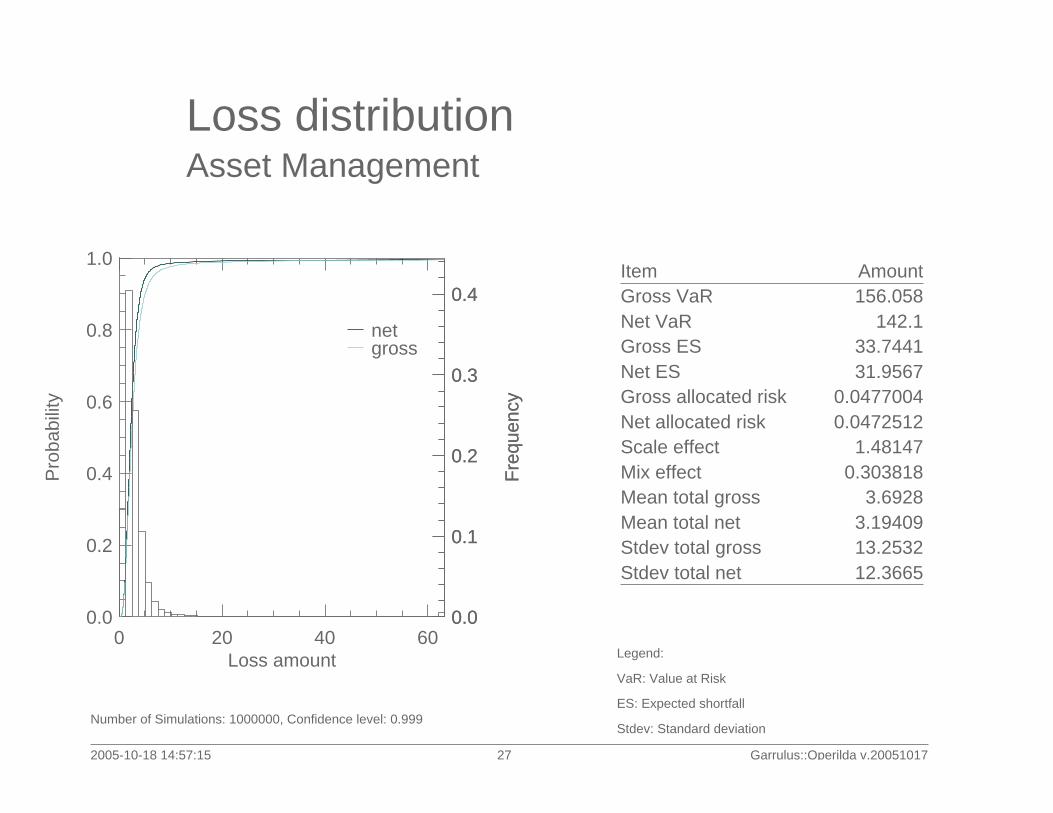
Loss distributionAsset Management
2005-10-18 14:57:15 27 Garrulus::Operilda v.20051017
Number of Simulations: 1000000, Confidence level: 0.999
Legend:
VaR: Value at Risk
ES: Expected shortfall
Stdev: Standard deviation
0 20 40 600.0
0.2
0.4
0.6
0.8
1.0
Loss amount
Pro
babi
lity
netgross
0.0
0.1
0.2
0.3
0.4
Fre
quen
cy
0.0
0.1
0.2
0.3
0.4
Fre
quen
cy
Item AmountGross VaR 156.058Net VaR 142.1Gross ES 33.7441Net ES 31.9567Gross allocated risk 0.0477004Net allocated risk 0.0472512Scale effect 1.48147Mix effect 0.303818Mean total gross 3.6928Mean total net 3.19409Stdev total gross 13.2532Stdev total net 12.3665

Loss distributionRetail Brokerage
2005-10-18 14:57:15 28 Garrulus::Operilda v.20051017
Number of Simulations: 1000000, Confidence level: 0.999
Legend:
VaR: Value at Risk
ES: Expected shortfall
Stdev: Standard deviation
0 20 40 60 800.0
0.2
0.4
0.6
0.8
1.0
Loss amount
Pro
babi
lity
netgross
0.0
0.1
0.2
0.3
Fre
quen
cy
0.0
0.1
0.2
0.3
Fre
quen
cy
Item AmountGross VaR 290.022Net VaR 267.345Gross ES 90.2863Net ES 83.3827Gross allocated risk 0.127628Net allocated risk 0.12329Scale effect 3.96385Mix effect 2.93436Mean total gross 8.26779Mean total net 6.78802Stdev total gross 19.8057Stdev total net 18.0665

Insurance analysis
2005-10-18 14:57:15 29 Garrulus::Operilda v.20051017

Loss distributionFI
2005-10-18 14:57:15 30 Garrulus::Operilda v.20051017
Number of Simulations: 1000000, Confidence level: 0.999
Legend:
CaR: Capital at Risk
Stdev: Standard deviation
CoC: Cost of Capital
Total Premium=Expected losses + loading x Stdev
0 20 40 600.0
0.2
0.4
0.6
0.8
1.0
Claims paid
Pro
babi
lity
CaRShare CaR [%]CaR x CoCPure PremiumStdevTheoretical premiumPremium paidBreak-even CoC [%]
Amount
21.33.014.268.2010.310.311.348.1

Loss distributionTerrorism
2005-10-18 14:57:15 31 Garrulus::Operilda v.20051017
Number of Simulations: 1000000, Confidence level: 0.999
Legend:
CaR: Capital at Risk
Stdev: Standard deviation
CoC: Cost of Capital
Total Premium=Expected losses + loading x Stdev
-1.0 -0.5 0.0 0.5 1.00.0
0.2
0.4
0.6
0.8
1.0
Claims paid
Pro
babi
lity
CaRShare CaR [%]CaR x CoCPure PremiumStdevTheoretical premiumPremium paidBreak-even CoC [%]
Amount
0.7970.1130.1590.1152.91
0.6980.42087.6

Loss distributionLiability
2005-10-18 14:57:15 32 Garrulus::Operilda v.20051017
Number of Simulations: 1000000, Confidence level: 0.999
Legend:
CaR: Capital at Risk
Stdev: Standard deviation
CoC: Cost of Capital
Total Premium=Expected losses + loading x Stdev
0 10 20 30 400.0
0.2
0.4
0.6
0.8
1.0
Claims paid
Pro
babi
lity
CaRShare CaR [%]CaR x CoCPure PremiumStdevTheoretical premiumPremium paidBreak-even CoC [%]
Amount
5.090.7191.02
0.8625.211.901.4537.4
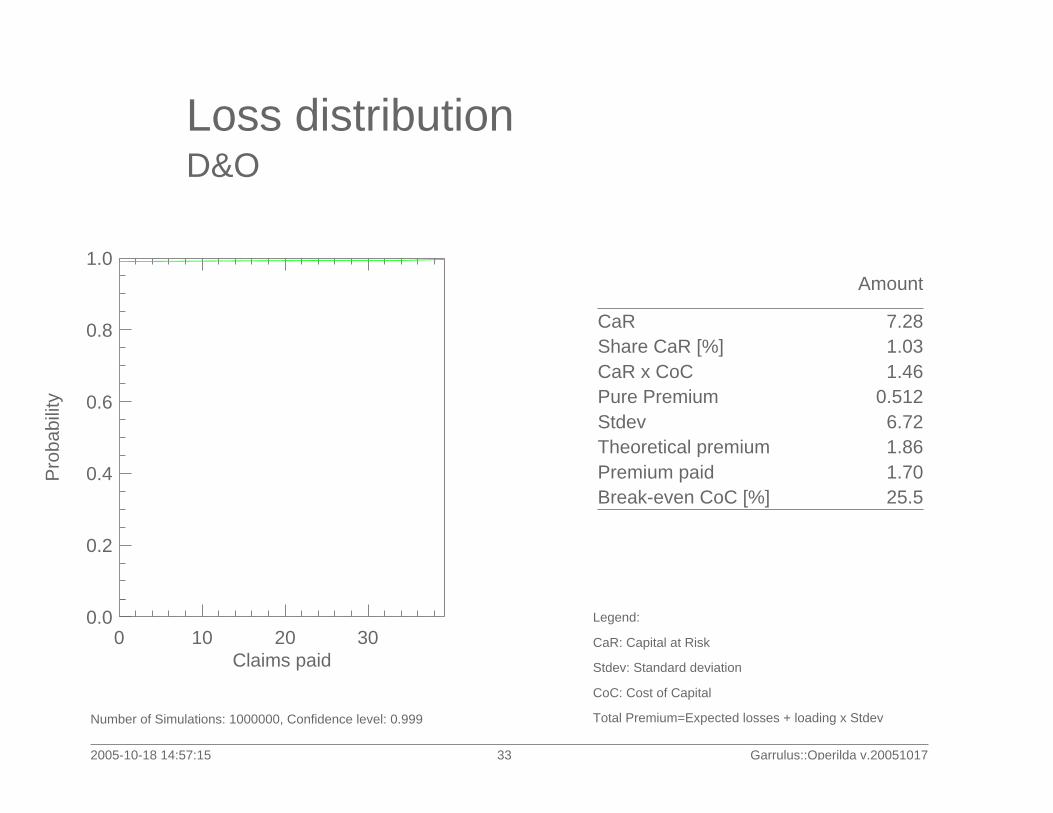
Loss distributionD&O
2005-10-18 14:57:15 33 Garrulus::Operilda v.20051017
Number of Simulations: 1000000, Confidence level: 0.999
Legend:
CaR: Capital at Risk
Stdev: Standard deviation
CoC: Cost of Capital
Total Premium=Expected losses + loading x Stdev
0 10 20 300.0
0.2
0.4
0.6
0.8
1.0
Claims paid
Pro
babi
lity
CaRShare CaR [%]CaR x CoCPure PremiumStdevTheoretical premiumPremium paidBreak-even CoC [%]
Amount
7.281.031.46
0.5126.721.861.7025.5
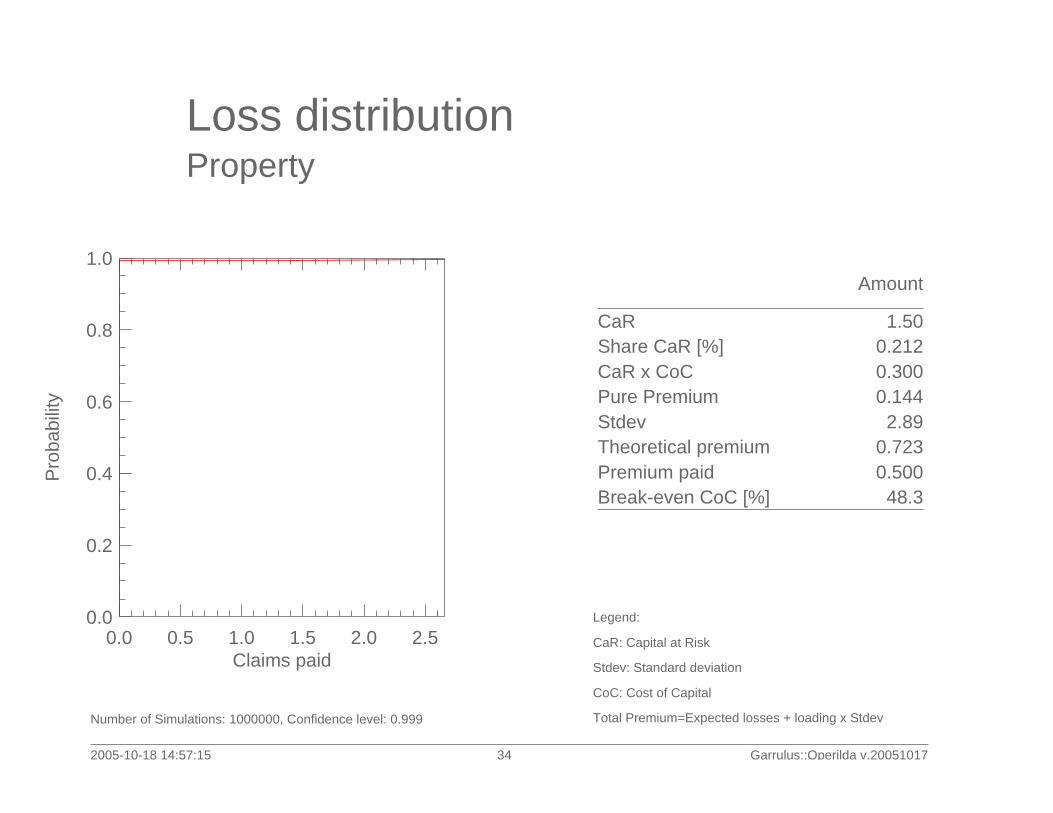
Loss distributionProperty
2005-10-18 14:57:15 34 Garrulus::Operilda v.20051017
Number of Simulations: 1000000, Confidence level: 0.999
Legend:
CaR: Capital at Risk
Stdev: Standard deviation
CoC: Cost of Capital
Total Premium=Expected losses + loading x Stdev
0.0 0.5 1.0 1.5 2.0 2.50.0
0.2
0.4
0.6
0.8
1.0
Claims paid
Pro
babi
lity
CaRShare CaR [%]CaR x CoCPure PremiumStdevTheoretical premiumPremium paidBreak-even CoC [%]
Amount
1.500.2120.3000.1442.89
0.7230.50048.3

Performance
2005-10-18 14:57:15 35 Garrulus::Operilda v.20051017
Elapsed time: 284 [sec]

Quality assurance
2005-10-18 14:57:15 36 Garrulus::Operilda v.20051017

Event loss generatorsCompound distributions
2005-10-18 14:57:15 37 Garrulus::Operilda v.20051017
Number of Simulations: 1000000, Confidence level: 0.999
InternalExternalEmploymentClientsPhysicalDisruptionExecutionExtreme
µ N samp
1.6422.21.147.001.351.7511.4
0.112
µ N theo
1.6422.21.147.001.351.7611.4
0.112
σ N samp
1.284.751.072.581.161.543.29
0.335
σ N theo
1.284.711.072.651.161.543.37
0.335
µ S samp
2.084.04
0.7766.0711.01.576.6511.5
µ S theo
2.084.05
0.7776.0711.01.576.6611.5
σ S samp
4.391.341.223.2530.51.884.4352.1
σ S theo
1.621.321.233.269.431.851.9734.4
Legend: N: Frequency S: Compound
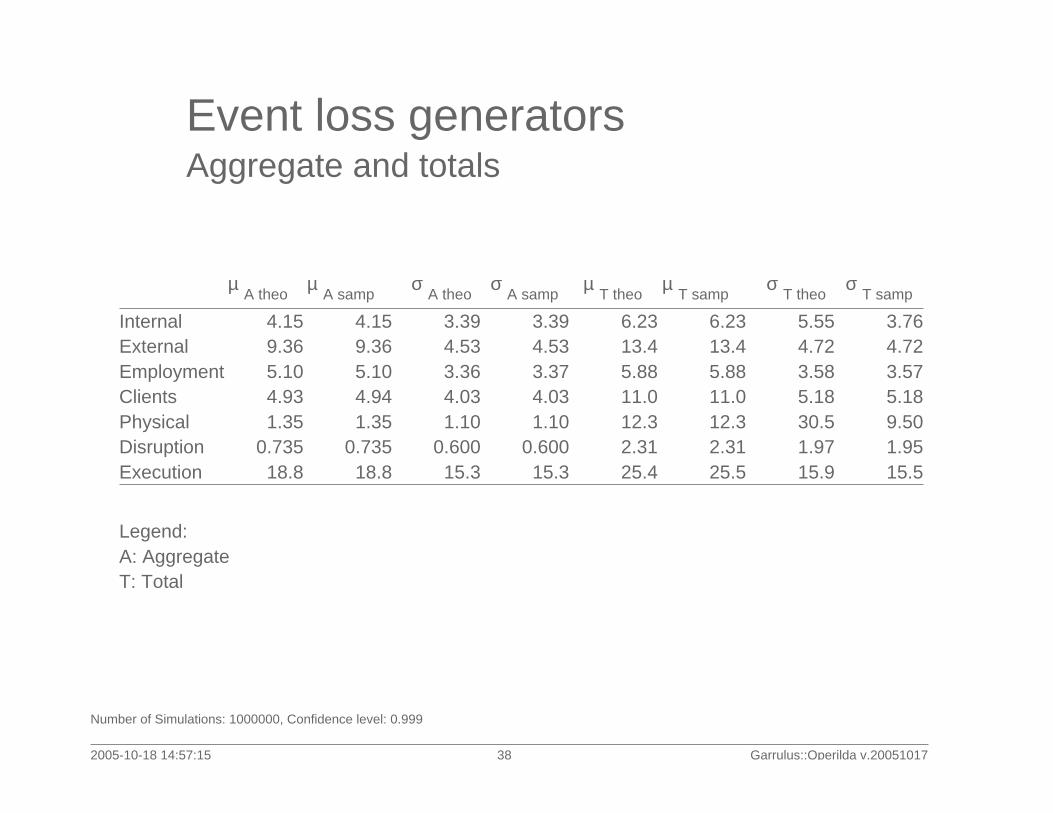
Event loss generatorsAggregate and totals
2005-10-18 14:57:15 38 Garrulus::Operilda v.20051017
Number of Simulations: 1000000, Confidence level: 0.999
InternalExternalEmploymentClientsPhysicalDisruptionExecution
µ A theo
4.159.365.104.931.35
0.73518.8
µ A samp
4.159.365.104.941.35
0.73518.8
σ A theo
3.394.533.364.031.10
0.60015.3
σ A samp
3.394.533.374.031.10
0.60015.3
µ T theo
6.2313.45.8811.012.32.3125.4
µ T samp
6.2313.45.8811.012.32.3125.5
σ T theo
5.554.723.585.1830.51.9715.9
σ T samp
3.764.723.575.189.501.9515.5
Legend: A: Aggregate T: Total

CorrelationFrequencies: theoretical vs sample
2005-10-18 14:57:15 39 Garrulus::Operilda v.20051017
Number of Simulations: 1000000, Confidence level: 0.999
InternalExternalEmploymentClientsPhysicalDisruptionExecutionExtreme
Internal
1.00.30
0.0990.100.10
0.0990.20
-0.0012
External
0.301.0
0.100.200.10
0.0980.10
-0.0022
Employment
0.100.101.0
0.100.100.100.10
-0.00031
Clients
0.100.200.101.0
0.100.10
0.0990.098
Physical
0.100.100.100.101.0
0.200.10
0.099
Disruption
0.100.100.100.100.201.0
0.100.10
Execution
0.200.100.100.100.100.101.0
-0.00015
Extreme
0.000.000.000.100.100.100.001.0
Legend: Lower triangle: sampleUpper triangle: theoretical (on input)

CorrelationEvents’ total loss
2005-10-18 14:57:15 40 Garrulus::Operilda v.20051017
Number of Simulations: 1000000, Confidence level: 0.999
InternalExternalEmploymentClientsPhysicalDisruptionExecutionExtreme
Internal
1.00.017
0.00460.012
0.00870.022
0.00920.00092
External
0.0171.0
0.00240.015
0.00550.012
0.00043-0.00049
Employment
0.00460.0024
1.00.010
0.00740.015
0.00180.00053
Clients
0.0120.0150.010
1.00.0160.031
0.00390.029
Physical
0.00870.00550.00740.016
1.00.045
0.00440.019
Disruption
0.0220.0120.0150.0310.045
1.00.00870.047
Execution
0.00920.000430.00180.00390.00440.0087
1.08.2e-005
Extreme
0.00092-0.000490.00053
0.0290.0190.047
8.2e-0051.0

CorrelationLines of Business’ total loss
2005-10-18 14:57:15 41 Garrulus::Operilda v.20051017
Number of Simulations: 1000000, Confidence level: 0.999
CorporateTradingRetailCommercialPaymentServicesAssetBrokerage
Corporate
1.00.00780.00870.00890.00260.00480.00260.0063
Trading
0.00781.0
0.0250.0330.0120.0190.0160.011
Retail
0.00870.025
1.00.026
0.00880.0120.0110.014
Commercial
0.00890.0330.026
1.00.0100.0160.0110.012
Payment
0.00260.012
0.00880.010
1.00.00560.00440.0058
Services
0.00480.0190.0120.016
0.00561.0
0.00820.0058
Asset
0.00260.0160.0110.011
0.00440.0082
1.00.0057
Brokerage
0.00630.0110.0140.012
0.00580.00580.0057
1.0
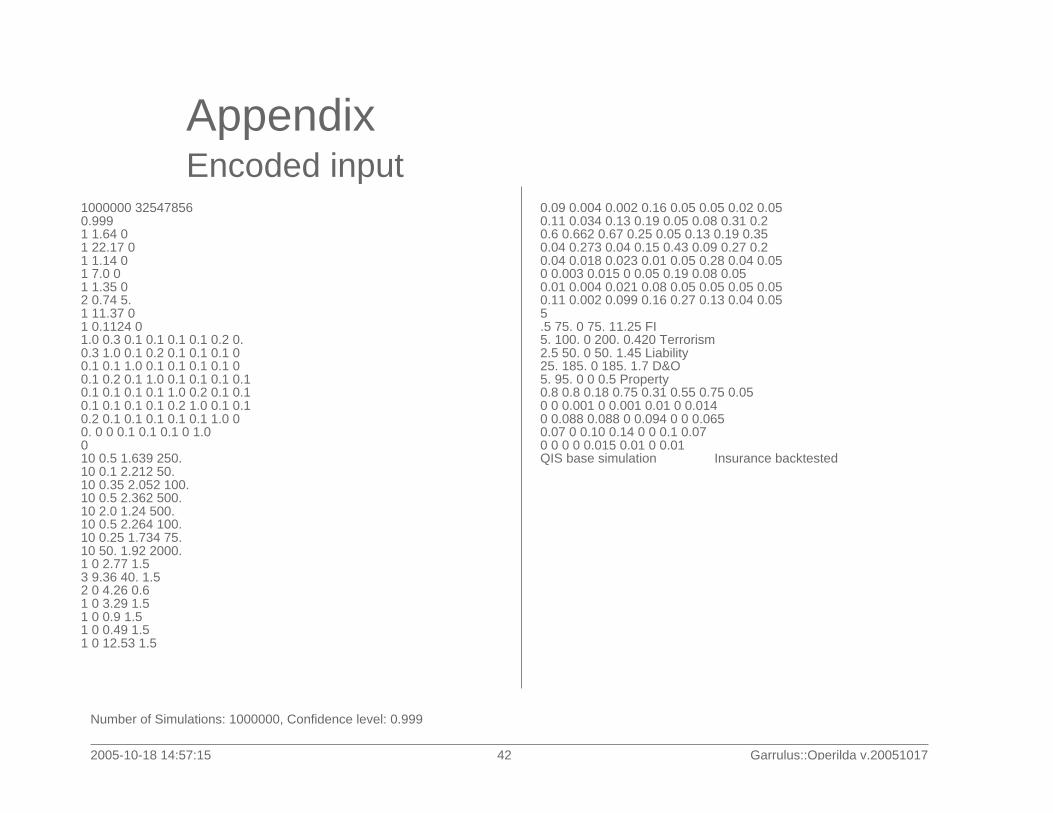
AppendixEncoded input
2005-10-18 14:57:15 42 Garrulus::Operilda v.20051017
Number of Simulations: 1000000, Confidence level: 0.999
1000000 32547856 0.999 1 1.64 0 1 22.17 0 1 1.14 0 1 7.0 0 1 1.35 0 2 0.74 5. 1 11.37 0 1 0.1124 0 1.0 0.3 0.1 0.1 0.1 0.1 0.2 0. 0.3 1.0 0.1 0.2 0.1 0.1 0.1 0 0.1 0.1 1.0 0.1 0.1 0.1 0.1 0 0.1 0.2 0.1 1.0 0.1 0.1 0.1 0.1 0.1 0.1 0.1 0.1 1.0 0.2 0.1 0.1 0.1 0.1 0.1 0.1 0.2 1.0 0.1 0.1 0.2 0.1 0.1 0.1 0.1 0.1 1.0 0 0. 0 0 0.1 0.1 0.1 0 1.0 0 10 0.5 1.639 250. 10 0.1 2.212 50. 10 0.35 2.052 100. 10 0.5 2.362 500. 10 2.0 1.24 500. 10 0.5 2.264 100. 10 0.25 1.734 75. 10 50. 1.92 2000. 1 0 2.77 1.5 3 9.36 40. 1.5 2 0 4.26 0.6 1 0 3.29 1.5 1 0 0.9 1.5 1 0 0.49 1.5 1 0 12.53 1.5
0.09 0.004 0.002 0.16 0.05 0.05 0.02 0.05 0.11 0.034 0.13 0.19 0.05 0.08 0.31 0.2 0.6 0.662 0.67 0.25 0.05 0.13 0.19 0.35 0.04 0.273 0.04 0.15 0.43 0.09 0.27 0.2 0.04 0.018 0.023 0.01 0.05 0.28 0.04 0.05 0 0.003 0.015 0 0.05 0.19 0.08 0.05 0.01 0.004 0.021 0.08 0.05 0.05 0.05 0.05 0.11 0.002 0.099 0.16 0.27 0.13 0.04 0.05 5 .5 75. 0 75. 11.25 FI 5. 100. 0 200. 0.420 Terrorism 2.5 50. 0 50. 1.45 Liability 25. 185. 0 185. 1.7 D&O 5. 95. 0 0 0.5 Property 0.8 0.8 0.18 0.75 0.31 0.55 0.75 0.05 0 0 0.001 0 0.001 0.01 0 0.014 0 0.088 0.088 0 0.094 0 0 0.065 0.07 0 0.10 0.14 0 0 0.1 0.07 0 0 0 0 0.015 0.01 0 0.01 QIS base simulation Insurance backtested
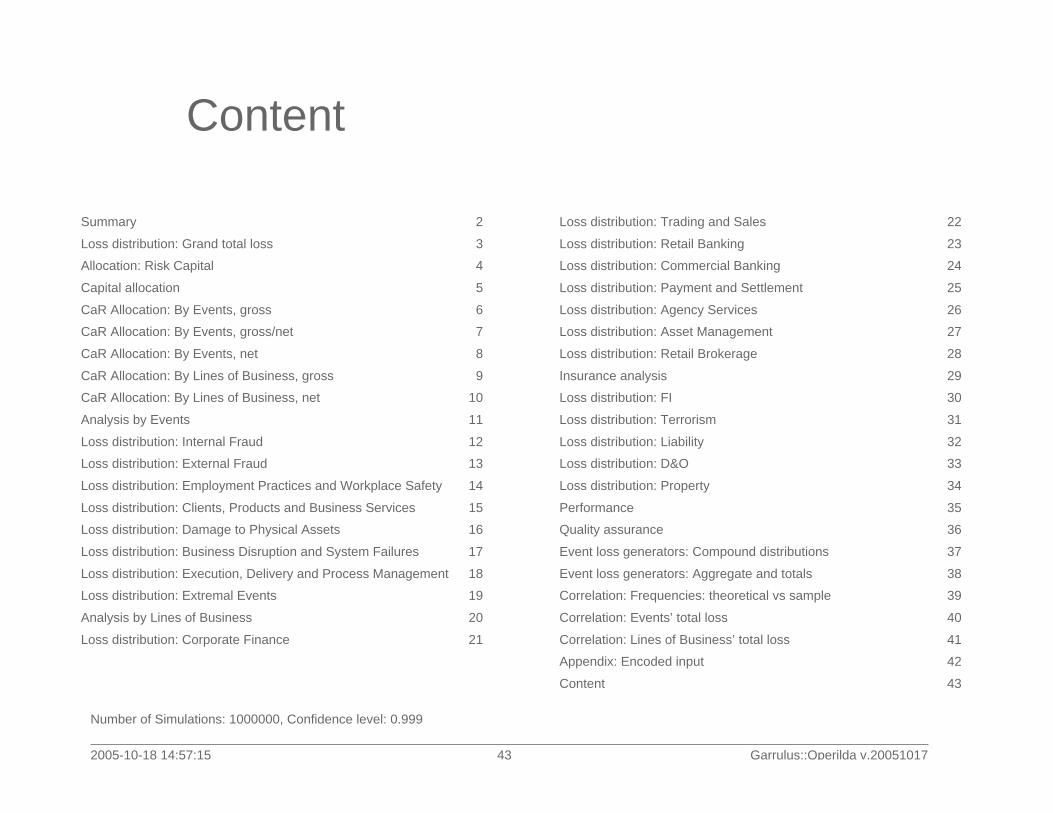
Content
2005-10-18 14:57:15 43 Garrulus::Operilda v.20051017
Number of Simulations: 1000000, Confidence level: 0.999
Summary 2
Loss distribution: Grand total loss 3
Allocation: Risk Capital 4
Capital allocation 5
CaR Allocation: By Events, gross 6
CaR Allocation: By Events, gross/net 7
CaR Allocation: By Events, net 8
CaR Allocation: By Lines of Business, gross 9
CaR Allocation: By Lines of Business, net 10
Analysis by Events 11
Loss distribution: Internal Fraud 12
Loss distribution: External Fraud 13
Loss distribution: Employment Practices and Workplace Safety 14
Loss distribution: Clients, Products and Business Services 15
Loss distribution: Damage to Physical Assets 16
Loss distribution: Business Disruption and System Failures 17
Loss distribution: Execution, Delivery and Process Management 18
Loss distribution: Extremal Events 19
Analysis by Lines of Business 20
Loss distribution: Corporate Finance 21
Loss distribution: Trading and Sales 22
Loss distribution: Retail Banking 23
Loss distribution: Commercial Banking 24
Loss distribution: Payment and Settlement 25
Loss distribution: Agency Services 26
Loss distribution: Asset Management 27
Loss distribution: Retail Brokerage 28
Insurance analysis 29
Loss distribution: FI 30
Loss distribution: Terrorism 31
Loss distribution: Liability 32
Loss distribution: D&O 33
Loss distribution: Property 34
Performance 35
Quality assurance 36
Event loss generators: Compound distributions 37
Event loss generators: Aggregate and totals 38
Correlation: Frequencies: theoretical vs sample 39
Correlation: Events’ total loss 40
Correlation: Lines of Business’ total loss 41
Appendix: Encoded input 42
Content 43