operationalizing big data to reduce risk of high consequence decisions in complex systems
TRANSCRIPT

Operationalizing Big Data to Reduce the Risk of High Consequence Decisions in Complex Systems
Copyright © 2016 OAG Analytics. All rights reserved. Page 1 of 14 [email protected] | 844.OAG.WELL(844.624.9355) | www.OAGanalytics.com
This white paper presents compelling alternatives to bivariate analysis, i.e. XY or scatter plots, for generating data-driven insights that can reduce risk in complex systems. It explores under what conditions businesses maximize value by relying on computers to make decisions versus using computers to help humans make better and/or faster decisions. The main body of the paper attempts to create a holistic view of why and how to use contemporary data technologies to create actionable insights from large and complex data. The Technical Appendix elaborates on the requisite capabilities of an end-to-end workflow to transform raw data into actionable insights using advanced analytics.
Historical Context Many advances in big data and advanced analytics have origins in search, social media, retail, and finance (SSRF). Factors that contribute to this fertile landscape for big data include: an abundance of robust data sets; resources to attract and retain top talent; and high volumes of relatively low consequence individual decisions. For example, the consequences of Google missing a relevant search result or advertisement, a misguided Facebook friend suggestion, Amazon suggesting an uninteresting product, or a suboptimal trade in an appropriately diversified automated trading portfolio are relatively low on a case-by-case basis. On the other hand, decisions about: oil and gas wells; mines; medical diagnosis and modalities; and pharmaceutical research (OGMMP) typically carry higher consequences. Accordingly, operationalizing big data and advanced analytics in the high consequence decision space is notably different from lower risk environments. Systems that are robustly defined by available data are usually the easiest in which to let computers make decisions on a stand-alone basis. For example, a smart residential thermostat can measure the difference between internal and external temperature and easily create a reliable model to minimize the amount of energy required to achieve a desired temperature by a specified time. Many opportunities to create material data-driven value in well-defined systems have been realized. On the other hand, there are numerous opportunities to deliver transformational value to domain experts in firms in high consequence decision spaces. Areas of the financial services industry with the most mature data-driven Decision Platforms (DPs) tend to be characterized by high volumes of relatively low consequence (HV/LC) decisions. However, some areas of finance are enjoying the benefits of data-driven Decision Support Platforms (DSPs) to gain material competitive advantage with high consequence decisions. On average more financial services firms are successfully using big data to support high consequence decisions than most OGMMP firms. OGMMP data often only describes a subset of the overall system. For example, thousands of parameters impact the output from a typical oil or gas well. The most robust O&G data sets typically contain hundreds of parameters, many of which are unreliable. The wider the gap between total parameters that impact a system and availability of high quality data, the less computers should be solely relied upon to make autonomous decisions. Human inability to identify meaningful relationships in complex data has lead many firms to increasingly rely on trial and error or choose to limit innovation, favoring attempting to emulate the most successful of their innovative peers. The ladder “wait and see” strategy becomes particularly limiting with new technology that cannot be quickly assimilated into existing processes. Data availability and risk management strategy not withstanding, of two equivalently capable, funded, and fortunate teams, the one that is maximizing the value of their data to reduce costs, cycle times, and risk has an advantage over the other.
Definitions Below are a few key definitions that attempt to cut through the fluff and clarify what big data is and why it is important to your firm.

Operationalizing Big Data to Reduce the Risk of High Consequence Decisions in Complex Systems
Copyright © 2016 OAG Analytics. All rights reserved. Page 2 of 14 [email protected] | 844.OAG.WELL(844.624.9355) | www.OAGanalytics.com
Big Data Transforming data from a cost into a revenue generating and cost savings asset Machine Learning Technology designed to extract signal from noise in large, complex data sets • Iterative process in which computers study systems to learn from the data, rather than follow
explicitly programmed instructions • Signal: a valuable consistent relationship in the data • Noise: random correlations that won’t occur again in the future
The Big 3 Transforming data into value requires three fundamental things: data management, analysis, and activating the analysis by delivering actionable insights. Activation is usually the most difficult and important, as these systems offer very little value until they effect decisions. Risk associated with managing and analyzing data is largely technical. Activation risk in DPs is typically largely technical. DSPs for high consequence decisions, on the other hand, require developing a requisite level of trust in a machine-based system with many known limitations, often a much more difficult task than implementing the technology.
1. Data Management A complete data management strategy must address storage, access, and quality control (QC). Taming the high volume, variety, and velocity of today’s data is a necessary, though not sufficient, condition for creating strategic competitive advantage. The foundation of data-driven analysis is the availability and quality of the underlying data. The firms with automated processes that continuously update, aggregate, normalize, and QC data from all available sources are already enjoying increased efficiency and, perhaps more importantly, are in a unique position to maximize the value of big data-specific analysis techniques like machine learning. A system qualifies as “big data” if it meets any of the following conditions: large volume (many rows), high variety (many columns), or high velocity, (frequent changes). Many proven solutions exist for managing big data, including Apache Spark, which supports a variety of options including HDMS / Hadoop, Amazon S3, local and remote file systems, and traditional databases (RDBMS). Common access to heterogeneous underlying storage often enables an ideal blend simplicity, flexibility, and performance. A data management strategy should not be any more complex than will be necessary in the foreseeable future, as superfluous complexity increases costs and risk without adding value. Furthermore, a well articulated data management strategy should maximize synergies between advanced analytics engines (pipelines) and the underlying data management system that they access.

Operationalizing Big Data to Reduce the Risk of High Consequence Decisions in Complex Systems
Copyright © 2016 OAG Analytics. All rights reserved. Page 3 of 14 [email protected] | 844.OAG.WELL(844.624.9355) | www.OAGanalytics.com
Accordingly, while data management is the first logical step in a big data initiative, it should not be designed or implemented in a vacuum. An analysis can only be as good as the quality of the underlying data, i.e., garbage in garbage out. Accordingly, viable data management systems must not only support maximizing data QC, but must provide as much automated QC as possible in order to scale. In many instances, user configurable QC rules achieve the appropriate balance of eliminating appropriate “bad data” without unnecessarily reducing the size of the data set. Retooling a data management implementation can be very expensive and very few, if any, commercial off the shelf products are optimized for any specific big data initiative, especially a DSP for LV/HC decisions. Proven data management offerings exist – committing to one that not only fulfills data management requirements on a stand-alone basis, but also holds up in the context of an end-to-end data-driven workflow is essential for the success of a big data initiative, especially one to support high consequence decisions in complex systems.
2. Analysis Effective data analysis extracts reliable signals from underlying data. The lack of transparent correlations is one of first indicators that a data set is complex, meaningful insights into which are beyond the reach of basic analysis techniques. Accordingly, advanced analysis techniques like machine learning, applied correctly, are another essential ingredient in delivering material competitive advantage. Leading firms in virtually every industry are using machine learning because of its unique ability to find valuable and consistent relationships in the data when other analytic techniques cannot. Relationships between inputs and outputs (correlations) can be readily identified in simple data using traditional techniques like scatter plots and regressions. However, like most simple solutions to complex problems, results can be deceiving. While there is a 96% correlation between the number of Civil Engineering PhDs and mozzarella cheese consumption, it is doubtful anyone is basing important decisions on that correlationi. High autocorrelation among data is a leading reason that traditional bivariate analysis fails to contribute meaningful insights. Figures 1 and 2 below were produced using exactly the same data. Figure 1, a scatter plot with a regression line, illustrates an all too common example of an input with a known cost that increases as we move from left to right on the x-axis, with an ambiguous effect on the output of the system represented on the y-axis. In other words, Figure 1 illustrates a scenario in which the raw data does not provide actionable insights about the return on investment (ROI) from investing in proppant, the parameter plotted on the x-axis.

Operationalizing Big Data to Reduce the Risk of High Consequence Decisions in Complex Systems
Copyright © 2016 OAG Analytics. All rights reserved. Page 4 of 14 [email protected] | 844.OAG.WELL(844.624.9355) | www.OAGanalytics.com
Figure 1: Weak correlation between input (x-axis) and output (y-axis).
Figure 2: Clear signal about the impact of input (x-axis) on the output (y-axis) Figure 2 above was produced by holding a well’s location and design constant while generating production estimates using a machine-generated model for an appropriate range of proppant
Operationalizing Big Data to Reduce the Risk of High Consequence Decisions in Complex Systems
Copyright © 2016 OAG Analytics. All rights reserved. Page 5 of 14 [email protected] | 844.OAG.WELL(844.624.9355) | www.OAGanalytics.com
volumes. Figure 2 clearly illustrates intervals in which incremental investments in proppant are highly unlikely to increase the value of the specified well design at the specified location. The output from both machine learning and manual (human) approaches to advanced analysis that identify signals between many inputs and one output, aka supervised learning, is typically a computer program (model) that uses specified values for the system’s input parameters to estimate an output. Machine learning generated models are often the most reliable way to put individual input parameters in context of the overall system, resulting in a much more reliable way to test hypothesis before making the next set of decisions. Machine learning models can often become even more reliable by combining two or more of them into an ensemble, as is the case of the model used in Figure 2. The model used in Figure 2 required: billions of calculations; thousands of configuration options; highly specialized data management; and tomes of proprietary code – well beyond the capabilities of a large team attempting a manual approach. Very few firms have efficiently converted their domain experts into data scientists and software engineers. While firms can often upgrade existing data-driven platforms with the help of third party data scientists, very few data science teams are delivering transformational value on a stand-alone basis to firms that have not already operationalized advanced analytics, especially for systems that support high consequence decisions. Consequently, a leading best practice for delivering the value of big data includes close collaboration between domain experts and data science teams.
3. Activation Data analysis becomes relevant when it is activated into a form that enables better decisions. Firms do not realize real value from big data until actionable insights are delivered to their technical and strategic decision makers. The most effective data-driven insights are currently delivered through purpose-built workflows that encapsulate the requisite dimensions of big data and have been developed in close partnerships between industry-specific domain experts and big data specialists. Translating data analytics into actionable insights that effect decisions is where the rubber meets the road, as this is where business value is delivered in the form of cost savings, increased revenue, and reduced risk. Data management and analysis are largely technical in nature. Translation, on the other hand, will not result in an evolved decision process until strategic and tactical decisions makers trust the system’s outputs, which requires a system that is properly aligned with an organization’s culture and processes. Business rarely make decisions in the absence of trust. Big data is no exception. Decision makers should not allow untrusted sources to influence their decisions. High consequence systems with moderately ambiguous effects of individual parameters require much more transparency into data management and analysis than their sibling systems that make lower consequence decisions. Similarly, they also require more rigorous validation following data updates or testing alternative analysis configurations. The tools and algorithms used to analyze complex data do not typically vary based on the consequences of decisions that they support, but the transparency and validation requirements into the analysis process and outputs, respectively can vary greatly. Accordingly, the highest risk aspect of DSPs is usually activation, which can be very different from DPs. Overlooking this nuance has rendered many DSPs irrelevant, as decision makers never seriously consider the DSP input in their decision process. Black box machine learning is a non-starter in many high consequence decision environments. The most effective way to build trust in machine learning-generated insights for complex systems is to empower decision makers with a highly transparent, self-service workflow (see BP 3 below).
Operationalizing Big Data to Reduce the Risk of High Consequence Decisions in Complex Systems
Copyright © 2016 OAG Analytics. All rights reserved. Page 6 of 14 [email protected] | 844.OAG.WELL(844.624.9355) | www.OAGanalytics.com
Following a rigorous validation by a multi-disciplinary team of domain experts and data scientists, models aligned with the appropriate software can reliably test hypotheses, create more clarity in to ROI, and reduce risk. Decisions Support Platforms that are appropriately aligned with large scale computing resources are also equipped to rapidly evaluate massive volumes of “what-if” scenarios, offering further insights into opportunities that humans are unlikely to consider.
Best Practices No one wins from another failed science experiment. The following proven best practices reduce the risk of operationalizing big data. This is not intended to be a comprehensive list, as translating advanced analytics into business value requires capturing company, team, and project-specific nuances, the best practice for which is to align your firm’s domains experts in a strategic partnership with a data analytics firm with a proven track record of delivering value to their customers. BP 1: Top Down & Bottom Up A bottom up data-driven analysis of a large data set is characterized by including a relatively few number of parameters that the domain experts "know" to be material influencers of the outcome. Verifying if what is believed to be known is supported by the data is essential not only in the beginning of a project, but should be done frequently, as continuously evolving data needs to be continuously validated. Similarly, there is a lot that can be learned from a "kitchen sink" style of analysis that includes many, if not all, of the parameters in a data set. Domain experts often gain insights about high value parameters, combinations of parameters, and more advantageous ways to use parameters from this top down style of analysis. Accordingly, parallelizing both top down and bottom up styles of analysis, critically challenging both approaches, and expanding the scope of the bottom up analyses over time is a leading best practice for maximizing the value of existing data. BP 2: Collaborate Data scientists need to understand the domain well enough to design and build for it. Similarly, the domain experts need to develop a requisite level of understanding in a new data-driven decision solution before they should consider its insights in their decision process, which often requires education and training. Systems for environments that are not fully described by available data and include high consequence decisions are much more difficult to operationalize than ones absent either these two notable characteristics. The most successful DSP for LVHC systems have been created by highly capable and motivated cross functional teams that collaborate effectively. BP 3: Self-Service Data Narratives Establishing trust in data driven insights fundamentally relies on creating a compelling story with data. Successful data narratives in high consequence domains require compelling visualization and almost always include control and transparency without overwhelming users. This is very hard to do. Delivering end-to-end self-service workflows is often an essential ingredient for building trust. This is even harder to do, but decision makers are more likely to trust self-service systems than they are to trust non-domain experts to drive systems that are too complex for the domain experts to operate. Purpose built workflows that enables a specific audience to accomplish a specific set of tasks are often the only way to reduce enough complexity to enable self sufficiency. Alternatively, organizations can become beholden to consultants, which is often adds superfluous cost, cycle time, and opacity to producing meaningful data-driven insights. These workflows must empower users to rapidly test their own hypotheses on the data. They must also enable experts to challenge both the analytical discoveries and the resulting model quality and accuracy. Lastly, these systems must also clearly communicate when they are attempting to predict

Operationalizing Big Data to Reduce the Risk of High Consequence Decisions in Complex Systems
Copyright © 2016 OAG Analytics. All rights reserved. Page 7 of 14 [email protected] | 844.OAG.WELL(844.624.9355) | www.OAGanalytics.com
through regions of dense data (usually reliable), interpolate through sparse data, or extrapolate beyond the data's boundaries. BP 4: High Speed Optimization Appropriate models can offer highly valuable insights on a standalone basis, however more value is usually possible. Models running in high volume parallel processing environments like Apache Spark can also offer near real-time simulation insights, based on running huge numbers of "what if" scenarios through the model(s). Like other aspects of big data, effectively leveraging scalable clustered computing is not trivial. Accordingly, resource selection with proven track records and, ideally, an accelerator platform are highly conducive to success. BP 5: Resources Virtually no one has been successful creating a DP or DSP without the right team. A current reality is that, “the major limitation in [the big data] market is the lack of skilled personnel”
P&S Market Research (https://www.psmarketresearch.com/market-analysis/big-data-market)
Firms with mature data-driven decision platforms may only need the services of expert data scientists to improve their current analytic engines. Everyone else requires the following additional resources with big data expertise: strategist, architect, software engineer, user experience designer, and user interface engineer. Starting from scratch is expensive and very risky. Partnering with firms with proven big data platforms can materially reduce cost, risk, and time to value. An Insights Workflow must also address intrinsic priorities, which can be unique within each organization or user group. Culture, processes, existing tools, and even market conditions must be adequately addressed before a decision engine has a chance to see the light of day. Decision makers are much more likely to trust systems that they understand; use systems that excite them and resonate at an emotional level. Systems like this require the right resources to build and operationalize.
Anti-Practices Erroneous data driven conclusions can easily destroy more value than they create; this section presents some of the most common mistakes to avoid. AP 1: Over Filtering Many teams materially reduce the size of large and complex data sets in order to draw conclusions that they are comfortable with using traditional analysis approaches like scatter plots and regressions. The most reliable data-driven insights about what is going to happen next require evolving of how data is used. While this may not be comfortable, it will be much less uncomfortable than loosing a market leadership position because of waiting too long to evolve. AP 2: Underestimating Data Velocity The days of build, test, deploy, and enjoy are behind us because of the rate at which data is changing. Accordingly, a data-driven workflow must implement strategy, process, and technology that can stay current with rapidly evolving large data sets.
Conclusion “Companies embarking on machine learning should pursue the strategy wholeheartedly at the C-suite level and acquire existing expertise and knowledge to guide the application of that strategy.” McKinsey, An executive’s guide to machine learning, June 2015: http://www.mckinsey.com/insights/high_tech_telecoms_internet/an_executives_guide_to_machine_learning
“The major limitation in [realizing value from big data] is the lack of skilled personnel”
Operationalizing Big Data to Reduce the Risk of High Consequence Decisions in Complex Systems
Copyright © 2016 OAG Analytics. All rights reserved. Page 8 of 14 [email protected] | 844.OAG.WELL(844.624.9355) | www.OAGanalytics.com
P&S Market Research: https://www.psmarketresearch.com/market-analysis/big-data-market
There is a massive amount of highly underutilized data in the world today, creating numerous opportunities for visionary firms to gain material competitive advantage by using their data more effectively and efficiently than their peers. These troves of data and the technologies that surround them have become much more complex, necessitating that domain experts form strategic partnerships with big data strategy and technology experts to efficiently create value. The complexity of big data, data science, and machine learning are on par with the complexity of locating and efficiently extracting hydrocarbons. Virtually no one has efficiently converted domain experts like geoscientists and reservoir engineers into world-class data scientists and software engineers. Similarly very few data science teams are delivering material value to the oil and gas industry on a stand-alone basis. Consequently, a leading best practice for transforming existing data from a cost into a revenue generating and cost savings asset includes close collaboration between domain experts and data science teams. OAG Analytics offers proven big data solution exclusively to the oil and gas industry. Our Insights Workflow™ delivers data management, advanced analysis, and translating the analysis into actionable insights as a cost effective managed service. Extracting more reliable information from existing data can create billions of dollars of value for the oil and gas industry. From the wellhead to the boardroom - OAG Analytics delivers actionable, data-driven insights that materially improve our customers’ ability to reduce exploration risk, right size completions, and value assets. If you are still relying on scatter plots, OAG can help rapidly improve your ability to manage risk and reduce costs.

Operationalizing Big Data to Reduce the Risk of High Consequence Decisions in Complex Systems
Copyright © 2016 OAG Analytics. All rights reserved. Page 9 of 14 [email protected] | 844.OAG.WELL(844.624.9355) | www.OAGanalytics.com
Technical Appendix
Machine Learning Workflow Deep Dive: Analysis, Validation, and Translation
AnalysisContemporary machine learning is a multi step process, each step of which requires validation before the system can be trusted. The first step of most machine learning workflows is to measure the impact that input parameters have on a system’s output. Many machine learning systems will also test numerous alternative hypotheses on the raw parameters and combinations of parameters to discover ways to transform the data into features that have stronger relationships with the outputs than the raw parameters; this process is often referred to as feature engineering. Whether data is used in its raw form or deterministically transformed using mathematical functions, domain experts must be able to sanity check the preliminary analytic findings in an efficient way to have any hope of trusting the system.
Figure 3. Parameter analysis and feature engineering validation with an interactive data graph
The next step in a common machine learning workflow is to measure the inter-relationships among the raw data and, if appropriate, among the features. Machine learning algorithms can only reliably learn from features that are sufficiently independent and complex data is usually highly interrelated,
Operationalizing Big Data to Reduce the Risk of High Consequence Decisions in Complex Systems
Copyright © 2016 OAG Analytics. All rights reserved. Page 10 of 14 [email protected] | 844.OAG.WELL(844.624.9355) | www.OAGanalytics.com
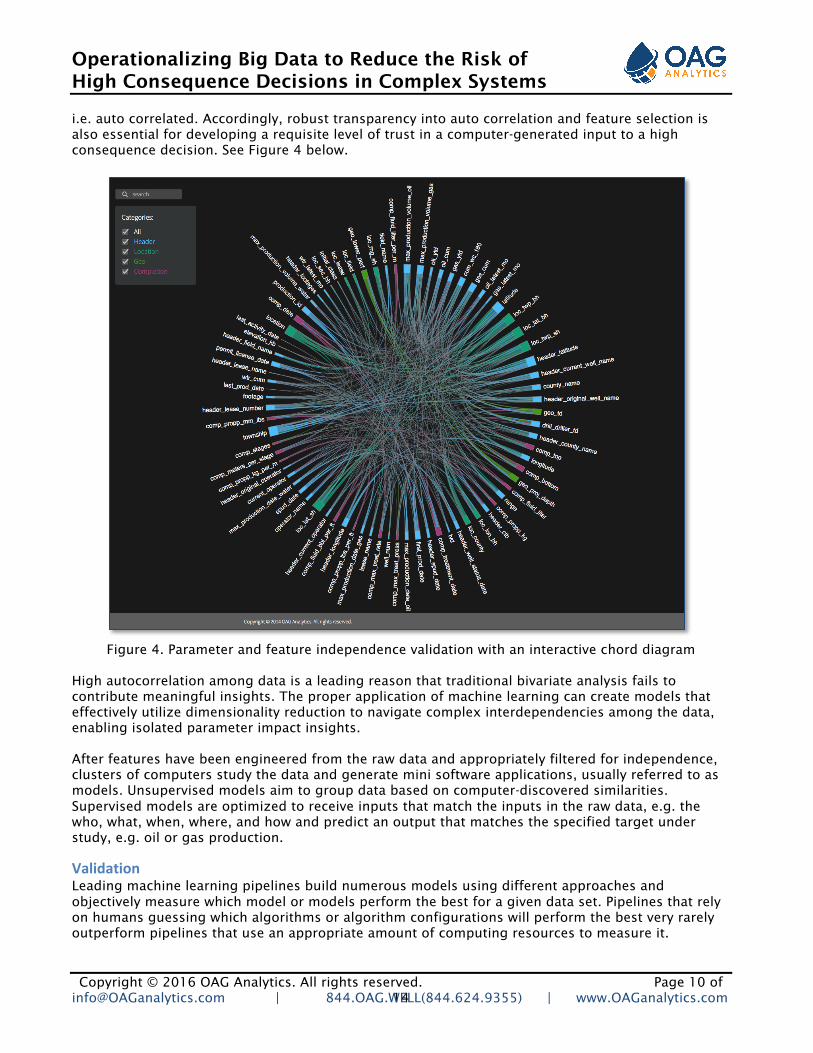
i.e. auto correlated. Accordingly, robust transparency into auto correlation and feature selection is also essential for developing a requisite level of trust in a computer-generated input to a high consequence decision. See Figure 4 below.
Figure 4. Parameter and feature independence validation with an interactive chord diagram
High autocorrelation among data is a leading reason that traditional bivariate analysis fails to contribute meaningful insights. The proper application of machine learning can create models that effectively utilize dimensionality reduction to navigate complex interdependencies among the data, enabling isolated parameter impact insights. After features have been engineered from the raw data and appropriately filtered for independence, clusters of computers study the data and generate mini software applications, usually referred to as models. Unsupervised models aim to group data based on computer-discovered similarities. Supervised models are optimized to receive inputs that match the inputs in the raw data, e.g. the who, what, when, where, and how and predict an output that matches the specified target under study, e.g. oil or gas production.
ValidationLeading machine learning pipelines build numerous models using different approaches and objectively measure which model or models perform the best for a given data set. Pipelines that rely on humans guessing which algorithms or algorithm configurations will perform the best very rarely outperform pipelines that use an appropriate amount of computing resources to measure it.

Operationalizing Big Data to Reduce the Risk of High Consequence Decisions in Complex Systems
Copyright © 2016 OAG Analytics. All rights reserved. Page 11 of 14 [email protected] | 844.OAG.WELL(844.624.9355) | www.OAGanalytics.com
Acceptable models should be both unbiased, i.e. the average difference between predictions and actual samples from data that was not used to build the models should be approximately zero and should be approximately normally distributed. Validating models with data that they have never seen before, i.e. “test data”, is a frequently missed step and critical for mitigating the risk of erroneous conclusions, as the objective is to build the best model possible for predicting future outcomes, not building a model that best fits the historical data. See Figure 5 below.
Figure 5. Error distribution for an OAG Ensemble Model
Machine learning pipelines and the DSPs that encapsulate them must enable the efficient comparison of different models. This includes models built using different algorithms as well as models built using different filters applied to the raw data sets, as both can materially impact results. The details of which model measurements are most appropriate for a specific set of requirements are beyond the scope of this white paper, but if the coefficient of determination (R2) is the only metric used, the system was not built properly, as R2 does not account bias. For example, doubling or halfing the errors will not change the value of R2, but it will certainly impact the validity of the actions that the resulting models suggest. Root mean squared error (RMSE) and relative root mean squared error (RRMSE) are a very common metrics for comparing models; minimizing RMSE and RRMSE is desirable.

Operationalizing Big Data to Reduce the Risk of High Consequence Decisions in Complex Systems
Copyright © 2016 OAG Analytics. All rights reserved. Page 12 of 14 [email protected] | 844.OAG.WELL(844.624.9355) | www.OAGanalytics.com
Figure 6. Error distribution for a non-linear regression model
Note that a non-linear regression is over 23% less accurate than an OAG Ensemble for predicting oil production at 180 days; RMSE of 19,333 and 15,700 barrels respectively.
Figure 6. Model validation actual production (x-axis) vs. predicted production (y-axis).

Operationalizing Big Data to Reduce the Risk of High Consequence Decisions in Complex Systems
Copyright © 2016 OAG Analytics. All rights reserved. Page 13 of 14 [email protected] | 844.OAG.WELL(844.624.9355) | www.OAGanalytics.com
Note that an R2 of 0.74 indicates that the predictions match the actual production for data that the model has never seen before, although R2 does not tell the whole story.
ActivationAltering a decision process requires establishing trust in new inputs. After data has been filtered to improve quality, the analysis’ measurements about the individual parameters has been challenged, the models have been blindly validated using data that they have never seen before, the opportunity exists to use a machine generated model to improve business decisions. In order to understand how much to trust the insights offered in the top graph of Figure 7, decision makers require visibility into data support and corresponding uncertainty reduction to establish trust in insights produced by machine-generated models.
Figure 7: Data support

Operationalizing Big Data to Reduce the Risk of High Consequence Decisions in Complex Systems
Copyright © 2016 OAG Analytics. All rights reserved. Page 14 of 14 [email protected] | 844.OAG.WELL(844.624.9355) | www.OAGanalytics.com
The blue bars on bottom graph on Figure 7 represent the number of samples in the raw data at each interval of the input parameter that we are analyzing (proppant volume per foot). Intervals with tall bars (a lot of data) indicate that we can expect the model’s behavior to be consistent with the error distributions that we observed in the Validation steps of our Insights Workflow. Intervals with low data support require that the models “interpolate” between areas of higher data and therefore cannot be used as reliably as intervals of high data support. However, interpolation should not be ignored because it can often offer more insight that is available through any alternatives. Information that falls outside of the raw data, i.e. no data support corresponds to extrapolation of the underlying data, is outside of the recommend areas of use for most data-driven analytics.
Figure 8: Uncertainty reduction
The light blue line (and area underneath it) represent how spread out production data is for wells completed at each proppant volume. Note that wells completed with circa 1,000 pounds of proppant per foot are both the most expensive and exhibit the least consistent performance, i.e. are the highest risk wells on a cost basis. The orange points represent how spread out production data is for the same wells using the machine generated model instaed of the raw data. Note the consistent uncertainty reduciton across the whole spectrum of proppant volumes, especially for the highest risk wells. i http://www.tylervigen.com/spurious-correlations