operationalizing the wef nexus: quantifying the trade-offs and … · 2019-03-04 ·...
TRANSCRIPT

Operationalizing the WEF nexus: quantifying the trade-offs and synergies between the water, energy and food sectors
Dutch Climate Solutions research programme
ECN-E--18-036 - March 2018 www.ecn.nl

Author(s) Mónica A. Altamirano– Deltares
Arend Jan van Bodegom- Wageningen University & Research
Nico van der Linden – Energy research Centre of the
Netherlands
Hugo de Rijke – Deltares
Jan Verhagen – Wageningen University & Research
Tom Bucx – Deltares
Agnese Boccalon – Deltares
Bob van der Zwaan – Energy research Centre of the
Netherlands
Disclaimer
ECN, including the associated sustainable energy activities, employees,
facilities and contracts, has been part of TNO since 1 April 2018. Although
the information contained in this document is derived from reliable
sources and reasonable care has been taken in the compiling of this
document, TNO cannot be held responsible by the user for any errors,
inaccuracies and/or omissions contained therein, regardless of the cause,
nor can TNO be held responsible for any damages that may result
therefrom. Any use that is made of the information contained in this
document and decisions made by the user on the basis of this information
are for the account and risk of the user. In no event shall TNO, its
managers, directors and/or employees have any liability for indirect, non-
material or consequential damages, including loss of profit or revenue and
loss of contracts or orders.
In co-operation with
Page 2 of 122 ECN-E--18-036
Operationalizing the WEF nexus: quantifying the trade-offs and synergies
between the water, energy and food sectors

Page 3 of 122 ECN-E--18-036
Preface
This report is deliverable D27 of the Dutch Climate Solutions research programme. The
programme acts as a platform for the Energy research Centre of the Netherlands (ECN) to support
the Netherlands Directorate-General for International Cooperation (DGIS) in the realisation of
Dutch policy objectives concerning poverty reduction and sustainable development. Support is
delivered through the provision of demand-led, product-driven research and knowledge
development. Particular attention is paid to expanding the contribution of Dutch expertise,
innovation and technology to international climate assistance.
The main question address within this programme is how to leverage climate and private sector
investments for sustainable and climate smart development, for with the consideration of the
water-energy-food nexus is key. Accordingly key research questions dealt with are: a) How do we
create a sustainable and effective balance in the water, energy and food sectors to achieve the
Sustainable Development Goals, in the face of climate change, and b) what is the role and
potential of climate finance to bring about transformative change in developing countries?
The program combines mutually reinforcing research and recommendations on the level of
multilateral finance architecture, Dutch development aid and the Dutch climate technology sector
to propose an integrated approach to support the climate technology sector and explore climate
finance mechanisms through which the Dutch water-food-energy sectors can export their Climate
Smart Solutions.
The Dutch Climate Solutions programme is funded by the Netherlands Ministry of Foreign Affairs
and implemented by a consortium coordinated by the ECN. The consortium comprises the
following organisations:
• Energy research Centre of the Netherlands (ECN)
• Deltares
• Stichting DLO, Wageningen UR
• Duisenberg School of Finance (until 1 October 2015).
The Dutch Climate Solutions programme is registered under ECN project number 5.2734.
The sole responsibility for the content of this report lies with the authors. It does not represent the
opinion of the Netherlands Ministry of Foreign Affairs, and the Ministry is not responsible for any
use that may be made of the information contained herein.

Page 4 of 122 ECN-E--18-036
Abstract
The purpose of this research is to develop an analytical and modelling approach that allows for the
quantification of trade-offs between the water, energy and food nexus at different scales; allowing
to go from national analysis of nexus stress by identifying and quantifying key intersectoral claims
and trade-offs, up to a more detailed and even local specific analysis of the trade-offs. These
trade-offs and the system understanding created by following the proposed steps for the analysis
of nexus stress, inform them the design of Climate Smart Solutions and Strategies that make use of
the most powerful leverage points and introduce or exploit existing synergies between the water-
energy-food sectors.
The national and local scales analyses following the proposed methodology have been applied to
Ethiopia. At the national scale the integration has been done by making use of system analysis
techniques in combination with the use of diverse modelling techniques for the quantification of
the key trade-offs identified.
The soft-linking Deltares Water Allocation Model (Ribasim) and TIAM-ECN model for optimization
of Energy Systems allowed for the quantification of trade-offs between the water and the energy
sectors given the national plans to make significant increase in hydropower dams. This modelling
exercise was complemented with excel calculations to quantify the trade-off between biomass
production for energy and land available for food production, as well as to quantify the complex
linkages between water and food security.
Last but not least, the economic analysis of trade-offs developed which builds on the so-called
Vulnerability Framework (AGO, 2005) allowed the comparison of alternative adaptation
investments and demonstrated that taking into account in the business case of an adaptation
measure a nexus approach ( accounting for the cost and benefits in other sectors) could improve
the financial viability of such projects. The method developed and tested for Ethiopia making use
of the TIAM-ECN and Ribasim modelling results could enable multisectoral investments in
adaptation.
At the local level in the second part of 2017 a nexus analysis was undertaken making use of
RIBASIM and LEAP models along with excel based agriculture production models to evaluate
whether the planned Industrial Park for sesame processing, in Bae’ker, near Humera, Tigray, will
create any significant trade-offs between the water, food and energy sectors, also in view of
climate change. This research is following a collaborative modelling approach and aims to help
local actors to come to a climate smart and diversified economy and develop a strategy for

Page 5 of 122 ECN-E--18-036
economic growth in Humera that is also sustainable in terms of water, energy and food
resources. The findings of this analysis are made available in separate report.
This multi-scale approach for analysis of nexus trade-off can be used either by donors,
multilaterals to analyse and test at national and local level whether certain sectoral investments
being planned are Climate Smart and advance the synergetic achievement of water-food and
energy related SDG’s. The methodological approach developed and illustrated for the case of
Ethiopia can also support governments in the generation of alternative solutions and changes in
the design of these projects so that future nexus stresses and vulnerabilities are reduced to a
minimum.

Page 6 of 122 ECN-E--18-036
Table of contents
Executive Summary 8
1. Introduction 11
1.1 The need to take a Water-Energy-Food nexus approach 11
1.2 How does the WEF Nexus relate to the Sustainable Development Goals? 13
1.3 The Paris agreement as the way forward 15
1.4 Reading guide 16
2. Literature reviews of the WEF Nexus 18
2.1 A historical overview of thinking about the WEF Nexus 18
2.2 Criticism on the nexus thinking 20
2.3 Barriers to implementing the nexus approach 21
2.4 Possible additional principles for the nexus approach 23
3. Conceptual and methodological framework for the WEF Nexus 24
3.1 Conceptual framework 24
3.2 Methodological approach: steps to follow 28
4. Applying the framework to Ethiopia 32
4.1 Step 1: problem definition 32
4.2 Step 2: Forecasting and Management of Climate Uncertainty 51
4.3 Step 3: Analysis of trade-offs and synergies 57
4.4 Step 4: formulating Climate Smart Strategies: making use of leverage points and
creating synergies 64
4.5 Modelling results and quantification of trade-offs and synergies 66
4.6 Economic analysis of water-energy trade-offs 75
4.7 Trade-offs in the water-energy-food nexus 80
5. Towards the solution: conclusions from the Nexus analysis 83
5.1 Introduction 83
5.2 Most significant trade-offs and leverage points 84
5.3 How to create synergies between the WEF sectors: reaching WEF security 87
5.4 Addressing the criticism on the nexus approach 87
5.5 Methodological findings 89
5.6 Research and innovation gaps 91

Page 7 of 122 ECN-E--18-036
References 93
Appendices 98
Appendix A: SDG targets and proxies 99
Appendix B: production processes of each sector requiring input from other sectors 100
Appendix C: Matrix Food, Water, Energy and Climate Change 103
Appendix D: Causal Loop Diagrams of Key Trade-offs and Synergies 112
Appendix E: Identifying leverage points 118

Page 8 of 122 ECN-E--18-036
Executive Summary
Rapidly growing demand and the globally uneven distribution of water, energy and food are
leading to increasing competition for these resources. The effects of climate change pose an
additional challenge, as heavy flooding in coastal areas and severe droughts in more arid regions
could further exacerbate this competition and seriously impede economic growth. So far, energy,
food and water challenges have mainly been addressed within the sectors concerned. This has
resulted in policies and interventions that focus primarily on individual sectors, rather than
considering the broader cross-sectoral impact. This lack of coordination, dialogue and
collaboration among sectors can significantly affect the efficiency and effectiveness of policies and
may also prevent appropriate measures from being taken. There is thus an urgent need to address
these challenges simultaneously and develop an integrated approach. Balancing the trade-offs
between these sectors will be essential if we are to achieve sustainable development and ensure
water, energy and food security.
This study aims to develop a conceptual and methodological framework that allows for the
quantification of the interactions and trade-offs between the water, energy and food sectors and
to design and evaluate climate smart solutions that benefit(or at least not negatively affect) all
three sectors. This framework draws on the vast experience and expertise of the three consortium
partners: Energy research Centre of the Netherlands ECN, Deltares and Wageningen University &
Research. The framework was applied to a case study in Ethiopia at the national level and one at
the regional level in Humera district in the province of Tigray. The latter case study is reported in a
separate report.
The study started with a literature review to assess existing and established research on the
water, energy and food security nexus, with the objective of making an inventory of existing cases
in which food security, water, energy and climate change are combined in one approach, and
identifying the most relevant interactions between the three sectors. The findings of the review
served as the starting point for the development of the conceptual framework.
Based on the outcome of the literature review, a conceptual and methodological framework was
developed to identify and quantify the linkages between the three sectors and to handle the
complexity of it. To develop this framework that can be shared among all relevant stakeholders,
use has been made of system analysis and group model building techniques. System analysis was
used to develop the conceptual models that portray the various interactions, cause-effect
relationships, feedbacks and time delays between and within the water, energy and food systems.
Once these conceptual models have been developed, system dynamics can be used to better

Page 9 of 122 ECN-E--18-036
understand the behaviour of these complex systems over time. Departing from this conceptual
framework the methodological approach adopted for this study consists of the following main
steps: 1. Defining the problem
2. Forecasting and management of climate uncertainty
3. Analysis of trade-offs and synergies: identifying the critical links
4. Formulating climate smart strategies: making use of leverage points and synergies.
The conceptual framework was applied to Ethiopia. The Ribasim/Tiam/Water-limited crop model
set was used to quantify the interactions between the WEF sectors and to analyse the long-term
integrated demand-supply strategies across the WEF sectors. Finally, an economic appraisal of
alternative adaptation options to solve water-energy trade-offs in the light of climate change has
been undertaken. The more general results of the case study in Ethiopia at the national level
regarding the quantification of trade-offs and synergies are:
• From a purely energy-cost and water-quantity point of view, the analysis showed that the
projected rapid increase in electricity demand in Ethiopia up to 2050 can be met with large
scale use of hydropower without compromising the increased domestic water use or irrigation
water demand expansion. These results are irrespective of possible negative hydrological
impacts as a result of climate change induced decreased precipitation nation-wide. These
results, however, are based merely on economic and hydrological factors and do not taken
into account environmental, geopolitical and social factors that may induce the Ethiopian
government to reduce the investments in hydropower development.
• The Tiam model calculation resulted in an increase in biomass demand in Ethiopia from 1.1 EJ
in 2010 to 1.9 EJ in 2050. Based on assumptions about the annual production of Eucalyptus,
wood density of Eucalyptus and conversion factor to convert to kg biomass it was determined
that, assuming the forest area does not change, it would require 156% of the existing forest
area to meet biomass demand in 2050. The amount of water required to produce the required
amount of biomass is estimated to be 6.21 1010 m3 water in 2050, which corresponds to
approximately 500 mm per year over the forest area.
• As a separate analysis, the cost-effectiveness of a reduction in distribution losses of urban
water supply has been assessed. This adaptation measure is expected to affect the water
balance in the agricultural and/or domestic water sector and will reduce annual hydropower
vulnerability because of increased water availability. The NPV calculations done for the hydro
and public water sector separately showed negative results if the discount rate is less than 2.7
% but is positive if NPV is calculated for both sectors simultaneously (multi-sector perspective).
These results show that the business case of an adaptation measure can be positively
influenced by taken into account the effects related to other sectors.
The more specific results include:
Water and food security
The growth in population and food demand is expected to drive an increase in agricultural land. A
way to limit the expansion of agricultural land would be to increase the yield per crop. However,
this would require the intensive use of pesticides and fertilizers which in turn would impact water
quality through water run-off and nitrate pollution. Potential nexus solutions that could trigger
improvements in food production include:
• Conservation and climate smart agriculture techniques;
• Improvements in soil nutrient levels, seed quality and /or irrigation systems.

Page 10 of 122 ECN-E--18-036
• Agricultural and water rights reforms that create the right incentives for farmers to invest in
more efficient irrigation systems.
Water and energy security
Hydropower requires large volumes of water to be stored. Water consumed through reservoir
evaporation cannot be used by other users. Another link between these two sectors concerns the
biomass use in households which is the largest driver of deforestation, which can lead to
deterioration in groundwater recharge capacity and water quality. Potential nexus solutions that
affect both sectors positively include:
• Development of most abundantly available renewable energy technologies such as solar, wind
and geothermal
• Accelerating the introduction of more efficient cook stoves, especially among rural households
• Facilitating a switch from firewood to more convenient fuels such as LPG, electricity and
kerosene.
Energy and food security
Several interactions exist between energy and food security. Land used for biofuel production
cannot be used for agricultural purposes and vice versa. Dung used as fuel for cooking cannot be
used for fertilization and increased crop production to supply the agro processing industry will
require increased amounts of energy. Potential nexus solutions that could create synergies
between the energy and food sectors:
• Introduction of afforestation and deforestation policies
• Solar powered water pumping for irrigation.
The road ahead: methodological findings, recommendations and research gaps
The current study provides the conceptual framework that can be used to analyse and evaluate
the trade-offs and synergies between the water, energy and food sectors. Effective
implementation of nexus solutions requires however collaboration between the three sectors and
further research is needed to identify the conditions that facilitate cooperation and collaboration
across these sectors. The research should inform what institutional structures should be built to
support the adoption of technical nexus solutions.
Based on the findings of the present study it is recommended to conduct further research on how
to define the nexus in a specific context: under what conditions do critical links exist beyond the
WEF nexus. An obvious example is climate change which is interlinked to the WEF sectors through
changing weather patterns but other sectors such as sustainable production and consumption may
also affect the WEF sectors. This broadening of the nexus scope is especially relevant for the SDG
framework which comprises 17 goals and 169 related targets that have many interactions.
The modeling package comprising the Ribasim/Tiam/water-limited yield models was used to
analyse quantitatively the interactions between the water, energy and food sectors. For the
present study these three models were soft-linked; output from one model was manually entered
as input for the other models. If these models could be physically integrated so that intervention
in one sector is automatically taken into account in the other sectors, it would enable the
identification of optimal solutions across the three sectors simultaneously.

Page 11 of 122 ECN-E--18-036
1. Introduction
In Chapter 1 an explanation is given of why the Water- Energy-Food (WEF) Nexus approach is
essential for achieving long-term water, energy and food supply security. This chapter elaborates
on the role the WEF Nexus can play in the UN 2030 development agenda and outlines the
elements relevant for this report of the Paris agreement adopted at the UN FCCC Conference held
in Paris in December 2015 (COP2015).
1.1 The need to take a Water-Energy-Food nexus approach According to UN DESA1 the current world population of 7.3 billion is projected to reach 8.5 billion
by 2030, 9.7 billion in 2050 and 11.2 billion in 2100. Most of this increase is expected to be
concentrated in nine countries: India, Nigeria, Pakistan, the
Democratic Republic of Congo, Ethiopia, the United Republic of
Tanzania, the United States of America, Indonesia and Uganda.
Based on these population trends and on rapid urbanization and
rising living standards, it is estimated that by 2050 global energy
demand will increase by 80%, water demand by 55% and food
demand by 60%2.These trends are placing increasingly
competitive demands upon finite natural resources for
agriculture, energy and water. The effects of climate change
pose an additional challenge, as heavy flooding in coastal areas
and severe droughts in more arid regions could further
exacerbate this competition and seriously impede economic
growth.
Thus far, energy, food and water challenges have mainly been addressed within the sectors
concerned. This has resulted in policies and interventions that focus primarily on individual
sectors, rather than considering the broader cross-sectoral impact. This lack of coordination,
dialogue and collaboration among sectors can significantly affect the efficiency and effectiveness
of policies and may also prevent appropriate measures from being taken. So there is an urgent
need to address these challenges simultaneously and develop an integrated approach. Balancing
the trade-offs between these sectors will be essential if we are to achieve sustainable
development and ensure water, energy and food security by maximising the potential synergies
and efficient solutions.
1 UN DESA: World Population Prospects, the 2015 Revision.
2 OECD Environmental Outlook to 2050: The Consequences of Inaction-Key facts and figures.

Page 12 of 122 ECN-E--18-036
This growing need for integrated resources management thinking is what triggered the
development of the Water-Energy-Food (WEF) Nexus concept which stems from system analysis
and is centred around the many links that exist between the water, energy and food sectors.
Water, for example, is used in agricultural production processes and for cooling the waste heat
from power plants; energy is used for irrigation (pumping water), food production processes and
power in agricultural machinery and tractors; and palm oil is used for cooking and is a key
ingredient in food production, but it is also used to produce biofuel. Taking into account these
links while designing policies to ensure long term water-food-energy supply security could result in
more development using less natural resources.
The WEF Nexus concept gained considerable momentum at the Water, Energy and Food Security
Nexus – Solutions for the Green Economy conference which took place in Bonn in November 2011
.Since then, a considerable amount of research has been conducted on the conceptualisation of
the nexus and significant progress has been achieved, as evidenced by the research results
presented at the two-day Understanding the Water-Energy-Food Nexus and its implications for
Governance conference held in Osnabruck in June 2016. However, the research focus so far has
mainly been on understanding and improving the conceptual framework of the nexus and much
less on the quantification of the trade-offs and potential nexus synergies.
The Dutch Climate Solutions(DCS) research programme combines the expertise of research
institutes from the water sector (Deltares), the food sector (Wageningen University) and the
energy sector (ECN) and is therefore well positioned to research the WEF Nexus and to contribute
to the debate on long-term water, food and energy supply security challenges. Furthermore, the
DCS research institutes have at their disposal a unique set of modelling tools that describe
mathematically the interdependencies between the WEF sectors, enabling them to assess the
impact of demographic and economic developments and extreme weather conditions on the
demand and supply of the WEF resources.
This report aims to make the complexity of the WEF Nexus more broadly known and
understandable by quantifying the availability of resources, the trade-offs and the potential
synergies using a concrete case study in Ethiopia, one of the countries in Africa where anticipated
rapid economic and population growth is expected to lead to severe WEF resources challenges in
the coming decades. Building on the conceptual framework resulting from system analysis, the
abovementioned set of modelling tools has been used to assess the WEF trade offs in the year
2050 at national level, also taking into account the impact of extreme weather conditions due to
the changing climate.
The quantitative analysis for Ethiopia presented in this report provides an important illustration of
how a nexus approach is needed to reduce the conflicts arising from rapidly growing demand for
resources. This requires that compartmentalised thinking, known as a silo mentality, be replaced
by an integrated resources management approach. However, in order to bring about this
paradigm shift we must also look at the institutional setting to ensure that information sharing and
collaboration across the sectors is facilitated and that nexus perspectives are integrated into
policies and strategies. The WEF Nexus can be understood as a governance system of institutions,
policies, and actors around the issues of water, energy, and food security. Lack of awareness of the
nexus interconnections, lack of coordination between the fragmented (and sometimes competing)
institutions and lack of implementation of nexus strategies are often seen as more serious barriers
than lack of innovative technology solutions.

Page 13 of 122 ECN-E--18-036
The overall objective of the research presented in this report is to develop a conceptual and
modelling framework to analyse the challenges in ensuring long-term water-energy-food supply
security and to test this framework by applying it to the concrete case study of Ethiopia. The
specific aims are to:
- Identify the links between the water, energy, forestry and food sectors.
- Analyse the long-term availability of resources and trade-offs between the energy,
forestry, food security and water sectors at a national level.
- Formulate strategies that address the growing demand for resources simultaneously and
take into account the impact of climate change on these sectors.
- Support the Dutch government in formulating climate-smart solutions that address the
three sectors simultaneously.
- Assess the role of institutions and of learning and capacity-building in such an approach.
- Identify the business opportunities for the Dutch companies offering Climate Smart
Solutions created by the mainstreaming of the nexus approach.
The scope of the research comprises the following elements:
- Climate change is not addressed as a separate economic issue, but as a cross-cutting issue
that puts additional pressure on other sectors.
- Mitigation and adaptation strategies are considered to be relevant for the following
sectors: water, food security, energy and climate change.
- The focus is on a quantitative analysis using a set of water, energy and agricultural
computer models that describe the interconnections between these sectors.
- Elaboration of the WEF Nexus in relation to the Sustainable Development Goals(SDGs).
1.2 How does the WEF Nexus relate to the Sustainable Development Goals?
The main focus of the present research is on how to achieve an optimal use of water, energy and
food resources to ensure water, energy and food security. Nevertheless it should be emphasized
that to achieve the broader objective of sustainable development, other aspects such as poverty,
land use, equity, gender, environment and health are equally important. The extent to which these
other aspects should/can be incorporated in the WEF Nexus depends on the specific context that
is being analysed.
In 2015, a consensus was reached by the 193 UN Member States on the development agenda for
the period up to 20303. The new agenda builds on the success of the Millennium Development
Goals (MDGs) and includes a set of 17 Sustainable Development Goals (SDGs) to end poverty and
hunger and tackle climate change by 2030. Similarly to the MDGs, for each SDG a set of concrete
targets has been set to allow quantitative monitoring of the progress towards the goals.
3 Transforming Our World: The 2030 Agenda for Sustainable Development

Page 14 of 122 ECN-E--18-036
There are numerous interconnections between the SDGs and the 169 related targets and the risk
is that meeting these goals individually may be achieved at the cost of other goals and targets at
different levels of governance. Achieving sustainable development by 2030 will be a daunting task
given these inherent inter-sectoral tensions. Additionally, climate change is expected to result in a
higher frequency of extreme events, intensifying these tensions and the uncertainties regarding
the availability of the resources. Therefore achieving the SDGs is far more complex than solving
infrastructure investment gaps – as it was perceived for the MDGs – and requires the recognition
of the inherent trade-offs as well as potential synergies between the sectors.
The challenge is to identify – from among these many interactions – those links that are critical in
the sense that they significantly influence the behaviour of the system. Taking these critical links
into account helps to reduce the trade-offs between the SDGs, to avoid possible rebound effects
and to identify potential leverage points to gain synergies.
The WEF Nexus is a part of the broader SDG development framework and basically covers only 3
out of the 17 SDGs4. A review of the SDG targets conducted by ICSU-ISSU suggests links between
the nexus goals 2,6 and 7 and most of the other 14 SDGs. Based on the qualitative description of
the linkages between the SDG targets presented in the review, the SDGs that are most likely to
have the strongest links with the WEF, and thus affect the WEF system, are depicted in the
following figure.
4 Other SDG’s such as number 15 and 8 are partially covered in our analysis due to the important impacts 2,6 and 7
have on them and/or due to the specific national priorities of the country being analysed, which are taken as point of departure for our WEF analysis.

Page 15 of 122 ECN-E--18-036
1.3 The Paris agreement as the way forward The Paris Agreement is a landmark in the climate negotiations. The key outcomes of COP21 are
captured in Article 2 of the decision (see Box).
The three elements of the decision are clear; however the manner in which parties will take up the
challenges is less well defined. It is open to the countries to define efforts and collaborative
initiatives. The voluntary nature and transparent character of the agreement is perhaps exactly
what is needed to move forward as it provides an open field in which parties can learn and
exchange ideas and technologies.
For mitigation, the low carbon development pathways are defined in the nationally determined
contributions (NDCs). Besides the mitigation aims, the NDCs also include the activities that will be
implemented at national level to achieve these aims. The process includes regular reporting on
emissions and progress in implementing and achieving the NDCs.
Article 2
This Agreement, in enhancing the implementation of the Convention, including its objective, aims to
strengthen the global response to the threat of climate change, in the context of sustainable
development and efforts to eradicate poverty, including by:
(a) Holding the increase in the global average temperature to well below 2 °C above pre-industrial levels and to pursue efforts to limit the temperature increase to 1.5 °C above pre-industrial levels, recognizing that this would significantly reduce the risks and impacts of climate change;
(b) Increasing the ability to adapt to the adverse impacts of climate change and foster climate resilience and low greenhouse gas emissions development, in a manner that does not threaten food production;
(c) Making finance flows consistent with a pathway towards low greenhouse gas emissions and climate- resilient development.
Source: FCCC/CP/2015/L.9/Rev.1

Page 16 of 122 ECN-E--18-036
For adaptation, the link to the sustainable development goals is obvious. Aligning the adaptation
and development processes makes sense so parties are encouraged to shape national adaptation
planning by jointly engaging in planning processes and the implementation of actions. Each party
should submit and periodically update an adaptation communication, which may include its
priorities, implementation and support needs, plans and actions.
Financing is a critical element of the agreement; this is particularly true for developing countries.
Developed country parties will provide transparent and consistent information on support for
developing country parties. Besides finance, capacity-building to plan and implement activities is
particularly important for the least developed countries.
While all the ingredients are there, it is important that the momentum created during the Paris
meeting should not be lost. So far fewer than 20 countries have ratified the agreement and the
goal to hold the global temperature increase well below 2°C is not supported by the NDCs/INDCs.
Financing pledges have been made and coordination mechanisms are being put in place. Capacity-
building, exchanging methods, technologies and success stories are all needed to move the
agreement forward.
Much of the follow-up will depend on available finance and examples on how to shape low-carbon
and resilient development. There is already a great deal of knowledge and experience available to
achieve the mitigation goals. National adaptation planning is emerging but needs examples and
capacity-building activities to make this work. In this report we will reflect on the NDC submitted
by Ethiopia and the adaptation plans it has prepared to see how a nexus approach can be used to
assist in defining low-carbon and resilient development while reaching the sustainable
development goals for the nation.
1.4 Reading guide Given the purpose of this research which is to develop an analytical and modelling approach that
allows for the quantification of trade-offs between the water, energy and food nexus at different
scales; and create the required system understanding of the nexus to guide the generation of
alternative Climate Smart Solutions and Strategies the report has been organized into five
chapters.
In Chapter 1 an explanation is given of why the Water- Energy-Food(WEF) Nexus approach is
essential for achieving long-term water, energy and food supply security. This chapter elaborates
on the role the WEF Nexus can play in the UN 2030 development agenda and outlines the
elements relevant for this report of the Paris agreement adopted at the UN FCCC Conference held
in Paris in December 2015 (COP2015).
Chapter 2 provides an overview of the rapidly growing literature on the WEF Nexus and reflects on
the state-of the art in this field. This review includes the barriers to the nexus implementation, key
nexus principles and main criticism on the nexus thinking.
Chapter 3 introduces the conceptual and methodological framework developed to identify the
interdependencies between the Water, Energy, Food (WEF) sectors and enable the management
of this complexity. This framework draws on joint expertise of the DCS consortium partners
representing the nexus sectors: ECN (energy), Wageningen UR (food and land) and Deltares
(water) and considers four main steps: 1) Defining the problem, 2) Forecasting and management

Page 17 of 122 ECN-E--18-036
of climate uncertainty, 3) Analysis of trade-offs and synergies: identifying the critical links and 4)
Formulating climate smart strategies: making use of leverage points and synergies.
In Chapter 4 this framework is applied to Ethiopia. Firstly, the key development challenges faced
by Ethiopia are assessed and translated into important current and future intersectoral claims;
including the analysis of the impact of Climate Change in these claims. Departing from the key
intersectoral claims identified a more detailed analysis of trade-offs is realized. This includes the
quantification of these trade-offs making use of Ribasim/Tiam/Water-limited crop models to
evaluate long- term integrated demand and supply strategies across the WEF sectors. Based on
the specific trade-offs and dilemmas identified for Ethiopia, potential points of leverage and
synergies that should be taken into consideration in the formulation of Climate Smart Strategies
are explored. To finalized the economic appraisal of alternative adaptation options to solve water-
energy trade-offs in the face of Climate Change is presented.
To finalize in chapter 5 main findings, conclusions and recommendations regarding the further
development of the nexus approach are presented.

Page 18 of 122 ECN-E--18-036
2. Literature reviews of the WEF Nexus
This chapter provides a brief overview of the rapidly growing literature on the WEF Nexus and the
progress achieved for the main research themes in this field. It explores the barriers to the nexus
implementation and the additional principles for the nexus approach that are mentioned in the
literature. Finally, the main criticism on the nexus thinking expressed in several publications is
presented.
2.1 A historical overview of thinking about the WEF Nexus The nexus approach was introduced as a new concept in the development discourse in 2008. The
World Economic Forum embraced the concept and argued that there are important links between
water, food, energy and climate change. It has since published several books and articles on the
issue, with many detailed figures about current and future use of resources and challenges to be
faced (for example The World Economic Forum Water Initiative, 2011).
In November 2011, as a specific contribution to the UN Conference on Sustainable Development
"Rio2012", the German Government organised the Bonn2011 Conference “The Water, Energy and
Food Security Nexus – Solutions for the Green Economy”. This conference was attended by more
than 550 people representing diverse stakeholder groups and created the momentum for
researching integrated approaches to address the supply security challenges of the water, energy
and food sectors. In the background paper(Hoff, 2011) for this conference a nexus approach is
defined as:
“an approach that integrates management and governance across sectors and scales. A nexus
approach can also support the transition to a Green Economy, which aims, among other things, at
resource use efficiency and greater policy coherence.”
Guiding principles advocated by Hoff (2011) for the nexus approach include:
- Investing to sustain ecosystem services. Such services are “the contribution of ecosystems
to human well-being”, with particular importance for livelihoods of the poor and include
food, feed, biofuels, wood, fibre. Other services include carbon sequestration and climate
and water regulation.
- Creating more with less. There is a need for increased sectoral resource and overall
resource efficiency. Reducing wastage along the production and supply chain – for
developing countries especially on-farm and in transport and processing – is an issue
where there is much to win.

Page 19 of 122 ECN-E--18-036
- Accelerating access, integrating the poorest. There is considerable overlap between the
1.1 billion poor people without adequate access to water, the (close to) 1 billion who are
undernourished, and the 1.5 billion who are without access to electricity. Synergies can be
built and positive feedbacks generated across the three nexus sectors.
Hoff (2011) identifies a number of areas of opportunity for improving water, energy and food
security through a nexus approach:
1. Increasing resource productivity (e.g. rainwater harvesting, desalination based on
renewable energy, photovoltaic water pumps, second or third generation biofuels).
2. Using waste as a resource in multi-use systems (in multi-use systems , wastes, residues
and by-products can be turned into resources).
3. Stimulating development through economic incentives ( investment, for example, in
research and development and reduction in perverse subsidies).
4. Governance, institutions and policy coherence (for example, learning platforms for social
innovation, more participation in planning and decision-making).
5. Benefiting from productive ecosystems (for example, maintaining and restoring
ecosystems, improved management and investment in (restoration of) natural capital, well
managed agriculture (‘agro-ecosystems’)).
6. Integrated poverty alleviation and green growth (for example landscape management).
7. Capacity building and awareness raising. Capacity building and social learning can help to
deal with the increasing complexity of cross-sectoral approaches and it can help to level
the playing field among the nexus partners.
This typology of measures identified by Hoff (2011) aligns with the typology of leverage points or
points of power to change the problematic behaviour of a system introduced proposed by
Meadows (2007) and explained in greater detail in Chapters 3 and 4.
In FAO (2014) the context in which nexus thinking is emerging, is described as an ever increasing
competition for natural resources by different sectors. In that context, the WEF Nexus has
emerged as a useful concept to describe and address the complex and interrelated nature of our
global resource systems, on which we depend to achieve different social, economic and
environmental goals. The aim of the nexus approach is to better understand and systematically
analyse the interactions between the natural environment and human activities, and to work
towards a more coordinated management and use of natural resources across sectors and scales.
This can help us to identify and manage trade-offs and to build synergies through our responses,
allowing for more integrated and cost-effective planning, decision-making, implementation,
monitoring and evaluation. It is important to note that there are different conceptualisations of
the nexus that vary in their scope, objectives and understanding of drivers. Several concepts,
frameworks and methodologies have looked at the interconnections between water, energy and
food, but also land and soil, minerals, and ecosystems.
The Water, Energy and Food Security Nexus – Solutions for the Green Economy conference in
Bonn triggered a great deal of research on the WEF Nexus which can be divided into the following
broad research themes:
I. Nexus interdependencies and integrated nexus modelling
II. Role of the nexus in the implementation of the SDGs
III. Policy Coherence and nexus governance.

Page 20 of 122 ECN-E--18-036
The progress achieved on these topics since the Bonn conference was presented at the Scientific
Forum “Understanding the Water-Energy-Food Nexus and its Implications for Governance” held in
Osnabrück, Germany, in June 2016. The main conclusions for the three research themes drawn
from the Forum were:
I. Detailed models exist and are used for developing and analysing water, energy and food
policies. The main challenge and research focus now is to integrate these models to be
better able to answer questions about the WEF Nexus. Models can serve a range of
purposes and must be judged in the light of their intended purpose: 1) general
understanding; or 2) policy formulation; or 3) detailed implementation. Important to note
here is that many of the system changes are triggered by social behaviour which is not
captured by the models and therefore other methods such as system dynamics should be
used to complement the modelling analysis.
II. In order to achieve the SDG targets it is important to identify and quantify the ‘’critical’’
links - those links that really affect the system - that exist between the 17 SDGs. This is
necessary to address the trade-offs between the SDGs simultaneously and to avoid a
situation in which one goal is achieved at the expense of another (the rebound effect).
Evidence-based nexus research helps to better identify co-benefits that may motivate
cooperation and thus improve policy coherence among the three sectors. Several methods
can be used to identify these critical links: systems analysis (simple method based on
expert judgment and not reproducible); cross-impact analysis (expert judgement assigns
score to link to create a cross-impact matrix) and integrated modelling (reproducible but
requires a great deal more resources). The current research focuses on the systems
analysis and impact matrix to reduce the huge number of links to the ones that are really
critical in a particular context and then to analyse those in detail with the integrated
modelling approach. Other relevant questions that need to be researched are: 1) does the
WEF Nexus capture all the links that are key for achieving the SDGs or does it miss the link
with sectors such as land, health, industry, gender, poverty, climate change? and 2) Does
the WEF Nexus focus more on optimizing resource use rather than on incorporating
stakeholder perceptions?
III. The lack of policy coherence rather than lack of technical solutions is often mentioned as
the main barrier to nexus-efficient solutions. Especially at the local level, integrated
modelling is less useful because the models do not incorporate social and local knowledge
and therefore often are perceived with scepticism. A participatory approach that focuses
on involving all key stakeholders, identifying their interests and addressing the lack of
awareness on nexus interconnections seems more appropriate for identifying and
implementing nexus-driven solutions.
2.2 Criticism on the nexus thinking Nexus thinking has now been in use for several years and it is being questioned on several issues.
The main points of criticism expressed by Allouche et al. (2015) are listed below:
Is the nexus approach really something new?
There are already other approaches which try to integrate different disciplines and approaches, for
example Integrated Water Resources Management. What might be new, is that the nexus tries to
integrate different policy sectors, and it encourages business involvement. It could also be a multi-
centric concept that treats the different sectors – water, energy, food and climate security – as
equally important. A multi-centric approach is certainly desirable, but it is not new and it is

Page 21 of 122 ECN-E--18-036
extremely difficult to achieve. Integrated Water Resource Management came out of the water
sector, the Landscape approach came out of the forest and biodiversity sector, and the nexus
approach most of all resounds in the water sector. All aim to achieve integration, but each starts in
its own sector (which is as such quite understandable). FAO (2014) also stresses the point that the
nexus approach considers the different dimensions of water, energy and food equally and
recognizes the interdependencies of different resource uses to develop sustainably.
Is the basic problem, the ‘scarcity of resources’ not a political issue which cannot be solved in a
technological or managerial way?
Nexus policy documents tend to provide a narrative to manage economic structures through
technological solutions, rather than questioning the inequalities (of access to resources) in the
system. The crucial importance of political and power issues is also well-known within Multi-
Stakeholder Processes and Partnerships for example for promoting changes in an economic sub-
sector (forests, livestock raising etc.). Such MSP processes were sometimes initially seen as an
‘easy’ solution to all problems. To put it simply: let people from different stakeholder groups talk
long enough and an acceptable solution will be the result. However, differences in knowledge and
power between stakeholders and groups of stakeholders play a significant role and may result in
powerful groups dictating a solution, or keeping others away from the negotiation table. There
may be situations where powerful groups prefer to not participate at all in a negotiation process.
Also differences between sectors (water, food, energy, climate change) in economic weight and
power can play an important role.
Is the nexus approach not too optimistic about investment, innovation and ingenuity?
Key to the idea of nexus is ‘efficiency’ of resource use. But the logic of optimisation has limits. It
treats the trade-offs between human needs for water, energy and food as a perfect equilibrium
model, in which resource allocation can be decided. This can encourage the commodification of
resources, downplaying environmental externalities, such as biodiversity and climate change, as
well as poverty alleviation needs, ignoring day-to-day realities, local priorities and needs. Social
dimensions of resource (nexus) links remain thinly described and under-theorised. While there
may be biophysical limits, the nexus promotors follow an optimistic view where these limits can be
overcome through investment, innovation and ingenuity, driven by even more sophisticated
technologies.
Are we not hiding the bigger debate?
The current concept is being approached as an almost magical solution that quickly solves long-
term fundamental and structural issue. This technical veil masks a bigger debate, which lies around
resource inequality and access that contribute to social instability.
Is integration of the food, water, energy and climate change sectors really possible?
Given that food, water and energy sectors often exist in silos, the idea of integration may be
challenging to put into practice. The different governing regimes of water, land and energy will
make nexus governance even more difficult.
2.3 Barriers to implementing the nexus approach Vanloqueren & Baret (2009) made a comparison of research efforts for genetic engineering and
agroecology and tried to answer the question why genetic engineering received considerably more
research funds than the much more holistic concept of agroecology. Based on that comparison the
following factors might explain the difficulty in integrating the sectors in a nexus approach:

Page 22 of 122 ECN-E--18-036
1. Until now public policies have not been focusing much on the integration of sectors.
Governmental bureaucracies also are organised according to sectors (water, food, nature,
forests, energy, climate change, etc.), often in different ministries.
2. In recent years private sector participation in the delivery of public services has become a
much more important goal. This can be seen in the promotion of the use of Public Private
Partnerships and other innovative contracting approaches. While these structures may be
viable for so called club goods, it should be noted that there are limits and challenges to
the application of these hybrid public-private governance structures for the delivery of
purely public goods and services. Two key challenges are the possibility to effectively
transfer public sector to the private sector and effective performance measurement.
Given the conflict of interests natural to the principal (public authority) and the agent
(private company delivery the service) ; these two factors mentioned above are necessary
conditions to achieve the benefits of PPP’s while limiting the negative effects of
opportunistic behaviour. A poor implementation of PPP’s for the delivery of public goods
may result in a improper focus on development of new commercialised products to the
detriment of externalities (not accounted for in the contract) such an increase in emissions
or reduction of biodiversity.
3. It is only recently that some private sector parties (particularly multinational companies)
see the need to apply a more holistic approach in their business model and started to deal
in their business practices with issues related to the nexus between food, water, energy
and climate change. The visible and increasing effects of climate change in water
availability is making more companies aware of their vulnerabilities and the fact that
nature is their real license to operate; encouraging them to look for more effective risk
mitigation measures and to invest in so-called Beyond the Fence measures at watershed
level.
4. In the media, holistic approaches like a nexus approach do not receive much attention. It
may be too complex and it is easier to tell the public about a single issue or sector. NGOs
that perform lobby and advocacy activities also have to obey to the law that you should
not make things too complex in your communication and campaigns.
5. Private sector research is not focusing on integrated approaches like the nexus. The
general perception is that it would be difficult to make the results of such a research
profitable for a company, either because is beyond their direct area of influence and/or
because to realize such collective investments would make them incur in significant
transaction costs .
6. Publicly funded research has traditionally been organised sector-specifically. Integrated
research and research on integrated systems do not have a high reputation. In sector-
specific approaches, scientists share common cultures, languages, methods and
techniques. By contrast, an integrated approach like nexus requires a greater integration
of agronomical, ecological, social, economic, water, climate and energy dimensions. It is
also one step further away from research at laboratory scale which seems the most
esteemed type of research (being closer to the ideals of positivism and reductionism). It is
also a step away from measurable innovations per sector towards variables that are much
more complex to measure, like sustainability and externalities. Innovations in the complex
field of nexus takes years before producing any publishable results and fewer papers
means a lower ranking of the scientist in question. However research is of the utmost
importance for explaining the success of sectors. For example, modern agricultural

Page 23 of 122 ECN-E--18-036
systems rely on a wide scientific basis, an enormous accumulation of the results of
investments in agricultural research during the last 160 years (Pardey and Beintema in
Vanloqueren& Baret, 2009).
7. Each sector has its own network. In many sectors, stakeholders from policy, research and
civil society meet frequently to discuss current issues. The food, water, energy sectors
each has their own networks. These different networks are barely connected. To make it
even more complex, ‘Climate Change’ often has its own network, while it is not an
economic sector.
The identified barriers are significant and there are no easy solutions to overcome them.
Important regulatory and political reforms and their proper enforcement (which will require
significant institutional development) combined with the introduction of new production and
economic models are key to create new formal and informal incentives for public sector, the
private sector and civil society to act. Additionally a new way of working that encourages
coordination, creates trust and enables effective communication between the energy-water-food
and energy sectors and all stakeholders (public, private and civil society) herein active, would be of
significant value to remove some of these barriers.
2.4 Possible additional principles for the nexus approach To address the criticisms mentioned above, the following additional principles have been suggested
to strengthen the nexus approach:
1. The need for participatory planning process: there is a need for more emphasis on
decentralised and democratised decision-making as the source of solutions, as well as the
source of understanding the challenges faced (Allouche et. Al (2015).
2. The need to pay special attention to livelihoods: to adequately incorporate sustainable
livelihoods perspectives Biggs et al. (2015) the concept of Environmental Livelihood
Security (ELS) was developed by Biggs et al.(2015) which encompasses, among other
things, a matrix with four aspects: livelihoods, water, energy and food. They identified
fundamental internal and external (influencing) factors present between these four
aspects.
3. Involvement of businesses in nexus approaches.
4. The need to pay attention to adaptive capacity of institutions.

Page 24 of 122 ECN-E--18-036
3. Conceptual and methodological framework
for the WEF Nexus
A majority of governments around the world in developed and developing countries have separate
agencies to oversee water, energy, and agricultural food production. These separate agencies set
policies, develop plans and plan investments for each sector separately. They favour ‘siloed’
approaches that represent the traditional way of governing, where one resource is controlled and
managed by a simple industry, often under specific government legislation.
In this chapter a conceptual and methodological framework is presented that aims to identify the
interdependencies between the Water, Energy, Food (WEF) sectors and is able to handle the
complexity of it. This framework draws on joint expertise of the DCS consortium partners
representing the nexus sectors: ECN (energy), Wageningen UR (food and land) and Deltares
(water). Each of them bring along expertise and practical lessons from projects conducted around
the world in the following areas: hydrology, integrated water resources management, energy
system analysis and energy technologies, agriculture and landscape management.
3.1 Conceptual framework In order to build a conceptual framework which is shared among the relevant disciplines we have
made use of System Analysis and Group Model Building techniques. Two group model building
techniques have been organized. The first session aimed to achieve a clear interdisciplinary
framing of the problem and focused on the linkages between SDG’s and the nexus. The second
session aimed at supporting the choice of case study area in Ethiopia and focused more in depth
on agriculture and landscape management as the impact of on-going projects of Wageningen UR
in Ethiopia was reviewed. The results of the Group Model Building session 1 are presented in
Appendix F. A limitation on this process has been the fact that we have limited participation to the
three DCS consortium partners without directly involving relevant stakeholders. This limitation will
be dealt with in the second phase of this research, by involving all relevant stakeholders of the
Ethiopian case study on the application of the framework making use of participatory modelling
techniques.
For a systematic process of discovery and in depth analysis of the interdependencies between the
sectors (trade-offs and synergies) within the nexus, we have made use of System Dynamics
techniques complemented with an in depth literature review of the interdependencies between

Page 25 of 122 ECN-E--18-036
the sectors. Needless to say, in the application of System Analysis and System Dynamics5
techniques the emphasis has been on discovery of key interdependencies – as the nexus concept
requires it- and not aiming at a Holistic approach.
Systems thinking and System Analysis support the drafting of conceptual models that portray
interconnections, cause- effect relationships, feedbacks and time delays between and within
dynamic systems. These interconnections are represented by so-called Causal Loop Diagrams
(CLD’s). Once these conceptual model structures have been drafted; System Dynamics can be
used to understand the behaviour of these complex systems over time. These conceptual model
structures could be taken a step further and converted into dynamic numeric models in a
computer environment.
Departing from this conceptual framework we will follow a methodological approach for the case
study which consists of the following main steps:
1. Defining the problem
2. Forecasting and management of climate uncertainty
3. Analysis of Trade-offs and Synergies: identification of critical links and variables and
quantification of trade-offs
4. Formulating Climate Smart Strategies: making use of leverage points and synergies.
Furthermore, a quantification of the trade-offs has been made by softly linking existing modelling
tools -TIAM-ECN and RIBASIM- for water-energy interdependencies and complementing this
analysis with excel calculations for biomass energy production in terms of land and water
requirements.
Before introducing each of the steps it is important to explain the conceptual framework of the
water-food-energy nexus. Our framework is depicted schematically as a system diagram, see
Figure 1 and Figure 2.
A system is the part of reality that is being studied for the solution of a given problem. Two key
steps for system specification are (Thissen and Walker 2013, p. 264):
- Step 1: Which part of reality should be focused upon? Which actors and issues?
- Step 2: Which factors are relevant?
The objectives of building a system diagram (Thissen and Walker 2013, p. 264) and its key
elements are:
- Define system boundaries, what will be included and what will not
5 System dynamics is based on systems thinking, which focuses on the system structure and offers a deeper insight
into problems. The root causes of problems and therefore a sustainable solution for them are not always easy to identify due to the interactions and time delays that occur in a system (Assaraf and Orion, 2005; Gharajedaghi, 2011; Lewis, 1998; Zoller, 1990). Systems thinking offers a deeper insight into problems. It focuses on the system structure and the system behaviour produced by the structure (Senge, 1997). System dynamics (SD) is a modelling and simulation approach using systems thinking (Assaraf and Orion, 2005; Forrester, 1994). It is particularly powerful for the study of the nexus as it enables us to (a) capture the interconnections among different components (sub-sectors ) within the (nexus) system, (b) identify stock and flow relationships, (c) recognise delays and their impacts on performance patterns, (d) simulate the structure of the system, and (e) explain the behaviour that the system produces (Draper, 1993; Forrester, 1994; Frank, 2000; Sterman, 2000; Sweeney and Sterman, 2000) and (f) last but not least, combine hard and soft variables. Causal loop diagrams (CLDs) and stock flow diagrams (SFDs) are the two basic tools used in model formulation.
Page 26 of 122 ECN-E--18-036
- Define system structure and interdependencies
- Identify key outcomes of interest, the indicators that help us evaluate if a system is
performing well or not, which are related to the objectives of the problem owner and that
will be used as criteria for policy evaluation
- Identify alternative policy options, instruments or measures for problem solution
- Identify relevant contextual factors, so-called external factors. These are elements that
cannot be influenced by the problem owner(s).
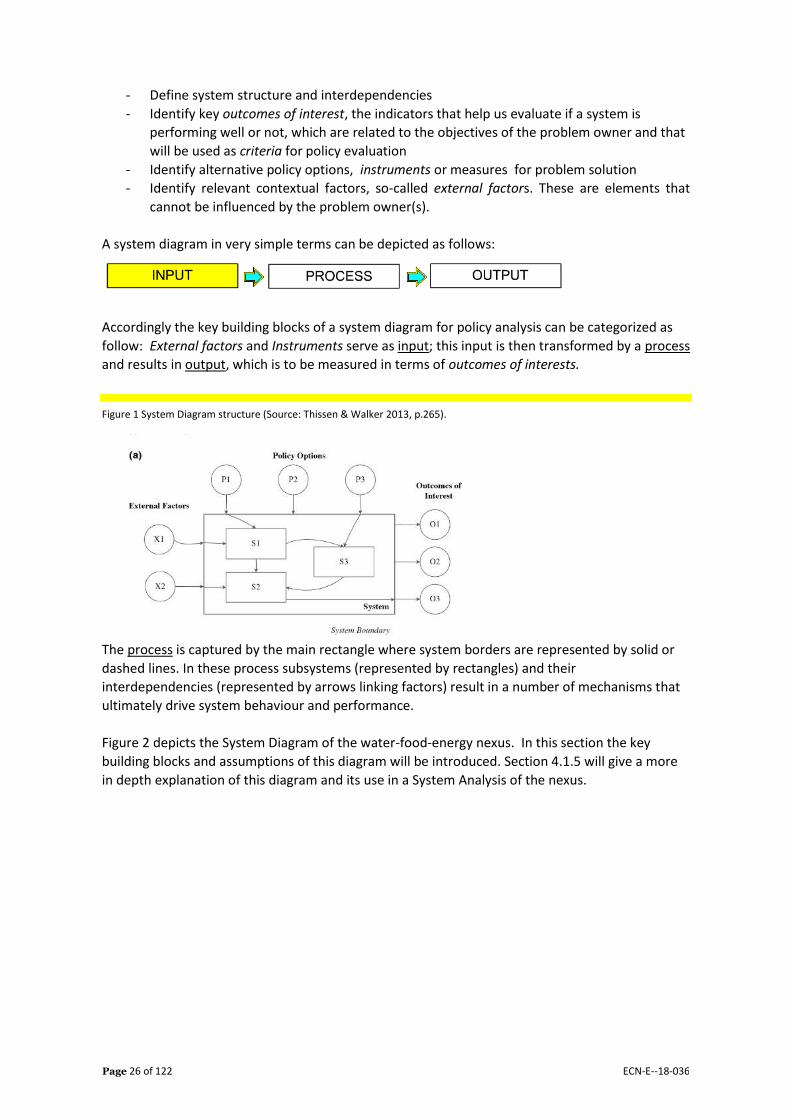
A system diagram in very simple terms can be depicted as follows:
Accordingly the key building blocks of a system diagram for policy analysis can be categorized as
follow: External factors and Instruments serve as input; this input is then transformed by a process
and results in output, which is to be measured in terms of outcomes of interests.
Figure 1 System Diagram structure (Source: Thissen & Walker 2013, p.265).
The process is captured by the main rectangle where system borders are represented by solid or
dashed lines. In these process subsystems (represented by rectangles) and their
interdependencies (represented by arrows linking factors) result in a number of mechanisms that
ultimately drive system behaviour and performance.
Figure 2 depicts the System Diagram of the water-food-energy nexus. In this section the key
building blocks and assumptions of this diagram will be introduced. Section 4.1.5 will give a more
in depth explanation of this diagram and its use in a System Analysis of the nexus.

Page 27 of 122 ECN-E--18-036
Figure 2 System Diagram of the water-food-energy nexus
The System and its boundaries
The system and its boundaries are depicted on the main rectangle and represented by the dash
lines. The nexus system comprises of three subsystems representing each sector. In each sector –
represented by a primary colour- a number of production processes take place that: a) ensure the
supply of the required yearly flows of water-energy and food by the population but that also pose
a claim on the resources of other sector(s). These claims are represented by the circles at the right
side of the subsystems and have been assigned secondary colours that reflect the two sectors
involved. The claims embody key interdependencies and trade-offs in the nexus:
- Energy required for Water Production,
- Water required for Energy production,
- Land required for Energy Production, the production of biomass results in less available
land for food production, therefore reducing the yearly food supply
- Energy required for Food Production and
- Water required for Food Production. The larger these claims the larger the chances are that scarcity of stress is experienced by the sector, endangering the achievement of water, food and energy related Sustainable Development Goals. Two important boundary conditions of our conceptual approach are:
a) Climate Change and Ecosystem health6 are considered cross-cutting issues affecting all three subsectors through a variety of variables. Although climate change is depicted as an external factors, as the feedback arrow indicates, the way the system perform in the long
6 Ecosystem health may be defined as the capacity for maintaining biological and social organization, on the one hand,
and the ability to achieve reasonable and sustainable human goals on the other (Rapport et al., 2001).

Page 28 of 122 ECN-E--18-036
term and via indirect effects will affect also the values of external factors. Ecosystem Health is depicted as a factor having an impact across all three sectors and affecting the production capacity of each of them.
b) To combat climate change adaptation and mitigation measures are needed and therefore our analysis of the nexus takes these measures as point of departure for the analysis of interdependencies (e.g. a larger share of renewable energy sources).
Outcomes of interest – the gap to be solved
The outcomes of interest depicted at the extreme right side of the diagram refer to the output
variables and represent the interests and the criteria by which the problem owner and relevant
stakeholders judge the performance of the system and monitor the impact of measures on the
problem. A problem in Systems Analysis is defined as the gap between the desired situation or
value of a criteria and the reality or current value.
As depicted in the system diagram, the main objective of the water-food-energy nexus system is to
ensure sustainable economic development and the achievement of the SDG’s 6 (6.1, 6.3, 6.4 and
6.6) and 11 (11.5) for water and water related disasters, 7 for energy and 2, 12 and 15 for food and
land management. Accordingly the Outcomes of Interest and/or Key Performance Indicators of the
Nexus System correspond to the relevant SDG indicators. Three examples would be: a. Access to
(safe and affordable) drinking water (% of total population), b. Access to modern energy (% of
population) and c) Percentage of children (<5 years) stunted or malnourished.
External Factors
External factors have been divided in two main groups: environmental and socio-economic
variable. While environmental variables affect more directly the production processes, socio-
economic variables are key drivers for demand of energy, water and food. Important
environmental variables are precipitation and temperature, both affected by Climate Change.
Meanwhile key socio-economic variables are population and its growth, prices shocks of oil, food
and energy; national regulation and policy frameworks as well as country preferences for
producing versus importing energy, food and/or water.
As indicated above, in energy policy analysis import/export is not seen as exogenous, price shocks
are not taken into account because they are only temporarily (typically 6-12 months) and policy
frameworks are endogenous.
Instruments or policy options Last but not least, in reaction to the problem faced a problem owner can influence the system by implementing a variety of Climate Smart Solutions and Climate Smart Strategies as combinations hereof. These solutions could vary from engineering and technological measures up to regulatory and planning approaches. These different options are reviewed and their potential to solve the trade-offs or to create additional synergies within the nexus is analysed.
3.2 Methodological approach: steps to follow As mentioned above, our methodological approach consists of four main steps: 1) Problem
definition, 2) Adding Climate (and policy) uncertainty, 3) Analysis of Trade-offs and Synergies, and
4) Formulating climate smart strategies. All these analytical steps need to be accompanied by a
well-designed process to ensure active engagement of key stakeholders and significant
representation and ownership of the agreements by the authorities of the three sectors: water,
food and energy. Collaborative modelling techniques have proved effective as stakeholder

Page 29 of 122 ECN-E--18-036
management technique especially for decision making process when the problem at hand has a
complex nature.
As it will be illustrated making use of the System Diagram presented in Figure 2 in each step
different elements of the water-food-energy system are analysed. Each step can be supported by
different methodologies.
The four steps suggested by our approach are: Step 1: Defining the problem This step includes a number of sub steps:
(a) Identification of key development challenges: by making a quantitative estimation of the most important gaps in terms of the Sustainable Development Goals and other national policy priorities. Analytically we suggest to make a rough quantitative estimation of current performance of the system and the challenge ahead; making use of the SDG’s suggested indicators or proxies and the baseline information for water stress, energy balance and food scarcity. A guide to realize this process is presented in Appendix A, where the proxies per SDG’s and the most important data sources are presented. The result of this first step is then the list of the most important Outcomes of Interest for the country or region applying the framework. (b) Stakeholder analysis: based on the interests of the stakeholders identified as crucial the Outcomes of Interest listed should be revised. (c) Analysis of cross-sectoral claims: Establishing most important interdependencies between sectors, by quantifying and prioritizing in order of magnitude the five cross-sectorial claims mentioned above; making use of Appendix B. Once the key two or three intersectoral claims have been identified, the production processes of the sector making the claim in another sector should be analysed aiming at discovering the most resource intensive ones. A guide to realize this process is presented is also presented in Appendix B, where the Production processes of each sectors requiring input from other sectors are presented.
(d) Draft a first problem definition (what is the problem about and how bad is it?) where the key development challenges and cross-sector dependencies that could result in unintended negative side effects of preferred or traditional measures are acknowledged.
In this step it is decided upon which part of reality should the further analysis be focused? And which actors and issues? Based on the findings of a, b and c choose the key interdependencies and processes per sector to be analysed in depth and then proceed to step 2 - evaluate the impact of Climate Change on these factors and step 3- analysis of trade-offs and synergies between the sectors.
In terms of process this first step should be accompanied by a collaborative modelling exercise including the key decision makers of the three sectors and other relevant stakeholders to be selected depending on the scale on which the analysis is being made. The results from the quantitative analysis should be seen simply as one of the many possible hypotheses, and only aiming at ensuring a facilitation of the discussions with stakeholders informed enough so as to ensure concrete new insights about nexus are shared.

Page 30 of 122 ECN-E--18-036
Step 2: Forecasting and Management of (Climate) Uncertainty Analyse the impact of Climate Change and other future scenarios – defined as combinations of a wide range of values for environmental and socio-economic factors – on a) claims made from one sector to another, b) production processes per sector and as result on c)the achievement of SDG’s. This analysis could be done in a quantitative way or in a qualitative way. In order to keep the analysis easier to grasp, in the application of this framework to Ethiopia we have opted for a focus on this step on the uncertainties introduced by climate change, while taking into consideration the changes in socio-economic variables introduced by the policy agenda of a country in the analysis of current and future intersectoral claims (step 1). A more complete analysis should also consider other socio-economic scenarios other than the ones considered in official documents. Step 3: Analysis of trade-offs and synergies: identification of critical linkages and variables and quantification of trade-offs Before the formulation and generation of solutions can start it is necessary to understanding the key mechanisms, virtuous and vicious cycles, drive explain the problematic behaviour of the system. A powerful method to do so is System Dynamics and the related Causal Loop Diagrams (CLDs) . By depicting the causal relationships between specific factors in the three sectors in a CLD and analysing it one can discover critical variables and points of leverage for the decision maker. It is important to mention that correlation is not causation and that therefore the use of statistical models in this step should be done with caution. Causation is the “story behind the model” (Thissen en Walker, 2013) which enables the discovery of leverage points. Points of leverage are the factors within a complex system where a small shift can result in significant changes in system performance, they are the places to intervene in a system. These could be identified by analysing CLD’s and finding out the factors that influence many other crucial factors simultaneously. If a quantitative System Dynamics model is used, these can be identified by making a sensitivity analysis and finding out the parameters that when varied 1o% produce a more than 10% change in the value of the outcomes of interest. However it should be noted that even more powerful leverage points than changes in specific parameters, may be identified when looking at other soft-variables that define the governance of water, food and energy resources. This will be explained and illustrated in greater detail in the following section. Special attention should be paid to the identification of these points of leverage. As stated by Jay Forrester, the founding father of System Dynamics, complex systems are counterintuitive. Leverage points are not intuitive. Or if they are, we intuitively use them backward and push them in the wrong direction, systematically worsening whatever problems we are trying to solve7. (Meadows 2007). As a result of Step 2 and 3 it is decided which factors and system mechanisms are relevant. These could be then quantified making use of a variety of simulation and/or optimization models. As sectoral models do not capture the implications of interventions in one sector for another sector; we recommend the creation of soft or hard linkages between these models to be able to quantify these trade-offs. As it will be shown in chapter 4, we have opted for soft-linkages between TIMES (TIAM-ECN) energy models, water balance models (RIBASIM) and excel calculations for the land and food sectors.
7 Leverage points: places to intervene in a System, available at: http://donellameadows.org/archives/leverage-points-
places-to-intervene-in-a-system/

Page 31 of 122 ECN-E--18-036
Step 4: Formulating Climate Smart Strategies: making use of leverage points and creating synergies Once points of leverage for decision makers have been identified and the trade-offs and synergies between sectors are well understood, the process of formulation of measures or “Climate Smart Solutions” can start. Climate Smart Solutions are measures varying from engineering and technological measures up to regulatory and planning approaches that can effectively influence critical variables and make use of the system leverage points. Climate Smart Solutions include a wide range of Smart Technological Solutions as well as Integrated Policy Solutions that are effective and efficient in affecting leverage points, in ensuring multiple SDG’s, minimizing conflicts and maximizing synergies across sectors and enhancing the potential for cooperation between and among all sectors.
In the following chapter all these steps are followed for the case of Ethiopia and in this way the
use of the framework is illustrated.

Page 32 of 122 ECN-E--18-036
4. Applying the framework to Ethiopia
In this chapter the conceptual framework presented in the previous chapter is applied to Ethiopia.
Firstly, based on the methodological approached developed we assessed in depth the key
development challenges of Ethiopia, its policy agenda and how this translate into important
intersectoral claims now and in the future, as well as how these will be affected by Climate
Change. Departing from the key claims identified we zoom and making use of the trade-offs -
already identified through the literature review (Chapter 2) and summarized as a matrix (Annex C)
and depicted as Causal Loop Diagrams (Annex D)- we analysed in depth critical linkages and
interdependencies between the three sectors, the specific trade-offs and dilemmas faced by
Ethiopia and potential points of leverage and synergies that should be taken into consideration in
the formulation of Climate Smart Strategies.
Secondly Ribasim/Tiam/Water-limited crop model set was used to quantify the interactions
between the sectors and to evaluate long- term integrated demand and supply strategies across
the WEF sectors. Until the present study these sector models were used by the consortium
partners to analyse sector specific strategies. In the present study these models have been soft
linked to create a powerful model package that enables a detailed analysis of the consequences of
policy measures taken in one sector on the other sectors.
Last but not least, an economic appraisal of alternative adaptation options to solve water-energy
trade-offs in the face of Climate Change is undertaken.
4.1 Step 1: problem definition
4.1.1 Identification of key development challenges This section aims to provide an overview of the critical development priorities of Ethiopia’s and
how they relate to the WEF nexus, from a national and global perspective. The national and global
perspectives are represented by the national policy priorities and the SDG agenda respectively. By
a) identifying Ethiopia development priorities and operationalizing them as quantitative gaps
between their (SDG) targets and the current situation and analysing, and b) analysing the
additional resource demands the achievement of these gaps simultaneously would generate; we
generate understanding on future resource constraints to the equitable economic growth of
Ethiopia and potential future conflicts in the use of their resources, and the trade-offs between
different policy targets and agendas.

Page 33 of 122 ECN-E--18-036
Setting out development priorities, their current status and the difference between both reveal
future resource demand. Comparing this to the boundary conditions of the system, e.g. resource
availability generates understanding on the criticality of certain objectives and potential conflicts.
Global policy agenda:
The Sustainable Development Goals
Table 1 below shows those SDG targets related to the WEF-nexus where Ethiopia shows the
largest gaps. Table 1 is an excerpt from Appendix A, which contains a review of WEF-nexus related
SDG variables based on the World Development Indicators (WDI) database8.
A critical challenge for achieving sustainable development in Ethiopia is meeting the population’s
primary needs, symbolized by SDG targets 2.1 and 6.1, representing food and water security
respectively. For target 2.1, eradication of undernourishment assumes sufficient access to food.
Access to energy is also a crucial factor for economic development, embodied by SDG target 7.1. In
this case a reliable and modern energy supply implies access to electricity.
For SDG target 15.1 concerning the sustainable management of Ecosystems, there does not seem
to be a gap. However, given the expected economic development, population growth, reliance on
wood fuel and the current downward trend in forest cover, forest conservation will be a challenge.
Forest conservation is taken into account in to the WEF-nexus since it is assumed to influence
sustainable provision of water, food and energy. Directly, forest cover can influence water supply
and water quality, among other things (Neary et al., 2009).
Table 1 SDG targets, indicators and their status for Ethiopia
SDG target SDG indicator (target) Target versus Status Ethiopia
Gap
2.1 By 2030, end hunger and ensure access by all people, in particular the poor and people in vulnerable situations, including infants, to safe, nutritious and sufficient food all year round
2.1.1 Prevalence of undernourishment
Target: 0% 32% (WDI, 2015)
32%
6.1 By 2030, achieve universal and equitable access to safe and affordable drinking water for all
6.1.1 Percentage of population using safely managed drinking water services
Target: 100% Status: 57.3 % (WDI, 2015)
42.7%
7.1 By 2030, ensure universal access to affordable, reliable and modern energy services
7.1.1 Percentage of population with access to electricity.
Target: 100% 26.6% (WDI, 2012)
73.4%
15.1 By 2020, ensure the conservation, restoration and sustainable use of terrestrial and inland freshwater ecosystems and their services, in particular forests, wetlands, mountains and drylands, in line with obligations under international agreements.
15.1.1* Forest area as a percentage of total land area
Target: 20% (GTP II) 12.5 % (WDI, 2015), 13.4% (WDI, 2002), (14.9% ( WDI, 1992)
7.5%
Given current development gaps in these areas, the indicators in Table 1 can be considered key
outcomes of interest for the Ethiopian government.
8 https://data.worldbank.org/data-catalog/world-development-indicators

Page 34 of 122 ECN-E--18-036
Climate agenda
The latest national policy document by the government of Ethiopia concerning the global climate
agreements is the INDC (Federal Democratic Republic of Ethiopia, 2015) which was prepared for
the 21stConference of Parties of the United Nations Framework Convention on Climate Change
(UNFCCC) held in December 2015. The INDC is clear about the national mitigation objectives,
which are to see a 64% reduction in greenhouse gas emissions from the BUA scenario by 2030. For
adaptation initiatives, the reduction of the vulnerability of the population, the environment and
the economy to the impacts of climate change are presented as key areas. In line with GTPII,
actions are linked to sectors.
The mitigation target in the INDC is formulated as: “The emissions reduction, which constitutes a
reduction of 255 MtCO2e or 64% compared to ‘business-as-usual’ (BAU) emissions in 2030,
includes 90 Mt CO2e from agriculture; 130 Mt CO2e from forestry; 20 Mt CO2e from industry; 10
Mt CO2e from transport; and 5 Mt CO2e from buildings. This does not include the reduction of 19
Mt CO2e in neighbouring countries due to the export of electric power to them from Ethiopia.”
In 2010 livestock and deforestation/forest degradation were the main sources of greenhouse
gases:
• Livestock emitted methane and nitrous oxide totalling 42% of the total.
• Deforestation and forest degradation due to cutting and burning fuel wood and due to
logging contributed 37% of the total emissions.
• Emissions from electric power generation, transport, industry and building were each only
3% of the total.
• Crop cultivation contributed 9%.
In the same document, Ethiopia states as main goal for its adaptation activities: to increase
resilience and reduce vulnerability of livelihoods and landscapes in three pillars: drought, floods
and other cross-cutting interventions.
This INDC was based on the Climate Resilient Green Economy Vision and Strategy of Ethiopia
(CRGE). The CRGE (FDRE, 2015) is Ethiopia’s Strategy for addressing both climate change
adaptation and mitigation objectives. Some priority initiatives under the CRGE include the use of
more efficient stoves, increasing reforestation and an afforestation ambition beyond the earlier
target of 7 million hectares with continued involvement of local communities.
The most important outcomes of interest concerning the climate agenda of Ethiopia are:
- Emissions (MtCO2e) from Agriculture, Forestry and Industry: these are closely related to
deforestation rate and livestock production.
- Vulnerability of livelihoods and landscapes (SDG 11.5: 5 By 2030, significantly reduce the
number of deaths and the number of people affected and substantially decrease the direct
economic losses relative to global gross domestic product caused by disasters, including
water-related disasters, with a focus on protecting the poor and people in vulnerable
situations)
National policy priorities
In this section we review some important policy papers from Ethiopia, dealing with the sectors of
agriculture, water and energy, and climate change.

Page 35 of 122 ECN-E--18-036
The national planning commission finalized in 2016 the second Growth and Transformation Plan
(GTPII) in which the successes of the first GTP will be taken forward. GTPII (FDRE, 2016) aims to
contribute to achieving Ethiopia’s vision:
“to become a country where democratic rule, good-governance and social justice reign upon the
involvement and free will of its peoples, and once extricating itself from poverty to reach the level
of a middle-income economy.”
In this chapter we examine the WEF Nexus and identify possible bottlenecks or synergies that may
strengthen the GTPII.
Ethiopia’s ambition is to become a lower middle-income country by 2025. Strategic pillars
introduced in GTP II are:
a) Sustaining the rapid, broad based and equitable economic growth and development
witnessed during the last decade including GTP I;
b) Increase productive capacity and efficiency to reach the economy’s productive possibility
frontier through rapidly improving quality, productivity and competitiveness of productive
sectors (agriculture and manufacturing industries);
c) Enhance the transformation of the domestic private sector to enable them become
capable development force;
d) Build the capacity of the domestic construction industry, bridge critical infrastructure gaps
with particular focus on ensuring quality provision of infrastructure services;
e) Proactively manage the on-going rapid urbanization to unlock its potential for sustained
rapid growth and structural transformation of the economy;
f) Accelerate human development and technological capacity building and ensure its
sustainability;
g) Continue to build democratic and developmental good governance through enhancing
implementation capacity of public institution and actively engaging the citizens;
h) Promote women and youth empowerment, ensure their effective participation in the
development and democratization process and enable them equitably benefit from the
outcomes of development;
i) Building a climate resilient green economy.)
These pillars provide the basis and direction for integrated inclusive development. The
implementation of GTP I and II is sectoral with agriculture (crop and livestock) as the main engine
for economic growth. Energy is a key element in the national economic infrastructure and large
scale investments in hydro and wind energy have been made over the last decade. Water is seen
as important in the overall economic infrastructure of the country notably in the services (potable
water supply) and agricultural (irrigation) sectors (FDRE, 2016).
IN GTP II Ethiopia’s National Planning commission and Ministry of Finance & Economic
development aim for economic growth by transitioning from an economy dominated by
agriculture to a more diversified economy that can deliver (light-) manufactured goods with a
higher added value. The envisioned transition can be linked to a traditional economic growth
model9, which describes different stages of economic growth, moving from a traditional
subsistence-driven agricultural society to a mature economy based on domestic consumption of
high-value consumer goods.
9 See stages of growth by Rostow (1990).
Page 36 of 122 ECN-E--18-036
For an economy to ‘take off’ to maturity, the secondary sector (goods-producing) share of the
economy needs to surpass the primary (agriculture) sector share (Rostow, 1990). Ethiopia aims to
do this by developing a light-manufacturing sector that produces goods such as textile and
garment, leather products, footwear, agro-processing, sugar and others. Agricultural output serves
as input factor to these production processes and is therefore a driving force, as acknowledged by
GTP II.
Another determinant of economic transitioning is through exporting additional production of
consumer goods abroad, thereby earning foreign currency, which can be used for importing
products and improving the balance of trade, leading to macroeconomic sustainability through an
improved exchange rate among other things. For increasing agricultural and thereby
manufacturing output, a reliable supply of energy and water is needed. Therefore, investments in
irrigation and energy production capacity are carried out in Ethiopia.
Other national development objectives related to water, energy and food supply are covered in
Ethiopia’s Green Economy Climate Resilience Strategy: Water and Energy (FDRE, 2015). The Green
Economy Climate-Resilience Strategy (CRGE is an integral part of the GTPII ambition to achieve
development goals in a sustainable manner. Accordingly it describes the national targets for water
and energy access, among other things. Key elements in this strategy are:
1. Improving crop and livestock production practices for higher food security and farmer
income while reducing emissions
2. Protecting and re-establishing forests for their economic and ecosystem services, including
as carbon stocks
3. Expanding electricity generation from renewable sources of energy for domestic and
regional markets
4. Leapfrogging to modern and energy-efficient technologies in transport, industrial sectors,
and buildings.
Building on the Climate Resilience Green Economy vision, the Climate Resilience strategy sets out
the implementation priorities for the Ministry of Water, Irrigation and Energy, the Ministry of
Agriculture and Natural resources and the Ministry of Environment and Forest.
Ethiopia’s current and planned power generation capacity is depicted in Figure 3 below. Currently,
the country is mostly dependent upon hydropower for its power generation. Although
hydropower would remain the predominant power source in 2030, the energy mix is planned to
become more diversified in 2030. Peak domestic and foreign energy demand is estimated at
17,868MW.

Page 37 of 122 ECN-E--18-036
Figure 3 Ethiopia’s current and planned power generation capacity (FDRE, 2015)
For an overview of the main policy objectives relevant for the WEF-system identified by Ethiopian
policy see Table 2 below.
Table 2 National policy indicators, status and targets of Ethiopia
Indicator Status Target
Average real GDP growth per annum 10.1 % (2010-2015) 11% (2016 – 2020)
Major crops production 270 million quintal (2015) 406 million quintal (2020)
Area of land irrigated 2.3 million ha (2015) 4.1 million ha (2020)
Power generating capacity 4180 MW (2015) 24092MW (2030)
Potable water supply coverage 58% (2015) 85% (2020)
Forest coverage 15.5 20% (2020)
Accordingly from this analysis we can conclude that key outcomes of interest for the Ethiopian
government, based on their policy priorities are:
- Light manufacturing output (contributes to SDG8.1 Economic growth)
- Export/import ratio (contributes to SDG8.1 Economic growth)
- % of population with access to WASH/potable water (SDG 6.1 and 6.2)
- % of population with access to electricity (SDG 7.1)
- Forest coverage (SDG 15.1)
- % of population undernourished (SDG 2.1).
As it can be seen above, four of these six outcomes of interest relate to SDG goals.

Page 38 of 122 ECN-E--18-036
4.1.2 Stakeholder Analysis In this step we analyse the position of key stakeholders and based on these results the list of
outcomes of interest depicted in section 4.1.1 Identification of key development challenges; needs
to be revised.
Table 3 Main stakeholders and their interests
Stakeholder (national level)
Role/ responsibility /mandate Strategic plan for which it is responsible
Outcomes of interest (criteria)
National planning commission / Ministry of Finance & Economic Development
- Set overall long term perspective and five years medium term growth targets10 - Provide general guidance for planning and development priorities - Approve the plan - Review the periodic evaluation results
Growth and Transformation Plan II
- GDP growth (SDG 8.1) - Macroeconomic imbalances - Agricultural output (SDG 2.3) - Manufacturing output
Ministry of Water, Irrigation and Energy (MoWIE)
- Promote the development of water resource and electricity - Cause the carrying out of study, design and construction works to promote the expansion of medium and large irrigation dams - Support the expansion of potable water supply coverage; follow up and coordinate the implementation of projects financed by foreign assistance and loans; - Promote the growth and expansion of the country's supply of electric energy11
Ethiopia’s Climate-Resilient Green Economy Climate Resilience Strategy: Water and Energy One WASH Cookstove program
- Energy production capacity (SDG 7.1) - Hectares of irrigated land - Water supply - People with access to WASH (SDG 6.1)
Ministry of Environment and Forest (MEF)
- the implementation of the CRGE strategy, and overall environmental and forest management in the country12
Ethiopia’s Climate Resilient Green Economy Climate Resilience Strategy; agriculture and forestry
- Ecosystem health (SDG 15.1) - Hectares of forests (SDG 15.1) - Biomass use (related to SDG 7.1 and 7.2)
Ministry of Health
To promote health and wellbeing of Ethiopians through providing and regulating a comprehensive package of promotive, preventive, curative and rehabilitative health services of the highest possible quality in an equitable manner.
One WASH national program
- Population health (SDG 3)
Ministry of Industry
Promote and expand the development of industry by creating conducive enabling environment for the development of investment and technological capacity of the industry sector by rendering efficient support and services to the development investor.
‘Industrial park development Document’
- Manufacturing output
Table 3 above describes the main stakeholders active in Ethiopia’s policy setting arena, each with their corresponding responsibility, outcomes of interest and strategic plan which outlines their priorities. Given the priorities of all actors, several possible conflicts of interest can arise in the future, dependent on the available resource base. The Ministry of Finance and Economic Development and the Ministry of Industry aspire economic growth based on agricultural output in
10 http://www.unosd.org/content/documents/14293-03%20Ethiopia%20New%20Institutional%20Framework.pdf
11 http://www.mowie.gov.et/mandateandresponsibility
12 https://www.forestcarbonpartnership.org/sites/fcp/files/2015/April/Ethiopia_Semi-Annual%20Report_FCPF_31515_Final.pdf

Page 39 of 122 ECN-E--18-036
combination with light-manufacturing industry. Furthermore, generating a significant part of economic growth through export markets can partially contribute to the objective of improving macroeconomic stability.
Increasing agricultural output destined for light-manufacturing will require additional land, water and energy. The Ministry of Water and Energy aims to increase supply of water and energy supply, through irrigation and (renewable) energy production projects, for the varied purposes, including WASH services and agriculture. The Ministry of Health is mainly concerned with a healthy population, reflected by access to WASH and nutrition, among other things. The Ministry of Environment and Forestry focuses on environmental quality and forest cover.
With several actors simultaneously requiring water, food and energy for fulfilling their objectives, the extent of additional water and energy supply vis-à-vis increased water and energy demand stemming from demographic and economic growth will be fundamental to potential conflict. In case of conflict, the balance between developing water and energy resources for domestic, subsistence-oriented- versus international, high-value purposes will steer the direction of national development, pro-poor or pro-growth. However, sufficient institutional capacity with respect to income redistribution can share the benefits of economic development over multiple actors. Nonetheless, given the potential future challenges, domestic food and water security might be necessary regardless of any income distribution.
The Ministry of WIE targets increasing water and energy availability by the planning set out in the Climate Resilient Green Economy strategy, setting targets for irrigation and energy production development. Besides that, the National Cookstove program should reduce carbon emissions from deforestation and forest degradation and ensuring large scale adoption of clean cooking technology by supporting the dissemination and adoption of improved cook stoves in Ethiopia.
The Ministry of Health, in collaboration with other ministries, has set out the One WASH National Program. This program aims to “improve the health and well-being of communities in rural and urban areas by increasing equitable and sustainable access to water supply and sanitation and the adoption of good hygiene practices. It combines a comprehensive range of water, sanitation and hygiene interventions that include capital investments to extend first-time access to water and sanitation as well as investments focused on developing the enabling environment, building capacity, ensuring the sustainability of service delivery, and behavioural change” (IRC, website).
Ethopia’s aims for becoming an African leader in light-manufacturing are supported by the development of industrial parks, led by the Ministry of Industry, Ethiopian Investment Commission and the Industrial Parks Development Corporation.
The influence of various actors and policy instruments at their disposal will be illustrated in the WEF-system diagram in Figure 8 , section 4.1.5.
As it can be seen in the list of outcomes of interest per stakeholder, most of these outcomes correspond to the SDG targets and/or the targets specified in key policy agendas. Based on this analysis the list of outcomes of interest needs to incorporate the following:
- GDP Growth (SDG 8): dependent on other outcomes already identified such as (light) manufacturing output. - Population Health (SDG 3) – this is of course very much dependent on SDG2.1 and other concerning food security.

Page 40 of 122 ECN-E--18-036
Nexus governance From this brief overview of policy documents and allocation of responsibilities the following conclusions can be drawn as to Ethiopia and the nexus in agriculture, water, energy and climate change:
1. There has been considerable thinking and strategy development on climate change
adaptation in the sectors under review: agriculture, water and energy. Priorities have been
formulated based on previously developed criteria and involving various Ethiopian experts.
For implementation, refining of ideas and quantification will have to take place. Part of the
activities can be taken up within existing programmes, but extensive additional funding is
necessary. This seems to be a considerable risk. Maybe more consideration is needed on
the question of how to involve the private sector and private-sector investment in climate-
change adaptation.
2. In Ethiopia the water and energy sectors are managed by the same ministry. There is one
climate-resilience strategy for the two sectors. From a nexus perspective these are
positive aspects because apparently the two sectors are already seen as linked. This has
led, for example, to the notion that the country should not only focus on hydropower for
its energy needs, since variability in water availability is a very serious issue.
3. When it comes to the relations with the agricultural sector, it should be noted that the
water sector is already considering the water needs to a great extent. This is not
surprising, since in many countries agriculture is the largest consumer of water and
traditionally the water sector takes agricultural needs into account.
4. The relation between energy and agriculture seems to be less defined. To what extent
could lack of energy in the rural areas hamper agricultural development (e.g. energy for
irrigation, energy for storage and processing of agricultural products and transport)?
5. When we look at agriculture in a broader sense and thus include forestry, there is on the
one hand the need to increase agricultural production and on the other hand the need to
intensify forestry production (fuel wood). A tension between these two objectives is
possible given constraints in land availability.
4.1.3 Analysis of current and future cross-sectoral claims The objective of this analysis is to identify the most important interdependencies between sectors, by quantifying and prioritizing in order of magnitude the five cross-sectorial claims; making use of Appendix B. For the key claims identified, the production processes of the sector making the claim to another sector is analysed with the aim to identify the the most resource intensive production processes within that sector and guide in this way the further in depth analysis of trade-offs. A guide to realize this process is presented in Appendix B, where the Production processes of each sectors requiring input from other sectors are presented.
Based on our analysis the main current and future inter-sectoral resource claims, in decreasing
order of magnitude, are as follows:
1. Water required for agricultural production
2. Water required for energy production
3. Energy required for agricultural production
4. Land required for energy production
5. Energy required for water production
The rationale for the order of the claims and their magnitude, as well as the analysis of production
process for the water and energy sectors that requires most resources from the agricultural and
energy production sectors is presented below.

Page 41 of 122 ECN-E--18-036
Water required for agricultural production
Currently, 38.5% of Ethiopia’s GDP is realised through agriculture and allied sectors. In 2020 this
share is aimed to be 33.5 (FDRE, 2014)). GTP II states that “agriculture will remain the main driver
of the rapid and inclusive economic growth and development. It is also expected to be the main
source of growth for the modern productive sectors. Therefore, besides promoting the
productivity and quality of staple food crops production, special attention will also be given to high
value crops, industrial inputs and export commodities. To this end irrigation based agriculture,
horticulture, fruits and vegetables, livestock and fisheries development will be promoted” (p. 78).
Ethiopia aims to achieve this agricultural development and growth by increasing major crops
production by around 50% and nearly doubling the area of land developed with modern small
scale irrigation schemes, by 2020 (FDRE, 2016). Water for irrigation is the dominant share of water
withdrawals, shown by Figure 4 below which illustrates the water distribution in Ethiopia with
respect to withdrawals per sector. Extrapolating this figure to the future taking into account
increased demand, water for agriculture is assumed to remain the dominant inter-sectoral claim in
the future.
Figure 4 Water withdrawal by sector, Ethiopia (Aquastat, 2016)
The prevalent crop portfolio will be altered due to a shift towards agricultural output destined for
the manufacturing industry, which is further scrutinized in section 4.1.4. Additionally, meat
consumption is expected to increase with economic development. For example, York and Gossard
(2004) found that for African countries a $1,000 increase in per capita GDP equals an increase in
1.66 kg of meat per person per year. Meat is generally known for its large water footprint
(Mekonnen & Hoekstra, 2012). Therefore, water required for agricultural production will likely
further increase through livestock demand due to a change in dietary preferences.
According to Ethiopia’s ‘Agriculture and Forestry strategy’ (2015) “Ethiopia has the largest
livestock population in Africa mainly made up of cattle (53m), sheep (26m), goats (23m) and
poultry (50m). Like agricultural cropping, livestock production is mainly based on traditional
techniques, whether mixed farming or pastoralism. A large proportion of livestock holders own

Page 42 of 122 ECN-E--18-036
just a few animals”. Total meat production is planned to increase from 1,3 million tonnes to 2,1
million tonnes in 2020 (FDRE, 2016).
Water required for energy production
In Ethiopia power generation capacity is expected to grow from 2,178MW in 2012 to 24,092MW in
2030. 70% of this growth will be driven by hydropower development (see figure 3 above).
Therefore, the energy sector claim to the water sector is expected to grow substantially.
Another source of energy that consumes water is embodied by the use of biomass. In 2010, 89% of
Ethiopia’s total national energy consumption was based on biomass energy. Biomass energy is
consumed for household energy purposes, e.g. cooking. It has been estimated that 81% and 11.5%
of 16 million households cook with firewood and leaves/dung cakes respectively (Geissler et al.,
2013).
Based on population growth estimates, absolute biomass energy consumption is expected to
increase further. However, the claim on water resources resulting from biomass energy
consumption depends on the type of biomass and its production method. Biomass energy can
come from the natural stock of woody biomass, on-farm trees, crop residues or dung. For 2013,
annual total sustainable natural woody biomass yield is estimated to be 49.7 million tons (air dried
weight). Annual total on-farm yield is 110.2 million tons. Crop residues and dung deliver 22 and 32
million annual tons respectively.
Therefore, when the increase in biomass consumption relies on natural woody biomass the claim
on water resources does not increase. In an extreme case, water and land resource availability
could increase due to deforestation. Nevertheless, deforestation decreases ecosystem health and
(ground) water retention capacity, negatively affecting water availability and quality (Neary et al.,
2009).
Increased biomass energy use stemming from on-farm tree production will increase the claim of
the energy sector on water resources. Additional crop residue and dung consumption will increase
water consumption, albeit indirectly. Uncertainty about future biomass energy production
methods inhibits a detailed estimation of this future claim on water resources. Nonetheless,
extrapolating current biomass consumption based on population growth creates a substantial
future claim, assuming a distribution of production methods similar to current biomass energy
production.
Energy required for agriculture
Making use of Appendix B, the table Food production – Energy demand we identify that within the
agriculture sector, energy is needed for: a) food production harvesting, b) processing and/or
packaging, c)transport, d)storage and cooling and e)cooking of food. Important energy claims for
Ethiopia, especially in the future relate to processing and/or packaging; due to the growth of the
agro-industry.
The surge in agricultural output will affect energy use of this sector, since additional output needs
to be served by pumping systems, tractors, assembly lines etc. Moreover, energy consumption will
increase due to Ethiopia’s aspired increase in industrial processes that are linked to agricultural
input such as textile manufacturing, leather production, agro-processing, sugar production and
meat, milk and honey production (FDRE, 2016).
Table 4 below illustrates current and future electricity demand of Ethiopia’s various sectors. The
direct share of agriculture can be considered marginal. Nonetheless, around 25% of industrial

Page 43 of 122 ECN-E--18-036
electricity demand is assumed to stem from the agroindustry sector (GTP II). Since industrial
electricity demand is the largest current and future consumer, 25% can be assumed to be a
substantial claim on energy resources.
Table 4 Electricity demand in the reference and universal electrification scenarios (Twh), LEAP model results (Mondal et al.,
2017)
Land required for energy production
As it can be seen in Appendix B, table Energy production- Food demand; the production of energy
also poses a claim on food production directly or indirectly via: a) the use of food products such as
corn for the generation of biofuel, b) the land claimed for biofuel crop production (or other energy
generation processes) that is not available for food production, or c)land required for other energy
generation installations such as wind and solar.
Error! Reference source not found. illustrates that 91% of Ethiopia’s current electricity production
originates from hydropower. As mentioned previously, 89% of Ethiopia’s total national energy
consumption is based on biomass energy.
As depicted by Figure 3 future electricity generation capacity is expected to experience an 11-fold
growth path. Hydropower’s claim on land resources is relatively small (from a KWh per m2
perspective) compared to other energy sources, e.g. wind and solar power. With 70% of future
capacity stemming from hydropower the total claim on land seems to be relatively modest.
Nonetheless, the 20% wind and solar production capacity will require land availability.
The future claim of biomass energy on land resources depends on the production method, e.g.
natural wood or on-farm trees. For example, an unsustainable yield of natural wood will generate
land resource availability. On the other hand, additional on-farm tree production will require more
land resources. Currently, no information on future biomass production methods has been
acquired.
Energy required for water production
Currently, a large share of Ethiopia’s drinking water needs is covered by groundwater supply.
Around 70% of rural water supply comes from groundwater sources and ground water is also
important for the large cities (Aquastat, 2018). Energy required for water production from
groundwater is assumed to be relatively small due to the limited energy needs for groundwater
extraction and purification compared to other methods such as reuse and reverse osmosis.

Page 44 of 122 ECN-E--18-036
Since Ethiopia currently uses around 10% of renewable water resources (Aquastat, 2018), a large
share of untapped resources remain. Therefore, additional water resource development can
commence with cheaper, less energy-intensive methods, before it has to revert to more
expensive, energy-intensive methods13
4.1.4 Main inter-sectoral claims Based on our analysis it can be argued that the most important future inter-sectoral claims will be water required for agriculture and water required for energy, as they seem largest in magnitude and have multiple interdependencies with other sectors. The sections below will provide a more detailed analysis of these inter-sectoral claims.
Food production claims on water
Water demand of agriculture has been identified as the largest current and future demand source
for water, fuelled by population and economic growth. By looking in Appendix B to the Table food
production-water demand we observe that water in the agricultural sector may be required for a)
Irrigation, b) fertilizers production, c) processing, d) water for animals and 5) water as habitat for
fish. Based on our analysis we have identified a) water for irrigation and d) water for animals as
important ones now and in the future. As Ethiopia advances in the development of their agro-
industry also water for b) fertilizers production and c) processing will become more and more
important.
The agricultural sector mainly consists of small-scale subsistence farmers using traditional farming
techniques that are dependent on rain-fed water resources. 8 million households, 95% of the total
cropped area and more than 90% of total agricultural output are currently represented by this
type of farming (FDRE, 2014) Figure 5 below confirms that staple foods related to subsistence
farming such as sorghum, barley and other cereals are typically rain-fed (green water). Crops with
a higher value typically destined for manufacturing such as cotton and sugar cane are typically
reliant on surface- and groundwater (blue water), as shown by Figure 5 as well.
Figure 5 Green (left) and blue (right) water use of per crop type (CWFP, 2016)
13 See for example Hellegers, Immerzeel & Droogers (2013)

Page 45 of 122 ECN-E--18-036
Table 5 below shows planned crop output according to the GTP II. Regarding cereals, maize, teff
barley and wheat are mentioned. Regarding pulse crops, chick peas, filed peas and haricot beans
are mentioned. In relation to oil crops, linseed, Niger seed and sun flower are mentioned. The
envisioned 50% increase in crop output by 2020 illustrates the expected surge in future water
demand. This demand is met partially by an expected growth from 2.3 to 4.1 million hectares of
the area of land equipped with modern small scale irrigation schemes by 2020. Additionally, the
area of land developed with large and medium irrigation schemes is expected to grow from 0,65 to
0,95 million hectares by 2020.
Table 5 Planned crop output for Ethiopia 2015-2020 (FDRE, 2016)
Variable Current (2015) Future (2020)
Total major crop production 270.3 (mln qt) 406 (mln qt)
Total production of stalk cereals 115 (mln qt) 171.78 (mln qt)
Total production of non-stalk
cereals 120.3 (mln qt) 184.22 (mln qt)
Total production of pulse crops 26.4 (mln qt) 38.75 (mln qt)
Total production of oil crops 7.5 (mln qt) 11.5 (mln qt)
Coffee production 420 (thousand tonnes) 1045 (thousand tonnes)
Exact data on the future composition of Ethiopia’s crop portfolio including location-specific water
needs is required in order to quantify future water demand. Nonetheless, the planned expansion
of the agroindustry sector will result in a larger share for more high-value crops such as cotton,
sesame and coffee compared to today. Gerbens-Leenes, Hoekstra & van der Meer (2009) show
that staple foods such as wheat and potatoes typically require less water than high-value crops
Water demand from fertilizer production is expected to double by 2020, with the supply of
chemical fertilizers increasing from 1.2 million to 2 million metric tonnes. Meat production has a
similar projected growth trajectory, with total output rising from 1.3 to 2.1 million tonnes.
Furthermore, the projected growth of the agroindustry (e.g. cotton, leather, tahin) will increase
water requirements for processing.
Energy production claims on water
Exactly quantifying energy-water trade-offs of different energy sources can be complex. Firstly,
one has to determine the water requirements in terms of withdrawal, consumption and discharge.
Withdrawal implies the amount of water abstracted from a water source. Consumption is the
amount of water that is taken out of the water cycle, usually either as vapour or biomass.
Discharge is the amount of water being returned to the water cycle, albeit in a different state
(Rodriguez et al., 2013).
As shown in Appendix B many parts of the energy value chain consume water; on the table Energy
production-Water demand, we observe that water in energy production is needed for a)
processing and b) cooling; and different energy production methods that require water are: a)
hydropower generation, b) energy plants (gas, coal, nuclear, etc) c) energy drilling and fracking,
d)solar energy plants and e)biofuel production. As it is explained below, the production processes

Page 46 of 122 ECN-E--18-036
expected to require most water for energy production in Ethiopia are a) hydropower and e)
biofuel production: biomass energy consumed by households, e.g. cooking.
Besides that, energy processing and production facilities’ return flows often inflict water pollution.
For example, hydropower production requires large amounts of water to be stored for energy
generation and carbon capturing in energy production also requires water. Thermal power plants
need large quantities for cooling purposes and developing energy in terms of extraction and
refining requires water for coal, oil and gas. Furthermore, producing biofuels requires substantial
amounts of water (Rodriguez et al., 2013).
Figure 6 Water footprint of energy sources (World Bank, 2016)
The power generating capacity of Ethiopia is aimed to expand from 4,180MW in 2014/15 to
17,208MW by 2019/20. As shown by Figure 6 above, the water footprint of this expansion is
dependent on the distribution of production methods within this future portfolio. The future
distribution of Ethiopia’s electricity production portfolio is as follows; 13,817MW is planned to be
generated from hydro-power, 1224MW from wind power, 300MW from solar power, 577MW
from geothermal power, 509MW from reserve fuel (gas turbine), 50MW from wastes, 474MW
from sugar and 257MW from biomass (FDRE, 2015).
A large share of the water use in the hydro-electricity sector is non-consumptive. However, the
timing of water releases and affected water quality rates can impact other sectors. Moreover,
consumption occurs in the form of reservoir evaporation and seepage, by amounts dependent
upon site location and design. For example, a reservoir in an arid region might evaporate great
amounts of water, whereas a run-of-the-river system stores and evaporates relatively small
amounts of water.
Additionally, hydropower generation impacts the surrounding environment. An unbounded
flowing river is converted into a reservoir, affecting water quality and ecology due to increased
water temperatures and altered sediment and nutrient levels among other things. Therefore, the
water footprint of hydro-electricity is among the largest in Figure 6 (Rodriguez et al., 2013).

Page 47 of 122 ECN-E--18-036
Ferroukhi et al. (2015) found that water use of wind is negligible, which is also confirmed by Figure
6 above. The water footprint of solar energy will be dependent on the exact production method,
since some solar energy methods are more dependent on water than others, e.g. concentrated
solar power compared to photovoltaic modules (Carter & Campbell, 2009).
Energy needs that are met by biomass, either for household or electricity generation purposes, will
have significant implications for future water demand. Gerbens-Leenes, Hoekstra & van der Meer
(2009) found that the water footprint of biomass is 70 to 400 times larger compared to other
primary energy carriers except hydropower. Final water demand will depend on where biomass
energy is sourced from. Sustainable yield from existing natural sources will not alter water
demand, whereas additional on-farm biomass production, e.g. eucalyptus, will increase water
demand.
4.1.5 System Diagram and problem definition
Based on all the analyses made before the overall WEF system diagram for Ethiopia is depicted in
Figure 7. On the right side the key outcomes of interests for the actors reviewed in our analysis are
presented; on the left side we see the external factors which cannot be directly influenced by the
problem owner(s) and are the root of uncertainty about future developments. Finally in the middle
top we see the instruments, measures or policies that could be adopted by the problem owners to
affect the problematic behaviour of the current system and steer the WEF system to close the key
development gaps identified. A more detailed analysis of the mechanisms driving system
behaviour within the overall WEF nexus in Ethiopia is presented in Figure 8 . Appendix D contains
more detailed Causal Loop Diagrams of specific key trade-offs and synergies, e.g. water for energy.
Figure 7 System diagram for the water-energy-nexus in Ethiopia

Page 48 of 122 ECN-E--18-036
As can be seen in Figure 7 above, the future of Ethiopia’s economic, social and ecological
development will be dependent on the long-term sustainability of the performance of the WEF-
system. The main policy objectives are visualised in the causal loop diagram representing
Ethiopia’s WEF-nexus in Figure 8 below. The green variables on the right hand side represent main
outcomes of interest, based on the information above.
As described above, the agricultural sector will be at the core of Ethiopia’s development.
Agricultural output can be distinguished according to two categories; food and non-food. Both
categories serve different trends that have induced the future crucial role of agriculture in
Ethiopia’s development. Food encompasses those agricultural products not meant for the
manufacturing industry or export, e.g. staple crops and livestock. Non-food output implies
products such as cotton, sesame meant for sesame paste and sugar canes.
Food production will be necessary to solve the current and future undernourishment prevalent in
Ethiopia, with 32% of the population currently being undernourished. Ethiopia’s population is
expected grow from 104 to 140 people in 2030, making the challenge larger. This trend will
pressure food availability per capita, as shown by the negative relation between population
growth and food availability per capita, as illustrated in Figure 8 .
Extensive agricultural modernization combined with food imports will probably be necessary for
progress in lowering undernourishment rates while keeping up with population growth. In Figure 8
this is shown by the positive correlation between agricultural productivity, percentage of land used
for food agriculture and food availability per capita.

Page 49 of 122 ECN-E--18-036
Figure 8 Most relevant Causal Loop Diagrams for the Water-Energy-Food Nexus in Ethiopia
Access to safedrinking water (%)
SDG 6.1
(Light) manufacturingoutput
Prevalence ofundernourishment
(%) SDG2.1
Access to electricity(%) SDG 7.1.
Deforestation rate
Exports/imports ratioExchange
rateInflation
Wateravailabilityper capita
(Renewable)Energy
generationcapacity
Foodavailability per
capita
Tradebalance
Agriculturaloutput
Amount ofhydropower
plants
Amount ofwind power
plants
Amount ofsolar power
plants
Householdbiomass energy
demand
Agriculturalproductsexported
% agriculturalproduction used
for lightmanufacturing
Agriculturalproductivity
% agriculturalland irrigated
Fertilizer use
Averagetemperature
Rainfallvariability
Prevalence ofpests anddeseases
Frequencyof droughts
Erosion rates
Hydropowerproduction
Wind powerproduction
Solar powerproduction
Land used foragriculture
Manufacturingproductivity
Climate change
-- -
Water use ofagriculture
-
+++
+
+
+
-
+
+
++
+
-
+Populationgrowth
-Electricity
exports
+Water use forenergy
generation
-
-
Economicpolicy
+
Irrigationinvestments
National cleancookstoveprogram
One WASHprogram
Industrial parkdevelopment
+
- +
+
Energyinvestment plan
+
++
Forest cover (% oftotal land area) SDG
15.1
National planning
commission ( GTP II)
Ministry of Water,Irrigation and Energy
(MoWIE)
It combines the efforts of the Ministry ofWater, Irrigation and Energy ( lead by its
Water and Sanitation Supply Directorate) ,Ministry of Health, Ministry of Education and
the Ministry of F inance & E conomicDevelopment
Within government, the Environmental Protection
Authority ( EPA) will be responsible for
alignment of this programme with the broader
Climate Resilience Green E conomy ( CREG)
strategy
E thiopian investment commission,
Industrial Parks Development
Corporation, Ministry of Industry
-
Access to Sanitation(% ) SDG 6.2
+
GDP Growth
+
+
+
+
Renewable EnergyShare (SDG 7.2|)
CO2 Emissions
+
-
Vulnerabilitylivelihoods and
landscapes (SDG11.5)
+-

Page 50 of 122 ECN-E--18-036
Non-food production is crucial for Ethiopia’s ambition to become a leader in light-manufacturing and
sustain the planned growth rates of GDP. Industrial parks are being constructed in order to process
the agricultural output and transform it into manufactured goods such as textile and garment.
Besides that, exporting these goods abroad will improve the position of Ethiopia’s currency,
improving its capability to repay foreign debt and thereby stabilize Ethiopia’s macro-economic
position. This relationship is defined as positive correlation between non-food agricultural output,
agricultural products exported and the exports/imports ratio.
Future conflict can arise when resources (money, water) are invested in the light-manufacturing
industry at the detriment of pro-poor development. Figure 8 illustrates this trade-off by assuming
land used for food agriculture cannot be used for non-food agriculture and vice-versa, with a limited
amount of land suitable for cultivation.
Besides the aforementioned intrasectoral trade-offs within the agricultural sector, increased
agricultural output will further increase the dominant claim of agriculture on water resources. Water
consumed through agriculture cannot be used for generating electricity and WASH services. The
negative relation between water used for agriculture and water availability per capita and water
available for hydropower in Figure 8 reflects this trade-off.
The severity of the issue of multiple sectors increasing their claim on water resources depends on
Ethiopia’s current and future water availability. Data from FAO’s Aquastat (2018) indicates that
Ethiopia currently utilizes 8.6% of its total renewable water resources. Based on this figure, one
could assume sufficient water resources remain to meet Ethiopia’s future water demand. However,
Figure 9 below, illustrating average annual blue water scarcity, shows a different reality.
Blue water scarcity is based on the blue water footprint compared to the blue water available after
environmental flows are met. Blue water entails surface water flows and connected surficial
aquifers, and does not take into account deep groundwater aquifers, storage capacity and releases
from dams. A value smaller than 1 implies environmental flows are met. A value higher than 1
indicates moderate (yellow), significant (orange) and severe (red) blue water scarcity.
Figure 9 Annual blue water scarcity in Ethiopia (Mekonnen & Hoekstra, 2016)
The discrepancy between Figure 9 and the perceived abundance of water resources illustrated by
Aquastat (2018) exemplifies how sufficient availability of water resources depends on the temporal
and spatial distribution of water. For example, around 70 per cent of the total runoff of Ethiopia’s

Page 51 of 122 ECN-E--18-036
rivers occurs during the period June-September (Aquastat, 2018). Large fluctuations in water
availability have led to multiple droughts in Ethiopia, with devastating effects. For example, the
2002/03 drought caused a 4% decline in GDP, a 12% reduction in agricultural output and a 15%
inflation rate. In particular, coffee harvests suffered a 30% decline due to this drought (FDRE, 2014).
The influence of various actors and their policy instruments is depicted at the top of Figure 8 . It
shows that economic policy set by the NPC affects the ratio between land and water used for food
and non-food agriculture, assuming a limited amount of land fit for agricultural development
(depending on soil characteristics, water availability etc.). Thereby, this policy steers the
beneficiaries of WEF resources.
Other actors are linked to actions and plans that can alter the practical WEF system capacity and are
placed on top of the diagram in the ‘instruments’ category. Potential WEF system capacity is
unchanged as it is bound to initial endowments.
In conclusion, it can be stated that Ethiopia’s main problem is that due to its dependence on
hydropower development and light-manufacturing of agricultural products, future economic growth
and social development will be vulnerable to temporal and spatial water scarcity. Besides that, this
increasing claim on water resources can conflict with increasing water demand for subsistence, e.g.
WASH services and small-scale farming, fuelled by population growth. Moreover, Ethiopia’s
ecosystems are under pressure due to deforestation stemming from biofuel use and land use change.
Further deterioration of ecosystem services will negatively affect water availability and quality,
among other things.
Accordingly important trade-offs and policy questions that are key to explore are:
- In what sense do the manufacturing output goals conflict with objectives for undernourishment
and WASH?
- How viable is hydropower in a country with water scarcity and growing water demands? This will
be explored with our models.
- Can hydropower synergize between issues? Generating electricity, providing water for irrigation,
WASH?
4.2 Step 2: Forecasting and Management of Climate Uncertainty In order to keep the analysis easier to grasp, in the application of this framework to Ethiopia we
have opted for a focus on this step on the uncertainties introduced by climate change, while taking
into consideration the changes in socio-economic variables introduced by the policy agenda of a
country in the analysis of current and future intersectoral claims (step 1). A more complete analysis
should also consider other socio-economic scenarios other than the ones considered in official
documents.
4.2.1 Trends in Ethiopia’s climate Temperatures have increased over the last five decades in Ethiopia. Compared to 1960, current
mean annual temperature is 1.3 °C higher. Furthermore, the average amount of ‘hot days’, a day
with a temperature exceeded on 10% of days, has increased by 73 relative to the 1960 distribution.
The average number of ‘hot nights’ increased by 137. Most changes occurred in the months June,
July and August for both days and nights (McSweeney et al., 2010).
Precipitation trends are hard to detect due to inter-annual and inter-decadal variability in Ethiopia’s
rainfall. Between 1960 and 2006 no significant trend has been observed in mean rainfall in Ethiopia.

Page 52 of 122 ECN-E--18-036
Since the 1980s, Ethiopia has experienced seven major droughts, five of them leading to localized
famines. Besides that, 50% of Ethiopian households were confronted with at least one drought event
between 1999 and 2004. Due to increases in temperature and erratic rainfall behaviour Ethiopia’s
vulnerability to droughts is expected to increase (Robinson, Strzepek & Cervigni, 2013). Droughts
have a large impact on the economy, costs vary between 1% to 4% of total GDP, dependent on the
intensity and duration of a drought event.
4.2.2 Future climate change Future temperatures are expected to rise in Ethiopia, the estimated range of warming relative to the
1961-1990 period is 0.5°C to 1.5°C in the 2011-2040 period and 1.5°C to 3°C in the 2041-2070
period. Figure 10 below shows the main temperature modelling result (FDRE, 2014).
Across Ethiopia, annual rainfall variability is a common factor. The precipitation difference between
a ‘wet’ and ‘dry’ year varies from 28% to 62%. This ‘regular’ year-to-year rainfall variability
complicates the prediction regarding precipitation trends due to climate change, in terms of
aggregate volume. Recent estimates taking into account different scenarios and model projections
report a change in annual rainfall that varies between -25% and +30% by 2050, relative to the 1961-
1990 period. Nonetheless, rainfall variability itself is expected to increase due to climate change,
intensifying extreme events and making rainfall prediction more uncertain.
Figure 10 Temperature estimates for Ethiopia (FDRE, 2014)
4.2.3 Implications for policy objectives Table 6 below illustrates Ethiopia’s main policy targets that have been identified as being most
vulnerable to future climate change. Each target is accompanied by its respective current and target
value and time horizon. Figures have been taken from Ethiopia’s GTP II (FDRE, 2016). Furthermore,
the main determinants of future climate change vulnerability are elaborated per policy target. See
Appendix C for additional information on the relation between climate change and trade-offs in the
WEF nexus. Table 6 describes and summarises the main policy targets, see Appendix G for a more
extensive overview of identified development priorities in Ethiopia, how they are connected to
SDG’s and the implications of climate change for their achievement.
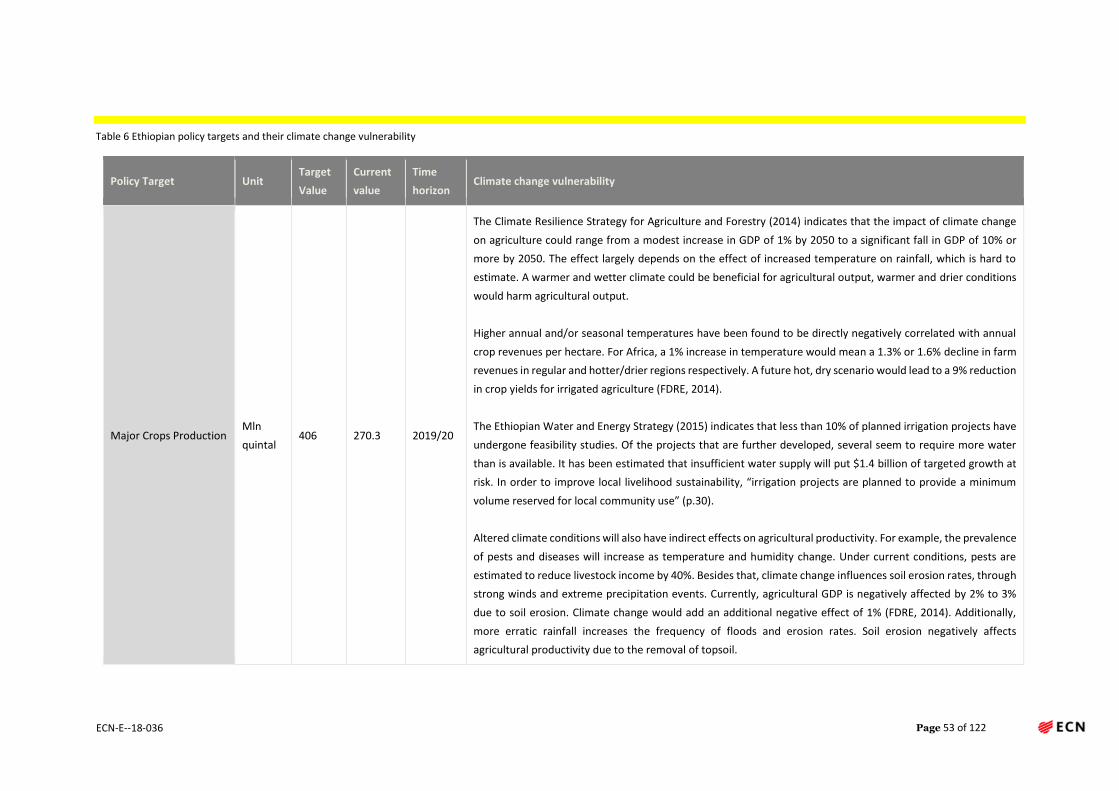
Page 53 of 122 ECN-E--18-036
Table 6 Ethiopian policy targets and their climate change vulnerability
Policy Target Unit Target
Value
Current
value
Time
horizon Climate change vulnerability
Major Crops Production Mln
quintal 406 270.3 2019/20
The Climate Resilience Strategy for Agriculture and Forestry (2014) indicates that the impact of climate change
on agriculture could range from a modest increase in GDP of 1% by 2050 to a significant fall in GDP of 10% or
more by 2050. The effect largely depends on the effect of increased temperature on rainfall, which is hard to
estimate. A warmer and wetter climate could be beneficial for agricultural output, warmer and drier conditions
would harm agricultural output.
Higher annual and/or seasonal temperatures have been found to be directly negatively correlated with annual
crop revenues per hectare. For Africa, a 1% increase in temperature would mean a 1.3% or 1.6% decline in farm
revenues in regular and hotter/drier regions respectively. A future hot, dry scenario would lead to a 9% reduction
in crop yields for irrigated agriculture (FDRE, 2014).
The Ethiopian Water and Energy Strategy (2015) indicates that less than 10% of planned irrigation projects have
undergone feasibility studies. Of the projects that are further developed, several seem to require more water
than is available. It has been estimated that insufficient water supply will put $1.4 billion of targeted growth at
risk. In order to improve local livelihood sustainability, “irrigation projects are planned to provide a minimum
volume reserved for local community use” (p.30).
Altered climate conditions will also have indirect effects on agricultural productivity. For example, the prevalence
of pests and diseases will increase as temperature and humidity change. Under current conditions, pests are
estimated to reduce livestock income by 40%. Besides that, climate change influences soil erosion rates, through
strong winds and extreme precipitation events. Currently, agricultural GDP is negatively affected by 2% to 3%
due to soil erosion. Climate change would add an additional negative effect of 1% (FDRE, 2014). Additionally,
more erratic rainfall increases the frequency of floods and erosion rates. Soil erosion negatively affects
agricultural productivity due to the removal of topsoil.

Page 54 of 122 ECN-E--18-036
Policy Target Unit Target
Value
Current
value
Time
horizon Climate change vulnerability
Gebreegziabher et al. (2011) studied the effect of climate change on Ethiopian agriculture, growth and poverty,
based the effect on land productivity in moisture-sufficient highlands areas with cereal-based agriculture and the
drought-prone highlands. These two areas were selected based on their large share of Ethiopia’s total agricultural
output. Results show that in the moisture-sufficient highlands areas crop and livestock productivity increases
until 2030 in the climate change scenarios compared to the no-climate-change scenarios. After 2030 land
productivity starts to decline. In the drought-prone highlands, land productivity and crop yield starts to decrease
relatively soon.
Additionally, the study analysed the role of general Total Factor Productivity (TFP) growth, which has been 2.58%
since 1992 in Ethiopia, in agricultural productivity. Results show that climate change affects income by 30% under
both scenarios (including and excluding TFP growth). However, in the scenario including TFP growth and climate
change overall income level increases. Therefore, the positive effect of TFP growth outweighs the negative effect
of climate change on productivity.
Area of Land developed
with modern small
scale irrigation schemes
Mln
hectare 4.1 2.3 2019/20
Ethiopia’s policy documents acknowledge the vulnerability of the planned growth in agriculture to rainfall
variability. Irrigation can aid in reducing this vulnerability by distributing water more uniformly and efficiently.
However, additional future reliance on irrigation systems also creates exposure to climate change. Up to $16.8m
of agricultural growth has been found to be at risk under the driest scenarios due to insufficient irrigation. A
further $1.4bn of targeted growth has not yet undergone feasibility study, but appears to be in areas where there
is insufficient water supply (FDRE, 2015).
Power generating
capacity MW 17,347 4,180 2019/20
Mukheibir (2007) found four main consequences of altered rainfall and temperature conditions that affect
hydropower output. Firstly, higher temperatures increase surface water evaporation. Secondly, dry conditions
reduce surface water run-off and diminish the storage in reservoirs, reducing hydropower production. For
example, historical droughts have sharply diminished African hydropower output. In 2004 all of Tanzania’s
hydropower plants were temporarily operating at half capacity due to a drought. A higher frequency of droughts

Page 55 of 122 ECN-E--18-036
Policy Target Unit Target
Value
Current
value
Time
horizon Climate change vulnerability
and/or increasing water withdrawals from other sectors is therefore expected to negatively affect hydropower
output.
Thirdly, flooding can increase surface water run-off and thereby increase generation potential. However, floods
can carry large loads of sediments and other materials such as vegetation that can damage or block the
hydropower plant. Fourthly, desertification of soils can increase erosion rates, with sediments filling up reservoirs
and lessening the lifespan of hydropower plants (Mukhebir, 2007).
Simplifying results gives a one-to-one relationship between a percentage change in precipitation and power
generation according to Neumann and Prince (2009). However, deriving relationships from average rainfall
conditions can be misleading. Average rainfall and extreme events can increase simultaneously, intensifying
droughts in terms of occurrence and intensity, leading to potential blackouts (Cole, Elliot & Strobl, 2014).
Forest Coverage % 20 15.5 2020
Current weather variability has existing impacts on forest health, for example 200,000 ha is affected by forest
fire prevalence annually. Future climate change is expected to affect forest productivity and health, through
changes in temperature and rainfall, affecting the suitability of existent forest areas. These effects can be
exacerbated by the slow rate of natural forest adaptation and the limits on natural redistribution due to land
constraints. However, adverse effects can be partially off-set by increased productivity stemming from a CO2
fertilisation effect (FDRE, 2014).
Hotter, drier scenarios will result in projected reductions in the areas of forest coverage, fragmentation of forest
life zones, the disappearance of certain types of forest (e.g. montane and lower montane wet forest and
subtropical desert scrub). This has the potential to affect timber and non--‐timber forest products, wider
ecosystem services (water and soil catchment management and flood protection) and rural livelihoods, which
depend on forests for a large proportion of their income, and as a coping strategy during times of drought (FDRE,
2014).

Page 56 of 122 ECN-E--18-036
Policy Target Unit Target
Value
Current
value
Time
horizon Climate change vulnerability
Overall potable water
supply coverage % 83 58 2020
A large proportion of planned schemes in the One Wash National Program rely on dug wells and spring capture.
These technologies are often highly exposed to rainfall variability and options for alternative methods are limited.
By 2030, around 14 million have been found to be at risk of (drink)water scarcity due to low-resilience
technologies and/or climate-prone hydrogeology. Moreover, higher temperatures increase domestic water
needs, further pressuring water resources available for WASH purposes. Additionally, climate change can affect
groundwater resources, which are often used for domestic ends. Long-term reductions in rainfall can reduce
groundwater levels. Contrarily, an increase in the intensity of rainfall has been linked to increased groundwater
recharge (FDRE, 2015).

Page 57 of 122 ECN-E--18-036
On an aggregate level, agricultural policy objectives seem to be negatively affected by climate
change due to the negative correlation between temperature and crop revenues per hectare.
However, the temporal and geographical distribution of climate effects varies due to Ethiopia’s
multitude of climatic zones. Moreover, high uncertainty remains regarding expected future
precipitation, which ranges from an increase to a decrease.
The relation between irrigation policy and climate vulnerability is two-sided. Firstly, irrigation
systems can mitigate drought-risk by smoothening fluctuations in water availability. Secondly,
additional development of agricultural areas dependent on irrigation systems can generate
additional vulnerability to climate change.
Ethiopia’s aspired future hydropower output will face various threats stemming from an increase in
temperature. The aforementioned uncertainty regarding future rainfall patterns complicates
assessing the implications of higher temperatures for surface water run-off. Furthermore, as
illustrated by section 4.5, precipitation model outcomes include high regional variability. Therefore,
each planned hydropower asset can experience different climate change effects. Based on the
current untapped hydropower capacity embodied in Ethiopia’s water resources initial investments
seem to create more added value than vulnerability.
Rural livelihoods can become particularly affected by climate change due deteriorated forest health,
which serves as input to biomass energy use, and reliance on low-resilience WASH technologies. The
WASH sector is especially vulnerable to an increase in rainfall variability, due to the necessary
continuity of drinking water supply for subsistence. An increase in variability is expected to occur
due to increased kurtosis in the probability distribution of future rainfall.
Besides climate change affecting policy objectives through altered water availability, growing
economies such as Ethiopia imply an increase in conflicting water demands due to increasing
domestic and industrial water needs. In terms of relative importance, Vörösmarty et al. (2000) found
that “impending global-scale changes in population and economic development over the next 25
years will dictate the future relation between water supply and demand to a much greater degree
than will changes in mean climate” (p. 287 Alcamo, Flörke & Märker (2007) also find that the balance
in water supply and demand will be mostly affected by an increase in withdrawals, rather than
decreased supply due to climate change.
4.3 Step 3: Analysis of trade-offs and synergies By undertaking a in depth analysis of the WEF system, key interdependencies between the water-
food – energy sectors we enable the explicit formulation of key policy dilemmas, which helps to
elucidate the specific conflicting points and trade-offs faced by a country in their endeavour to
achieve food, water and energy security along with the desired economic growth that is key for the
achievement of other SDG’s .
We will do this in depth analysis and illustration of the methodology for two of the three most
important intersectoral claims identified throughout steps 1 and 2:
1) Water required for agricultural production: water-food nexus
2) Water required for energy production: water-energy nexus

Page 58 of 122 ECN-E--18-036
4.3.1 Water for Food: the complex linkages between food and water security Food production and more specifically water for irrigation accounts for over 85% of water
withdrawals in Ethiopia, making the agricultural sector the largest user of water. It is known that
50% of water withdrawals for food production are lost, either evaporated into the atmosphere or
transpired through plant leaves.
Causal Loop Diagram in Figure 11 shows the interdependencies between food and water security. In
order to have a comprehensive understanding of the behavior of these two systems and the trends
we observe in Ethiopia is important to identify critical variables of the system, which could be places
of leverage. The following paragraphs will explain in greater detail this process.
To define what is a critical variable, the number of arrows coming in and coming out of this variable
are a first good indication. The causal links depicted by the arrow that such variable has more causal
relations influencing it and/or influences many other variables. The more connections it has, the
more critical this variable could be. This is, however, not the only criteria; also the fact that such
variable affects multiple “outcomes of interest” or the main goals of the system - which are at the
right side of the diagram - makes it a suitable one to be considered a critical variable.
As an illustration of the previous two criteria, let’s look at Total agricultural land to understand how
this dynamic works. On the one hand this variable is being influenced by Total food demand,
Average cultivated area, Rainfed agricultural land, Irrigated agricultural land and Average yield per
crop. On the other hand, this variables has an impact on annual deforestation rate and Energy used
for Harvesting. According to the first criteria, this would be a central variable. However, we still need
to evaluate whether it influences many of the outcomes of interest or not. To check this, the arrows
that depart from Total agricultural land are followed. As it can be seen in Error! Reference source
not found., the goals Water stress, Biodiversity, Food production environmental footprint, Hunger,
Interruptions in supply and percent of energy used for productive use are all affected by this variable.
This variable could thus be considered a critical variable of the system.
Following the same principles, the variable Average yield per crop field does not seem at first so
central, as it does not have many arrows going in or out of it. Nevertheless, given the number of final
goals this variables influences - more than Total agricultural land- make it a critical one. Even more
since this variable is easier to be influenced by a range of policy measures.
To complete this analysis is important to understand the main mechanisms that drive system
behavior and explain the historical trends observed in key outcomes of interests. The behavior of a
system is the result of its structure and is driven by what is called Feedback Loops. These loops are
series of causal connections that altogether form a closed loop, which reinforces or stabilizes the
behavior of a system.
We can observe such a loop in Figure 11, in the right side bold arrows are connected. The loop could
be read as follows: An increase in the Ecosystem’s Health increases river discharge levels, as more
water remains within the system. This, at the same time, increases water supply and consequently
reduces water stress; which ultimately means that more water can go to Ecosystems and
Ecosystem’s health improves. This behavior is called a reinforcing loop, as an increase in Ecosystem’s
Health from a variable outside the loop, would increase the whole loop final outcome, and
Ecosystem’s health itself again. Such a reinforcing loop may become, depending on the initial levels
of “Ecosystem Health”, a vicious or virtuous cycle. Reinforcing loops cause exponential growth or

Page 59 of 122 ECN-E--18-036
decrease and if stronger than other loops they can steer the behavior and direction of the whole
system.
As it can be observed in Figure 11, two important reinforcing loops with Ecosystems Health as
departure point could become vicious cycles that deteriorate exponentially the water stress
challenge and/or virtuous cycles that lead to an exponential increase of water supply. Ecosystem
Health affects river discharge levels and water quality, both of which define water supply. Limited
water supply and stress often means that environmental flows are not ensured and that Ecosystem
Health is further deteriorated. As it can be seen in Figure 11, Ecosystem Health not only plays a role
in water supply within normal conditions but also contributes to the resilience of landscapes and the
reduction of economic and crop production losses in extreme dry/wet years. This seems all in all to
be a leverage point of the system. Therefore is not surprising that reduction of deforestation rates is
the focus of the work of many NGOs and governmental campaigns around the world.
To explain the possibilities of this type of analysis, an increase in Average yield per crop field will be
analysed. If we assume that the yield per crop field is increased, following the lines going out of this
variable, it can be observed that it decreases the Total agricultural land, as less land will be required,
and it will also decrease the annual deforestation rate. This change will decrease as well the Area of
Natural Ecosystem Destroyed, which will in turn increase Ecosystems Health and reduce Water
Stress. It can be concluded, with the same logic of the Causal Loop Diagram, the following: An increase in average yield per crop would mean in terms of system goals a:
- Reduction of Water stress - Increase on Biodiversity (or at least not decrease) - Decrease in Food production environmental footprint - Reduction of Hunger (defined as # months there is enough food per year) - Reduction of interruptions in energy supply - Reduction of Percentage of energy used for productive use
As it can be seen from the previous analysis, increasing the Average yield per crop field will be an
effective and straightforward way to contribute to the accomplishment of all the goals defined.
Following the same rationale, reducing the Average yield per crop field would affect negatively the
goals proposed. Finally, by doing the same analysis we observe that decreasing Total agricultural
land will have similar effects in the goals of the system.
What does this mean from an Ethiopian perspective? These two variables and loops are very
relevant given Ethiopia’s agricultural system and policy goals. With the expected growth of 50% in
food production between 2015 and 2020 and assuming the rest of the system in the business as
usual scenario, an increase in Total agricultural land of at least 50% can be expected, meaning that
there would be a significant: - Increase in Water stress - Reduction of Biodiversity (or at least not decrease) - Increase in Food production environmental footprint - Increased in Hunger (defined as # months there is enough food per year) - Increased in interruptions in energy supply - Increase in Percentage of energy used for productive use
Now is important to go a step further in our analysis to understand the concept of trade-offs. In our
analysis of Average yield per crop field and Total Agricultural Land and their effect on outcomes of
interest we did not yet consider how the measures that could be implemented to improve these
parameters, could have negative side effects and rise conflicts between goals. In Figure 11 it can be

Page 60 of 122 ECN-E--18-036
observed that a way to increase Average yield per crop field - which is ‘desired’ from the previous
analyses -, is through increasing the Fertilizer and pesticide application rate and/or increasing
irrigation and therefore irrigated agricultural land.
In the Causal Loop Diagram presented, Fertilizer and pesticide application rate do not only have a
positive effect by increasing Average yield per crop field, but also a negative one by affecting the
Quality of irrigation return flows, and in this way Water quality, which will eventually lead to an
increase in Water stress and decrease of Biodiversity. Also, by following the causal chain or path
through Ecosystems’ Health, a third goal is negatively impacted in the longer term: Hunger.
Here a dilemma or trade-off can be pointed out. By increasing the use of fertilizers and pesticides,
two possible things can happen. On the one hand (the Average yield per crop field direction) all goals
are improved, and thus, seems to be a fairly effective solution. On the other hand, when observing
the negative side effects of fertilizer use, it is not clear what the best direction to take is. A similar
dilemma can be identified when increasing Irrigated agricultural land. By doing this, not only the
Total agricultural land can be reduced due to an increase in Average yield per crop field, but also
Water used for irrigation and to a less degree energy used for harvesting will increase, eventually
leading to water and energy stress and an increase on interruptions in supply.
In explicit terms these dilemma’s or tradeoffs would be:
How to increase the average yield per crop area so as to advance water and food security, while
limiting or avoiding the negative side effects of current solutions as Fertilizers and Pesticides on
biodiversity and water quality and of water for irrigation on water security?
Stating the dilemmas in this way helps to elucidate the specific conflicting points and trade-offs
faced within the Water-Energy-Nexus. This process also helps to formulate problem definitions that
are clear and helpful for the search of climate smart strategies; strategies that are effective in the
long term and deal with the root causes of Ethiopia development and environmental challenges and
that have the potential to solve the trade-offs or to create additional synergies within the nexus.
To conclude, there are important trade-offs and tensions between food and water security- as an
increase of agricultural land may endanger water supply in the middle to long term and traditional
measures to increase average yield per crop often result in lower water quality levels, also reducing
supply.

Page 61 of 122 ECN-E--18-036
Figure 11 Causal Loop Diagram depicting the interdependencies between Food and Water Security
Total fooddemand
percentage of soilswith
erosion/degradation(%)
Water quality(nutrients/pollutantconcentrations -
ppm)
% of foodproduction
wasted
Population
+
Interruptions insupply (goal:
none)
Hunger (#months there is
enoughfood/year) (goal:
12)
E conomic losses /damage caused bywater disasters
Riverdischarge
(m3/second)
E nergy used forfood
tranportation,storage and
cooling (GWh/yr)
Post- harvestlosses (tons/yr)
+ +
% of energyused for
productive use
E vapotranspiration(M m3/yr)
Annualdeforestation
rate Area of naturalecosystemsdestroyed
(km2)
+
Consumptivewater demand
- food production(M m3/year)
Water required forIrrigation (M m3/yr)
Water Used - foodproduction (M
m3/yr)
Agricultural waterproductivity of a field
(tons/m3 of waterabstracted)
Totalagriculturalland (km2)
Food processinginstalled capacity
(M tons/yr)
Water Supply(M m3/yr)
Water Stress(M m3/yr)
-
Water required forfood processing (M
m3/yr)
Average yield percrop field (tons/
ha)
Fertilizer andpesticide
application rate(kg/ha)
Quality of IrrigationReturn F lows (nitrate
and nutrientsconcentrationlevels- ppm)
E nergy used forharvesting (GWh/yr)
E nergy used for foodprocessing and
packaging (GWh/yr)
Water used for foodtransportation
(GWh/yr)
E nergy used for foodstorage and cooling
(GWh/yr)
+
+
+
-
Irrigatedagriculturalland(km2)
+
+
Rainfedagriculturalland (km2)
+
-
-
+ +
-
+
Energy used forfood production
(GWh/yr)
Total E nergyused for Food
Provisiong(GWh/yr)
Installed coolinginfra capacity (M
tons/yr)
++
+
+
+
+
+
-
-
+
-
+
E cosystemsHealth
Food productionenvironmentalfootprint (GHGemissions/ton)
-
-
B iodiversity+
Mechanizationof Agriculture
Averagecultivated area
(km2/household)
+
+
+
Landscaperesilience to
extreme events
+
Food productionlosses due to
extreme weatherevents (tons/yr)
-
+
+
+
+
+
Energy Scarcity
+
+
+
+
Water used forIrrigation (M m3/yr)
Water allocated toIrrigation (M m3/yr)
+
+
Run-off(M m3/yr)
+
-
-
++
+
Water used for foodprocessing (M m3/yr)
+
+
-
+
T raditional useof biomass for
cooking
+
Improved seedquality
E fficient irrigationsystems (e.g. drip
irrigation)
Measures that IncreaseProductivity of rainfed
agriculture
Measures to reduceevotranspiration rates
(e.g. Mulching)Rule enforcement
Waste WaterT reatment of
Irrigation ResidualWater
Conservation andClimate SmartAgriculturePractices
Forest governanceand protection
Reforms toagricultural and
water rights
++
-
--
- +
+
-
++
+

Page 62 of 122 ECN-E--18-036
Figure 12 Causal Loop Diagram for Food and Energy Security
hydropower plantgeneration capacity
(MW)
People with access tomodern energy (goal:
100%)
Share of renewables intotal energy mix (Goal:
twice current)
Water quality
Forest cover (%loss/year)
Percentage of children(<5year) stunted or
malnurished
River B asinHealth
Measures tolimit reservoirevaporation
Land requiredto build dam
(km2)
Hydropowerdam size(height)
F ish migrationflow
Number oflarge
hydropowerdams
Reservoirevaporative
losses Annualdeforestation
rate
Area of naturalsystems
destroyed(km2)
Level ofdisturbance of
river ecosystem(downstream)
+
+
+
+
+
-
Hydropowerenergy generated
(MW/yr)
L and erosionlevel (upstream)
Landscape &E cosystem Mgt.
Measures
+
+
Number of peopleaffected by waterborne
diseases
-
Multi- usereservoirs
Methaneemissions/yrClimate Change Number of
artificialreservoirs
+
+
+
+
+
Loss ofagricultural
land (km2/yr)+
Annual CropProduction(calories/yr)
Annual F ishProduction(tons/yr)
+
-
-
-
-
Reservoirvolume
+
+
+
ReservoirSiltation
+
-
Droughtintensity
Averagetemperature
+
+
+
+
Total energydemand
People usingelectricity +
+
+
-
-
-
-E nergy supply
+
Energy supply:demand ratio
-
+
Large hydropowerdam planned
-
+
Water forIrrigation
+
+
+

Page 63 of 122 ECN-E--18-036
4.3.2 Water for Energy: the complex linkages between water, food and energy security
As an additional Causal Loop Diagram to analyse, the case of the Water for Energy trade-offs is
explored. Figure 12 shows the system diagram relating hydropower development versus environ-
mental and natural resources objectives. Following the same analysis pattern as for water for food
production, the critical variables and feedback loops will be identified in this section first. Then, the
implications of such variables and the dilemmas present will be explored in the Ethiopian case, and
finally some leverage points will be identified that could steer the direction of the system’s behavior.
As explained before, critical variables are those that either have many connections within the system
or affect most or the goals. Such connections can be either going in or out of the variable. With such
base, two variables and one feedback loop can be identified: Number of large hydropower dams and
Hydropower dam size and the loop that is represented with bold lines in Figure 12. Now a zoom will
be done in each one of them for the case in Ethiopia.
The future development of Ethiopia relies heavily on Hydropower. There is an expected increase of
power generation capacity of more than 8 times between 2012 and 2030, from 1.981MW to 16.864
MW in 2030. This dramatic increase in Hydro energy production inclines the system diagram in a
very straightforward way towards growth, so all that is dependent variables on Number of large
hydropower dams will have critical effects here. Increasing the Number of large hydropower dams
according to the logic of the system diagram, will end up increasing the Share of renewables in total
energy mix and People with access to modern energy – which is desirable. On the other hand, the
forest cover will be reduced due to deforestation, as well as the percentage of children under 5
stunted or malnourished due to competition of land with agriculture. All this is undesirable, of
course.
There is an additional dilemma worth of highlighting from increasing the Number of large
hydropower dams. Even though in the short term people will get access to modern energy, in the
long run this goal might be threatened by climate change, from which building new dams will be also
a contributor to some extent as it accelerates deforestation. Here we observe again that a policy
measure will have both, positive and negative implications on the same goal in different time scales.
The loop between Number of large hydropower dams, Hydropower energy generated and Energy
supply:demand ratio is a balancing feedback loop. This means that the tendency of the whole loop is
not to increase unlimited, but to grow as the limits allow (in this case, people using electricity) and
remain there. This is a key factor when talking about speed of implementation. We’ll come back to
this later.
If the actual increase of Hydro power in Ethiopia is a fact, the goals related to People with access to
modern energy and Share of renewables in total energy mix will be favorably met. However, the
other goals affected negatively, such as forest cover and percentage of children under 5 stunted or
malnourished will have a heavy burden if they are not managed adequately, especially the negative
effects on land and ecosystems when building the dams.
Doing a similar analysis for an increase in Hydropower dam size, at first it can be observed that it
would affect positively the people with access to modern energy, however if analysed carefully it will
also decrease it if an increase in the evaporation losses happens, reducing reservoir volume, and
ultimately hydropower plant generation capacity. In this case an optimal needs to be found, and/or

Page 64 of 122 ECN-E--18-036
measures that limit reservoir evaporation. Additionally there are purely negative effects caused by
the an increase on number of large hydropower dams, such as an increase of percentage of children
under 5 stunted or malnourished and the number of people affected by waterborne diseases, both of
them explained by the level of disturbances of river ecosystems (downstream) caused by the con-
struction of dams, and the subsequent impacts this has on fish migration flows and water quality.
Additionally a significant increase in the number of large hydropower dams would not only imply and
increase in access to modern energy, but also an increase on number of people affected by
waterborne diseases and diseases and is expected to trigger land use conflicts (less land available
for agricultural production) in the areas where the hydro dams projects will be developed.
Summarizing, the dilemma faced here seem to be: How to exploit the hydropower potential of
Ethiopia without materializing the environmental, food security and health threats associated to it?
Given the ambitions plans that Ethiopia has to increase hydropower production and the significant
increase in energy production planned according to the policy documents reviewed, it is very
probable that most of this production will consider the construction of very large dams. Therefore it
is important to consider these trade-offs when designing further a strategy of hydropower
generation expansion. Based on this understanding the government of Ethiopia could design a plan
that includes the necessary risk mitigation measures and climate smart strategies that allow them to
increase their generation capacity while limiting the negative effects this has on the environment
and ultimately on food and water security for the most vulnerable.
4.4 Step 4: formulating Climate Smart Strategies: making use of leverage points and creating synergies
Once we have formulated clear problem definitions that capture the key dilemma’s and trade-offs
(steps 1 to 3) these dilemma’s guide our the search for Climate Smart Strategies. Climate Smart
Strategies are strategies that are effective in the long term , that deal with the root causes of
Ethiopia development and environmental challenges and that have the potential to solve the trade-
offs or to create additional synergies within the nexus by making use of powerful leverage points.
According to Meadows (2007), there are different ways to change a system behavior and improve
the performance of system, called leverage points. Some leverage points are more effective than
others. What Meadows proposes is a specifically categorized way to change the behavior of a
system. The following is the list of possible changes to do in order to modify the behavior of any
system, in increasing order of effectiveness:
12. Constants, parameters, numbers (such as subsidies, taxes, standards).
11. The sizes of buffers and other stabilizing stocks, relative to their flows.
10. The structure of material stocks and flows (such as transport networks, population age
structures).
9. The lengths of delays, relative to the rate of system change.
8. The strength of negative feedback loops, relative to the impacts they are trying to correct against.
7. The gain around driving positive feedback loops.
6. The structure of information flows (who does and does not have access to information).
5. The rules of the system (such as incentives, punishments, constraints).
4. The power to add, change, evolve, or self-organize system structure.
3. The goals of the system.
2. The mind-set or paradigm out of which the system - its goals, structure, rules, delays, parameters -
arises.
Page 65 of 122 ECN-E--18-036
1. The power to transcend paradigms.
By applying this approach to the WEF nexus, and the case of Ethiopia, different Climate Smart
strategies that make use of these leverage points can be conceived.
4.4.1 Achieving food and water security For instance, part of the solutions already proposed (Fertilizers, Irrigation and/or improved seed
quality) are already part of the 12th point of the list, where some parameters are increased or
decreased to change the final effects on the goals. There are still many others (maybe more
effective) ways to change the behavior of the system, and we will explore some options here.
A first option that can be considered as a solution could be, for instance, the implementation of
fertilizers with less harming effects in the water or the environment. This would delay the effect of
chemicals on the ecosystems’ health and would balance - for better - the trade-offs of that particular
solution. Similar solutions could be thought for irrigation, where less energy intensive solutions
could be taken, such as taking water from specific (easy to access) places, or making the spraying
process more efficient. All this type of solutions could be grouped in option 9th of the list proposed
by Meadows: changing the lengths of delays, relative to the rate of system change.
Also, some other more effective changes can be made which would take advantage of the loops
already present in the system. Looking at how central are some variables in a feedback loop, it can
critically improve (or worsen) the behavior of the system. In the Ethiopian case, some special focus
could be put in the Ecosystems’ health. This variable is central to the loop and affects three of the
goals in the system. So for instance, reinforcing this loop by adding forest governance and protection
policies, or even including economic incentives for families to work on this by introducing payments
for ecosystem services or the like that could boost and protect these goals. Additionally reforms to
agricultural and water rights could create the incentives for farmers to invest in more efficient
irrigation systems and other measures to reduce evotranspiration. This type of changes is related to
point 7th of the list proposed: change in The gain around driving positive feedback loops.
Finally, more drastic but also more effective changes in the system can be developed. Item 4 of the
list, The power to add, change, evolve, or self-organize system structure, is definitely a point where
things can be dramatically changed. These changes nevertheless require longer periods of time and a
broader perspective ; for which political buy in is necessary. These changes could be, for instance,
about modifying individual behaviors regarding social systems and productivity models that are
resilient and environmentally friendly. An option here would be the introduction of Conservation
and Climate Smart agriculture practices. Nevertheless, to make this happen, the modifications have
to be done from the bottom, regarding education and empowerment so emergent changes come
out of it. Transforming food consumption patterns is another example of how a system behavior can
change if the system structure is changed by changes in individual behavior. Such a change would
dramatically influence food demand in quantity and types of crops, and in this influence significantly
the environmental pressures posed by food production on the water sector and the environment.
We see such a change happening in the Western world were the preferences of consumers for
biological products is driving the change in agricultural practices elsewhere.
The changes proposed here require different degree of commitment and implementation strategies.
Independent of that, the leverage points approach helps in defining more effective policies and
designing Climate Smart Strategies (CSS). For the design of Climate Smart Strategies a systemic
analysis of the nexus is required.

Page 66 of 122 ECN-E--18-036
4.4.2 Achieving energy security without endangering food and water security A rather ‘technical’ solution that is in between modifying Constants, parameters, numbers (as a
12th best way to change a system) and changing the sizes of buffers and other stabilizing stocks,
relative to their flows (the 11th best way), could be to tackle evaporation losses in the dams to be
built in Ethiopia. In this way, harmful effects of large hydro dam regarding water losses due to
evaporation could be mitigated.
A deeper change of this system could be done if the lengths of delays, relative to the rate of
system change are modified (this is the 9th best way to change a system, according to meadows).
This could mean, for instance, that in practical terms the construction of the dams can be done in
a different speed in Ethiopia, making sure that the affected goals can be mitigated adequately over
time. Making use of the balancing feedback loop would help to control this over time, by either
helping the loop with – for example- implementing Landscape and Ecosystem Management
measures that control erosion upstream and prevent a loss in reservoir volume of existing dams or
slowing down the growth in total energy demand, so that the process of hydropower expansion
matches better time wise with the environmental adjustments required. The implementation of
this approach requires nevertheless an change in Ethiopia policy priorities, or at least in the tempo
with which they implement national economic objectives.
A final lever that could help, is the one related to change the rules of the system, which is expected
to have greater impact than the previous ones. This means that instead of letting the system work
as it is now, new incentives and maybe new linkages are introduced; overall changing current
system structure. This change of the system, for the Ethiopian case, would mean that -for
instance- new regulations actually enforce the protection of some variables, like the requirement
to build artificial ‘fish passes’ allow for fish migration flows. Also, creating strong regulatory and
economic incentives for companies to protect the ecosystems surrounding the dams, would help
to overcome the tradeoff between dams construction vs. environment and health, by changing the
connections between them.
4.5 Modelling results and quantification of trade-offs and synergies
4.5.1 Brief description of the modelling framework for quantitative estimation of trade-offs and impact of climate change (steps 2 and 3)
TIAM-ECN is a well-established version of the global TIAM model developed in the context of the
IEA Implementation Agreement called IEA-ETSAP (The International Energy Agency’s Energy
Technology Systems Analysis Program). TIAM is a member of the family of technology-rich
bottom-up energy systems models based on the TIMES platform and is described in detail in
Loulou and Labriet (2008) and Loulou (2008). TIAM is a linear optimization model simulating the
development of the global energy economy from resource extraction to final energy use over a
period of over 100 years. Its regional disaggregation separates the world in a number of distinct
geographical areas, 20 until recently for TIAM-ECN. The objective function of TIAM-ECN consists of
the total discounted aggregated energy system costs calculated over the full time horizon and
summed across all regions. Running scenarios with TIAM-ECN involves minimizing this objective
function.
The main cost components included in the objective function are investment costs, fuel costs and
fixed plus variable operation and maintenance costs. Smaller cost components such as
decommissioning and infrastructure costs are also included, albeit in an approximate respectively
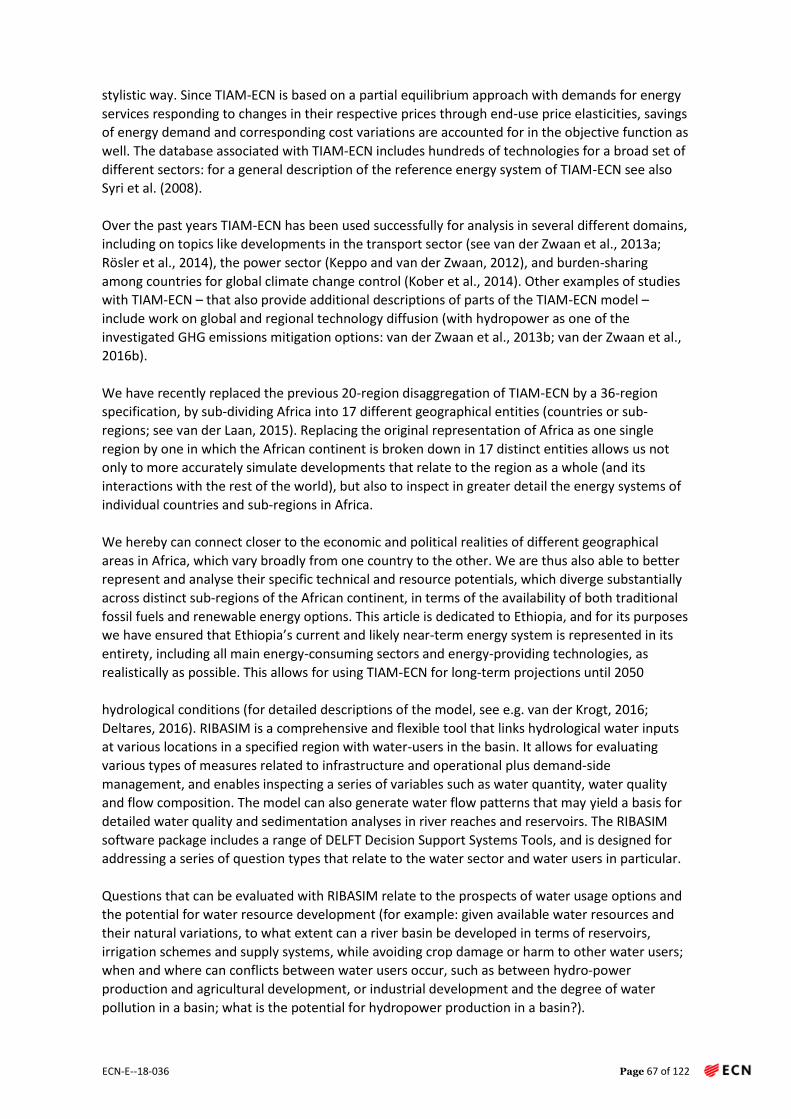
Page 67 of 122 ECN-E--18-036
stylistic way. Since TIAM-ECN is based on a partial equilibrium approach with demands for energy
services responding to changes in their respective prices through end-use price elasticities, savings
of energy demand and corresponding cost variations are accounted for in the objective function as
well. The database associated with TIAM-ECN includes hundreds of technologies for a broad set of
different sectors: for a general description of the reference energy system of TIAM-ECN see also
Syri et al. (2008).
Over the past years TIAM-ECN has been used successfully for analysis in several different domains,
including on topics like developments in the transport sector (see van der Zwaan et al., 2013a;
Rösler et al., 2014), the power sector (Keppo and van der Zwaan, 2012), and burden-sharing
among countries for global climate change control (Kober et al., 2014). Other examples of studies
with TIAM-ECN – that also provide additional descriptions of parts of the TIAM-ECN model –
include work on global and regional technology diffusion (with hydropower as one of the
investigated GHG emissions mitigation options: van der Zwaan et al., 2013b; van der Zwaan et al.,
2016b).
We have recently replaced the previous 20-region disaggregation of TIAM-ECN by a 36-region
specification, by sub-dividing Africa into 17 different geographical entities (countries or sub-
regions; see van der Laan, 2015). Replacing the original representation of Africa as one single
region by one in which the African continent is broken down in 17 distinct entities allows us not
only to more accurately simulate developments that relate to the region as a whole (and its
interactions with the rest of the world), but also to inspect in greater detail the energy systems of
individual countries and sub-regions in Africa.
We hereby can connect closer to the economic and political realities of different geographical
areas in Africa, which vary broadly from one country to the other. We are thus also able to better
represent and analyse their specific technical and resource potentials, which diverge substantially
across distinct sub-regions of the African continent, in terms of the availability of both traditional
fossil fuels and renewable energy options. This article is dedicated to Ethiopia, and for its purposes
we have ensured that Ethiopia’s current and likely near-term energy system is represented in its
entirety, including all main energy-consuming sectors and energy-providing technologies, as
realistically as possible. This allows for using TIAM-ECN for long-term projections until 2050
hydrological conditions (for detailed descriptions of the model, see e.g. van der Krogt, 2016;
Deltares, 2016). RIBASIM is a comprehensive and flexible tool that links hydrological water inputs
at various locations in a specified region with water-users in the basin. It allows for evaluating
various types of measures related to infrastructure and operational plus demand-side
management, and enables inspecting a series of variables such as water quantity, water quality
and flow composition. The model can also generate water flow patterns that may yield a basis for
detailed water quality and sedimentation analyses in river reaches and reservoirs. The RIBASIM
software package includes a range of DELFT Decision Support Systems Tools, and is designed for
addressing a series of question types that relate to the water sector and water users in particular.
Questions that can be evaluated with RIBASIM relate to the prospects of water usage options and
the potential for water resource development (for example: given available water resources and
their natural variations, to what extent can a river basin be developed in terms of reservoirs,
irrigation schemes and supply systems, while avoiding crop damage or harm to other water users;
when and where can conflicts between water users occur, such as between hydro-power
production and agricultural development, or industrial development and the degree of water
pollution in a basin; what is the potential for hydropower production in a basin?).

Page 68 of 122 ECN-E--18-036
Likewise, infrastructure requirements and operational plus demand-side management issues can
be assessed (for instance: what is the effect of technical measures to improve water supply for
various users, taking into account water quantity and flow composition; what are the agricultural
production yields and costs for the implementation of such measures?). More generically, RIBASIM
allows for performing essentially any type of analysis that requires the water balance of a river
basin to be calculated, by taking into account the use by and drainage from agriculture, the use by
and discharges from industry, domestic water demand for drinking, cleaning and sanitation
purposes, and downstream re-use of water. The resulting water balance can provide the basic
information needed to determine the available quantity and quality of water, as well as the
composition of the water flow, at any time and location in the river basin.
RIBASIM has recently been used to perform an analysis for Ethiopia. It has now been updated for
the purpose of this study to reflect as accurately as possible the present water basin features in
Ethiopia. The analysis behind the current study makes use of the existing RIBASIM schematization
developed under the ENWSM (Development of the Eastern Nile Water Simulation Model) project,
commissioned by ENTRO (Eastern Nile Technical Regional Office) to Deltares. The present study
makes use of the ENTRO version of the RIBASIM model only for the Blue Nile in Ethiopia, with
substantial improvement with regards to the details of domestic and irrigated water demand
projections, and the sequential inclusion of hydropower development in our time horizon until
2050. Model improvements also include climate change projections based on the regional climate
scenario HadGem2 RCP2.6 (see Collins et al., 2008; Jones et al., 2011), downscaled at the sub-
regional level to generate both climate and hydrological input for the model (for a detailed
description, see Boccalon, 2016).
RIBASIM is here only used for the upstream portion belonging to Ethiopia (and therefore
disregards any influence that projected future water use scenarios in the Ethiopian section of the
Blue Nile might have on downstream users in South Sudan, Sudan and Egypt). Although by just
simulating the Blue Nile part of Ethiopia the current version of RIBASIM only covers about 32% of
the entire surface of the country (see Figure 10), we calculate that still about 70% of the total
surface water availability is covered, so that the model fits our purposes (for the specifics of this
claim, see Boccalon, 2016).
Figure 13 Blue Nile area in Ethiopia (left, in green) and RIBASIM model schematization of surface water reservoirs and irrigation
nodes in the Blue Nile river system (right).
Based on an inventory of all existing and foreseen hydropower projects in Ethiopia, we estimate
that about 63% of the total planned domestic hydropower capacity will have been developed in
the Blue Nile river system by the time horizon of 2050. We stipulate, correspondingly, that
approximately 63% of the overall national hydro-electricity generation will emanate from the Blue

Page 69 of 122 ECN-E--18-036
Nile basin by then. By way of comparison, on the basis of existing public information, the
estimated current installed capacity at the Blue Nile basin scale only covers 24% of the total
national figure. In 2015 around 890 MW of reservoir-based hydropower capacity and 540 MW of
run-of-river-based capacity was installed in the Blue Nile river basin of Ethiopia. In scenario R1 we
assume that these numbers remain unaltered. We project that these figures are raised to 14400
MW and 750 MW in 2030 (scenario R2), and 16360 MW and 960 MW in 2050 (scenario R3),
respectively.
4.5.2 Water-energy trade-offs TIAM-ECN was employed in combination with RIBASIM to test the implications of energy
developments for water availability in Ethiopia. Two energy production scenarios were computed;
a baseline and stringent climate change control scenario. The former is a representation of what
Ethiopia's energy system may look like without the introduction of far reaching climate policy. The
latter, entitled RCP2.6 (Based on a Representative Concentration Pathway with an anthropogenic
radiative forcing of 2.6 W/m2). is a scenario in which the likelihood is high (around 70%) that the
global average atmospheric temperature increase stays below 2 degrees Celsius, including the
relevant (global) policy measures that achieve this future. TIAM-ECN provides a projection on the
optimal distribution of energy supply by technology and resource for each scenario, as depicted in
Figure 14 below.
Figure 14 Electricity supply in Ethiopia by technology and resource in two scenarios: baseline (left) and RCP2.6 (right).
RIBASIM was used to calculate the produced amount of hydropower based on projected
expansions plans of hydropower in Ethiopia. Two future climate scenarios were taken into account
for these calculations, a baseline and HadGem2 RCP2.6 climate scenario respectively. The
potential hydropower output results were compared to the hydropower outcomes depicted in
figure 1 in order to assess the feasibility of scenario-based energy supply expansion from a water
availability perspective.
Column 3 of Table 7below lists the annual average hydro-electricity generation levels (in GWh) in
2050 for the first two climate futures calculated with RIBASIM. Since the RIBASIM model
developed for this case study only covers the Blue Nile basin and thereby only 63% of the expected
hydropower capacity in 2050, we list in column 4 these numbers corrected (i.e. multiplied by a
factor 100/63) so as to reflect the full amount of hydropower likely to be produced on a national

Page 70 of 122 ECN-E--18-036
scale by then. The last column indicates the values that TIAM-ECN projects for hydro-electric
energy production by the middle of the century, for the last two climate futures.
Table 7 Main results from the RIBASIM and TIAM-ECN models for annual average hydropower generation in 2050
The first observation from Table 7 is that in the moderate climate change scenario (R5 and RCP2.6,
respectively, for RIBASIM and TIAM-ECN) the projected level of hydro-electricity generation in
2050 in RIBASIM (71,310 GWh) is substantially lower than that in TIAM-ECN (86,820 GWh). This
means in principle that the cost-optimal amount of hydropower production is higher than the
amount that we think is technically feasible from a hydrological, water balance and climate change
point of view. The discrepancy in findings with our two models can be explained, however, by the
fact that RIBASIM does not include any plants that are not yet in some stage of planning, while
opportunities exist for the inclusion of more small-scale hydropower projects.
In other words, in order to achieve the large amount of hydro-electricity production that TIAM-
ECN foresees, a capacity would need to be installed by 2050 that even goes beyond what is
foreseen in current plans and intentions (for a total of 28 surface water reservoirs and 5 run-of-
river plants). The explanation for the large amount of hydropower production projected by TIAM-
ECN is that it is the level deemed required from the model's cost-minimisation perspective in order
for Ethiopia to contribute its share in global climate change control while meeting domestic
demand for energy services.
In the negligible climate change case, we see that RIBASIM foresees an average annual hydro-
electricity generation level of 73,190 GWh in 2050, which is about 3% higher than in the moderate
climate change case. This is consistent with the observation that on average there is slightly more
precipitation on a national scale in this negligible climate change case than in the moderate
climate change case. In the enhanced climate change (that is, baseline) scenario TIAM-ECN
projects an amount of produced hydropower electricity of 66,790 GWh, which is a drop of
approximately 23% from the level calculated under the RCP2.6 scenario. This is a reflection of the
assumption that under the business-as-usual emissions pathway, little effort is undertaken in
Ethiopia, as well as on an international level, to manage global climate change.
The still sizeable level of hydro-electricity generation mostly derives from economic and
development arguments, rather than targeting specifically climate change control. The
hydropower generation levels depicted in Figure 14 Electricity supply in Ethiopia by technology
and resource in two scenarios: baseline (left) and RCP2.6 (right). are derived from installed
capacities of around 15 and 20 GW in 2050 for our two scenarios, baseline versus RCP2.6,
respectively. The capacities stipulated for RIBASIM are a little over 15 GW and close to 18 GW, for
the R2 and R3 scenarios, in 2030 and 2050, respectively. All these figures fall well within the
overall domestic potential of 45 GW as reported by national authorities in Ethiopia such as the
Ministry of Water and Energy (MWE, 2011). Our model outcomes are thus realistic from that point
of view.
The hydro-electricity generation numbers we calculated also match economically and technically
feasible hydropower capacity estimates from other analysts, as well as ambitious long-term
national electric power development plans of EEPCO, of around 30 GW in 2050 (Block & Strzepek,

Page 71 of 122 ECN-E--18-036
2012; Boccalon, 2016). The upper value of our estimates is about 10 GW below this figure of 30
GW, so in order to satisfy overall electricity demand perhaps Ethiopia does not need to reach the
total hydropower capacity level that some of its national institutions suggest today.
Policy implications
From a purely energy-cost and water-quantity point of view, our analysis may not give substantial
reason to oppose the ambitious development trajectory for hydropower in Ethiopia as currently
planned by national authorities. While we did not investigate whether the government's targets
for economic growth and welfare increase could perhaps be met with low-carbon options other
than the large-scale use of hydropower, our partial equilibrium cost-minimisation approach shows
that broad hydropower development could meet the targets without simultaneously significantly
increasing GHG emissions. A large increase in hydropower derives from the scenarios considered
in our study through both models that we employ. Our modelling efforts, however, are merely
based on an economic and hydrological approach, and thus do not account for a series of other
relevant factors, among which environmental, geopolitical and social.
Such factors may induce the Ethiopian government to take a different course and reduce its
ambitions substantially. According to the comparison of model results reported in Table 7 Main
results from the RIBASIM and TIAM-ECN models for annual average hydropower generation in
2050 we can see that Ethiopia may not be able to meet its domestic energy demand and climate
change control contributions by only relying on the intended hydropower development plans.
Based on the results of our investigation we suggest that the Ethiopian government invests more
effort into identifying an energy and water sector policy framework that meets internal demand
for electricity and water resources while complying with its commitments under the Paris
Agreement. This framework should include a broad range of renewable energy sources, energy
saving options and water use efficiencies, in order to avoid an overreliance on natural water
resources.
The scenarios investigated in our study and the level of detail used in our computations suggest
that possible future climatic trends will not substantially impact hydropower production on a
national level, even while non-negligible hydro-electricity generation reductions of around 3% may
result from climate change. Yet at the local level individual hydropower plants may be subject to
precipitation variability emanating from climate change that could lead to larger hydropower
production losses than on average nation-wide.
The large expansion of the use of hydropower as described in this paper necessitates significant
financial and human capacity investments, as well as extensive planning, institutional plus
regulatory development and capacity building. These requirements will need to be complemented
by efforts to reduce vulnerability to variability at the local level as a consequence of climate-
dependent water availability. Our hydro-electricity generation findings are consistent with those
by Block and Strzepek (2012), who report hydropower production levels between 40 and 70 TWh
in 2040e2050 under varying assumptions with regards to future climate change developments in
Ethiopia. This reinforces the reliability of our analysis, as well as our finding that on economic,
hydrological and climatic factors alone the Ethiopian government may not necessarily have to
immediately stop investing in domestic hydropower development through dedicated national
policy schemes.

Page 72 of 122 ECN-E--18-036
4.5.3 Energy-Food/Land trade offs In this section, a simple modelling approach is presented and used to assess the demands of land
and water needed to achieve a certain amount of biomass. We will look at two cases the first will
focus on the land requirements for forest biomass and the second will look at food production.
The calculations are very simple and provide not more than a first impression on whether and
which issues might be limiting or problematic. More in-depth calculations which could be
prompted by the results are possible using soil-crop models (refs). However, when going into
more detailed modelling the available data Introduction to forest biomass calculations
In this scoping study the biomass and food production levels are calculated using rudimentary
methods. It provides a fast first order of magnitude using basic information, simple conversion
factors and reasoning that can be followed and implemented by non-experts. The results provide
an order of magnitude and direction of change and If needed further exploration can be done
using more complex models which require more detailed input and expert knowledge. For more
details on crop modelling see for example van Ittersum et al. (2003). Biomass demand and implications for area and water
The first question we will address is whether the biomass needed to fulfil demand can be met by
harvesting biomass from Ethiopian forests and how much water is needed. We will focus on
Eucalyptus, which was introduced in Ethiopia in the late 19th century and is used mainly as fuel,
although some wood is used as construction material (Pohjonen, and Pukkala, 1990).
We will use a three step approach to address the question. First we will calculate the demand
second then the area needed and third the water needed to produce the amount of biomass
needed is calculated.
Step 1. Calculate Demand for wood
a) This information is provided by the energy analysis, from Figure 15we see that the
demand in 2010 is set at 1.1 EJ in 2010 and in the high biomass scenario about 1.9 EJ is derived from biomass. When converted to GigaJoules we get 1.1 109 and 1.9 109 GigaJoules/year for 2010 and 2050 respectively.
Figure 15 Biomass demand
b) To be able to determine how much biomass is needed we need to convert to kg biomass. This is done by using a conversion factor of 17 GigaJoule/ton wood (Pérez et al 2006).
0.0
0.5
1.0
1.5
2.0
2.5
2010 2020 2030 2040 2050Biom
ass d
omes
tic p
rodu
ctio
n [E
J]
Industrial waste Municipal waste Energy crops
FT diesel Ethanol from crop Biogas
Solid biomass
0.0
0.5
1.0
1.5
2.0
2.5
2010 2020 2030 2040 2050

Page 73 of 122 ECN-E--18-036
Given the results in a) we get 6.47 107 and 1.12 108 ton wood/yr for 2010 and 2050 respectively.
c) The wood density for Eucalyptus of 0.58 (ton/m3) is taken from FAO (1997). Which gives us
1.12 108 and 1.93 108 m3 wood/yr for 2010 and 2050 respectively.
So now we have both the weight and volume of wood needed in 2010 and 2050 to fulfil current
demand and the highest future demand. In forestry m3 is used to indicated productivity. So next
step is to convert the volume to the area needed.
Step 2. Area demand
a) First we need to figure out the annual production and the period or rotation the crop is
grown. From Gessesse, and Teklu (2011) we get quite a large range for Eucalyptus productivity in Ethiopia: 10 – 57 m3 wood/ha/yr. We will use both numbers for our analysis, assuming all wood is used as biofuel. Temesgen (2016) indicate that short rotations (5–10 years) for Eucalyptus plantations in Ethiopia are normal, we will assume a rotation of 7 years for our calculations. For a 7-year rotation the total volume is then 70 – 399 m3 wood/ha which. Using the results of step 1.c and a production of 70 m3 wood/ha we get 1.59 106 ha and 2.75 106 ha for 2010 and 2050 respectively. For a production of 399 m3 wood/ha this is 2.80 105 ha and 4.83 105 ha for 2010 and 2050 respectively.
b) According FAOSTAT (http://faostat.fao.org) the total forest area in Ethiopia is 1.23 107 ha.
So with 10 m3 wood/ha/yr the required areas in 2010 is about 90% of the total forest area, whereas in 2050, assuming that the forest area doesn’t change, this would require 156% of the area. So with the low productivity it would require more forest area than currently available. For a productivity of 57 m3 wood/ha/yr the 2010 area demand is 2% and in 2050 27% of the area. In fact with a productivity of around 38 m3 wood/ha/yr in 2050 the demand can be fulfilled on the total forest area.
Step 3. Water demand
The amount of water required to produce the required amount of biomass is calculated using a
water use efficiency of 1.8 kg wood/m3 of water for a normal year (Stape, et al., 2004). Stape et al.
indicate that for a wet year this conversion is 3.2 wood/m3. We will use the 1.8 kg wood/m3/yr and
assume the normal rainfall is valid for the 2010 and 2050 period, clearly with a dryer climate this
factor would go down. We know the amount of wood needed (Step 1c) and can simply determine
the amount of water needed in 2010 3.59 1010 m3 and for 2050 it would be 6.21 1010 m3 water.
Using the forest area in Ethiopia of 1.23 107 ha (FAOSTAT) as reference this amount of water
would be equal to a bit more than 500 mm per year over the forest area.
Climate Change
Impacts on the production levels via higher temp, water availability and change in abundance and
occurrence of pest and diseases is not clear. A simple approach would be to assume reduction
levels (eg: 10% 20% 50%) reduction levels in relation to possible changes. This linear relation is not
worked out. Introduction to food production calculations
The population of Ethiopia is expected to increase from 91 million in 2013 to 100 million by 2020,
120 million by 2030 and 145 million by 2050 (Ministry of Environment and Forest, 2015).
Agriculture is key sector in keeping economic growth and development in pace with the increased

Page 74 of 122 ECN-E--18-036
demand for jobs, income and food. In this section we will focus on the cereal production which for
the major share of agricultural
GDP In line with this policy aim the production and productivity of major crops is priority in the
draft Second Growth and Transformation Plan (National Planning Commission 2015).
Achieving an increase in production can be achieved by increasing the area and the output per unit
area. From we can see that the increase in cropland area has been an important strategy for decades
but since the turn of the century this strategy has become less important.
Table 8 Summaries of land use and land cover from 1975 to 1986, 1986 to 2000, and 2000 to 2014 time periods showing area
changed in hectares and percentage change (Desalegn et al., 2014)
In this section we will look at maize as a key cereal crop. Over the 2010-2014 period production
has increased from 2.5 t/ha to 3.4 or 36% (see Table 9)
Table 9 Ethiopia production levels maize 2010 – 2014 (FAOSTAT, 2016)
Year t/ha
2010 2.5
2011 2.9
2012 3.0
2013 3.3
2014 3.4
The production increase over the years has been a major achievement and is the result of a
combination of factors including improved varieties, better fertilizer use and improved farmers’
skills. Water is an important input but not likely to be the key factor for cereal production in
Ethiopia. We will show this by simple calculations using basic relations and factors. The
assumptions are not much different from those used in advanced models such as WOFOST and
CERES but require less detailed input the results are only a first rough indication. Water and nitrogen limited production
Assume an area with an annual rainfall of 500 mm which falls during the growing season. If only
50% of this water is used by the crop, 250 mm per year is transpired which is 2.5 106 litres per
years. Note that both the rainfall and transpiration of 50% are at the low end. Considering a water
use efficiency (WUE) of 200 litres of water needed for 1 kg dry matter we get a biomass
production of 12.5 t/ha/yr. Of this total biomass about 10-20% is roots, we will use 15%. So above

Page 75 of 122 ECN-E--18-036
ground biomass is 10.625 kg per year. With a harvest index or the ration of grain to the total above
ground biomass of 0.35 the harvested grain is about 3.7 t dry matter/ha/yr. If we convert to fresh
yield (as reported in Table 9) assuming a moisture content of 15% in the grains we get a yield of
4.4 t/ha/yr. Which indicates that given the assumptions there is still scope to increase production
levels.
The importance of soil organic matter in the soils for agriculture is many fold besides water
retention, anchorage the supply of nutrients, mainly nitrogen, are important. Given a topsoil of 15
cm and bulk density of 1200 kg/m3 we have a soil mass per ha of 1.8 t. Assuming 2% soil organic
matter which is, given a 0.58 conversion factor, about 1.16 % soil organic carbon. So a total of 21
ton of soil organic carbon per ha is available over 15 cm. Converting this to total carbon can be
done using 1.33 (based on Walkley and Black, 1934) gives 27 t organic carbon per ha in the topsoil.
With a CN ratio of 10 this is equal to 2.7 t N/ha/yr. This N is released during the mineralisation of
the SOM which is 2% per year, so given a growing season of 3 months about 14kg N becomes
available to the crop. Using a conversion of 55 kg grain per kg N we get a N limited yield of 764
kg/ha/yr. This number is well below the actual yields reported in Table 9 and indicate that fertilizer
is used.
The calculations show there is still scope to improve production levels. So how efficient the
fertilizer is used and whether application can be improved is for further study. Also the role of
irrigation in intensification of production system is worth exploring. By reducing risks related
erratic rainfall and expanding the growing season irrigation can be a worthwhile investment in
overall agricultural development.
4.6 Economic analysis of water-energy trade-offs To further decide on the preferred strategies to solve these trade-offs and ensure climate
resilience of investments in economic growth is required an analysis of cost-effectiveness of
alternative adaptation measures. For this analysis a quantification of the trade-offs making use of
models is necessary. We illustrate the use of the method we have developed to make the
economic analysis of trade-offs for the case of hydropower investments in the context of the
water-energy nexus.
This section aims to assess the cost-effectiveness of an adaptation measure with respect to a
climate change induced decrease in water availability in the hydropower sector of Ethiopia’s Blue
Nile. Based on modelling outcomes of the RIBASIM schematization explained in section 4.4.1
physical effects in the Blue Nile basin of Ethiopia are transformed to costs and benefits. The
valuation of water and energy shortages is performed according to their ‘total’ value, taking into
account the social dimensions of water and energy supply (see Table 10).
The monetization of physical effects allows for the construction of a Net Present Value (NPV)
analysis that has a uniform valuation mechanism across all sectors. By having a multi-sectoral
overview of the effects one can construct a NPV analysis from the perspective of different sectors.
The objective is to indicate how the NPV of an investment in adaptation to climate change varies
when multiple sectors are taken into account.
An adaptation measure should decrease the increasing vulnerability due to climate change of
Ethiopia’s WEF-system, and can be implemented in any sector. Vulnerability, according to the IPCC
(2012) definition is “the propensity of exposed elements such as human beings, their livelihoods,
and assets to suffer adverse effects when impacted by hazard events” (p.31) and “is related to

Page 76 of 122 ECN-E--18-036
predisposition, susceptibilities, fragilities, weaknesses, deficiencies, or lack of capacities that
favour adverse effects on the exposed elements” (p. 32).
The vulnerability framework below (Figure 16 Vulnerability framework (AGO, 2005)) conceptualises vulnerability as a function of exposure, sensitivity and adaptive capacity. For bearing the risk of vulnerability it is necessary to be exposed to this risk. Exposure refers to having resources located in a potentially dangerous setting, i.e. an area that is sensitive to climate variability (IPCC, 2012).
Figure 16 Vulnerability framework (AGO, 2005)
The adaptive capacity, i.e. potential adaptation measures, of a certain nation or area can be
assessed according to the vulnerability framework above. Firstly, the need for adaptive
investments is indicated by the potential impact climate change might have on a certain area.
Based on climate scenarios, which are based on future emissions, land use and demographic
trends, the exposure of a certain area/population can be computed. Relating this to the sensitivity
of a sector, exposure generates a potential impact, which can be reduced by increasing adaptive
capacity (AGO, 2005). Given the sensitivity of hydropower to climate change and dry conditions in
general, Ethiopia’s development of hydropower assets an area sensitive to droughts can be
identified as an increase in exposure.
4.6.1 Economic appraisal of resilience gains The impact of an adaptation measure is defined as the difference between vulnerability to climate
change under different options, either including or excluding an adaptation measure. Figure 17
below conceptualizes the options analysed in this study; no adaptation (x) and an increase in
adaptive capacity (y).
Figure 17 Adaptation options (Modified from AGO (2005))
Translating the impact of an adaptation measure to a general function framework gives:
𝐼𝑚𝑝𝑎𝑐𝑡𝑦 = 𝑓(𝑉𝑢𝑙𝑛𝑒𝑟𝑎𝑏𝑖𝑙𝑖𝑡𝑦𝑥) − 𝑓(𝑉𝑢𝑙𝑛𝑒𝑟𝑎𝑏𝑖𝑙𝑖𝑡𝑦𝑦)
(1)

Page 77 of 122 ECN-E--18-036
With,
𝑉𝑢𝑙𝑛𝑒𝑟𝑎𝑏𝑖𝑙𝑖𝑡𝑦𝑥 = 𝑓(𝐴𝑑𝑎𝑝𝑡𝑖𝑣𝑒 𝑐𝑎𝑝𝑎𝑐𝑖𝑡𝑦𝑥 , 𝐸𝑥𝑝𝑜𝑠𝑢𝑟𝑒, 𝑆𝑒𝑛𝑠𝑖𝑡𝑖𝑣𝑖𝑡𝑦)
(2)
𝑉𝑢𝑙𝑛𝑒𝑟𝑎𝑏𝑖𝑙𝑖𝑡𝑦𝑦 = 𝑓(𝐴𝑑𝑎𝑝𝑡𝑖𝑣𝑒 𝑐𝑎𝑝𝑎𝑐𝑖𝑡𝑦𝑦, 𝐸𝑥𝑝𝑜𝑠𝑢𝑟𝑒, 𝑆𝑒𝑛𝑠𝑖𝑡𝑖𝑣𝑖𝑡𝑦) (3)
With,
𝑓′(𝐴𝑑𝑎𝑝𝑡𝑖𝑣𝑒 𝑐𝑎𝑝𝑎𝑐𝑖𝑡𝑦) < 0
(4)
𝑓′(𝐸𝑥𝑝𝑜𝑠𝑢𝑟𝑒) > 0 (5)
𝑓′(𝑆𝑒𝑛𝑠𝑖𝑡𝑖𝑣𝑖𝑡𝑦) > 0 (6)
Besides affecting the vulnerability to climate change, adaptation measures affect other sectors.
For example, in an interdependent system, such as the water-energy-food nexus, adaptation
measures interfering with the water allocation can induce or mitigate shortages basin-wide.
Therefore, the ultimate impact of an adaptation measure will be:
𝐼𝑚𝑝𝑎𝑐𝑡 = 𝑓(𝑉𝑢𝑙𝑛𝑒𝑟𝑎𝑏𝑖𝑙𝑖𝑡𝑦𝑥) − 𝑓(𝑉𝑢𝑙𝑛𝑒𝑟𝑎𝑏𝑖𝑙𝑖𝑡𝑦𝑦) ± 𝑐𝑜𝑠𝑡𝑠/𝑏𝑒𝑛𝑒𝑓𝑖𝑡𝑠 𝑜𝑡ℎ𝑒𝑟 𝑠𝑒𝑐𝑡𝑜𝑟𝑠 (7)
For the Ethiopia case, the cost-effectiveness of a reduction in distribution losses of urban water
supply will be assessed. Hydropower output vulnerability due to climate change in 2040-2070 is
modelled including (𝑉𝑢𝑙𝑛𝑒𝑟𝑎𝑏𝑖𝑙𝑖𝑡𝑦𝑦) and excluding (𝑉𝑢𝑙𝑛𝑒𝑟𝑎𝑏𝑖𝑙𝑖𝑡𝑦𝑥) the adaptation measure.
The adaptation measure is expected to affect the water balance in the agricultural and/or
domestic water sector, represented by the difference in average water shortage in both sectors.
Altered electricity output and water shortages are valued according to their respective price,
described in table X below.
Table 10 Value of water and energy in different sectors
Sector Value in US$ (unit) Source
Hydropower 0.09 (KWh) EES (2016)
Irrigation 0.10 (m3) Hellegers & Perry (2006)
Domestic 1.00 (m3) Hellegers, Droogers & Immerzeel (2013)

Page 78 of 122 ECN-E--18-036
The acquired RIBASIM results are implemented into a CBA and discounted towards their current
value to calculate the NPV according to the format in Table 11 below.
Table 11 CBA of increasing adaptive capacity according to vulnerability framework
Year 0 Year 1 Year 2 … Year 30
Benefits
𝑓(𝑉𝑢𝑙𝑛𝑒𝑟𝑎𝑏𝑖𝑙𝑖𝑡𝑦𝑥)
− 𝑓(𝑉𝑢𝑙𝑛𝑒𝑟𝑎𝑏𝑖𝑙𝑖𝑡𝑦𝑦)
+ 𝑏𝑒𝑛𝑒𝑓𝑖𝑡𝑠 𝑖𝑛
𝑜𝑡ℎ𝑒𝑟 𝑠𝑒𝑐𝑡𝑜𝑟𝑠
𝑓(𝑉𝑢𝑙𝑛𝑒𝑟𝑎𝑏𝑖𝑙𝑖𝑡𝑦𝑥)
− 𝑓(𝑉𝑢𝑙𝑛𝑒𝑟𝑎𝑏𝑖𝑙𝑖𝑡𝑦𝑦)
+ 𝑏𝑒𝑛𝑒𝑓𝑖𝑡𝑠 𝑖𝑛
𝑜𝑡ℎ𝑒𝑟 𝑠𝑒𝑐𝑡𝑜𝑟𝑠
…
𝑓(𝑉𝑢𝑙𝑛𝑒𝑟𝑎𝑏𝑖𝑙𝑖𝑡𝑦𝑥)
− 𝑓(𝑉𝑢𝑙𝑛𝑒𝑟𝑎𝑏𝑖𝑙𝑖𝑡𝑦𝑦)
+ 𝑏𝑒𝑛𝑒𝑓𝑖𝑡𝑠 𝑖𝑛
𝑜𝑡ℎ𝑒𝑟 𝑠𝑒𝑐𝑡𝑜𝑟𝑠
Costs 𝐶0 Costs in other sectors Costs in other sectors … Costs in other sectors
Total 𝐼𝑚𝑝𝑎𝑐𝑡 𝐼𝑚𝑝𝑎𝑐𝑡 … Impact
NPV …
In order to determine if benefits outweigh costs the sum of future costs and benefits is translated
into a NPV. The NPV is calculated according to the following formula:
𝑁𝑃𝑉 = −𝐶0 + 𝐼𝑚𝑝𝑎𝑐𝑡
(1+𝑟)1 +𝐼𝑚𝑝𝑎𝑐𝑡
(1+𝑟)2 … .𝐼𝑚𝑝𝑎𝑐𝑡
(1+𝑟)30 (7)
With,
𝐶0𝑦 = 𝑈𝑝𝑓𝑟𝑜𝑛𝑡 𝑖𝑛𝑣𝑒𝑠𝑡𝑚𝑒𝑛𝑡 (8)
𝐼𝑚𝑝𝑎𝑐𝑡𝑦 = 𝑓(𝑉𝑢𝑙𝑛𝑒𝑟𝑎𝑏𝑖𝑙𝑖𝑡𝑦𝑥) − 𝑓(𝑉𝑢𝑙𝑛𝑒𝑟𝑎𝑏𝑖𝑙𝑖𝑡𝑦𝑦) ± 𝑐𝑜𝑠𝑡𝑠/𝑏𝑒𝑛𝑒𝑓𝑖𝑡𝑠 𝑜𝑡ℎ𝑒𝑟 𝑠𝑒𝑐𝑡𝑜𝑟𝑠 (9)
𝑟 = 𝐷𝑖𝑠𝑐𝑜𝑢𝑛𝑡 𝑟𝑎𝑡𝑒
(10)
The NPV will be calculated for a discount rate of 2% and 5%. With 2% indicating the long-term risk-
free return on an investment such as a U.S. treasury bill14, 5% represents a return of an Ethiopian
treasury bill.
4.6.2 Results Table 12 depicts the results, reducing distribution losses in the urban public water sector (y)
decreases annual hydropower vulnerability by 54 GWh. Besides that, the average annual urban
public water shortage is decreased by 12 MCM and agricultural shortages are unchanged.
Table 13 presents the transformation of physical effects to costs and benefits in US$. The
reduction in vulnerability through a reduction in distribution losses produces an annual benefit of
4.78 for the hydropower sector. The public water sector annually benefits 12.7 million US$ due to
decreased shortages.
14 https://www.treasury.gov/resource-center/data-chart-center/interest-rates/Pages/TextView.aspx?data=longtermrate

Page 79 of 122 ECN-E--18-036
Table 12 Average annual vulnerability and effect on other sectors of different adaptation measures
Average hydropower
output (GWh)
Average irrigation
shortage (MCM)
Average public water
shortage (MCM)
Historical climate 44121 501 6
RCP 2.6 climate 43013 250 31
Vulnerability (x) 1108
Reduce distribution losses 43067 250 19
Vulnerability (y) 1054
Table 13 Benefits/costs of different adaptation measures in millions (US$)
Hydropower Agriculture Public water Multi-sector
Reduce distribution
losses 4.78 0 12.47 17.25
Table 14 depicts the NPV analysis of a reduction in distribution losses. Costs of reducing
distribution losses in the urban public water sector are based on a study by Droogers, Butterfield &
Dyszynski (2009), who analysed adaptation options for the hydropower sector in Kenya. Improved
urban water consumption in Kenya was modelled as a reduction in supply from 14 m3 to 10 m3
(28%) per capita per year and increased consumption from 30% to 40%. Costs of this adaptation
measure were estimated at US$ 10 per capita. The urban population in this case study is estimated
at 25,336 million, therefore costs are determined at 253.37 million US$. 10 US$ per capita can be
considered an upper bound estimate since the water supply in this analysis is improved by 25%
instead of 28%. Changes in consumption depend on the reduction in shortages per location as
computed by RIBASIM.
Table 14 NPV of reducing urban distribution losses in millions (US$)
Year 0 Year 1 Year 2 … Year 30
Benefits 17.25 17.25 17.25
Costs (253.37) 0 0 … 0
NPV (2%) 133.64
NPV (5%) 12.27
IRR 5.42%
The NPV is positive for both discount rates and has an internal rate of return (IRR) of 5.42%.

Page 80 of 122 ECN-E--18-036
4.6.3 Business case Table 15 below shows the computation of the NPV of a reduction in distribution losses from the
perspective of different sectors, based on the investment costs of Table 14 and benefits of Table
13 Table 15 reveals a negative discount rate for investing in a reduction in distribution losses solely
from the perspective of the hydropower sector. The NPV from the public water sector (PWS)
perspective is dependent on the discount rate. Below or above 2.72% will generate a positive or
negative NPV respectively. From a multi-sector perspective, the NPV is positive for both discount
rates since the IRR amounts to 5.42%.
Table 15 NPV of reducing distribution losses for different sectors in millions (US$)
Hydro-sector
NPV (2%) -146.31
PWS-sector
NPV (2%) 25.91
Multi-sector
NPV (2%) 133.64
Hydro-sector
NPV (5%) -179.89
PWS-sector
NPV(5%) -61.68
Multi-sector
NPV (5%) 12.27
Hydro-sector
IRR -3.35%
PWS-sector
IRR 2.72%
Multi-sector
IRR 5.42%
This result illustrates that the business case of an adaptation measure can be positively influenced
by taking into account the effects related to other sectors. For a 5% discount rate, the NPV of
benefits is 73.48 and 191.69 million US$ for the hydro- and PWS-sector respectively. Given the
costs of 253.37 million US$, no sector would be interested in investing in this measure due to a
negative return. However, combining both benefits gives a positive NPV of 12.27 million US$.
Therefore, distributing costs in such a manner that the NPV remains positive for both parties, i.e.
costs <191.69 million US$ and <73.48 million US$ for the hydro- and PWS sector respectively,
totaling at least 253.37, would imply a profitable business case.
Table 15illustrates that an unviable financing scheme for a single-sector investment can be turned
viable by including payments from other sectors based on the share of benefits received by that
sector. This can facilitate investment in adaptation, potentially improving the response to the
future adaptation burden.
Increasing investment in adaptation measures in Ethiopia is needed in Ethiopia. For example,
Bosello et al. (2011) indicate that the largest share of the global adaptation burden will be carried
by developing countries. Besides that, the AfDB (2011) states that “Africa is arguably the most
vulnerable region in the world to the impacts of climate change” (p.2).
For Africa, adaptation costs are estimated between 20-30 billion US$ per annum over the next 10
to 20 years. In 2011, only 350 million US$ had been allocated to spending on adaptation in Africa.
The remaining financing gap is characterised as the adaptation deficit. Scarce funding
opportunities induce a quest for adaptation solutions that maximize benefits and minimize costs
(ECA, 2009). Multi-sectoral financing arrangements can help closing this gap.
4.7 Trade-offs in the water-energy-food nexus In the case study presented presented in the previous section the Ribasim-Tiam models were
employed to analyse the interdependencies between the two sectors at the national level in
Ethiopia and to identify potential trade-offs and synergies. Two scenarios were developed to

Page 81 of 122 ECN-E--18-036
analyse whether the water sector can meet the rapidly growing demand for water for hydro
electricity production: the baseline scenario for which no far reaching climate policy is assumed;
and the RCP2.6 scenario which assumes a stringent climate policy in which the likelihood is high
that the global average atmospheric temperature increase stays below 2 degrees Celsius.
The model analysis revealed that as a result of high population and economic growth rates, the
electricity demand in the baseline scenario will grow to a level of approximately 66.7 GWh in 2050.
Under the RCP2.6 scenario electricity demand will even further increase to a level of 86.8 GWh in
the same year. The analysis showed that the amount of water needed to meet this high level of
demand can be supplied without compromising water claims from other users such as irrigation
and domestic water use.
This is true irrespective of possible negative hydrological impacts as a result of climate change
induced decreased average precipitation nation-wide. Whether the Ethiopian government should
pursue its ambitious hydro power development plan however also depends on environmental,
geopolitical and social factors that are not included in this quantitative analysis. The main
conclusion which can be drawn from the Tiam-Ribasim analysis is that at the national level future
water availability will not impose a constraint on future water demand for hydropower production
and other water use categories. However, at the regional level the situation could be very different
with local shortages occurring in regions with low rainfall. Also rainfall variability is expected to
increase due to climate change.
The energy analysis conducted with the Tiam model also provided projections for the amount of
biomass (firewood for households and biomass for electricity production) needed in 2050. In the
RCP2.6 scenario the demand for biomass is expected to increase from 1.1 EJ in the base year 2010
to 1.9 EJ in 2050. This is equal to 64.7 million ton and 112 million ton wood per year for 2010 and
2050, respectively. Subsequent analysis with the Water-limited Crop model model reveals that,
assuming a sustainable yield of 10m3 per ha, 19.3 million ha of forest land is needed in 2050 to be
able to produce this amount of wood in a sustainable way. Currently available forest area in
Ethiopia is 12.3 million ha so clearly there is a trade-off between land use and energy.
The amount of water required to produce the required amount of biomass is estimated to be
6,210 million m3 per year. Based on a forest area of 12.3 million ha, this amount of water would
be equal to some 500 mm rainfall per year. The highest average annual rainfall of over 2,400 mm
is in the south-western highlands of the Oromia Region. The lowest amount of rainfall of about
600 mm is in the north in areas bordering Eritrea, and it drops to less than 100 mm in the north-
east in the Afar. Therefore, in most regions rainfall will be enough to produce the required amount
of biomass and therefore no competition is expected in Ethiopia between the water sector and
forest land.
Finally, the model exercise shows that there still is ample scope to improve food (maize)
production necessary to feed the fast growing population in Ethiopia which will reach 145 million
in 2050. More importantly, this food production growth will not need considerable amounts of
water and therefore is not expected to constrain water demands from other users.
In summary, the quantitative analysis using the Tiam-Ribasim-Water-limited Crop model set shows
that at the national level in Ethiopia the only significant trade- off concerns the biomass
production(land use) needed for the energy sector. Table 16 presents an overview of the analysed
interactions.

Page 82 of 122 ECN-E--18-036
Table 16 Critical links between the water-energy and food sectors at the national level in Ethiopia
Water Energy Food/landuse
Water X not critical not critical
Energy not critical X not critical
Food/land use not critical critical X
Ethiopia is one of the largest countries of Sub-Sahara Africa with large differences among the
various regions in rainfall amount, soil quality, topography, altitude, water hydrology, energy
resources and demographic factors. This means that the conclusions drawn at the national level
may be unsuitable at the regional level. In fact, the RIBASIM analysis for the Blue Nile area
revealed that local water shortages will occur and can lead to conflicting claims for water use by
different water users. To analyse more in detail the WEF nexus in a particular region, a second
case study was conducted in the Humera region in Northern Ethiopia. The methodology and
findings of the Humera case study are presented in a separate report15.
15 Report on the Nexus Humera case study in Ethiopia

Page 83 of 122 ECN-E--18-036
5. Towards the solution: conclusions from the
Nexus analysis
This final chapter aims to summarize the main findings of the research results presented in this
report and to draw conclusions and recommendations as to how the trade-offs between the
water, energy and food sectors can become synergies. This provides the basis for addressing the
criticism on the nexus approach expressed in the literature. Finally, an evaluation of the
conceptual modelling framework is presented along with research gaps that still need to be dealt
with.
5.1 Introduction The Bonn 2011 nexus Conference created a strong momentum behind the water, energy and food
security nexus concept that aims to integrate management and governance of these resources
across the three sectors. The rapidly increasing demand for water, energy and food calls for a
more cross sectoral approach that takes into account the interdependencies between these
sectors. This can significantly improve the efficiency and effectiveness of policy measures and can
contribute to achieving more development with less resources and environmental pressure.
Six years after the Bonn nexus Conference, the nexus philosophy has gained more significance and
is now higher on the political agenda. The climate dimension has been brought in to the original
WEF nexus framework and the adoption of the Sustainable Development Goals has broadened the
scope to include other relevant sectors such as health, ecosystems, infrastructure and
industrialization, sustainable consumption and production and poverty.
A considerable amount of nexus-related research has been conducted during the past six years,
mostly focusing on the development of the WEF nexus concept. Only few studies have been
published so far that aim to quantify the interdependencies between the WEF sectors and to
identify and evaluate potential trade-offs and synergies. The present study aims to partly fill this
gap by applying the WEF framework to case study Ethiopia.
The literature review presented in Chapter 2 provides the basis from which the conceptual and
methodological framework for the WEF nexus could be developed. This framework is presented
in chapter 3 and entails an in depth analysis of the interdependencies between the WEF sectors, a
definition of the system boundaries and the formulation of the key steps of the nexus approach.
In Chapter 4 the nexus conceptual and modelling framework has been applied to Ethiopia. Firstly,
based on the methodological approached developed we assessed in depth the key development
challenges of Ethiopia, its policy agenda and how this translate into important intersectoral claims

Page 84 of 122 ECN-E--18-036
now and in the future, as well as how these will be affected by Climate Change. Departing from
the key claims identified we zoom and making use of the trade-offs - already identified through
the literature review (Chapter 2) and summarized as a matrix (Annex C) and depicted as Causal
Loop Diagrams (Annex D)- we analysed in depth critical linkages and interdependencies between
the three sectors, the specific trade-offs and dilemmas faced by Ethiopia and potential points of
leverage and synergies that should be taken into consideration in the formulation of Climate Smart
Strategies.
Secondly Ribasim/Tiam/Water-limited crop model set was used to quantify the interactions
between the sectors and to evaluate long- term integrated demand and supply strategies across
the WEF sectors. Until the present study these sector models were used by the consortium
partners to analyse sector specific strategies. In the present study these models have been soft
linked to create a powerful model package that enables a detailed analysis of the consequences of
policy measures taken in one sector on the other sectors. Last but not least, an economic
appraisal of alternative adaptation options to solve water-energy trade-offs in the face of Climate
Change is undertaken.
The complexity of the water, energy, food nexus approach makes stakeholder participation
essential. Engaging the key stakeholders from the onset greatly enhances the quality and
legitimacy of the model results and also improves the chance of informing decision making.
Through raising awareness and creating stakeholder buy –in the implementation of the proposed
changes through concrete projects can be facilitated. In Chapter 4 the stakeholder analysis forms
a key component of the nexus framework.
The analysis conducted at the national level of Ethiopia provided deeper insights into the extent to
which water, energy and food resource availability is sufficient to meet long-term demand for
these resources. However, Ethiopia is among the largest countries by area in sub-sahara Africa and
the regional conditions could be very different from the national totals. Therefore, as a separate
activity, a second case study on the WEF nexus has been conducted in the Humera district in
northern Ethiopia. The results of this regional case study are presented in a separate document.16
5.2 Most significant trade-offs and leverage points By applying the methodological and modelling Nexus framework to Ethiopia as explained above,
we can come to a list of more important trade-offs faced by Ethiopia in their goal to achieve
sustainable economic development in the face of Climate Change. Taking these dilemma’s as
central in our analysis of leverage points we have also identified relevant Climate Smart Solutions
and Strategies for the country. These findings are summarized below:
5.2.1 Water and food security Water used for agriculture cannot be used for domestic purposes (WASH). Ethiopia’s policy
objective is to expand crop production by 50% and nearly double the area of land equipped with
irrigation schemes. Irrigation schemes allow for a more evenly distributed consumption of water
resources, leading to a higher water footprint.
Furthermore, a surge in livestock is expected to meet higher meat demand, which is notorious for
its high water footprint. Extracting additional water resources for agriculture will have
consequences for the overall surface and groundwater balance. Therefore, system-wide cascading
16 Report on the Nexus Humera case study in Ethiopia.

Page 85 of 122 ECN-E--18-036
effects of water use in one location need to take into account other beneficiaries of water
resources.
Agriculture is the largest driver of deforestation- which can lead to deterioration in groundwater
recharge capacity and water quality; threatening in the long term water and food security itself.
Population growth and growth in food demand is expected to drive an increase in total agricultural
land which leads to an increase in the annual deforestation rate, a reduction of natural ecosystem
and a degradation of ecosystems health. Poor ecosystem health of river systems translates into
reduced river discharges and yearly water supply, and therefore higher water stress levels.
A way to limit the expansion of agricultural land would be to increase the yield per crop field.
However this would require the intensive use of pesticides and fertilisers and impact water quality
through run-off and nitrate pollution. Moreover, domestic fertilizer production expected to double
by 2020, is also expected to increase significantly water demand.
Important mechanisms that drive system performance are the two important reinforcing loops
with Ecosystems Health as departure point could become vicious cycles that deteriorate
exponentially the water stress challenge and/or virtuous cycles that lead to an exponential
increase of water supply. Ecosystem Health affects river discharge levels and water quality, both of
which define water supply. Limited water supply and stress often means that environmental flows
are not ensured and that Ecosystem Health is further deteriorated. Ecosystem Health not only
plays a role in water supply within normal conditions but also contributes to the resilience of
landscapes and the reduction of economic and crop production losses in extreme dry/wet years.
This seems all in all to be a leverage point of the system. Therefore is not surprising that reduction
of deforestation rates is the focus of the work of many NGOs and governmental campaigns around
the world.
Technological and policy measures that could trigger improvements in food production, without
activating these negative side effects on water security. Options are: a) Conservation and Climate
Smart Agriculture techniques that while increasing average yield, limit or revert deforestation
rates and reduce production losses due to extreme weather events. b) Improvements in soil
nutrient levels, seed quality and/or irrigation systems that impact positively food production by
increasing average yield and/or water productivity without affecting water quality. And last but
not least, reforms to agricultural and water rights that create the incentives for farmers to invest
in more efficient irrigation systems and other measures to reduce evotranspiration.
5.2.2 Water and energy security Hydropower production requires large volumes of water to be stored. Water consumed through
reservoir evaporation cannot be used elsewhere. Furthermore, water quality is affected due to
higher temperatures and an altered sediment regime, which can result in levels unfit for drinking.
An important aspect between these two sectors relates to the impact of increasing share of
renewables on water and food security: the impact of large dams. A significant increase in
hydropower generation aiming at a higher share of renewables in the total energy mix and an
increase in access to modern energy sources; can be detrimental for the achievement of other
SDG’s if the choice is made for larger size dams. Large size dams given the large extensions of land
they require for their construction, as well as the disturbances they create on rivers; may have
considerable negative effects on: a) Forest cover – due to upstream deforestation; b) percentage
of children malnourished due to both a loss in annual crop production through agricultural land
and annual fish production through a reduction of fish migration flows. c) Last but not least, the

Page 86 of 122 ECN-E--18-036
disturbance of river ecosystems results often in a significant increase of waterborne diseases. Risk
mitigation measures could be: implementation of multi-use reservoirs and landscape and
ecosystem management measures.
Last but not least, continued dependence on traditional biomass energy resources will increase
demand due to population growth. Sustaining existing forests and additional on-farm production
of biomass resources leads to a higher water footprint of around 500 mm rainfall per year (section
4.7), which can be met by precipitation levels in various regions in Ethiopia. However, a trade-off
arises when this water use conflicts with other demands. Unsustainable yield from existing forests
leads to deforestation, potentially impeding water quality and recharge.
Synergies can be achieved through the (further) development of Ethiopia’s vast potential of
renewable energy resources, in particular solar energy, biomass and geothermal energy. This
would positively affect the energy sector (diversification of supply), the food sector (electricity
supply for the agriculture sector) and the water sector(less hydro power production needed thus
water can be used for other users).
5.2.3 Energy and food security To finalize important trade-offs between energy and food security are: - Land determined for on-farm biofuel production cannot be used for agricultural purposes and
vice-versa. Quantative analysis revealed that for sustainable yield levels an additional 7 million ha of land needed for wood production in 2050 (section 4.7).
- Dung used for cooking cannot be used for fertilization and vice-versa. - Agricultural modernisation and development of an agro-industrial sector drive up energy
demand, leading to conflict with other energy users.
Potential measures to create synergy between energy and food security objectives are:
Solar powered water pumping for irrigation can improve agricultural yields and is considered as a
basic strategy to alleviate poverty and improve food security. Modern irrigation systems are based
on diesel or electric driven water pumping systems. However, solar powered water pumping is
becoming increasingly interesting because the sharp decline in costs of solar PV. Solar pumping
replaces diesel and/or electricity and thus may reduce CO2 emissions. .
Biofuel production from non-food crops. Currently, Ethiopia has to import all its oil requirements
which account for more than 80% of its export earnings. The country has high potential for biofuel
production. To reduce the financial burden on the national budget and create employment and
income the government is pursuing a biofuel development strategy focused on the production of
ethanol from sugar beet and sugar cane and the production of biodiesel from Jatropha and castor
bean plants Despite its high potential, currently the biofuel sector is still underdeveloped. This is
mainly due to lack of a conducive regulatory framework and high production costs. However, the
growing concerns about climate change and the rapidly increasing global energy demand lead to
renewed interest in biofuels that are derived from renewable sources. Non-food biofuel
feedstock may create synergies between energy and food security objectives provided that the
cultivation of land for energy crops does not lead to completion for cropland. .
Introduction of afforestation and deforestation policies. To combat the high deforestation rate
the Ethiopian government has developed and implemented afforestation and reforestation
policies. These policies involve farm land and community tree planting programmes and
rehabilitation and creation of productive forest land that aim to improve local livelihoods, to
reduce total water consumption through evapotranspiration and to increase fuelwood availability.

Page 87 of 122 ECN-E--18-036
These measures create synergies between the energy (increase in wood supply), water (reduced
evaporation) and food(reduced erosion) security objectives.
Accelerated introduction of improved cook stoves: current wood demand in Ethiopia is
unsustainable and results in high deforestation rates. The accelerated dissemination of improved
cook stoves among especially rural households aims to address this problem by using wood more
efficiently. This could reduce deforestation and land degradation but would also positively affect
indoor air pollution which causes adverse health effects. This therefore is a good example of
creating synergy between the energy (reduced demand for woodfuel), land use (reduced land
degradation) and health (reduced indoor air pollution) objectives.
5.3 How to create synergies between the WEF sectors: reaching WEF security
The sections above illustrate that expanding the size of one sector can generate a trade-off due to
multiple sectors being dependent on the same resource. Therefore, achieving a particular sectoral
policy goal can be at the detriment of another. The significance and size of a trade-off depends on
the availability of the resource(s) for which a conflicting demand has arisen.
Integrated inter-sectoral policy making is required in order to detect trade-offs and minimise their
materialization. This does not imply that trade-offs can be prevented, since competing demands
are inherent to the fixed endowment of the overall WEF-nexus, i.e. no additional land, water and
energy sources can be created within the confines of Ethiopia. However, increasing the efficiency
of resource use needed for reaching one policy goal can free up resources for another one.
Furthermore, inter-sectoral interdependencies as illustrated by the CLDs in Appendix D should be
taken into account when policy goals are determined. A single-sectoral approach that aims to
maximise the development of each sector leads to disregard for system-wide consequences of
resource use implied by reaching a policy target.
Furthermore, the allocation of limited (public) resources through policy should be based on the
marginal benefits generated by each policy target. For example, the societal benefit of allocating
water to meat production might be lower than providing WASH access for subsistence.
The multi-scale approach we have developed and tested for the Ethiopia for analysis of nexus
trade-off can be used either by donors, multilaterals to analyse and test at national and local level
whether certain sectoral investments being planned are Climate Smart and advance the synergetic
achievement of water-food and energy related SDG’s. The methodological approach developed
and illustrated for the case of Ethiopia can also support governments in the generation of
alternative solutions and changes in the design of these projects so that future nexus stresses and
vulnerabilities are reduced to a minimum.
5.4 Addressing the criticism on the nexus approach Based on our analysis of the water-energy-food nexus we can reflect in the criticisms raised in
section 2.2 and explain our we have dealt with them through the design of our conceptual and
modelling framework.
Is the basic problem, the ‘scarcity of resources’ not a political issue which cannot be solved in a
technological or managerial way?

Page 88 of 122 ECN-E--18-036
We deal with this criticism by using the leverage points of Meadows (2007) which explicitly
acknowledge the limitation of technological solutions alone and encourage the identification of
alternative Climate Smart Strategies that make use of more powerful leverage points such as: the
structure of information flows (who does and does not have access to information), The rules of
the system (such as incentives, punishments, constraints) or the power to add, change, evolve, or
self-organize system structure.
It should be acknowledge that to apply these more powerful and structural solutions to the nexus
problem will remain a significant institutional challenge, as it may require a challenge of the status
quo and current allocation of power. These aspects were outside the scope of our study. We have
developed an approach for the nexus that focus on identification of problems and trade-off and
does not go in detail on the strategies for implementation. However, current power imbalances
may limit even the process of identification and framing of nexus problems,
Is the nexus approach not too optimistic about investment, innovation and ingenuity?
The criticism here is that the nexus promotors follow an optimistic view where limits can be
overcome through investment, innovation and ingenuity, driven by even more sophisticated
technologies. This criticism may be true to a certain extent, but (also in developing countries)
there is still much space and need for implementation of new technologies, innovations and
investments. Downplaying environmental externalities, such as biodiversity and climate change
are, however, serious threats.
We deal with this criticism by adopting an ample approach in the study of the nexus , which places
as central issue the achievement of the SGD’s and in this way the situation of the most vulnerable
groups of society.
Are we not hiding the bigger debate?
It may be true to a certain extent that the nexus is hiding the bigger debate about resource
inequality. However, when you take the principles and areas of opportunities as formulated in
Hoff (2011) – see above - seriously, the outcome should not differ much from the situation critical
scientists such as Allouche et al. (2015) would wish. The practical situation is hard: there are
differences in (economic) power, knowledge, organizations, networks and lack of learning and
communication. This demands a good strategy and stubborn but flexible efforts to implement a
nexus approach.
We partly deal with this criticism by applying the leverage points perspective, which explicitly
acknowledge that far more effective than a mere change in parameters (e.g. by technological
solutions) are measures that a) introduce a change in the rules of the system (such as incentives,
punishments, constraints); b) change existing power to add and change hold by stakeholders and
allow for the system to evolve or self-organize itself in a more organic way; or even changes that
enable societies to transcend present paradigms. Again as noted above, current power
imbalances may limit this process of identification of more effective leverage points.
Is integration of the food, water, energy and climate change sectors really possible? How can we
assure integration of sectors on an equal footing?
Hoff (2011) recognizes that “there is no blueprint for overcoming institutional disconnect and
power imbalances between sectors, e.g. blue and green water generally falling under different
ministries, or energy often having a stronger voice than water or environment, indicating that the
nexus may not be traded-off equally. “

Page 89 of 122 ECN-E--18-036
What seems to be new in the nexus concept is the more active interest and involvement of the
private sector. In the business world, the awareness is growing that resources are becoming
scarcer and that problems of scarcity of resources should be considered from a plural perspective.
In many local and regional multi-stakeholder processes for example to promote governance of
natural resources (water, forests etc.) in a certain region or area, the private sector, although an
important stakeholder with considerable influence on the local situation, was absent. In the nexus
approach the private sector shows interest and commitment. This is an important and positive
development, an opportunity.
We deal with this point by undertaking a stakeholder analysis and liking the policy objectives and
outcomes of interest with the responsible government agency; and going further into analysing
and pointing out the conflicts and trade-offs between these policy goals. Also further in the local
case study realized in Humera, we deal with this criticism by making use of collaborative modelling
techniques, such as the Nexus game; and designing the process of interaction with stakeholders
during our first and second mission in such a way that engagement and collaboration between
these different government authorities and the breaking of silos is encouraged.
5.5 Methodological findings
5.5.1 Operationalization of the methodological framework Adopting a systems analysis approach for analysing the WEF-nexus reveals potential conflicts in
achieving multiple development objectives simultaneously, by showing bottlenecks in terms of
resource claims and linking it to dependent policy objectives. Furthermore, adopting the system
analysis approach allows one to distinguish between future constraining conditions due to climatic
or socio-economic drivers, which can influence the desired adaptation approach, e.g. by reacting
to climate pressures or by steering towards a more climate-resilient socio-economic development
path.
By undertaking a in depth analysis of the WEF system, key interpedencies between the water-food
– energy sectors we enable the explicit formulation of key policy dilemmas, which helps to
elucidate the specific conflicting points and trade-offs faced by a country in their endavour to
achieve food, water and energy security along with the desired economic growth that is key for
the achievement of other SDG’s . This process also helps to formulate problem definitions that are
clear and helpful for the search of climate smart strategies; strategies that are effective in the long
term and deal with the root causes of Ethiopia development and environmental challenges and
that have the potential to solve the trade-offs or to create additional synergies within the nexus.
5.5.2 Quantitative analysis by soft-linking water and energy models The results obtained through our cross-validation of TIAM-ECN and RIBASIM model outputs show
that we have identified an approach that can be used for the multi-sectoral assessment of energy
and water policies and for the inspection of the compatibility between them. Yet our analysis has
focused mainly on the quantitative aspects of hydropower development and water resources
management. The actual success of hydropower expansion at the national level against
concomitant growth of agricultural and domestic water needs will not only be dependent on
technical feasibility, but likewise on the technical and managerial capacity of operators to ensure
an optimal distribution of resources across users and time. It will also depend on the government's
ability to ensure the institutional support and financing needed for maintaining the water supply
system.

Page 90 of 122 ECN-E--18-036
One of the primary aims of this study was to test the possibility of soft-linking energy and water
sector modelling tools so as to provide practical instruments for analysis of energy-water nexus
challenges and constraints. Through a number of joint input assumptions we enabled the results of
our models to be contrasted to each other, even while they followed distinct approaches.
By soft-linking these two models we determine what the cost-optimal level of hydropower
generation could be under baseline and stringent climate change control regimes, and investigate
whether these production levels are realistic from a hydrological and water balance point of view
and may be imperilled by the adverse impacts on water supply from average climate change
effects as well as expected increases in water demand from domestic and agricultural sectors.
Through our two approaches we project a high level of hydropower generation in Ethiopia:
between 71 and 87 TWh/yr by 2050 in a stringent climate change control scenario in which the
country contributes substantially to global efforts to reach the 2 C target fixed in the Paris
Agreement (COP-21, 2015). On the basis of the dimensions addressed by our two models energy
system costs, national hydrological features and average climate factors one may be tempted to
argue that it makes sense for Ethiopia to pursue its current ambitious hydropower development
plan. Other issues, however, that are beyond our confined scope need to be considered for such
reasoning to hold.
5.5.3 Economic analysis of multisector adaptation investments The vulnerability framework has proven to be a useful aid in conceptualizing the temporal
evolution of vulnerability. By categorizing potential impact according to driving (exposure,
sensitivity) and mitigating (adaptive capacity) factors it is possible to establish a baseline
conceptualization describing the interaction between a system and climate change Subsequently,
practical detail regarding the dynamics of vulnerability development can be added by linking
economic, demographic and meteorological parameters to the categorizations. For example,
economic growth leads to energy demand, which spurs hydropower development, representing an
increase in exposure.
Transforming the arrangement of categorizations and accompanying parameters into a functional
form allows for distinguishing between different options aimed at mitigating future vulnerability.
Boiling down the dynamics of climate change vulnerability to equation (16) below allows one to
envision the objective and possible pathways to achieve it. The objective is to reduce vulnerability trough adaptation (y) compared to the baseline situation (x), i.e. when 𝐼𝑚𝑝𝑎𝑐𝑡𝑦 > 0, according to
equation 17.
𝑉𝑢𝑙𝑛𝑒𝑟𝑎𝑏𝑖𝑙𝑖𝑡𝑦𝑥,𝑦 = 𝑓(𝐴𝑑𝑎𝑝𝑡𝑖𝑣𝑒 𝑐𝑎𝑝𝑎𝑐𝑖𝑡𝑦𝑥,𝑦,𝑧, 𝐸𝑥𝑝𝑜𝑠𝑢𝑟𝑒𝑥,𝑦,𝑧, 𝑆𝑒𝑛𝑠𝑖𝑡𝑖𝑣𝑖𝑡𝑦)
(16)
𝐼𝑚𝑝𝑎𝑐𝑡𝑦 = 𝑓(𝑉𝑢𝑙𝑛𝑒𝑟𝑎𝑏𝑖𝑙𝑖𝑡𝑦𝑥) − 𝑓(𝑉𝑢𝑙𝑛𝑒𝑟𝑎𝑏𝑖𝑙𝑖𝑡𝑦𝑦)
(17)
𝐼𝑚𝑝𝑎𝑐𝑡𝑦 = 𝑓(𝑉𝑢𝑙𝑛𝑒𝑟𝑎𝑏𝑖𝑙𝑖𝑡𝑦𝑥) − 𝑓(𝑉𝑢𝑙𝑛𝑒𝑟𝑎𝑏𝑖𝑙𝑖𝑡𝑦𝑦) ± 𝑐𝑜𝑠𝑡𝑠/𝑏𝑒𝑛𝑒𝑓𝑖𝑡𝑠 𝑜𝑡ℎ𝑒𝑟 𝑠𝑒𝑐𝑡𝑜𝑟𝑠
(18)
Besides that, by expanding equation (16) with the effects in other sectors (see equation (18)) and
integrating it into an NPV analysis, one can demonstrate what ‘taking the WEF nexus into account’
means for investment planning in climate change adaptation. Augmenting the business case of an

Page 91 of 122 ECN-E--18-036
adaptation measure with effects from other sectors can improve overall financial viability when
vulnerability to climate change decreases basin-wide. Distributing investment costs proportional
to expected benefits can transcend sector borders and thereby stimulate implementation of
adaptation measures.
5.6 Research and innovation gaps The most important research and innovations gaps identified are the following.
Firstly, our nexus approach guide the identification of trade-offs between sectors; for which
solution you will require collaboration between different sectors. The key question that remains is
how, once you have identified the problem and the needs for collaboration, you can effectively
drive these sectors to work together. Important governance questions are how to create the
conditions under which cross-sector coordination and collaboration takes place. Which fact-base
and incentives are required to make these collaboration platforms evolve from “discussion
platforms” to an implementing workgroup with a clear work plan and procedures for resolution of
these trade-offs.
In addition to the technical aspects of the WEF nexus, the institutional nexus frame work is equally
important. The institutional structure should be built in such a way that it can support the
adoption of technical nexus solutions. Cross-sectoral coordination and collaboration is essential
and should be fostered through suitable institutional structures. This however is not always
evident because of the imbalance in political power between the sectors. More research therefore
is needed to analyze the institutional aspects of the nexus approach to ensure effective
implementation of the nexus solutions.
Secondly, further research is required on how to “define the nexus” in a specific context. A sound
analysis is needed to draw a clear line about what needs to remain and dealt by sectoral agencies,
and what needs to be managed in nexus collaboration. In our research we have advanced this
goal by defining a method to identify the most important intersectoral claims. Nevertheless to
bring this method towards a mature structured process that is universally applicable for the
definition of this context-specific balance of issues to deal with by the silos versus issues that
require nexus collaboration will require the application of the methodology in many more cases in
different regions and at different scales.
Based in our findings we advise that in the definition of this balance one does not limit itself to
the World-Energy-Food nexus, but following a problem oriented search one defines what needs to
be dealt with in collaboration and what nots. This may translate in some places to only water-
energy, while in others may even require the consideration of Land and Marine Ecosystems.
Although the water-energy food security nexus currently forms the core of the nexus research,
interactions with other sectors may also be important. An obvious example is climate change
which in interlinked to the WEF sectors through changing weather patterns that could result in
floods and droughts. But other sectors such as health, sustainable consumption and production,
infrastructure and industrialization and cities may also affect the WEF sectors. Further research is
needed to investigate if and under what conditions critical links exist beyond the WEF. This is
especially relevant for the SDG framework which comprises 17 goals and 169 related targets that
have many interconnections. To identify those links that really affect the system helps to
formulate integrated policies that reduce the trade-offs and create synergies

Page 92 of 122 ECN-E--18-036
Thirdly, another related methodological question that remains is on how to decide which
approach to use when and at which institutional and geographical scale. More specifically how
should the landscape and the IWRM approaches collaborate and/or link with the nexus approach.
In our research the Nexus approach turned out effective to identify trade-offs and solution
directions at the national and regional level; but a further detailing of these solutions and their
implementation requires the consideration of more institutional and governance issues such as
water rights. It may be that IWRM and the landscape approach are better equipped to deal with
these issues given their bottom-up nature; or that these issues need to be solved per sector.
Again by applying the nexus methodology developed in many more cases one could test these
boundaries.
Fourthly, should the approach developed and tested at the local scale (Humera) for the analysis of
important investments – in our case a large Agro-Industry park- become a standard part of pre-
feasibility studies? How identifying future bottlenecks in terms of resource use triggered by the
investment project early in the process could inform and serve a better project design and the
definition of the management and commercial business cases of these investments. In other
words, how this analysis could inform and inspire the design of alternative business models and
structuring of deals in such a way that these trade-offs are internalized and managed by a single
public or private entity.
Last but not least, we recommend further work on the sharpening of analytical and modelling
tools for the identification, reporting and evaluation of trade-offs. Whether we go for a single
integrated model or soft linking of sectoral models; two key constraints for the quantification of
these trade-offs are: availability of good quality data and of standards definitions and metrics
common to the sectors covered by the nexus. Further work on these two constraints is essential
to advance in the analysis and solution of nexus challenges.
The modelling package, comprising the Ribasim/Tiam/water-limited yield models, proved a very
useful tool to analyse the implications of an intervention in one sector for the other sectors.
However, the three models were originally developed to mathematically describe one particular
sector only and were not designed to also take into account the interactions with the other
sectors. This means that for the present study the three models were ‘soft-linked’ to analyse the
nexus implications; output from one model was manually entered as input for the other models. a
pending question given the two key constraints defined above is if these models could be
physically integrated so that intervention in one sector is automatically taken into account in the
other sector. And how this integration could enable the identification of optimal solutions across
the three sectors simultaneously.

Page 93 of 122 ECN-E--18-036
References
AfDB (2011) The cost of adaptation to climate change in Africa. Tunis, TN: African Development Bank
(AfDB).
Alcamo, J., Flörke, M., & Märker, M. (2007). Future long-term changes in global water resources
driven by socio-economic and climatic changes.Hydrological Sciences Journal, 52(2), 247-275.
Allouche, J., C. Middleton and D. Gyawali, 2015. Technical veil, hidden politics: Interrogating the
power linkages behind the nexus. Water Alternatives 8(1): 610- 626
Australian Greenhouse Office (2005). Climate Change Risk and Vulnerability: Promoting an efficient
adaptation response in Australia. Final report. Report to the Australian Government, Department of
the Environment and Heritage by the Allen Consulting Group. Available
at: http://www.sfrpc.com/Climate%20Change/4.pdf.
AQUASTAT - FAO's Information System on Water and Agriculture . (2018). Fao.org. Retrieved 29
January 2018, from http://www.fao.org/nr/water/aquastat/countries_regions/ETH/
Biggs, E. M., Bruce, E., Boruff, B., Duncan, J. M., Horsley, J., Pauli, N., ... & Haworth, B. (2015).
Sustainable development and the water–energy–food nexus: A perspective on
livelihoods. Environmental Science & Policy, 54, 389-397.
Block, P., & Strzepek, K. (2012). Power ahead: meeting Ethiopia's energy needs under a changing
climate. Review of development economics, 16(3), 476-488.
Bosello, F., Carraro, C., & De Cian, E. (2010). Climate policy and the optimal balance between
mitigation, adaptation and unavoided damage. Climate Change Economics, 1(02), 71-92.
Carter, N. T., & Campbell, R. J. (2009, June). Water issues of concentrating solar power (CSP)
electricity in the US Southwest. Congressional Research Service, Library of Congress.
Cole, M. A., Elliott, R. J., & Strobl, E. (2014). Climate Change, Hydro-Dependency, and the African
Dam Boom. World Development, 60, 84-98.
Desalegn, T., Cruz, F., Kindu, M., Turrión, M. B., & Gonzálo, J. (2014). Land-use/land-cover (LULC)
change and socioeconomic conditions of local community in the central highlands of Ethiopia.

Page 94 of 122 ECN-E--18-036
International Journal of Sustainable Development & World Ecology, 21(5), 406–413.
http://doi.org/10.1080/13504509.2014.961181
Droogers, P., Butterfield, R., & Dyszynski, J. (2009). Climate change and hydropower, impact and
adaptation costs: case study Kenya. FutureWater Report, 85.
ECA (2009). Shaping Climate-resilient Development a framework for decision-making. A report of
the economics of climate Adaptation working group. Economics of Climate Adaptation.
Ethiopia Energy Situation (EES) (2016). Energypedia.info. Retrieved 28 September 2016, from
https://energypedia.info/wiki/Ethiopia_Energy_Situation#Wind_Energy
FAO, 1997. Estimating Biomass and Biomass Change of Tropical Forests: a Primer. (FAO Forestry
Paper - 134) http://www.fao.org/docrep/w4095e/w4095e0c.htm
FAO, 2014. The Water-Energy-Food Nexus: A new approach in support of food security and
sustainable agriculture. FAO, Rome, Italy 28 pp.
Federal Democratic Republic of Ethiopia (FDRE) (2014) Ethiopia’s Climate-Resilient Green Economy,
Climate Resilience Strategy: Agriculture and Forestry. Retreived 15 August 2016, from:
http://www.agcrge.info/files/Vision/CRGE.pdf
Federal Democratic Republic of Ethiopia (FDRE) (2015) Ethiopia’s Climate-Resilient Green Economy,
Climate Resilience Strategy: Water and Energy. Retreived 15 August 2016, from: http://gggi.org/wp-
content/uploads/2015/08/2015-08-10-FINAL-CR-Strategy-Water-and-Energy.compressed.pdf
Federal Democratic Republic of Ethiopia (FDRE) (2016) Growth and Transformation Plan II (GTP II)
Retreived 15 August 2016,
from:https://europa.eu/capacity4dev/resilience_ethiopia/document/growth-and-transformation-
plan-ii-gtp-ii-201516-201920
Ferroukhi, R., Nagpal, D., Lopez-Peña, A., Hodges, T., Mohtar, R., Daher, B., & Keulertz, M. (2015).
Renewable energy in the water, energy, and food nexus.
Fuka, D. R., & Easton, Z. M. (2016). Climate change in the Blue Nile Basin Ethiopia: implications for
water resources and sediment transport. Climatic Change, 139(2), 229-243.Walkley, A. and I. A.
Black. (1934). An examination of Degtjareff method for determining soil organic matter and a
proposed modification of the chromic acid titration method. Soil Sci. 37:29-37.
Gebreegziabher, Z., Stage, J., Mekonnen, A., & Alemu, A. (2011). Climate change and the Ethiopian
economy: A computable general equilibrium analysis.
Geissler S.,Hagauer D., Horst A., Krause M., Sutcliffe P. (2013) Biomass Energy Strategy Ethiopia,
Retreived 15 August 2016, from:
http://www.eueipdf.org/sites/default/files/field_publication_file/Ethiopia_Biomass_Energy_Strat
egy_and_Action_Plan_Final_2014_02_06.pdf
Gerbens-Leenes, W., Hoekstra, A. Y., & van der Meer, T. H. (2009). The water footprint of
bioenergy. Proceedings of the National Academy of Sciences, 106(25), 10219-10223.

Page 95 of 122 ECN-E--18-036
Gessesse, D., & Teklu, E. (2011). Eucalyptus in East Africa, socio-economic and environmental
issues. Planted forests and trees working papers.
Hellegers, P. & Perry, C. J. (2006). Can irrigation water use be guided by market forces? Theory and
practice. Water resources development, 22(1), 79-86.
Hellegers, P., Immerzeel, W., & Droogers, P. (2013). Economic concepts to address future water
supply–demand imbalances in Iran, Morocco and Saudi Arabia. Journal of Hydrology, 502, 62-67
Hoff, H. (2011). Understanding the nexus: Background paper for the Bonn2011 Nexus Conference:
the water, energy and food security nexus. Stockholm, Stockholm Environment Institute.
IPCC (2012): Managing the Risks of Extreme Events and Disasters to Advance Climate Change
Adaptation.A Special Report of Working Groups I and II of the Intergovernmental Panel on Climate
Change [Field, C.B., V. Barros, T.F. Stocker, D. Qin, D.J. Dokken, K.L. Ebi, M.D. Mastrandrea, K.J. Mach,
G.-K. Plattner, S.K. Allen, M. Tignor, and P.M. Midgley (eds.)]. Cambridge University Press,
Cambridge, UK, and New York, NY, USA, 582 pp.
Keppo, B.C.C. van der Zwaan (2012), The impact of uncertainty in climate targets and CO2 storage availability on long-term emissions abatement, Environ. Model. Assess. 17 (1/2) 177e191.
Kober T., B.C.C. van der Zwaan, H. Ro€sler (2014), Emission certificate trade and costs under regional burden-sharing regimes for a 2 C climate change control target, Clim. Change Econ. 5 (1) 1e32, 1440001. Loulou R., M. Labriet (2008) ETSAP-TIAM: the TIMES integrated assessment model, Part I: model structure, Comput. Manag. Sci. 5 (1e2) 7e40. Loulou R., (2008) ETSAP-TIAM: the TIMES integrated assessment model, Part II: mathematical formulation, Comput. Manag. Sci. 5 (1e2) 41e66 McSweeney, C., Lizcano, G., New, M., & Lu, X. (2010). The UNDP Climate Change Country Profiles:
Improving the accessibility of observed and projected climate information for studies of climate
change in developing countries.Bulletin of the American Meteorological Society, 91(2), 157-166
Meadows, D. (2007). Leverage points: places to intervene in a system. Hartland: The Sustainability Institute. Retrieved.
Mekonnen, M. M., & Hoekstra, A. Y. (2012). A global assessment of the water footprint of farm
animal products. Ecosystems, 15(3), 401-415.
Ministry of Environment and Forest (2015). Second National Communication to the United Nations
Framework Convention on Climate Change(UNFCCC). The Federal Democratic Republic of Ethiopia.
Mondal, M. A. H., Bryan, E., Ringler, C., & Rosegrant, M. (2017). Ethiopian power sector
development: Renewable based universal electricity access and export strategies. Renewable and
Sustainable Energy Reviews, 75, 11-20.
Mukheibir, P. (2007). Possible climate change impacts on large hydroelectricity schemes in Southern
Africa. Journal of Energy in Southern Africa, 18(1), 4-9.

Page 96 of 122 ECN-E--18-036
Neary, D. G., Ice, G. G., & Jackson, C. R. (2009). Linkages between forest soils and water quality and
quantity. Forest ecology and management, 258(10), 2269-2281.
O'Keefe, P., Westgate, K., & Wisner, B. (1976). Taking the naturalness out of natural
disasters. Nature, 260, 566-567
Pérez, S., Renedo, C. J., Ortiz, A., Mañana, M., & Silió, D. (2006). Comparison of Energy Potential of
the Eucalyptus Globulus and the Eucalyptus Nitens.
http://www.icrepq.com/icrepq06/285%20Perez.pdf
Rapport, D. J., Fyfe, W. S., Costanza, R., Spiegel, J., Yassie, A., Bohm, G. M., ... & Horwitz, P. (2001).
Ecosystem health: definitions, assessment and case studies. Our Fragile World: Challenges and
Opportunities for Sustainable Development. EOLSS, Oxford, 21-42.
Robinson, S., Strzepek, K., & Cervigni, R. (2013). „The Cost of Adapting to Climate Change in Ethiopia:
Sector-Wise and Macro-Economic Estimates‟.Ethiopia Strategy Support Program II (ESSP) working
Paper, 53.
Rodriguez, Diego J.; Delgado, Anna; DeLaquil, Pat; Sohns, Antonia. (2013). Thirsty energy. Water
papers. Washington DC ; World Bank. Wagena, M. B., Sommerlot, A., Abiy, A. Z., Collick, A. S.,
Langan, S.,
Roesler R., B.C.C. van der Zwaan, I.J. Keppo, J.J.C. Bruggink (2014), Electricity versus hydrogen for passenger cars under stringent climate change control, Sustain. Energy Technol.
Assessments 5 106e118
Stape, J. L., Binkley, D., Ryan, M. G., & Gomes, A. N. (2004). Water use, water limitation, and water
use efficiency in a Eucalyptus plantation. Bosque.
Syri S., A. Lehtila, T. Ekholm, I. Savolainen, H. Holttinen, E. Peltola, (2008) Global energy and
emissions scenarios for effective climate change mitigation e deterministic and stochastic
scenarios with the TIAM model, Int. J. Greenh. Gas Control 2 (2) 274e285.
Temesgen, D., Gonzálo, J., & Turrión, M. B. (2016). Effects of short-rotation Eucalyptus plantations
on soil quality attributes in highly acidic soils of the central highlands of Ethiopia. Soil Use and
Management, 32(2), 210–219. http://doi.org/10.1111/sum.12257
Thissen, W. A., & Walker, W. E. (2013). Public Policy Analysis. springer.
Van der Laan, A. (2015), Leapfrogging in the African Power Sector: the Effect of Mitigation
Policies on Regional African Power Sector Development, Master Thesis Energy Science, Utrecht
University/ECN
Van der Zwaan, B.C.C. I.J. Keppo, F. Johnsson (2013a) How to decarbonize the transport sector?
Energy Policy 61 562e573.
Van der Zwaan, B.C.C., H. Ro€sler, T. Kober, T. Aboumahboub, K.V. Calvin, D.E.H.J. Gernaat, G.
Marangoni, D.L. McCollum (2013b), A cross-model comparison of global long-term technology
diffusion under a 2 C climate change control target, Clim. Change Econ. 4 (4) 1e24.

Page 97 of 122 ECN-E--18-036
Van der Zwaan, B.C.C. , T. Kober, S. Calderon, L. Clarke, K. Daenzer, A. Kitous, M. Labriet, A.F.P.
Lucena, C. Octaviano, N. Di Sbroiavacca (2016b), Energy technology roll-out for climate change
mitigation: a multi-model study for Latin America, Energy Econ. 56 526e542
Van Ittersum, M. K., Leffelaar, P., van Keulen, H., Kropff, M., Bastiaans, L., & Goudriaan, J. (2003).
On approaches and applications of the Wageningen crop models. European Journal of Agronomy,
18, 201–234.
Pohjonen, V., & Pukkala, T. (1990). Eucalyptus globulus in Ethiopian forestry. Forest Ecology and
Management, 36(1), 19–31. http://doi.org/10.1016/0378-1127(90)90061-F
Van Keulen H. and N.G. Seligman, (1987) Simulation of Water Use, Nitrogen Nutrition and Growth
of a Spring Wheat Crop. Simulation Monographs, Pudoc, Wageningen. 310 pp.
Vanloqueren, G. and Ph.V. Baret, 2009. How agricultural research systems shape a technological
regime that develops genetic engineering but locks out agroecological innovations. Research Policy
38 (2009) 971-983
Vörösmarty, C. J., Green, P., Salisbury, J., & Lammers, R. B. (2000). Global water resources:
vulnerability from climate change and population growth. Science, 289(5477), 284-288.
York, R., & Gossard, M. H. (2004). Cross-national meat and fish consumption: exploring the effects
of modernization and ecological context. Ecological economics, 48(3), 293-302.

Page 98 of 122 ECN-E--18-036
Appendices
Appendix A: SDG targets and proxies
Appendix B: production processes of each sector
Appendix C: Matrix, Food, Water, water, Energy and Climate Change
Appendix D: Causal loop diagrams of key trade-offs and synergies
Appendix E: Identifying leverage points
Appendix F: Results from the Group Model Building sessions of them Nexus research team
Appendix G: Nexus development table
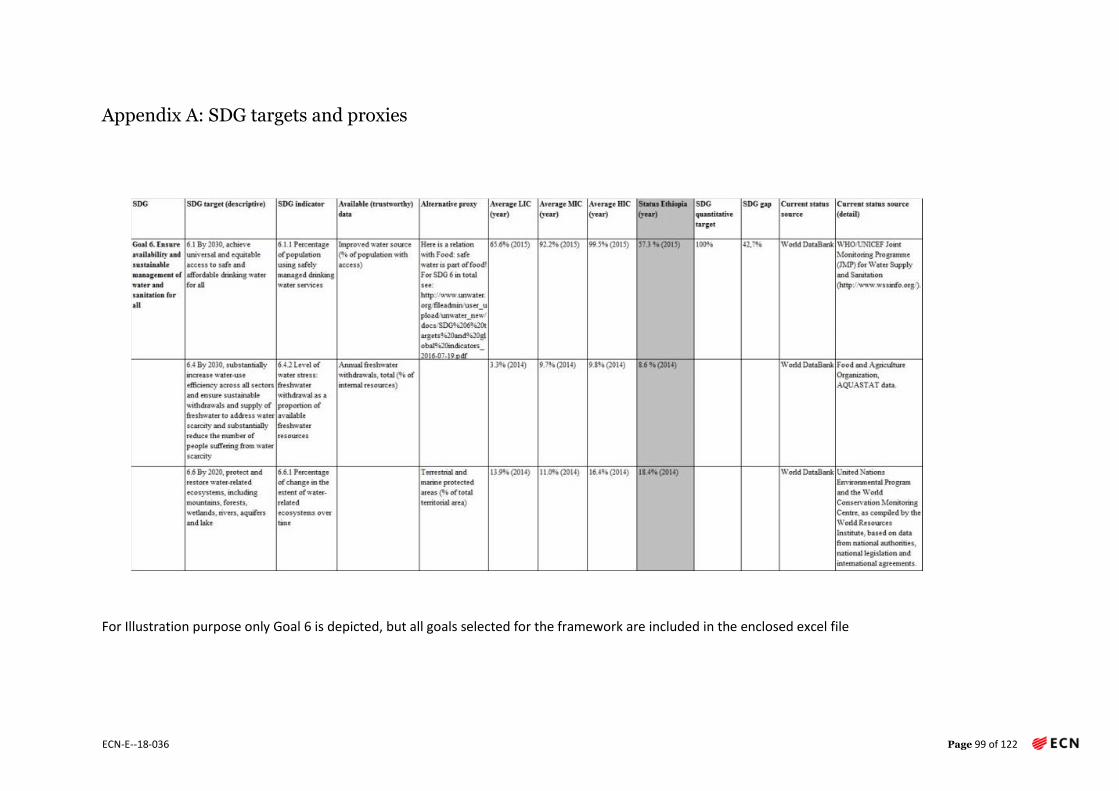
Page 99 of 122 ECN-E--18-036
Appendix A: SDG targets and proxies
For Illustration purpose only Goal 6 is depicted, but all goals selected for the framework are included in the enclosed excel file

Page 100 of 122 ECN-E--18-036
Appendix B: production processes of each sector requiring input from other sectors
WATER demand and supply
ENERGY production – WATER demand
WATER production –ENERGY demand
Water Demand
(ranked high-
low)
Water Production and Supply
Availability (ranked high-low)
1. Agriculture 2. Population 3. Industry 4. Ecosystems
1. Surface water extraction - River discharge - Drainage - Storage volume
2. Groundwater extraction - Pumping capacity - Storage volume - Aquifer recharge
3. Re-use (waste water treatment) - Capacity of waste
water treatment 4. Rain harvesting (rain-fed)
- Precipitation rate 5. Desalinisation
- Capacity of desalinisation
Energy Production and Supply
(ranked high-low)
Water needed
for
1. Hydropower generation 2. Energy plants (gas, coal,
nuclear, ..) 3. Energy drilling and
fracking 4. Solar energy plants 5. Biofuel production
1. Processing 2. Cooling
Water Production and
Supply (ranked high-low) Energy needed for
1. Surface water 2. Groundwater
extraction 3. Re-use (waste water
treatment) 4. Rain harvesting 5. Desalinisation
1. Pumping 2. Transport /
distribution 3. Filtering / waste
water treatment 4. Desalinisation
production

Page 101 of 122 ECN-E--18-036
ENERGY production – FOOD demand
Energy Production and Supply
(ranked high-low) Food needed for
Bio fuel • Processing
• Land required for biofuel crop production
• Land required for energy generation installations: solar, wind
FOOD demand and supply
Food Demand
(ranked high-low)
Food Production and
Supply -> Availability
(ranked high-low)
By population
• Total food demand
• Demand for high quality crops
• Agricultural areas
• Green houses
• Aquaculture
• Livestock
• Tree crops
• Grassland
• Fisheries
• Hunting
ENERGY demand and supply
Energy Demand
(ranked high-
low)
Energy Production and Supply
-> Availability (ranked high-
low)
1. Households 2. Industry 3. Transport 4. Commercial 5. Other
sectors
1. Fossil Energy plants (gas, coal,.)
2. Hydropower generation 3. Solar energy plants 4. Biofuel production (incl.
biodigester) 5. Wind energy 6. geothermal energy 7. wave energy 8. nuclear energy
FOOD production - WATER demand
Food Production and Supply (ranked
high-low) Water needed for
1. Agriculture
1. Irrigation 2. Fertilizers
production 3. Processing 4. Water for
animals 5. Water as habitat
for fish
FOOD production - ENERGY demand

Page 102 of 122 ECN-E--18-036
Food Production and Supply (ranked
high-low) Energy needed for
1. Agriculture
1. Food production harvesting
2. Processing / packaging
3. Transport 4. Storage and
cooling 5. Cooking of food

Page 103 of 122 ECN-E--18-036
Appendix C: Matrix Food, Water, Energy and Climate Change Sources:
• Bellfield, H. 2015. Water, energy and food security nexus in Latin America and the Caribbean. Global Canopy programme, 57 pp. ;
• The World Economic Forum Water Initiative, 2011. Water security: the water-food-energy-climate nexus, Island Press Washington, Covelo, London 248 pp
• Hoff, 2011
• IRENA, 2015
• Wright et al., 2015
• FAO, 2012
• Extended
These trade-offs have been clustered and represented graphically by a number of causal loop diagrams (appendix D), in which the numbers given to each trade-off
mentioned in this table are referred to so as to make the connection easier for the reader.

Page 104 of 122 ECN-E--18-036
Water and energy (water for energy)
Trade-offs Additional impact of Climate change on
the trade-off
Possible impact of
the trade-off on
climate change
Possible impact of trade-off on
ecosystems, or relation with
natural ecosystems
Synergies or measures to decrease the mentioned trade-off
(1)
Hydropower reservoirs can have
significant evaporative losses. So
the question is: Water use for
generating hydropower versus the
use for other purposes. Large
hydropower dams are controversial
because of potentially serious
ecological and social damage
• Future drier conditions may increase competition for water and result in more periods of low hydro-energy production.
• Drier conditions may increase evaporation of surface water.
• Emission of methane from (artificial) hydro-lakes/ reservoirs. Methane is a very strong greenhouse gas
• Hydropower lakes occupy land and lead to loss of ecosystems.
• Possible water-borne diseases
• Dam changes the river ecosystem and is an obstacle for fish migration.
• Upstream the hydro dam, it is important to apply good landscape and ecosystem management in order to avoid erosion on the land and siltation in the lake.
• Coupled water-energy systems
• Investing in infrastructure
• Reforming subsidies
• Land use and water use planning
• environmental impact assessment (EIA and SEA), and measures also to limit evaporation.
• Multi-use reservoirs.
•
(2)
Energy drilling (gaz, oi) and
fracking: pollution of water (Niger
Delta, Gulf of Mexico, etc.)
changing water quality or
temperature
• Climate change may result in even warmer water. Warmer, polluted water may be a bigger threat to health.
• Fossil fuel drilling and production continues the process of using fossil fuels and of emission of CO2
Pollution of water and/or
increased water temperature
lead to (generally negative)
changes in ecosystems
• environmental impact assessment (EIA and SEA), and measures
• Land and water use planning
• Energy policy which does not only focus on fossil fuels.
• Use brackish or other marginal water
• Increase transmission capacity
(3)
Thermal and nuclear power plants:
use of (much) cooling water which
also results in heating of surface
water.
• Warmer climate may make temperature of natural waters still higher. Elevated water and air temperatures reduce the efficiency of power plant generation.
• Increased numerous and intense floods in areas close to energy plants can cause severe harm to
• Thermal power plants produce much CO2
Increased water temperature
lead to (generally negative)
changes in water ecosystems
• Use cooling water for heating houses or other purposes.
• Switch from water cooling to air cooling, or other techniques. Coastal power plants do not use fresh water.
• Use of renewable energy; market wind-energy as zero-water, rather than just a low-carbon alternative.
• Switching from wet to dry cooling at thermoelectric power plants

Page 105 of 122 ECN-E--18-036
power production and energy delivery infrastructure. Fuel transport by rail and barge may be interrupted more frequently.
• Electricity transmission is less efficient with higher air temperatures, weakening the capacity of grid infrastructure.
• More hot weather events (caused by climate change) may lead to soaring energy demand for air conditioners and to seasonal scarcity of water for cooling the power plants.
(4)
Recent switch to growing feedstock
as first-generation biofuels, often
with generous governmental
subsidies, has an upward pressure
on water use in agriculture.
Biofuels are substantially more
water intensive than fossil fuels.
• Climate change induced drought will increase competition between biofuel crops and other water users for clean sweet water
• Climate change discussion may push biofuel crops even more
• Higher CO2 in the air increases crop growth
First-generation
biofuels were
intended to
diminish
greenhouse gas
emissions (by using
less fossil fuels), but
the debate about
whether this is true,
is fierce.
Biofuel production is also land-
intensive. Cultivation of crops
for biofuel leads to conversion
of forests and other natural
ecosystems to agricultural
monocultures (e.g. oil palm
plantations).
• Use only second-generation biofuels
• Use sustainable sources of energy (solar, wind, etc.)
• Plant biofuel producing crops on abandoned agricultural land (which is not competing for water with food production) – this solution has its limitations.
• Only use crop residues for biofuel (when not used already for other purposes)
(5)
In the value chain from raw
materials (like oil, coal, gas and
biofuels) to transformation into
energy, much water is used.
• Climate change may cause more extreme events like droughts. In dry periods there may not be enough water to transform raw materials into energy
Fossil fuels produce
much CO2
Use of extra water is often at
the expense of natural
ecosystems like wetlands and
rivers.
• Integrated water policy
• Water productivity in ethanol processing has increased by 30% in the first decade of the 21st century.
• Recycling-reuse of this water
(6)
The concentrated solar thermal
plant, one form of solar energy
Climate change may cause more extreme
events like droughts. In dry periods there
Use of extra water is often at
the expense of natural
• Concentrated solar thermal plants should be planned in relation to a water policy

Page 106 of 122 ECN-E--18-036
generation, uses relatively large
quantities of water in relation to
other renewable alternatives.
may not be enough water to provide this
plant with water
ecosystems like wetlands and
rivers.
Water and energy (energy for water)
Trade-offs Additional impact of Climate change
on the trade-off
Possible impact of
the trade-off on
climate change
Possible impact of trade-off on
ecosystems, or relation with
natural ecosystems
Synergies or measures to decrease the mentioned trade-off
(7)
Energy is used in the provision of
water services. Energy is used for
lifting, moving distributing and
treating water. It is necessary for
pumping water for domestic use,
irrigation and/or water
management. Energy used to
deliver water over long distances or
great elevations is very energy-
intensive. Especially in rural areas
energy provision may be scarce.
In drier conditions (caused by climate
change) more water should be pumped
up (from deeper depths). This costs
more energy and may reduce the water
table in an unsustainable way.
Using fossil energy
increases carbon
emissions.
• Using fossil energy increases pollutants in air and sometimes in water. These pollutants may enter ecosystems so that these produce less products (or polluted products) and less services.
• To a certain extent natural ecosystems can purify polluted water.
• Use pumps which consume renewable energy
• Groundwater supply, on average requires about 30% more electricity on a unit basis than does surface water. So use surface water if acceptable.
• Use water as efficiently as possible (also final consumers)
• Increase energy reliability by decreasing electricity gaps for pumping irrigation water (so you do not leave pumps on all the time).
• By improving the productivity of rain fed agriculture, energy intensive irrigation can be limited or reduced.
• New storage and conveyance of water to serve new demands
• Watershed management
(8)
Energy is used in treatment of
wastewater
Using fossil energy
increases carbon
emissions.
Using fossil energy increases
pollutants in air and sometimes
in water.
• Energy recovery from wastewater can reduce the energy demand in the treatment plant, or even allow an excess of energy to the power grid.
•
(9)
Energy is used for desalinisation
(50% in MENA region: Middle East
and North Africa)
• Climate change causes a higher sea level, which results in more lands and waters with salinization problems.
Using fossil energy
increases carbon
emissions.
Using fossil energy increases
pollutants in air and sometimes
in water.
• Shift from fossil fuels to renewable energy for desalinisation.
• Desalinisation of brackish water requires less energy than seawater desalinisation. Some regions have large reservoirs of brackish water.
• Make agriculture (and other water using activities) more water efficient so that more fresh water remains and less salinization occurs.

Page 107 of 122 ECN-E--18-036
Water and food security
Trade-offs Additional impact of Climate change
on the trade-off
Possible impact of
the trade-off on
climate change
Possible impact of trade-off on
ecosystems, or relation with
natural ecosystems
Synergies or measures to decrease the mentioned trade-off
(10)
Food production is the largest user
of water at the global level. Water
for agriculture or (irrigation) is
often at the expense of its use for
domestic use (towns, cities, but
also at household level in farms).
To feed ourselves the world will
need to double food production in
the next 40 years to meet the
projected demand (more people
and more demanding diets). So
even more water will be needed for
agriculture.
• Future drier conditions may increase competition for water.
It may lead to more tensions
between city and rural area for
water.
• Longer drier periods because of climate change need more water storage capacity for surface water;
• Long-term storage of water via groundwater and glaciers are at risk with climate change.
• In certain areas increased flooding may lead to more harvest losses.
Expansion of area for
food production is
generating more
GHG/kg product and
will cost more water
/kg product than
intensification on
already cultivated
land
More competition for water
will also be at the expense of
natural ecosystems like
wetlands.
• Improvement in rain-fed agriculture, reducing land degradation and rehabilitation of degraded land can reduce pressure on (blue17) water and land.
• Efficient irrigation systems, water storage measures (and other techniques)with sufficient storing capacity
• Drought-tolerant crops, salinity-resistant crops
• Improved nutrient status of the soil.
• Reduce unproductive evaporation from the soil (e.g. mulching)
• Water use management, drainage
• Integrated stress management
• Many other climate-smart agricultural techniques
• Reforms to agricultural water rights and price incentives
• Agricultural research and development
• Reduction of losses of crops and in the food chain (especially in developing countries): less water needed for production
• Shifts in consumer behaviour, e.g. from red meat to poultry generally increases water productivity in the food sector.
• “virtual water trade”
(10)
Agriculture is the largest driver of
deforestation, which threatens
water security
More extreme rainfall events (droughts
and or excessive rainfall) are expected
threatening food production
• Deforestation leads to substantial CO2
emission.
• Deforestation is a direct threat to biodiversity.
• Deforested landscapes generally are less resilient to extremes, like extreme weather events.
• Land and water use planning
• Forest governance, management and protection of forests
• Measures in agricultural sector so that it produces more with less land and water.
• Agricultural research and development
• Switching from use of freshwater to wastewater
• Increasing water use efficiency
• Modernising agriculture operations through application of improved practices.
17 Blue water: water in rivers, lakes or aquifers that is available for irrigation, municipal and industrial uses; Green water: water in the soil that comes directly from rainfall.

Page 108 of 122 ECN-E--18-036
(11)
Intensive use of pesticides and
fertilisers to improve agricultural
yields impact water quality through
run-off (result: grey water from
nitrate pollution)
Warmer, polluted water
• For production of fertilisers much energy is needed, which results in more CO2 emission.
Polluted water is a threat to
natural water ecosystems:
rivers, but also coastal and
marine systems.
• Enforcing mechanism for compliance with rules
• Agricultural research and development
Trade-offs Additional impact of Climate change
on the trade-off
Possible impact of
the trade-off on
climate change
Possible impact of trade-off on
ecosystems, or relation with
natural ecosystems
Synergies or measures to decrease the mentioned trade-off
(12)
Biofuels: land, water, nutrients for
biofuels at the expense of food
crops
More CO2 increases crop growth;
higher temperature increases crop
growth in some (Netherlands,
Mongolia, ..) and decreases crop growth
in other countries (mainly Africa);
•
If poor farmers are deprived of
their land because the land is
used for biofuel production,
they may over-exploit natural
areas in order to get their food
(wild animals, herbs, fruit from
the forest).
• Investing in agricultural waste as a source of biofuels (second generation biofuels)
• Biofuels on marginal agricultural lands?
• Certification of biofuels on sustainable production
• Lower the expectation (e.g. in EU) of biofuels as a solution for making energy production sustainable
• Nitrogen-fixing leguminous trees like Gliricidia sepium can at the same time be used to add nitrogen and organic matter to the soil and can dramatically increase crop yields. At the same time, by pollarding the trees regularly, leaves can be used as fodder while the branches are used as feedstock for electrical power generation.
• ‘Solar sharing’: Production (in Japan) of crops and solar energy simultaneously. Rows of PV panels mopunted above ground and arranged at certain intervalsto allow enough sunlight for photosynthesis and space for agricultural machuinery to be used.
• Using waste or marginal land for biofuels
(13)
Use of dung for cooking
(traditional) and not for fertilisation
of agricultural lands
Climate change makes some areas
unsuitable for livestock --> no dung
available
Burning dung and fuel
wood release GHG
and is bad for human
health.
• Improved stoves
• Sustainable production of fuelwood
• Solar cooking
• Solar energy production
• Use dung for biogas production and the remaining slurry for fertilisation of land.

Page 109 of 122 ECN-E--18-036
In most African
countries burning
dung/fuel wood is
major contributor to
GHG emissions--> to
be avoided
(14)
Hydro-power reservoirs may
occupy land that is needed for food
production.
• Provide sustainable alternatives for affected communities
Energy and food security (energy for food production)
Trade-offs Additional impact of Climate change
on the trade-off
Possible impact of
the trade-off on
climate change
Possible impact of trade-off on
ecosystems, or relation with
natural ecosystems
Synergies or measures to decrease the mentioned trade-off
(15)
Mechanisation and other
modernisation measures helped to
increase yields and make
agricultural labour more bearable.
But energy inputs have increased
significantly.
Droughts may reduce window for
planting hence more tractors needed at
the same time
Changing from oxen
traction to
mechanisation may
have a net benefit for
greenhouse gas
emissions
Mechanisation allows for more
area to be cultivated per
household--> conversion of
natural areas in crop fields is
likely to occur
• More efficient energy use (cutting fertiliser overuse, more precise application of fertiliser, nitrogen fixing, compost etc.)
• More renewables
• Improved access to sustainable forms of energy
• Reconsider subsidies in the agro-sector for fertilisers, electricity, gas.
• Integrated multi-use systems (e.g. crop-livestock or agro-forestry)
•
(15)
Energy is required for the entire
food system: food production,
harvesting, transport, processing,
packaging, and marketing. The full
food production and supply chain is
Climate change may increase distance
between food production and food
consumption areas (e.g. food needs to
be imported in areas that lost
productive power due to droughts or
floods) leading to more energy
idem
Traditional use of fuelwood for
artisanal processing of food
(e.g. tempeh and tofu
production in Indonesia) may
lead to overexploitation of
forests and land degradation.
• Systems to measure ecological footprint of products and to communicate the results
• Reduce post-harvest losses and losses in the value chain and at consumer’s level.
• Milk cooling devices using solar energy are available.
• Biogas can be used to process food (e.g. tofu and tempeh production in Indonesia)

Page 110 of 122 ECN-E--18-036
responsible for around 30% of total
global energy demand.
demands and larger amounts of GHG
emissions related to transport and or
the need to process food for storage or
less food security
(16)
Developed countries use about 35
gigajoules per person per year for
food and agriculture (nearly half in
processing and distribution).
Developing countries use only 8
gigajoules per person per year
(nearly half for cooking). For proper
development of the agricultural
sector in developing countries,
more energy is needed at the right
place, especially for fertilisers,
processing, storage and transport
Intensification of
agriculture requires
more energy (inputs)
but will still lead to
lower GHG
emissions/kg food
• Agricultural planning and energy planning should be
coordinated.
(17)
In several energy programs
(traditional) fuelwood for cooking is
being replaced by modern energy
sources.
If the modern energy
source is fossil , then
the nett CO2 emission
may increase, leading
to more greenhouse
effect.
Stress on natural resources
(trees and shrubs) will diminish
if fuelwood is replaced by other
energy sources. This is positive
and there is also an opportunity
and a need to use the shrubs
and trees in an alternative way.
• Planning of the use of natural resources and of land use
Water, energy & food security
Trade-offs Additional impact of Climate
change on the trade-off
Possible impact of the
trade-off on climate
change
Possible impact of trade-off on
ecosystems, or relation with
natural ecosystems
Synergies or measures to decrease the mentioned trade-off

Page 111 of 122 ECN-E--18-036
Intensification of agriculture dd
Intensification of
agriculture requires more
energy (inputs) but will still
lead to lower GHG
emissions/kg food and
lower water use/kg food
produced
• Good landscape planning will help to conserve biodiversity and secure long-term provision of environmental services by (semi-) natural ecosystems.
• Natural wetlands can serve as water storage facilities so they are important water management tools.
• Giving more space to river systems in order to cope better with extreme situations, is also a measure that can be beneficial for nature.
• Improvements in rain fed agriculture and reducing land degradation and rehabilitating degraded land can significantly reduce pressure on (blue) water and land.
• Integrated production of food, feed and biofuels can enable recycling of residues and waste products. (e.g. biogas from agricultural waste, crop residues for feed)
• Integrated planning across the nexus, involving also city and spatial planning, environmental protection and forestry.
General
The average water supply-demand
imbalance is expected to become
critical in much of eastern,
southern, central and western
Asia, in much of Africa and the
Middle east, in Southern Europe,
the American Southwest, Mexico,
the Andean region, and north-
eastern Brazil by 2020/2030.
Intensification of
agriculture requires more
energy (inputs) but will still
lead to lower GHG
emissions/kg food and
lower water use/kg food
produced
• Employment outside agriculture to generate money to increase access to food
• Food aid
• Drought relief measures like control of migration and internal and external conflict.
• Strategies that apply physical, policy, and financial tools.

Page 112 of 122 ECN-E--18-036
Appendix D: Causal Loop Diagrams of Key Trade-offs and Synergies
CLD 1: Food and Water Security (Trade-offs 10, 12, 15, and 16)
.
Total fooddemand
percentage of soilswith
erosion/degradation(%)
Water quality(nutrients/pollutantconcentrations -
ppm)
% of foodproduction
wasted
Population
+
Interruptions insupply (goal:
none)
Hunger (#months there is
enoughfood/year) (goal:
12)
E conomic losses /damage caused bywater disasters
Riverdischarge
(m3/second)
E nergy used forfood
tranportation,storage and
cooling (GWh/yr)
Post- harvestlosses (tons/yr)
+ +
% of energyused for
productive use
E vapotranspiration(M m3/yr)
Annualdeforestation
rate Area of naturalecosystemsdestroyed
(km2)
+
Consumptivewater demand
- food production(M m3/year)
Water required forIrrigation (M m3/yr)
Water Used - foodproduction (M
m3/yr)
Agricultural waterproductivity of a field
(tons/m3 of waterabstracted)
Totalagriculturalland (km2)
Food processinginstalled capacity
(M tons/yr)
Water Supply(M m3/yr)
Water Stress(M m3/yr)
-
Water required forfood processing (M
m3/yr)
Average yield percrop field (tons/
ha)
Fertilizer andpesticide
application rate(kg/ha)
Quality of IrrigationReturn F lows (nitrate
and nutrientsconcentrationlevels-ppm)
E nergy used forharvesting (GWh/yr)
E nergy used for foodprocessing and
packaging (GWh/yr)
Water used for foodtransportation
(GWh/yr)
E nergy used for foodstorage and cooling
(GWh/yr)
+
+
+
-
Irrigatedagriculturalland(km2)
+
+
Rainfedagriculturalland (km2)
+
-
-
+ +
-
+
Energy used forfood production
(GWh/yr)
Total E nergyused for Food
Provisiong(GWh/yr)
Installed coolinginfra capacity (M
tons/yr)
++
+
+
+
+
+
-
-
+
-
+
E cosystemsHealth
Food productionenvironmentalfootprint (GHGemissions/ton)
-
-
B iodiversity+
Mechanizationof Agriculture
Averagecultivated area
(km2/household)
+
+
+
Landscaperesilience to
extreme events
+
Food productionlosses due to
extreme weatherevents (tons/yr)
-
+
+
+
+
+
Energy Scarcity
+
+
+
+
Water used forIrrigation (M m3/yr)
Water allocated toIrrigation (M m3/yr)
+
+
Run-off(M m3/yr)
+
-
-
++
+
Water used for foodprocessing (M m3/yr)
+
+
-
+
T raditional useof biomass for
cooking
+
Improved seedquality
E fficient irrigationsystems (e.g. drip
irrigation)
Measures that IncreaseProductivity of rainfed
agriculture
Measures to reduceevotranspiration rates
(e.g. Mulching)Rule enforcement
Waste WaterT reatment of
Irrigation ResidualWater
Conservation andClimate SmartAgriculturePractices
Forest governanceand protection
Reforms toagricultural and
water rights
++
-
--
- +
+
-
++
+

Page 113 of 122 ECN-E--18-036
CLD 2: The impact of an increasing share of renewables on water and food security: the impact of large dams (Trade-offs 1 and 14, Water for Energy)
hydropower plantgeneration capacity
(MW)
People with access tomodern energy (goal:
100%)
Share of renewables intotal energy mix (Goal:
twice current)
Water quality
Forest cover (%loss/year)
Percentage of children(<5year) stunted or
malnurished
River B asinHealth
Measures tolimit reservoirevaporation
Land requiredto build dam
(km2)
Hydropowerdam size(height)
F ish migrationflow
Number oflarge
hydropowerdams
Reservoirevaporative
losses Annualdeforestation
rate
Area of naturalsystems
destroyed(km2)
Level ofdisturbance of
river ecosystem(downstream)
+
+
+
+
+
-
Hydropowerenergy generated
(MW/yr)
L and erosionlevel (upstream)
Landscape &E cosystem Mgt.
Measures
+
+
Number of peopleaffected by waterborne
diseases
-
Multi- usereservoirs
Methaneemissions/yrClimate Change Number of
artificialreservoirs
+
+
+
+
+
Loss ofagricultural
land (km2/yr)+
Annual CropProduction(calories/yr)
Annual F ishProduction(tons/yr)
+
-
-
-
-
Reservoirvolume
+
+
+
ReservoirSiltation
+
-
Droughtintensity
Averagetemperature
+
+
+
+
Total energydemand
People usingelectricity +
+
+
-
-
-
-E nergy supply
+
Energy supply:demand ratio
-
+
Large hydropowerdam planned
-
+
Water forIrrigation
+
+
+

Page 114 of 122 ECN-E--18-036
CLD 3: The impact of an increasing share of renewables on water and food security: water and food required for biomass energy production (Trade-offs 4 and 12)

Page 115 of 122 ECN-E--18-036
CLD 4: Water for Energy (Trade-offs 2, 3, and 4 )

Page 116 of 122 ECN-E--18-036
CLD 5: Energy for Water (Trade-offs 7, 8, and 9 )
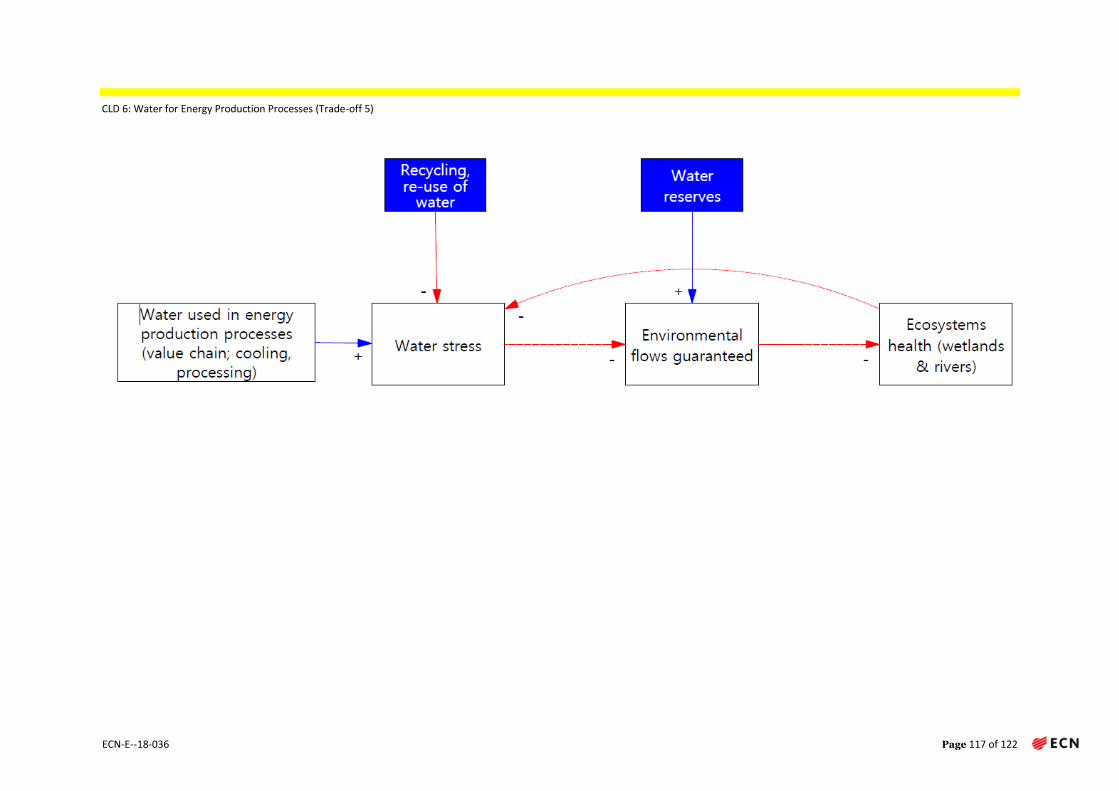
Page 117 of 122 ECN-E--18-036
CLD 6: Water for Energy Production Processes (Trade-off 5)

Page 118 of 122 ECN-E--18-036
Appendix E: Identifying leverage points
PLACES TO INTERVENE IN A SYSTEM in increasing order of effectiveness:
12. Constants, parameters, numbers (such as subsidies, taxes, standards).
11. The sizes of buffers and other stabilizing stocks, relative to their flows.
10. The structure of material stocks and flows (such as transport networks, population age structures).
9. The lengths of delays, relative to the rate of system change.
8. The strength of negative feedback loops, relative to the impacts they are trying to correct against.
7. The gain around driving positive feedback loops.
6. The structure of information flows (who does and does not have access to information).
5. The rules of the system (such as incentives, punishments, constraints).
4. The power to add, change, evolve, or self-organize system structure.
3. The goals of the system.
2. The mindset or paradigm out of which the system — its goals, structure, rules, delays, parameters —
arises.
1. The power to transcend paradigms.
Source: Meadows, D. (1999). Leverage points. Places to Intervene in a System.
Avaiallable at: http://drbalcom.pbworks.com/w/file/fetch/35173014/Leverage_Points.pdf

Appendix F: Results from the Group Model Building sessions of them Nexus research team Causal Loop


Appendix G: Nexus development table
See enclosed excel file for complete table.
Development priority Detail Target Unit Target
Value
Current
value
Time horizon Source Relevant SDG
target
SDG indicator Data Status
Ethiopia
SDG gap Climate change influence Source Resource use Source
Agriculture In GTP II period, (2015-2020) agriculture will
remain the main driver of the rapid and inclusive
economic growth and development. It is also
expected to be the main source of growth for the
modern productive sectors. Therefore, besides
promoting the productivity and quality of staple food
crops production, special attention will also be given
to high value crops, industrial inputs and export
commodities. To this end irrigation based
agriculture, horticulture, fruits and vegetables,
livestock and fisheries development will be
promoted.
Share of
Agriculture and
allied Sectors to
GDP
% 33.5 38.5 2019/20 GTP II 2.1 By 2030, end
hunger and
ensure access by
all people, in
particular the
poor and people
in vulnerable
situations,
including infants,
to safe, nutritious
and sufficient
food all year
round
2.1.1 Prevalence
of
undernourishmen
t
Prevalence of
undernourishmen
t (% of
population)
32% 32% The Climate Resilience Strategy for Agriculture indicates
that the impact of climate change on
agriculture could range from a modest increase in GDP of
1% by 2050 to a significant fall in
GDP of 10% or more by 2050. Other studies indicate that
GDP per capita could fall by 30%
from the impacts on agriculture and livestock by 2050
(Gebreegziabhre, 2011).
CRGE Agricultural water
withdrawal in 2016 is
estimated at around 9
000 million m³. This
figure, however,
seems to be a low
estimate considering
both the large
increase in irrigated
areas and the
changing pattern in
irrigated crops.
AQUASTAT
