operations and administration committee information item ......operations and administration...
TRANSCRIPT

Operations and Administration Committee
Information Item II-A
March 10, 2016
Annual Vital Signs Report for 2015
Page 2 of 18

Washington Metropolitan Area Transit Authority
Board Action/Information Summary
TITLE:
Vital Signs - 2015 Annual Report
PRESENTATION SUMMARY:
As a regional transportation system, Metro’s system-wide performance is captured in the Vital Signs Report. The Vital Signs Report provides analysis of a focused set of Key Performance Indicators (KPIs) that monitor long term progress in delivering quality service.
PURPOSE:
Vital Signs communicates the transit system’s performance to the Board of Directors on a quarterly and annual basis. The public and other stakeholders are invited to monitor Metro’s performance using a web-based scorecard at wmata.com.
Metro’s managers measure what matters and hold themselves accountable to stakeholders via a focused set of KPIs that are reported publicly in Vital Signs. The report is organized by the Board-adopted strategic goals that align actions to improve performance and deliver results.
Vital Signs is different from most public performance reports in that it provides systematic, data-driven analysis of KPIs by answering two questions: Why did performance change? What actions are being taken to improve performance? The answers reveal the challenges and complexities of the operation.
A balanced scorecard approach is used in Vital Signs, but the focus is on Metro’s core business of quality service delivery. Mission critical functions such as safety, security and finance provide in-depth reporting separately to the Board.
DESCRIPTION:
Key Highlights:
The 2015 Annual Vital Signs Report documents results for Metro’s KPIs. This report takes a look back at the entirety of 2015 compared to prior years. Performance resultsshow that in the area of quality service delivery and safety:
• Three KPI’s improved:
Elevator Availability Escalator Availability Crime Rate
Action Information MEAD Number:201715
Resolution:Yes No
Page 1 of 4MEAD 201715 - Vital Signs - 2015 Annual Report (View Mode) - MEAD : Metro Electr...
3/3/2016https://meadapp.wmata.com/Document/Print?__RequestVerificationToken=T8_9tXkwMBk...
Page 3 of 18

• Six KPI’s worsened:
Bus On-Time Performance Rail On-Time Performance Rail Fleet Reliability Bus Fleet Reliability Customer Injury Rate Employee Injury Rate
Background and History:
Metro has established many of the performance-based planning and programming elements necessary to become a more strategic, accountable and transparent organization. The agency was recognized in 2013 as a model in the U.S. Department of Transportation’s Performance Based Planning and Programming (PBPP) Guidebook for establishing a framework for setting goals, developing measures, determining targets, allocating resources and evaluating/reporting results via Vital Signs.
Key to progress in becoming a performance-based organization was the establishmentof a standalone Office of Performance in 2010. The Office is dedicated to expanding the use of performance information to guide decisions, to promote Metro’s benefits in the region and to unify employees to accomplish agency goals. Since its inception, the Office has developed a range of performance tools that connect day-to-day work of Metro’s employees to agency goals.
In its most recent long range plan, Momentum, the Board of Directors drove the development of WMATA’s mission, vision and goals for building a transit system that supports a competitive region. Through this process, the Board of Directors enacted policy that defined four Strategic Goals:
• Build and Maintain a Premier Safety Culture and System• Meet or Exceed Expectations by Consistently Delivering Quality Service• Improve Regional Mobility and Connect Communities• Ensure Financial Stability and Invest in our People and Assets
These four Strategic Goals define where Metro wants to go and provide guidance for decisions across the agency. For each goal, the Office of Performance (CPO) has worked with Departments across the agency to develop business plans with measures and key actions that demonstrate departmental contribution to these goals. CPO staff work as internal consultants with leaders in bus and rail operations to conduct in depth analyses and promote data-driven decision making across the agency, striving for quality and accuracy in the KPIs and seeking to evolve or establish new KPIs that reflect the customer experience.
On an annual basis, CPO facilitates a work session with the GM/CEO and the Executive Leadership Team to determine annual targets for each KPI. The executives review historical data trends, activities planned for the coming year, resource constraints, external factors that may impact results (e.g. major construction projects on bus routes) and performance results from peer agencies. Given that the audience for these targets is the Board of Directors and the public, Metro strives for targets that push progress, but
Page 2 of 4MEAD 201715 - Vital Signs - 2015 Annual Report (View Mode) - MEAD : Metro Electr...
3/3/2016https://meadapp.wmata.com/Document/Print?__RequestVerificationToken=T8_9tXkwMBk...
Page 4 of 18

are realistic to attain.
As recently announced, the GM/CEO's Go Forward plan is a comprehensive strategy for the Authority that specifies actions to improve the KPIs. Some of those actions are discussed below in context with the annual results.
Discussion:
Bus on-time performance (OTP) showed mixed results depending on the type of route, but system wide, at 77.7 percent, it was practically the same as 2014. High ridership routes improved by one percent. Priority corridor routes experienced slightly lower OTP (0.5 percent). Actions to be taken in CY16 to address bus OTP include partnering with regional and state departments of transportation to introduce traffic signal prioritizationin key bus corridors to reduce travel times.
Rail OTP fell from almost 91 percent in 2014 to 84 percent in 2015 as railcar, power and track equipment problems led to longer and more variable travel times for customers. Rail OTP will benefit from a new service reliability plan that reduces excess waiting time and crowding in CY16.
Fleet reliability was below target most of the year as Metro faced numerous ongoing challenges with its fleets. Bus service interruptions increased by 234 mechanical failures compared to 2014. Rail fleet reliability was 13 percent worse than 2014 as the higher Silver Line car requirement strained the maintenance program. To improvereliability in CY16, a mechanical wellness program, track quality improvement program and new 7000 series trains as well as new buses will be introduced.
Escalator and elevator availability both surpassed targets in 2015. At 93.3 percent, escalator availability was the highest since the measure was first reported in 2010, despite taking more units out of service for rehabilitation. Elevator availability was 96.9 percent.
Customer injuries rose this year and were worse than target, driven by an increase in rail injuries from the January 12 smoke incident at L’Enfant Plaza. Injuries improved in all other modes. Despite improvements as the year progressed, employee injuries were worse than 2014 and target. To improve safety in CY16, Metro will welcome a new Chief Safety Officer, install new safety radio systems, improve transparency about progress towards National Transportation Safety Board and Federal Transit Administration recommendations, and add platform attendants to assist customers in key rail stations.
In 2015, Part-1 crimes were 13 percent lower (246 fewer crimes) than the target, although slightly up over 2014. Crimes counted are classified as “Part 1” crimes as defined by the FBI. In CY16, transit police officers will be more visible in stations and on buses with enhanced uniforms and more patrols.
Customer satisfaction for bus was on par with CY14 while rail customers were markedly less satisfied with service. The CY16 priorities identified by the General Manager/Chief Executive Officer are part of a portfolio of initiatives that will become the road map to deliver the basics of better service for Metro’s customers.
Page 3 of 4MEAD 201715 - Vital Signs - 2015 Annual Report (View Mode) - MEAD : Metro Electr...
3/3/2016https://meadapp.wmata.com/Document/Print?__RequestVerificationToken=T8_9tXkwMBk...
Page 5 of 18

FUNDING IMPACT:
TIMELINE:
There is no impact on funding for this information item.Project Manager: Andrea Burnside, Chief Performance officer
ProjectDepartment/Office: Office of Performance
Previous Actions The last Vital Signs (annual) report was presented to the Board in November 2015.
Anticipated actions afterpresentation
The next scheduled quarterly Vital Signs Report will be delivered to the Operations and Administration Committee in May 2016.
Page 4 of 4MEAD 201715 - Vital Signs - 2015 Annual Report (View Mode) - MEAD : Metro Electr...
3/3/2016https://meadapp.wmata.com/Document/Print?__RequestVerificationToken=T8_9tXkwMBk...
Page 6 of 18

Washington Metropolitan Area Transit Authority
Annual Vital Signs Report2015 Performance Results
Operations and Administration CommitteeMarch 10, 2016
Page 7 of 18

Key Performance Indicator Results2015
Beat target = Success
Escalator and elevator availabilityCrime rate
Service quality and safety were challenging
Bus & rail on-time performanceBus & rail fleet reliabilityCustomer & employee injury rates Customer satisfaction
Page 8 of 18

Customer Satisfaction
* Defined by customers as:
Reliability – consistent service delivery
On-time performance – arriving according to schedule.
Train reliability
25%
Station signage11%
Train climate9%
Train cleanliness
8%
Ride quality8%
Bus Reliability
23%
On‐time performance
17%
Bus climate10%
Bus cleanliness
8%
Bus safety7%
• Survey approximately 400 bus and 400 rail customers
• Rated “very satisfactory” or “satisfactory”
• Results are summarized by quarter
Customer Satisfaction Drivers
Page 9 of 18

Actions to ImproveReliability and On-Time Performance
GM Priority Areas
On time train arrivals; reduce waiting, crowdingMechanical wellness – fewer equipment failuresAccelerate 7000-series deliveryNew bus and paratransit vehiclesTrack quality improvement programSignal priority in key bus corridorsNew cell phone appPass products, simplify faresSocial media customer complaint resolution
Page 10 of 18

Actions to ImproveSafety
GM Priority Areas
Hire Chief Safety OfficerInstall public safety radio systemsPublish National Transportation Safety Board and Federal Transit Administration actions takenEmploy platform attendantsEnhance uniformed police patrol visibility
Page 11 of 18

Actions to ImproveAccountability
GM Priority Areas
Rail line management ownership
Institutional individual evaluations
Collective bargaining restructuring
Page 12 of 18

Business Operations Results2015
Budget measuresmid-way throughfiscal year 2016
Vacancy rates -overall & critical hire
Page 13 of 18

DisadvantagedBusiness Enterprise
EnvironmentalSustainability
Business Operations Results2015
Page 14 of 18
Board of Directors KPI’s
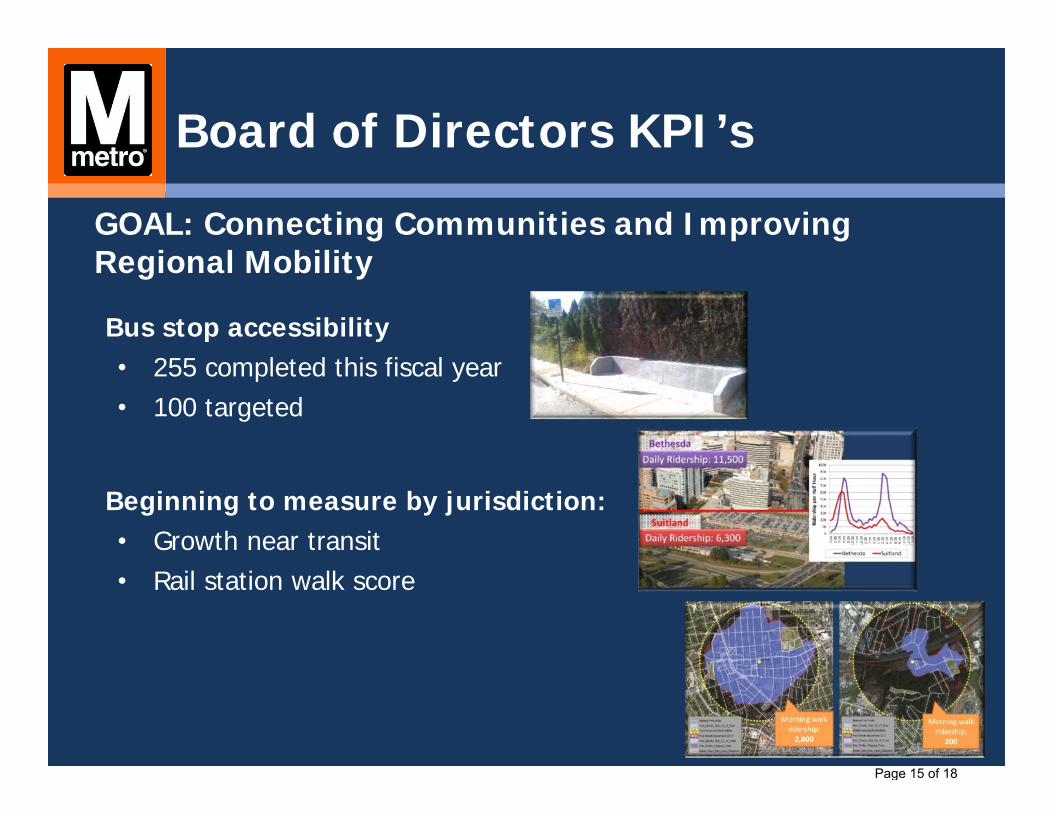
Bus stop accessibility• 255 completed this fiscal year• 100 targeted
GOAL: Connecting Communities and Improving Regional Mobility
Beginning to measure by jurisdiction:• Growth near transit• Rail station walk score
Page 15 of 18

Increasing Accountability & Transparency2016 Vital Signs Improvements
Procurement Per Board Resolution 2014-19
FTA defined “State-of-Good-Repair” measuresMAP-21 Asset management requirement
Measures of bus crowding Companion to rail Passengers-Per-Car Standard
Rail customer travel time score
Page 16 of 18

Data Driven Decision Making
“The big data of this revolution is far more powerful than the analytics that were used in the past. We can measure and therefore manage more precisely than ever before. We can make better predictions and smarter decisions. We can target more-effective interventions, and can do so in areas that so far have been dominated by gut and intuition rather than by data and rigor.”
Harvard Business Review
Page 17 of 18

APPENDIX

Washington Metropolitan Area Transit Authority
January – December 2015 Annual Report
Published: January 2016
Highlights
• Bus on-time performance (OTP) showed mixed results depending on the type of route, but system wide at 77.7 percent was practically the same as 2014. High ridership routes improved by one percent. Priority corridor routes experienced slightly lower OTP (0.5 percent). p3
• Rail OTP fell to 84 percent in 2015 from almost 91 percent in 2014 as railcar, power and track equipment problems led to longer and more variable travel times for customers. p5
• Fleet reliability was below target most of the year as Metro faced numerous ongoing challenges with its fleets. Bus service interruptions due to mechanical failures increased by three percent compared to 2014. Rail fleet reliability was 13 percent worse than 2014 as the higher Silver Line car requirement strained the maintenance program. p4 & 6
• Escalator and elevator availability both surpassed targets in 2015. At 93.3 percent, escalator availability was the highest since the measure was first reported in 2010, despite taking more units out of service for rehabilitation. Elevator availability was 96.9 percent. p7
• Customer injuries rose this year and were worse than target, driven by an increase from the January 12 smoke incident at L’Enfant Plaza. Injuries improved in Metrobus and MetroAccess. Despite improvements as the year progressed, employee injuries were worse than 2014 and target. p8 & 9
• In 2015, Part-1 crimes were 13 percent lower (246 fewer crimes) than the target, although slightly up from 2014. Crimes counted are classified as “Part 1” crimes as defined by the FBI. p10
• Customer satisfaction did not meet target in 2015. Bus was on par with last year while rail customers were markedly less satisfied with service. p11
Table of Contents
Bus 3 Rail 5 Elevator/Escalator 7 Customer Satisfaction 8 Safety 9 Security 11 Business Operations 12 Definitions 17 Performance Data 20
Performance Bus On-Time Performance
Bus Fleet Reliability
Rail On-Time Performance
Rail Fleet Reliability
Elevator Availability
Escalator Availability
Customer Injury Rate
Employee Injury Rate
Crimes
Customer Satisfaction – Rail
Customer Satisfaction – Bus
Color of bar reflects performance vs. target
2015 Target

2 Chief Performance Officer Vital Signs—2015 Annual Report
Introduction
ITAL SIGNS communicates the transit system’s
performance to the Board of Directors on a quarterly and annual basis. The public and other stakeholders are invited to monitor Metro’s performance using a web-based scorecard at wmata.com. Metro’s managers measure what matters and hold themselves accountable to stakeholders via a focused set of Key Performance Indicators (KPIs) reported publicly in Vital Signs. The report is organized by the Board-adopted strategic goals that align actions to improve performance and deliver results. Vital Signs is different from most public performance reports in that it provides systematic, data-driven, analysis of KPIs by answering two questions: The answers reveal the challenges and complexities of our operation. TARGETS are set for every Vital Signs KPI to identify success. Realistic targets deliver continuous improvement and keep the ball moving forward.
Metro’s executive leaders set targets annually and present them to the Board to gauge progress. Target setting takes into account factors like historical trends, planned activities, resource constraints, and external factors that influence results – e.g., roadway construction projects in bus corridors. Metro values benchmarking to share best practices in the industry that lead to improved performance.
A BALANCED SCORECARD approach is used in Vital Signs, but the focus is on Metro’s core business of quality service delivery.
Mission-critical functions such as safety, security and finance provide in-depth reporting separately to the Board.
Why did performance change? What actions are being taken to improve it?
Goal: Ensure financial stability and invest in our people and assets
Goal: Meet or exceed customer expectations by consistently delivering quality service
Goal: Build and maintain a premier safety culture and system
Goal: Improve regional mobility and connect communities
V

Vital Signs —2015 Annual Report Chief Performance Officer 3
KPI: Bus On-Time Performance Although Bus On-Time Performance (OTP) in 2015 was nearly the same as the year before (77.7 percent in 2015 compared
to 77.9 percent in 2014), Metrobus service levels increased 4 percent this year.
Why did performance change? The frequency of buses running ahead of schedule and arriving early at
bus stops declined or improved by 17 percent; however, the rate at which buses ran behind schedule increased or worsened by 8 percent.
Results were mixed. OTP for high ridership routes improved by one percent. Numerous schedule changes occurred on these routes to: provide additional service, reduce crowding and improve on-time performance. However, OTP for priority corridor routes was slightly lower by 0.5 percent compared to last year.
In response to numerous complaints about buses running early, street supervisor presence was increased to reduce late and early arrivals.
Other 2015 events that impacted OTP included: transitioning service to the new Shepherd Parkway bus garage, four more recorded inclement weather conditions and an increase in special events and road construction projects compared to 2014.
Key Actions to Improve Performance Data driven decision making In the year ahead, Bus Service will implement the organization’s first Bus StreetStat meeting to help supervisors use data
to make decisions about how to improve service. Continue the daily tracking and monitoring efforts of the Performance Improvement Team (PIT), which monitors and
implements real-time solutions (primarily for low performing routes), assesses service impacts, conducts ride-alongs and provides operator guidance.
Collaboration Work to increase jurisdictional collaborative efforts to increase initiatives like traffic priority signaling and additional
service adjustments.
Fewer service disruptions, less congestion Evaluate the effectiveness of the new post-incident drug testing procedures that became effective November 2015 and
which should result in less service disruptions. Assign additional articulated buses to congested ridership areas during the weekdays.
70%
75%
80%
85%
2013 2014 2015
Target
Quality Service
For t
his
mea
sure
, hig
her i
s be
tter

4 Chief Performance Officer Vital Signs—2015 Annual Report
KPI: Bus Fleet Reliability Customers experienced less reliable bus service this year compared to prior years as a result of numerous fleet and parts
manufacturer-related challenges that troubled the entire industry.
Why did performance change? Bus fleet reliability did not meet its 2015 target 8,000 miles, service
interruptions increased by three percent or 234 mechanical failures compared to 2014.
Service interruptions fluctuated throughout the year as a result of delayed delivery of new buses; temperature/weather-induced challenges; defective parts; failures due to older (less reliable) buses experiencing end of useful life issues; and the receipt of new buses impaired by door system, exhaust clamp failures, low coolant level sensor and fire suppression sensor failures.
Service interruptions began to decline towards the later part of the year as the condition of the Hybrid fleet began to improve and selected targeted campaigns came to a close.
Staff is investigating a November mileage discrepancy and will modify November’s fleet reliability results accordingly.
Key Actions to Improve Performance Better parts and new buses Bus Services will complete a number of part and manufacturer initiatives in 2016, such as the in-depth failure analysis of
the top 5 service interruptions causes, and continue to develop detailed action plans. In continued compliance with the bus maintenance Federal Transit Administration (FTA) materials procurement
processes, standard operating procedures will be implemented to ensure optimal incoming parts inspections and materials discrepancy reporting.
In efforts to retire older, less-reliable buses and reduce the average age of the bus fleet, Bus Maintenance will complete the accelerated delivery of additional new buses by the end of 2016.
Better failure analysis Improve data analysis through the mandated use of component code reporting for all work order tasks to allow for a
better assessment of trend failures and a more-targeted engineering approach to reducing service interruptions. Continue to participate in peer exchange exercises to better understand how failures impact the entire industry and
possible solutions.
5,000
7,000
9,000
11,000
2013 2014 2015
Mile
s Target
Qua
lity
Serv
ice
For t
his
mea
sure
, hig
her i
s be
tter

Vital Signs —2015 Annual Report Chief Performance Officer 5
KPI: Rail On-Time Performance On-Time Performance (OTP) was well below the target of 91 percent in 2015, falling to 75 percent in October, the lowest
rail OTP ever published in Vital Signs. Causes included: railcar failures and shortages, a power transformer fire leading to months of intentional service reductions on Orange and Silver Lines and scheduled work to improve long-term track reliability.
Why did performance change? Rail OTP fell from almost 91 percent in 2014 to 84 percent in 2015 as
railcar, power and track equipment problems led to longer, and more variable travel times for customers.
In Q1/2015, low winter temperatures and snow led to railcar and track problems.
The daily railcar service requirement was not met for most of 2015 meaning trains were routinely shortened from 8 to 6 cars, or slots were completely missed resulting in gaps in the headways (time between trains).
The September power transformer failure at Stadium-Armory reduced service on Orange and Silver Lines through December, bringing Orange and Silver Line OTP to lows of 50-60 percent.
To improve long-term track reliability, Metro re-initiated scheduled mid-day track work beginning in June which immediately worsened mid-day OTP through December.
Key Actions to Improve Performance GM Priority Conduct weekly GM/CEO meetings to address leading causes of railcar performance and other challenges to reliability. Better schedule track work to make most effective use of limited access window and minimize customer travel time
(e.g., pre-stage equipment; evaluate travel time impact of track work schedule). Implement asset management strategies in adherence with new FTA requirements expected to be released in 2016,
addressing how Metro provides reliable service to customers by managing asset performance, risk and cost over the life of an asset.
75%
80%
85%
90%
95%
100%
2013 2014 2015
Target
Quality Service
For t
his
mea
sure
, hig
her i
s be
tter

6 Chief Performance Officer Vital Signs—2015 Annual Report
KPI: Rail Fleet Reliability 2015 Rail Fleet Reliability was 13 percent worse than 2014 as the higher Silver Line car requirement strained the maintenance
program. Not enough railcars were available to depart end-of-line stations, leading to longer waits for customers and more crowded trains.
Why did performance change? Metro began 2015 without the 64 additional cars needed to operate
Silver Line service (delivery timeline delayed by 2011 earthquake and tsunami in Japan). More of the existing fleet was put into regular service (“spare ratio” decreased from 20 percent to 14 percent).
2015 Rail Fleet Reliability was 13 percent worse than last year, as more aging railcars were removed from service for causes including propulsion, door and brake issues. Maintenance staff had limited flexibility to change out equipment with more reliable components due to the decreased spare ratio and parts shortages.
When the number of railcars removed from service exceeds the available spares, Metro shortens 8-car trains to 6-car trains. This rail car shortening can lead to crowding and, when car availability drops further, trains are unavailable for departure from end-of-line stations, which increases headways (time between trains). This was particularly pronounced in 2015 due to winter weather-related door and propulsion problems, an unplanned summer door inspection campaign (4000 series), a summer maintenance initiative that purposefully removed railcars from service and a parts shortage.
By the end of 2015, 64 of the new 7000 series cars were put in service. Reliability of these new railcars is expected to increase after the initial break-in (per contract).
Key Actions to Improve Performance Improve reliability and availability of fleet Replenish parts inventories and improve procurement processes to reduce the number of cars out of service due to parts
shortages. Implement identified engineering solutions by conducting railcar component change-out campaigns when parts are
received.
Introduce new 7000-series railcars following testing and certification
Continue delivery of the 364 7000-series railcars ordered, testing to ensure cars meet quality standards. Following certification, place into service to replace Metro’s older, less-reliable cars.
30,000
50,000
70,000
90,000
2013 2014 2015
Mile
s
Target
Qua
lity
Serv
ice
For t
his
mea
sure
, hig
her i
s be
tter

Vital Signs —2015 Annual Report Chief Performance Officer 7
KPI: Elevator and Escalator System Availability Elevator and escalator availability continued to improve for customers this year, surpassing targets.
Why did performance change? Escalator availability was 93.3 percent for 2015, the highest since
reporting on this measure began in 2010. Metro beat its target despite taking more units out of service for multi-month rehabilitations or replacements (61 percent of all outages).
Escalators were more reliable in 2015, running about 12 hours longer before breaking down. This improved condition is a result of a multi-year emphasis on preventive maintenance and prioritizing the most troublesome units for rehabilitation or replacement. Better condition also led to less-intensive repairs when units did break down. Overall, units were out of service for unscheduled repairs 15 percent less than in 2014.
Elevator availability also surpassed target, at 96.9 percent for 2015. About 55 percent of outages were for scheduled, multi-month rehabilitations. Metro completed 17 rehabs in 2015, 50 percent more than 2014.
Technicians were able to keep availability high for customers by addressing unscheduled breakdowns almost 3 hours faster than in 2014, thanks to a staff reorganization that improved flexibility and less-intensive repairs resulting from better condition.
Key Actions to Improve Performance Modernize escalator and elevator fleet Replace 137 of the system’s 618 escalators by 2020 and rehabilitate up to an additional 144 escalators and 90 elevators.
Modernized units are be more reliable and energy efficient. From 2011 through 2015, 149 escalators and 49 elevators have been modernized. In 2016, replace 23 escalators and rehabilitate 8 escalators and 20 elevators.
Improve reliability Through CY2020, install canopies at 11 Metrorail entrances where units are currently exposed to the elements. Conduct more sophisticated analysis of failures to engineer better maintenance solutions.
Implement remote monitoring Consolidate and enhance the elevator and escalator operations center and remote monitoring operations to improve
response time to outages and enable more accurate availability reporting.
Train staff Train senior staff to mentor younger mechanics and journeymen in order to improve skills and employee engagement.
85%
90%
95%
100%
2013 2014 2015
Escalators
Target
85%
90%
95%
100%
2013 2014 2015
Elevators Target
Quality Service
For t
hese
mea
sure
s,
high
er is
bet
ter

8 Chief Performance Officer Vital Signs—2015 Annual Report
KPI: Customer Satisfaction Bus customer satisfaction is comparable to last year, while rail customer satisfaction is down year-over-year. Why did performance change? Overall, customer satisfaction did not meet the target of 84 percent. Bus customer satisfaction is consistent with previous quarter at 81
percent and statistically comparable to last year at this time. Bus customers saw no change in the average number of problems they
experienced during a trip this quarter (1.60 per trip). This has remained consistent with the previous quarter (1.62 per trip).
Rail customers’ satisfaction (69 percent) also remained consistent with previous quarter and statistically down compared to last year at this time.
While less than half of customers rated rail reliability positively this quarter, the average number of problems a rail customer may experience during a trip declined to levels experienced at the beginning of 2015 (approximately 2.7 per trip).
Compared to Q4/2014, bus customers are experiencing: o Improved operator courteousness; o Slightly more trouble purchasing their fare; and o More concern for safety at bus stops.
Compared to Q4/2014, rail customers are experiencing: o Better announcements on trains; o Less crowding in stations; o Uncomfortable temperatures on trains; and o Less safe conditions on trains.
Key Actions to Improve Performance Bus Review automatic fare collection (AFC) maintenance of on-board equipment for add-value transactions. Reinforce the positive aspects of good customer service. To address crime, Metro Transit Police will focus on increased collaborative solutions at the federal, state and local levels.
Rail Develop standard scripts and pinch-point announcements for train operators/rail operations control center (ROCC). Operate trains consistently as station crowding is an indicator to all customers of unreliable service. Deploy additional staff to assist customers and manage excessive crowding during service disruptions.
Qua
lity
Serv
ice
For t
his
mea
sure
, hig
her i
s be
tter

Vital Signs —2015 Annual Report Chief Performance Officer 9
KPI: Customer Injury Rate The customer injury rate rose this year and was worse than target, driven by an increase in rail injuries associated with the
January 12 smoke incident at L’Enfant Plaza.
Why did performance change? The higher rate was driven by a significant increase in Metrorail customer
injuries occurring while on-board trains. Sixty-nine customers were injured and one customer died during the January 12, 2015 smoke incident at L’Enfant Plaza.
There were also over 70 percent more injuries sustained when train doors closed on passengers, most frequently as they attempted to exit crowded trains.
Customer injury rates on Metrobus and MetroAccess improved compared to 2014, reflecting sustained efforts to upgrade escalator condition, provide better training and coaching to bus operators, and encourage safe behavior among customers through targeted outreach.
Almost 20 fewer customers required medical attention after slipping or falling on escalators, in Metrorail stations, or in parking lots. About 40 fewer bus customers were injured, leading to a 9 percent decrease in the bus customer injury rate.
The MetroAccess customer injury rate decreased by almost 30 percent, driven by a drastic decline in the number of non-collision-related injuries.
Key Actions to Improve Performance Conduct customer outreach Deploy additional staff to assist customers and manage excessive crowding during service disruptions. Enhance safety features of vehicles Review Metrobus interior design to identify opportunities to improve customer safety. Work with Virginia Legislature to allow installation of strobe lights on Metrobuses to improve pedestrian safety. Evaluate the effectiveness of reflective chevrons on decreasing collisions. Install closed circuit television (CCTV) cameras on MetroAccess vehicles. Install new public safety radio systems and cell phone cabling for telecom providers in stations and tunnels. Improve station lighting to reduce slips, trips and falls and enhance personal security.
Coach staff Reduce the number and severity of collisions by implementing a revamped and expanded bus operator training. Schedule safety blitzes at incident hotspots to reinforce safe behavior and address unsafe conditions. Improve rail operator response to customer emergency intercom calls.
Comply fully with federal and state regulations Submit for closure all NTSB and FTA safety recommendations. Respond to FTA rulemaking (expected in 2015) to ensure compliance with all aspects of integrating a Safety
Management System with Asset Management.
0
1
2
3
4
5
6
2013 2014 2015
Inju
ries
per
Mill
ion
Cust
omer
s
Target
Safety Culture and Security
For t
his
mea
sure
, low
er is
bet
ter

10 Chief Performance Officer Vital Signs—2015 Annual Report
KPI: Employee Injury Rate Despite recent improvements, the employee injury rate rose this year, performing worse than 2014 and target, driven by
winter weather and an increase in crime-related injuries.
Why did performance change? The total 2015 employee injury rate was worse than target and worse
than 2014, at 5.4 injuries per 200,000 hours worked. The number of injuries rose to almost 630, up nearly 30 percent compared to 2014.
Slips, trips and falls (25 percent) and collisions (19 percent) were the two most common types of injuries and were particularly high during the winter of 2015, as employees worked in wet and icy conditions. Declines in these injury types drove improvements in spring, summer and fall.
Crime-related injuries were significantly higher in all but one month this year compared to 2014, and accounted for about 16 percent of all injuries. Almost 30 police officers were injured while pursuing and arresting criminals, about 25 percent more than in 2014.
More employees were assaulted by customers (with 35 requiring medical attention) compared to 2014, and the number of employees seeking treatment for work-related stress stemming from violence witnessed or experienced more than quadrupled. Stress injuries for non-crime-related reasons also grew over 2014, reflecting increased medical staff outreach.
Key Actions to Improve Performance Build safety culture Design and execute a safety strategy focused on changing behavior and bolstering the safety culture, in line with the
Federal Transit Administration’s (FTA) Safety Management Systems (SMS) approach. Conduct regular executive, departmental and local safety committee meetings that involve front-line staff and focus
on operational risks and employee information. Monitor and respond to leading indicators. Expand Confidential Close Call Reporting program to bus employees in March 2016.
Analyze and address root causes of injuries Conduct thorough injury investigations, including identifying key factors and mitigating any hazards. Recommend actions to management based on analysis of injury data, safety observations and training attendance. Establish a task force to better understand and address stress-related injuries. Implement plan to reduce Bus Operator assaults, including use of shields, cameras and enhanced police patrols.
0
2
4
6
8
10
2013 2014 2015
Inju
ries
per
Hun
dred
Em
ploy
ees
Target
Safe
ty C
ultu
re a
nd S
ecur
ity
For t
his
mea
sure
, low
er is
bet
ter

Vital Signs —2015 Annual Report Chief Performance Officer 11
KPI: Crime In 2015, Part-1 crimes were 13 percent lower (246 fewer crimes) than the target, although slightly up over 2014. Crimes
counted are classified as “Part-1” crimes as defined by the FBI.
Why did performance change? Similar to the District of Columbia’s 2015 violent crime rate, overall Part 1
crimes on Metro increased slightly compared to 2014 primarily as a result of increased robberies. These crimes were largely attributed to forcibly taking mobile phones.
Although crimes that occurred in Metro facilities and parking lots declined by 17 percent, bus stop crimes nearly doubled; these crimes generally involved various forms of robbery.
Unlike bus stop crimes, crimes that occurred on buses declined approximately four percent. During 2015, there was an increase in deployment of uniformed personnel and improved camera systems used to deter bus crimes.
Metrorail crimes increased by approximately five percent; primarily driven by an increase in pickpockets. Pickpockets increased more than 40 percent.
Key Actions to Improve Performance MTPD tactics Collaboration will be key in 2016 to reduce both violent and non-violent crimes throughout the region. MTPD will focus on
increased collaborative solutions at the federal, state and local levels, as well as Metrorail and Metrobus partnerships. Assaults on bus operator increased 9 percent compared to 2014. Although these assaults are not categorized as a Part-1
crime, MTPD will continue a surge of High Intensity Targeted Enforcement initiatives in 2016 to reduce assaults against both customers and employees.
Although not a component of Part 1 crime reporting, MTPD is mindful of both national and international events that dictate a heightened security posture in Metrorail and on Metrobus. In addition to an increased presence of uniformed offers, the MTPD will conduct quarterly, full-scale exercises to improve emergency response, expand on active shooter training for Metro employees, and refine response capabilities to threats against the Metro system.
0
500
1,000
1,500
2,000
2,500
3,000
2013 2014 2015
Crim
es P
er Y
ear
Target
For t
his
mea
sure
, low
er is
bet
ter
Safety Culture and Security

12 Chief Performance Officer Vital Signs—2015 Annual Report
Business Operations Finance
Capital Funds Invested
Metro is budgeted to receive slightly more than $1.2 Billion in fiscal 2016 to be invested in infrastructure renewal.
This measure tracks the rate at which these funds are invested.
This utilization is slightly above the rate in fiscals 2014 and 2015.
The fourth quarter of each fiscal year is typically the time of high funds utilization.
Operating Budget Variance
The measure calculates the percentage variance between actual and budgeted spending each month.
The target for this measure is a range between 0 percent and -2 percent under budget.
The range can be explained by considering that underspending by more than -2 percent may indicate some important resource is not being utilized and may have a negative impact on service quality.
The rate shown below is cumulative year-to-date.
Peo
ple
and
Ass
ets
For t
his
mea
sure
, hig
her i
s be
tter
For t
his
mea
sure
, cl
oser
to ta
rget
is b
ette
r

Vital Signs —2015 Annual Report Chief Performance Officer 13
Business Operations Human Resources
Vacancy Rate
By the end of 2015 the overall vacancy rate had successfully declined to 4.5 percent which is well below the target of six percent.
In keeping with the Board’s request to focus on Operations-Critical vacancies a subset of the overall vacancy KPI is now being measured. As of the end of 2015 these positions are running an 11.1 percent vacancy rate which is not on target. The target has been set at 9 percent.
Proactive sourcing and workforce planning are the key strategies being worked to control these vacancy rates.
GM/CEO holding bi-weekly meetings to review vacancies.
Disadvantaged Business Enterprise (DBE) Contracts
DBEs are for-profit small businesses wherein socially and economically disadvantaged individuals (including ethnic minorities, women, and other individuals evaluated on a case-by-case basis) own at least a 51 percent interest, control management and daily business operations, and possess a DBE certification from the relevant state – generally through the state Uniform Certification Program (UCP).
The KPI for DBE awards calculates the percentage of contracts awarded to DBEs. Each Federal Fiscal Year (FFY), Metro sets a target for the percentage of contracts to be awarded to DBEs.
In recent Federal Fiscal Years (FFY), the target has been 25 percent.
Metro achieved a rate of 17 percent for FFY2015, falling below target.
For DBE FFY2015 completed contracts payments, see data tables on p26.
3%
5%
7%
9%
2013 2014 2015
Target
For t
his
mea
sure
, low
er is
bet
ter
People and A
ssets

14 Chief Performance Officer Vital Signs—2015 Annual Report
Business Operations Environmental Sustainability
Meeting sustainability targets helps reduce costs and improve service while expanding the environmental benefits Metro already brings to the region.
Energy and Water Usage Energy comes in many forms including electricity, natural gas, diesel and
gasoline. All can be converted to a common unit called the “BTU” [British thermal unit] and tracked based on the number of bus and train miles operated annually
Metro consumes large quantities of water for its operation. Rail stations are cooled using water chiller plants and all buses and trains are washed on a regular basis. Like energy, water usage is also tracked on a per mile basis.
Both of these measures have targets established to reduce consumption. By 2025 energy use is targeted to decrease 20 percent and water use is targeted to decrease 15 percent from 2013 levels.
Metro consumed energy at the same rate as last year, failing to continue the savings achieved in 2014 (2 percent reduction compared to 2013). Metro did not meet its ambitious annual target. Metro had several efforts that significantly reduced energy usage in its facilities (e.g., LED lighting, more energy-efficient equipment), but these savings were negated by declining efficiency in the aging CNG bus fleet and increases in traction power usage (in part, due to heavier, more crowded cars on the red, orange, blue and silver lines – see p15).
Water usage declined in 2015 to .86 gallons per vehicle mile, better than target. Metro used 3.5 percent fewer gallons of water as a result of measures taken to reduce consumption, including installing new management systems for station cooling towers.
Key Actions to Improve Performance Complete project to install LED lighting in all parking garages, reducing Metro energy consumption by at least 1 percent. Invest in more energy-efficient equipment, such as switch heaters. Complete installation of FleetWatch in non-revenue vehicles to reduce gasoline consumption, e.g., by monitoring idling Perform an energy audit to identify further opportunities for savings
Peo
ple
and
Ass
ets
For t
hese
mea
sure
s, lo
wer
is b
ette
r
Vital Signs Report—CY 2015 Q4 Chief Performance Officer 15
Board Service Standard
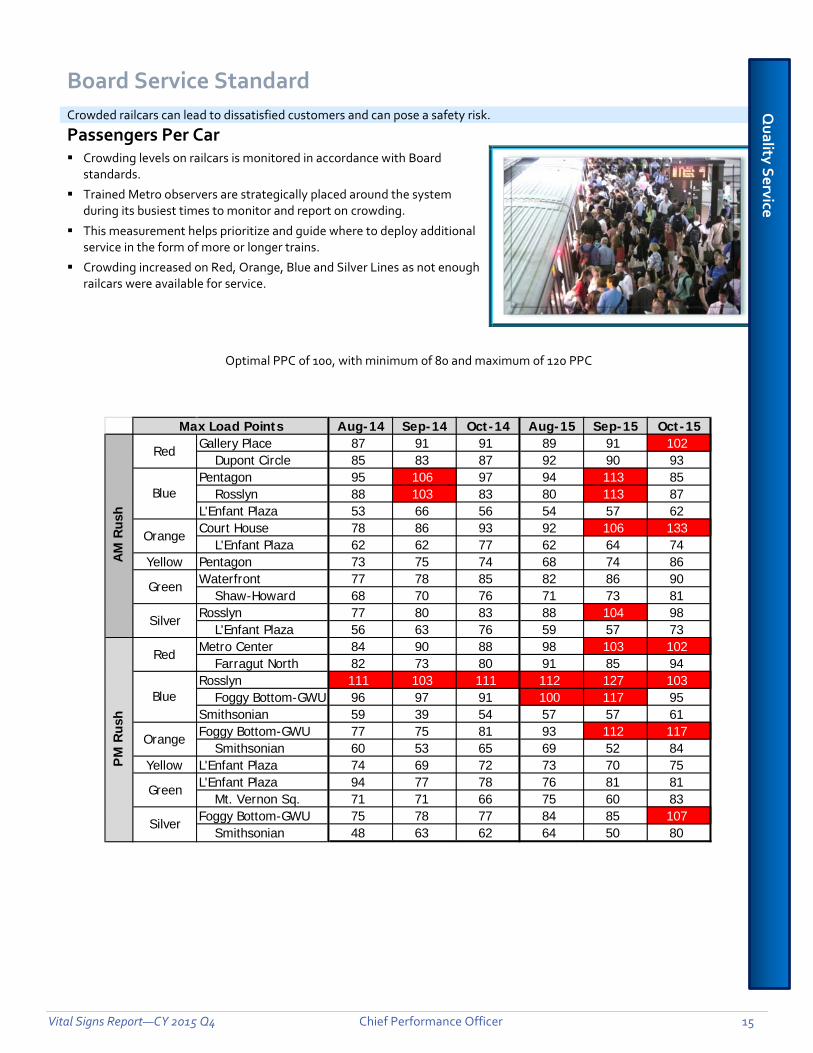
Crowded railcars can lead to dissatisfied customers and can pose a safety risk. Passengers Per Car
Crowding levels on railcars is monitored in accordance with Board standards.
Trained Metro observers are strategically placed around the system during its busiest times to monitor and report on crowding.
This measurement helps prioritize and guide where to deploy additional service in the form of more or longer trains.
Crowding increased on Red, Orange, Blue and Silver Lines as not enough railcars were available for service.
Optimal PPC of 100, with minimum of 80 and maximum of 120 PPC
Aug-14 Sep-14 Oct-14 Aug-15 Sep-15 Oct-15Gallery Place 87 91 91 89 91 102 Dupont Circle 85 83 87 92 90 93Pentagon 95 106 97 94 113 85 Rosslyn 88 103 83 80 113 87L'Enfant Plaza 53 66 56 54 57 62Court House 78 86 93 92 106 133 L'Enfant Plaza 62 62 77 62 64 74
Yellow Pentagon 73 75 74 68 74 86Waterfront 77 78 85 82 86 90 Shaw-Howard 68 70 76 71 73 81Rosslyn 77 80 83 88 104 98 L'Enfant Plaza 56 63 76 59 57 73Metro Center 84 90 88 98 103 102 Farragut North 82 73 80 91 85 94Rosslyn 111 103 111 112 127 103 Foggy Bottom-GWU 96 97 91 100 117 95Smithsonian 59 39 54 57 57 61Foggy Bottom-GWU 77 75 81 93 112 117 Smithsonian 60 53 65 69 52 84
Yellow L'Enfant Plaza 74 69 72 73 70 75L'Enfant Plaza 94 77 78 76 81 81 Mt. Vernon Sq. 71 71 66 75 60 83Foggy Bottom-GWU 75 78 77 84 85 107 Smithsonian 48 63 62 64 50 80
Silver
PM R
ush
AM R
ush
Max Load Points
Green
Red
Orange
Green
Red
Orange
Silver
Blue
Blue
Quality Service

16 Chief Performance Officer Vital Signs—2015 Annual Report
Board of Directors Measures
In the Momentum strategic plan, the Board identified performance measures to track and review annually for the Connect Communities goal.
Annually Reported Board Measures
Bus Stop Accessibility 2015 target = 100 stops made accessible, per year 2015 actual Results = 255 completed Jurisdictions continue to improve stops at a brisk pace
Also, Metro is improving stops throughout the region using grant funds
Coordination between Metro and the jurisdictions on bus stop improvements continues for resources prioritization (Metro shares data related to inaccessible bus stops near conditionally-eligible MetroAccess customers and high-frequency pick-up and drop-off locations)
Regional Development Households and jobs within walking distance to transit generate walk ridership, which costs Metro very little to facilitate.
This indicator measures the combined effect of regional growth within areas located near transit and how well Metro connects growth in these transit-accessible communities to other areas in the system.
Factors that influence this indicator are: how growth occurs near transit; growth in the provision of transit; growth in the accessibility of transit.
For this indicator, there are two metrics. In each case, higher (or more) is better.
Growth Near Transit
Local jurisdictions routinely forecast the number of households and jobs planned for their jurisdictions over the next 25 years. This growth can occur anywhere within the jurisdictional boundaries. However, more growth/density at Metro stations or proximate to bus routes means there is a better chance jobs, housing and retail will be better connected by transit on either end of a trip.
This indicator seeks to measure how well our local partners are planning for future growth to be served by transit, both by proposing new development and by estimating growth to take place in existing transit-served areas. It also is a leading indicator of the extent to which market forces value transit-proximity – if private developers believe that transit proximity is valuable, they will propose more transit-oriented development.
The measure focuses on growth in rail station areas, evaluating households and jobs growth projections within a ½ mile of stations as a share of the jurisdictions’ overall growth projections.
Rail Station Walk Score
By removing barriers to entry, Metro can realize more ridership originating on foot or by bicycle. Staff have calculated a “walkshed coverage ratio” for each station that represents the percent of the area within ½ mile of a station that is actually accessible by foot.
The calculation is based on the pedestrian network within the station area, rather than the typical “planning circle” shown to represent the station planning area.
Conn
ecte
d Co
mm
unit
ies

Vital Signs Report—CY 2015 Q4 Chief Performance Officer 17
Key Performance Indicators
KPI How is it measured? What does this mean and why is it key to our strategy?
Quality Service
Bus Fleet Reliability
Mean Distance Between Failures (MDBF) Total bus miles / Number of failures
The number of total miles traveled before a mechanical breakdown requiring the bus to be removed from service or deviate from the schedule. Mean Distance Between Failures is used to monitor trends in vehicle breakdowns that cause buses to go out of service and to plan corrective actions. Factors that influence bus fleet reliability include vehicle age, quality of maintenance program, original vehicle quality, and road conditions affected by inclement weather and road construction.
Bus On-Time Performance
Adherence to Schedule Scheduled time – Actual time arriving at a time point based on a window of no more than 2 minutes early or 7 minutes late Number of time points that arrived on time by route based on a window of 2 minutes early and 7 minutes late / Total number of time points scheduled (by route)
This indicator illustrates how closely Metrobus adheres to published route schedules on a system-wide basis. Factors that effect on-time performance are traffic congestion, inclement weather, scheduling, vehicle reliability, and operational behavior. Bus on-time performance is essential to delivering quality service to the customer.
Elevator and Escalator Availability
In-service Percentage Hours in service / Operating hours Hours in service = Operating hours – Hours out of service Operating hours = Operating hours per unit * number of units
Escalator/elevator availability is a key component of customer satisfaction with Metrorail service. This measure communicates system-wide escalator and elevator performance (at all stations over the course of the day) and will vary from an individual customer’s experience. Availability is the percentage of time that Metrorail escalators or elevators in stations and parking garages are in service during operating hours. Customers access Metrorail stations via escalators to the train platform, while elevators provide an accessible path of travel for persons with disabilities, seniors, customers with strollers, and travelers carrying luggage. An out-of-service escalator requires walking up or down a stopped escalator, which can add to travel time and may make stations inaccessible to some customers. When an elevator is out of service, Metro is required to provide alternative services which may include shuttle bus service to another station.

18 Chief Performance Officer Vital Signs Report —CY 2015 Q4
Railcar Availability
Cars released for service at 7 AM / Total active railcars
Railcar availability is a key driver of on-time performance (OTP) and supports the ability to meet the Board standard for crowding. When the availability target is met, scheduled departures of all 8- and 6-car trains from end of line stations is possible. When not enough railcars are available, train lengths are first shortened to six cars, which can contribute to crowding. When railcar availability dips further and there are not enough trains to depart from end-of-line stations, headways (time between trains) increase, lowering OTP for customers.
Rail Fleet Reliability
Mean Distance Between Delays (MDBD) Total railcar revenue miles / Number of failures resulting in delays greater than three minutes
The number of revenue miles traveled before a railcar failure results in a delay of service of more than three minutes. Some car failures result in inconvenience or discomfort, but do not always result in a delay of service (such as hot cars). Mean Distance Between Delays communicates the effectiveness of Metro’s railcar maintenance program. This measure reports the number of miles between railcar failures resulting in delays of service greater than three minutes. Factors that influence railcar reliability are the age of the railcars, the amount the railcars are used and the interaction between railcars and the track.
Rail On-Time Performance
Adherence to scheduled weekday headways Number of station stops delivered within the scheduled headway during rush (AM/PM) service plus 2 minutes / Total station stops delivered Number of station stops delivered up to 150% of the scheduled headway during non-rush (midday and evening) / Total station stops delivered
On-time performance measures the adherence to weekday headways, the time between trains. Factors that can effect on-time performance include: infrastructure conditions, speed restrictions, single-tracking around scheduled track work, railcar delays (e.g., doors), or delays caused by sick passengers. Station stops are tracked system-wide, with the exception of terminal and turn-back stations.
Safety & Security
Crime Reported Part I crimes
Part I crimes reported to Metro Transit Police Department for Metrobus (on buses), Metrorail (on trains and in rail stations), or at Metro-owned parking lots in relation to Metro’s monthly passenger trips. Reported by Metrobus, Metrorail, and Metro parking lots. This measure provides an indicator of the perception of safety and security customers experience when traveling the Metro system. Increases or decreases in crime statistics can have a direct effect on whether customers feel safe in the system.
Vital Signs Report—CY 2015 Q4 Chief Performance Officer 19
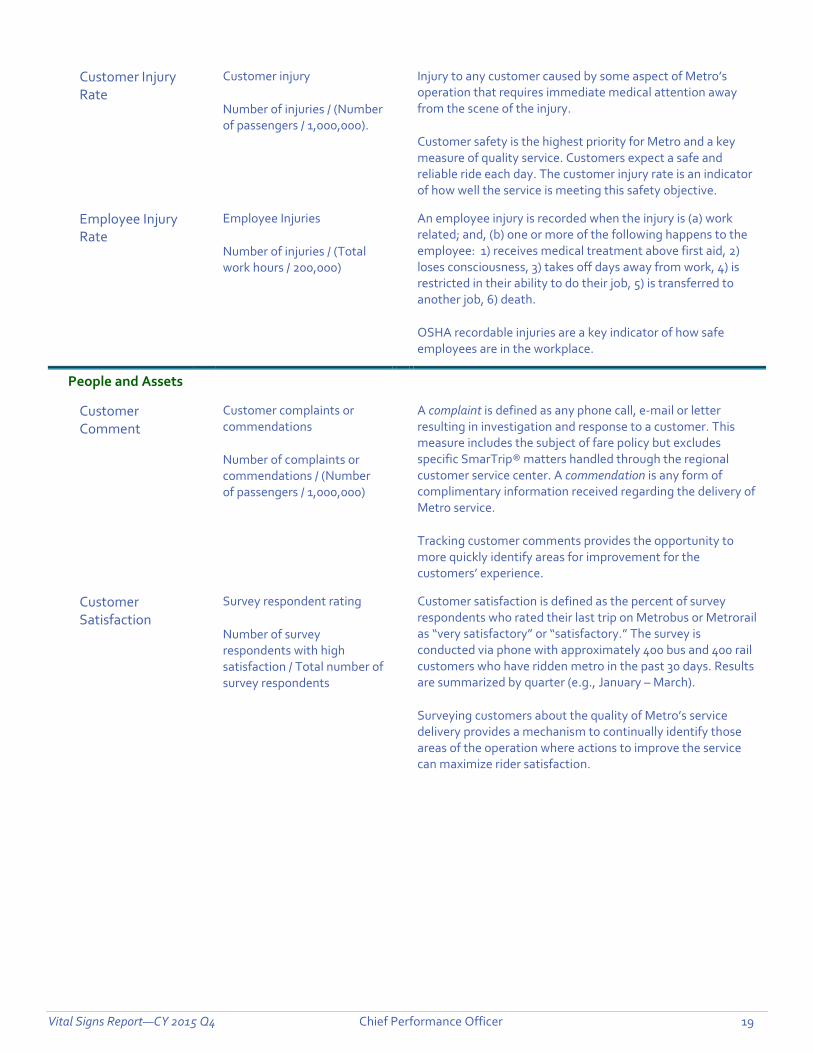
Customer Injury Rate
Customer injury Number of injuries / (Number of passengers / 1,000,000).
Injury to any customer caused by some aspect of Metro’s operation that requires immediate medical attention away from the scene of the injury. Customer safety is the highest priority for Metro and a key measure of quality service. Customers expect a safe and reliable ride each day. The customer injury rate is an indicator of how well the service is meeting this safety objective.
Employee Injury Rate
Employee Injuries Number of injuries / (Total work hours / 200,000)
An employee injury is recorded when the injury is (a) work related; and, (b) one or more of the following happens to the employee: 1) receives medical treatment above first aid, 2) loses consciousness, 3) takes off days away from work, 4) is restricted in their ability to do their job, 5) is transferred to another job, 6) death. OSHA recordable injuries are a key indicator of how safe employees are in the workplace.
People and Assets
Customer Comment
Customer complaints or commendations Number of complaints or commendations / (Number of passengers / 1,000,000)
A complaint is defined as any phone call, e-mail or letter resulting in investigation and response to a customer. This measure includes the subject of fare policy but excludes specific SmarTrip® matters handled through the regional customer service center. A commendation is any form of complimentary information received regarding the delivery of Metro service. Tracking customer comments provides the opportunity to more quickly identify areas for improvement for the customers’ experience.
Customer Satisfaction
Survey respondent rating Number of survey respondents with high satisfaction / Total number of survey respondents
Customer satisfaction is defined as the percent of survey respondents who rated their last trip on Metrobus or Metrorail as “very satisfactory” or “satisfactory.” The survey is conducted via phone with approximately 400 bus and 400 rail customers who have ridden metro in the past 30 days. Results are summarized by quarter (e.g., January – March). Surveying customers about the quality of Metro’s service delivery provides a mechanism to continually identify those areas of the operation where actions to improve the service can maximize rider satisfaction.

20 Chief Performance Officer Vital Signs Report —CY 2015 Q4
Communities
Rail Passengers Per Car
Number of rail passengers Total passengers observed on-board trains passing through a station during a rush hour / Actual number of cars passing through the same station during the rush hour Counts are taken at select stations where passenger loads are the highest and in the predominant flow direction of travel on one to two dates each month (from 6 AM to 10 AM and from 3 PM to 7 PM). In order to represent an average day, counts are normalized with rush ridership.
The Board of Directors has established Board standards of rail passengers per car to measure railcar crowding. Car crowding informs decision making regarding asset investments and scheduling. Additional Board standards have been set for:
• Hours of service – the Metrorail system is open to service customers
• Headway – Scheduled time interval between trains during normal weekday service
Growth Near Transit
Planning office research has identified thresholds for both household and employment density1 – both urban and suburban contexts2 – that will sufficiently support new rail extensions. These thresholds have been applied to existing stations3 with the results shown for the percent of stations in a jurisdiction that meet either the households or jobs threshold. 1 Household density: Urban >=15 hh/ac, Suburban >=12 hh/ac; Employment density: Urban >=75 jobs/ac, Suburban >=19 jobs/ac 2 Stations categorized using MWCOG cordons for urban (core) vs. suburban (non-core) 3 For this metric the following stations are excluded: Arlington Cemetery, Pentagon, and Ronald Reagan Washington National Airport.
Rail Station Walk Score
Metro uses 63.7percent, which is the maximum area within a circular radius that a rectilinear street grid can cover, to designate a high-performing walkshed. A walkshed can be expanded by providing new pedestrian infrastructure beyond the walkshed edges. This metric measures the progress toward the 63.7 percent coverage ratio on a jurisdictional level.1 1 For this metric the following stations are excluded: Arlington Cemetery, Pentagon, and Ronald Reagan Washington National Airport.

Vital Signs Report—CY 2015 Q4 Chief Performance Officer 21
Glossary of Terms Action – Specific and discrete steps taken that move the organization toward achieving the Strategic Goals. Key Performance Indicator (KPI) – A quantifiable measure externally reported that tracks progress toward achieving the Board adopted Strategic Goals. Mission – Overarching purpose of the organization. Performance Management Framework – An organizational process and culture that values measurement as a tool to deliver results. Performance Measure – A quantifiable measure generally tracked internally as a management tool to gauge progress being made. Strategic Goal – Adopted by the Board to provide direction that aligns the organization to attain the mission. Target – End point or direction for performance measures and KPI’s. Targets define success. Vision – Desired outcome for the organization.

22 Chief Performance Officer Vital Signs — 2015 Annual Report
Performance Data 2015
KPI: Bus On-Time Performance [Target 79%]
Jan Feb Mar Apr May Jun Jul Aug Sep Oct Nov Dec YTD
CY 2013 78.8% 79.4% 78.4% 76.5% 75.6% 75.5% n/a n/a n/a n/a n/a n/a 77.4%CY 2014 80.4% 78.4% 78.2% 77.6% 76.9% 77.8% 78.7% 78.5% 76.0% 75.7% 77.9% 78.4% 77.9%CY 2015 79.9% 78.9% 77.2% 76.8% 75.6% 77.3% 79.1% 80.4% 76.2% 75.6% 76.8% 78.4% 77.7%
KPI: Bus Fleet Reliability (Bus Mean Distance Between Failures) [Target 8,000 Miles]
Jan Feb Mar Apr May Jun Jul Aug Sep Oct Nov Dec YTD
CY 2013 9,008 9,783 8,883 7,918 9,060 6,917 7,553 8,260 7,972 7,342 9,226 8,923 8,309CY 2014 5,879 7,291 7,778 7,648 6,773 7,313 7,095 7,911 6,954 8,027 8,440 7,670 7,337CY 2015 6,259 7,434 6,109 7,016 6,405 7,328 6,499 7,327 7,542 7,307 9,166 7,891 7,103
Bus Fleet Reliability (Bus Mean Distance Between Failure by Fleet Type)
Jan Feb Mar Apr May Jun Jul Aug Sep Oct Nov Dec YTD
CNG 5,240 7,262 5,804 7,064 5,480 6,825 5,925 6,780 6,559 6,390 9,182 5,226 6,351 Hybrid 7,045 7,663 6,539 7,823 7,911 8,142 8,002 9,261 9,286 9,604 11,242 11,445 8,431 Clean Diesel 8,557 9,450 6,666 9,082 6,849 7,472 5,919 6,616 6,734 6,076 8,693 8,074 7,305 All Other 3,816 4,456 3,815 2,595 2,650 4,392 2,914 2,679 3,887 3,006 2,965 3,935 3,324
KPI: Rail On-Time Performance [Target 91%]
Jan Feb Mar Apr May Jun Jul Aug Sep Oct Nov Dec YTD
CY 2013 92.3% 92.2% 92.1% 92.4% 91.9% 91.5% 91.7% 92.7% 92.4% 92.2% 90.3% 92.3% 92.0%CY 2014 89.2% 92.0% 90.4% 92.0% 91.7% 91.2% 92.2% 89.7% 90.7% 90.1% 88.4% 89.7% 90.6%CY 2015 87.3% 83.9% 88.5% 89.9% 87.0% 84.6% 84.4% 82.8% 78.9% 75.6% 80.1% 82.3% 84.0%
Rail On-Time Performance by Line
Jan Feb Mar Apr May Jun Jul Aug Sep Oct Nov Dec YTD
Red Line 89.8% 85.3% 92.1% 90.3% 88.6% 85.8% 87.2% 81.7% 81.8% 80.8% 84.2% 85.5% 89.3%Blue Line 86.8% 81.8% 85.2% 89.4% 84.1% 84.6% 83.8% 81.8% 73.3% 76.6% 81.0% 74.7% 84.7%Orange Line 84.6% 82.0% 85.4% 88.6% 83.6% 79.1% 75.7% 77.1% 68.2% 55.9% 67.2% 74.1% 84.1%Green Line 85.0% 82.8% 86.2% 88.5% 86.9% 83.2% 86.0% 86.4% 85.7% 87.2% 86.5% 88.8% 84.8%Yellow Line 92.7% 89.4% 92.7% 94.4% 94.6% 93.9% 93.6% 93.7% 91.4% 91.1% 93.2% 93.0% 91.7%Silver Line 84.1% 82.1% 86.0% 88.8% 84.3% 82.8% 80.8% 80.2% 71.8% 58.1% 68.2% 74.0% 84.2%
* Per page 16, bus fleet reliability is calculated by dividing total bus miles by number of failures. Miles for June 2015 are slightly overstated because they include bus mileage that had not been accurately reflected in prior months due to mechanical issues with hubdometers, the system used to collect mileage data. These issues were resolved during June 2015.

Vital Signs Report—CY 2015 Q4 Chief Performance Officer 23
Performance Data 2015
Rail On-Time Performance by Time PeriodJan Feb Mar Apr May Jun Jul Aug Sep Oct Nov Dec YTD
AM Rush 82.3% 77.8% 83.4% 86.1% 84.6% 80.2% 78.8% 78.5% 75.0% 72.0% 74.9% 78.6% 79.6%Mid-day 94.3% 92.6% 95.1% 95.9% 92.9% 93.7% 93.7% 89.1% 85.2% 81.6% 89.2% 88.9% 91.3%PM Rush 83.5% 78.5% 84.8% 86.0% 82.0% 77.2% 77.7% 78.6% 73.2% 70.4% 72.8% 77.3% 78.8%Evening 94.1% 93.2% 96.4% 98.1% 94.6% 95.3% 95.5% 93.8% 92.6% 91.5% 93.0% 93.2% 94.4%
KPI: Rail Fleet Reliability (Rail Mean Distance Between Delays by Railcar Series) [Target 65,000 miles]
Jan Feb Mar Apr May Jun Jul Aug Sep Oct Nov Dec YTD
CY 2013 67,500 71,323 71,225 64,890 62,418 61,745 51,757 69,230 75,697 61,959 51,248 63,468 63,624CY 2014 44,530 66,600 63,127 77,957 64,848 55,522 84,627 65,042 73,150 89,891 63,436 61,000 65,958CY 2015 53,784 41,558 63,588 60,242 69,260 54,779 56,446 59,196 60,872 65,900 63,564 51,599 57,528
KPI: Rail Fleet Reliability (Rail Mean Distance Between Delays by Railcar Series)
Jan Feb Mar Apr May Jun Jul Aug Sep Oct Nov Dec YTD
1000 series 59,925 34,472 69,876 57,157 47,409 46,458 51,763 57,580 56,702 50,451 54,553 52,703 52,120 2000/3000 series 71,595 56,046 83,615 106,406 157,484 70,185 92,959 72,319 83,487 85,534 99,874 78,183 83,171 4000 series 22,973 18,894 26,103 20,208 29,239 11,800 22,910 39,273 21,209 25,413 23,543 20,521 22,961 5000 series 36,136 36,844 70,401 45,923 49,013 50,925 34,685 38,798 45,332 59,782 41,300 32,701 43,243 6000 series 95,297 64,816 61,007 84,083 124,325 89,370 106,428 98,851 164,737 205,761 202,484 112,794 101,547 7000 series 14,902 18,439 30,874 70,202 54,928 34,860 34,973 36,067
Rail Fleet Availability (Target: 85%)Jan Feb Mar Apr May Jun Jul Aug Sep Oct Nov Dec YTD
CY 2013 88% 86% 86% 86% 85% 84% 84% 86% 85% 85% 83% 87% 85%CY 2014 84% 85% 84% 85% 84% 85% 86% 87% 88% 88% 87% 87% 86%CY 2015 87% 84% 86% 87% 84% 79% 80% 80% 82% 83% 81% 81% 83%

24 Chief Performance Officer Vital Signs — 2015 Annual Report
Performance Data 2015
KPI: MetroAccess On-time Performance [Target 92%]
Jan Feb Mar Apr May Jun Jul Aug Sep Oct Nov Dec YTD
CY 2013 93.3% 92.3% 92.6% 91.6% 91.9% 89.9% 91.3% 92.9% 90.6% 91.2% 91.1% 92.5% 91.8%CY 2014 93.3% 90.2% 92.5% 91.1% 92.3% 92.4% 92.6% 92.8% 91.8% 91.9% 91.5% 92.2% 92.1%CY 2015 93.0% 89.1% 89.4% 92.0% 92.9% 93.5% 94.8% 94.7% 93.9% 93.0% 93.4% 93.7% 92.8%
KPI: Escalator System Availability [Target 91%]
Jan Feb Mar Apr May Jun Jul Aug Sep Oct Nov Dec YTD
CY 2013 88.6% 89.4% 89.3% 90.0% 90.7% 90.6% 89.9% 87.6% 86.8% 88.4% 90.4% 90.8% 92.1%CY 2014 93.0% 93.6% 93.6% 92.6% 92.3% 93.1% 92.9% 92.7% 93.0% 93.8% 93.8% 93.2% 93.1%CY 2015 93.1% 93.9% 94.1% 93.5% 93.7% 93.3% 92.9% 93.3% 93.4% 92.7% 93.2% 93.3% 93.4%
KPI: Elevator System Availability [Target 96.5%]
Jan Feb Mar Apr May Jun Jul Aug Sep Oct Nov Dec YTD
CY 2013 95.7% 96.6% 96.5% 96.5% 97.3% 98.0% 97.0% 97.5% 97.2% 97.4% 96.9% 97.5% 96.4%CY 2014 97.4% 96.6% 97.3% 97.2% 97.6% 97.0% 97.2% 96.8% 96.3% 96.0% 96.7% 96.2% 97.0%CY 2015 96.8% 97.4% 97.9% 97.1% 96.5% 96.1% 96.7% 97.4% 96.4% 96.4% 96.4% 97.2% 96.9%
Customer Satisfaction RatingQ1/2013 Q2/2013 Q3/2013 Q4/2013 Q1/2014 Q2/2014 Q3/2014 Q4/2014 Q1/2015 Q2/2015 Q3/2015 Q4/2015
Metrobus 82% 82% 81% 76% 78% 79% 81% 78% 78% 75% 82% 81%Metrorail 84% 86% 84% 76% 80% 80% 77% 82% 74% 73% 67% 69%
KPI: Customer Commendation Rate (per million passengers) Jan Feb Mar Apr May Jun Jul Aug Sep Oct Nov Dec YTD
CY 2013 6.6 6.4 5.9 7.0 6.2 6.4 7.3 6.1 5.0 6.7 5.9 4.6 6.2CY 2014 7.0 6.0 6.6 5.2 7.2 7.3 6.7 7.0 6.6 5.4 5.6 5.7 6.4CY 2015 5.2 6.4 6.6 5.2 6.4 5.6 6.7 6.0 5.3 6.0 6.4 6.7 6.0
KPI: Customer Complaint Rate (per million passengers) Jan Feb Mar Apr May Jun Jul Aug Sep Oct Nov Dec YTD
CY 2013 84 73 74 74 76 79 90 81 82 81 113 74 82CY 2014 92 88 74 81 79 83 90 84 96 89 71 69 83CY 2015 82 82 65 69 89 88 86 88 112 80 81 85 84

Vital Signs Report—CY 2015 Q4 Chief Performance Officer 25
Performance Data 2015
KPI: Customer Injury Rate (per million passengers) [Target 1.8]
Jan Feb Mar Apr May Jun Jul Aug Sep Oct Nov Dec YTD
CY 2013 1.88 1.49 1.84 2.60 1.78 2.05 1.46 1.98 2.23 2.39 1.68 1.59 1.92CY 2014 3.01 1.90 1.51 1.53 2.19 1.63 1.74 1.47 2.95 1.53 1.86 2.42 1.96CY 2015 5.19 1.70 2.22 2.49 1.70 1.61 0.81 2.53 1.70 2.05 1.37 1.35 2.04*Includes Metrobus, Metrorail, rail transit facilities (stations, escalators and parking facilities) and MetroAccess customer injuries
KPI: Employee Injury Rate (per 200,000 hours) -- Target = < 4.6 injuries per 200,000 hours
Jan Feb Mar Apr May Jun Jul Aug Sep Oct Nov Dec YTD
CY 2013 4.45 5.74 5.09 6.00 3.89 5.28 5.09 4.95 4.31 3.74 5.09 4.26 4.81CY 2014 4.09 5.45 4.49 4.57 3.89 3.77 4.24 4.31 4.50 3.29 3.92 3.99 4.20CY 2015 8.69 6.35 5.95 5.56 4.95 4.86 5.15 6.13 3.72 4.91 4.28 3.73 5.35
KPI: Crimes [Target 1,900]
Jan Feb Mar Apr May Jun Jul Aug Sep Oct Nov Dec
CY 2013 149.0 290.0 410.0 560.0 795.0 998.0 1202.0 1430.0 1647.0 1859.0 2011.0 2098.0CY 2014 104.0 179.0 274.0 395.0 552.0 717.0 865.0 1037.0 1189.0 1337.0 1449.0 1562.0CY 2015 109.0 193.0 296.0 413.0 580.0 730.0 874.0 1027.0 1196.0 1395.0 1529.0 1646.0
Crimes by Type
Jan Feb Mar Apr May Jun Jul Aug Sep Oct Nov Dec YTD
Robbery 32 19 20 36 37 27 30 24 32 40 48 34 379Larceny (Snatch/Pickpocket) 31 34 31 23 34 41 37 20 31 32 34 29 377Larceny (Other) 32 22 37 38 75 73 64 91 86 106 40 34 698Motor Vehicle Theft 2 0 0 7 5 5 4 5 5 8 4 5 50Attempted M V Theft 1 2 3 2 4 1 3 4 1 3 1 1 26Aggravated Assault 11 6 12 11 12 3 6 9 14 10 7 14 115Rape 0 0 0 0 0 0 0 0 0 0 0 0 0Burglary 0 0 0 0 0 0 0 0 0 0 0 0 0Homicide 0 0 0 0 0 0 0 0 0 0 0 0 0Arson 0 1 0 0 0 0 0 0 0 0 0 0 12015 Part1 Crimes 109 84 103 117 167 150 144 153 169 199 134 117 1,646
Crimes are reported as a cummulative number; therefore monthly data is reflective of the year-to-date total.

26 Chief Performance Officer Vital Signs — 2015 Annual Report
Performance Data 2015
DBE Awards/Commitments for FFY15
AWARDS/COMMITMENTS MADE (total contracts and subcontracts committed)
Totals Dollars Total NumberTotal to DBEs
(dollars)Total to DBEs
(number)Total to DBEs/Race Conscious (dollars)
Total to DBEs/Race Conscious (number)
Total to DBEs/Race Neutral (dollars)
Total to DBEs/Race
Neutral (number)
Percentage of Total Dollars to DBEs
Prime Contracts Awarded this Period $72,120,043 49 $8,214,795 5 - - 8,214,795 5 11.39%
Subcontracts awarded/committed this period 4,071,373 14 4,071,373 14 4,071,373 14 - - 100.00%
Total $76,191,416 63 $12,286,168 19 $4,071,373 14 $8,214,795 5 17.04%
DBE FFY15 Completed Contracts Payments
# Contracts Completed
Total Completed
Contracts Value
DBE Participation Needed to Meet
Goal (Dollars)
Total DBE Participation
(Dollars) Percent to DBEs
Race Conscious 6 $28,228,064 $4,295,593 $6,940,899 25%
Race Neutral 10 142,391,716 - 120,181,033 84%
Totals 16 $170,619,780 $4,295,593 $127,121,932 75%