operations reporting systems global data … training...corporate & franchise oars operations...
TRANSCRIPT

Corporate & Franchise OARS Operations Reporting Systems Global Data Management June 2015 CUBUS Outperform EV Analytics

Page 2 of 54
Table of Contents ............................................................................................................................................................................... Table of Contents ................................................................................................................................................. 2 Essbase / OARS .................................................................................................. Error! Bookmark not defined.
Accessing OARS ............................................................................................................................................. 3 Defining OARS................................................................................................................................................ 3 What is a dimension ......................................................................................................................................... 4 Commonly used views ..................................................................................................................................... 5
Customizing Views .............................................................................................................................................. 5 Adding and / or removing data from a view .................................................................................................... 5 Using Find / Select ........................................................................................................................................... 6 Adding dates to a view..................................................................................................................................... 9 Adding stores to a view ................................................................................................................................... 9 Alternative Method of changing selected data measures............................................................................... 11 Switching Columns to Rows.......................................................................................................................... 11 Drilling down on a view ................................................................................................................................ 12 Turn off automatic refresh to save time ......................................................................................................... 13 Using suppress zeroes / no data ..................................................................................................................... 14 Traffic Light feature....................................................................................................................................... 17 Sort Feature .................................................................................................................................................... 19 Graph Feature ................................................................................................................................................ 20 Printing, saving and emailing data from views.............................................................................................. 22
Exporting to Excel ............................................................................................................................................. 23 Saving a custom view ........................................................................................................................................ 27 Advanced Features ............................................................................................................................................. 32
Using a calculator to compute averages ........................................................................................................ 32 Compute special time periods ........................................................................................................................ 36 Special features – delivered functions and relativity ..................................................................................... 38 Calculations with relativity ............................................................................................................................ 40 Trending a particular day of the week ........................................................................................................... 42
Using Menu Mix application ............................................................................................................................. 46 4 Dimensions vs. 3 ......................................................................................................................................... 46 Products vs. No Products ............................................................................................................................... 48 Pizzas ............................................................................................................................................................. 49 Speciality Pizzas ............................................................................................................................................ 50 Topped Pizzas ................................................................................................................................................ 51 Drinks / Beverages ......................................................................................................................................... 52 Extras ............................................................................................................................................................. 53

Page 3 of 54
Operations Analytic Reporting System (OARS) The primary function of OARS is to provide sales, transaction and service metrics on a timely basis to operators. OARS is supported by three technologies. First, relational databases store collected data from the store POS, Online, and other transactional systems. Second, the data is migrated to OLAP databases that store and consolidate the data across multiple dimensions. Finally, CUBUS Outperform EV Analytics© is the outward facing technology used to share the data on the web. The data in OARS is only as good as the data in your stores. If data is incorrect in your POS, then the bad data will be reflected in OARS the following day. This data cannot be updated in either system. OARS is loads the previous 14 days of history each day. If the data was corrected in OARS it would revert back to the bad data during the next load.
Accessing OARS OARS is accessed by Corporate employees most commonly through www.papalink.net. After connecting to your internet provider and launching Internet Explorer, enter the web address of www.papalink.net in your browser screen and press enter. Enter your name and password as assigned by the papalink administration team. Under the main menu on papalink.net, you will find the link called OARS/VBO Access, pictured below.
. Click on this link to find the following options:
Defining OARS Known as the Operations Analysis and Reporting System, OARS is a one stop shop for a variety of information related to restaurant performance. 90% or more of the information found in OARS is from the restaurant’s polling files. Other sources include Snapshot mystery shopper data, People Soft HR (turnover data) and Hyperion Enterprise (financial performance). The data used on OARS is delivered via a Web Application called Cubus©. Basic help using the tool can be found by accessing the Help button on the main page. This training document will reference the Cubus User Manual.

Page 4 of 54
What is a dimension Data is organized by what is called a dimension. Most data included in Essbase / OARS is organized into three dimensions. Each dimension contains members that represent a data element or a group of data elements. OARS on Essbase uses these dimensions - organized into columns, rows, etc. to create views or reports of the data.
1. Time-- This dimension contains the organization of days into weeks, periods, quarters and years. At this time the corporate calendar is used to define weeks and periods into quarters -- each quarter has three periods or thirteen weeks. The three periods are weeks grouped by 4-4-5. The standard views show the current day (previous day polled), week, period, quarter and year. To select a different time period, click on the time member. This will display the outline for the time dimension. Select the desired time period and click OK.
2. Measures-- This dimension contains all the various data measures (aka indicators) that we currently poll from the restaurants. They are grouped into multiple categories such as, Sales, Controllable Measures, The Customer Experience, etc. Measures are typically found in the rows on each view. Views are constantly being updated as business focus changes and new measures are identified. To select additional or different measures, not found in a standard view, click on any of the measures. This will display the outline for the measures dimension. Select the desired measure(s) and click OK. For a definition of the calculation of each measure, hold your mouse over the measure. A dialog box will appear with the Essbase calculation. For example, if you hover over the measure “Target Food %”, you will see that it is Target Food as a percent of Net Sales.
3. Restaurants-- This dimension contains the organization of your restaurants as defined by the Domestic Operations Organizational Structure for OARS. In Franchise OARS (a.k.a. Toolkit) the restaurants are grouped as defined by the Franchise Owners / Operating Partners when they sign up for Franchise OARS. Security as to what restaurants are visible to each user is defined by Operations Sr. Management for Corporate users and the Franchise Owner for Franchise operations users.
Other dimensions on specific databases include:
• Blended – This dimension is used to identify Domestic, International and Corporate or Franchise as of a point in time. For example, a store that is closed or has been divested or acquired will change positions in the restaurant section of the outline, however it will retain its status using the blended dimension to allow store details to be associated with the appropriate organization.
• DMA Dimension – This is an attribute dimension that assigns stores to a specific DMA. It can be used to slice data across DMA’s.
• Franchisee – This is also an attribute dimension. It is used to view data associated with a specific Franchisee.
• Products – This dimension refers to the products sold. See the page 43 regarding Menumix.
• Currency – This dimension is used to separate Local and USD currency types. Currency is only converted from local to USD. Data is converted from USD to any other currency.
Most views in OARS are made up of three components displayed in columns or rows. Views can be grouped in folders.
o Columns -These are the data elements that are displayed across the top of the view. Most views are designed to show the restaurants in the columns and time in the columns.
o Rows -These are the data elements that are displayed down the left side of the view. Most

Page 5 of 54
views are designed to show the measures in the rows. o Views - Data elements are arranged to create a view of the information present in the
database. Several views can be stored in a folder. o Folders - Each folder may contain several views. Many folders will have separate views for
different time dimensions, (day, week, period, etc). Depending on the type of data, views may be based on areas or organizational groupings.
Commonly used views Standard views have been created to help the user find the information needed. These standard views are found in the “Shared Views” tab. They can be used as a starting point to create your own view and share with other users. Personalized, custom views can be saved in either the “Local Views” tab or the “My Views” folders.
Customizing Views
Adding and / or removing data from a view When choosing an existing view, please be aware that several data elements, not in the delivered view, may be available to you. Below is an example of data being added to the delivered Sales view. Left click in the left column where measures, or data elements, are typically listed. The data elements highlighted in the outline below are included in the current view. Any or all of the other data elements or measures not highlighted are available to be included in the current view. Click on the + symbol to expand and see even more measures available.

Page 6 of 54
To add a measure to the view, click on the name to highlight it. To remove or exclude a measure from a view, if it is highlighted, click on the name so that it is no longer highlighted. Once you click OK, the additions and deletions from the view will be made. Please be aware that many of these measures are already provided in some of the other predefined views within the OARS folder structure. You may modify any of the existing views and save them as your own custom views / folders. Saving custom views is discussed in detail in this document.
Using Find / Select Perhaps the data element you want to add is not easily apparent in the outline. To find the data element you are looking for, you can use the Find / Select feature. This feature is also helpful when you are looking for a particular store or roll up in the outline. Once you left click in the left column to see additional measures available, you will notice at the bottom of the list of measures is a button labeled Find…

Page 7 of 54
Click on the Find… button. The Find Members screen pictured below will appear.
First, notice the various options that are available. Under Members you can choose to select from all members in the outline or only the currently selected members.
Under Match, you have the option to search for a Member Name or Alias Name. Most times those are the same, however, know that for restaurants the member name is a six digit zero filled number, for example, “000321”, and the alias name is the store number, for example, “321”. We will skip the attribute and generation / levels options because they would rarely be used by the average user. Finally, under How, you have the options of choosing a match that will contain the character string entered into other search window, an exact match to what is entered in the search window, or data measures starting with or ending with the character string entered into the search window. For an example, let’s search for an Member name with the exact match of “000001”. Modify the Find Member screen to appear as below and click on Find.
Notice the found member, store 1, is now bolded, as displayed below. The outline was expanded automatically to show you the location of the found member. This will help you decide if it is what you were expecting or not. (Notice that the outline displays the alias of “1” while the member searched for was “000001”.)

Page 8 of 54
From the search window, choose your desired action. You may Select the member, or if desired, De-select the member. Find the Next member or Find All members that match the entered criteria. Choosing the Keep Found button will by default deselect any other measures already selected that are not in the search criteria. Care should be taken with that option. When you have chosen your desired action, typically you will choose Select, you may opt to Find another item by changing the criteria in the search window, or you may click on the Close button to close the Find Members window.

Page 9 of 54
Adding dates to a view Many standard views default to the prior day, current week or other date that is fairly recent. You may change the date to a different time period, or perhaps add a date to compare to the default date on the view. To make the change, click on the green area where the date displays.
The outline will appear where all dates are stored. Expand the outline until you reach the date you wish to add to the view. Click on any date or several dates, as desired.
When finished, click OK. The view will now appear as follows:
Adding stores to a view Adding stores, works in much the same way. Using the prior view, click in the green area where “Traditional” is displayed. Traditional represents a roll up of all stores.
Page 10 of 54
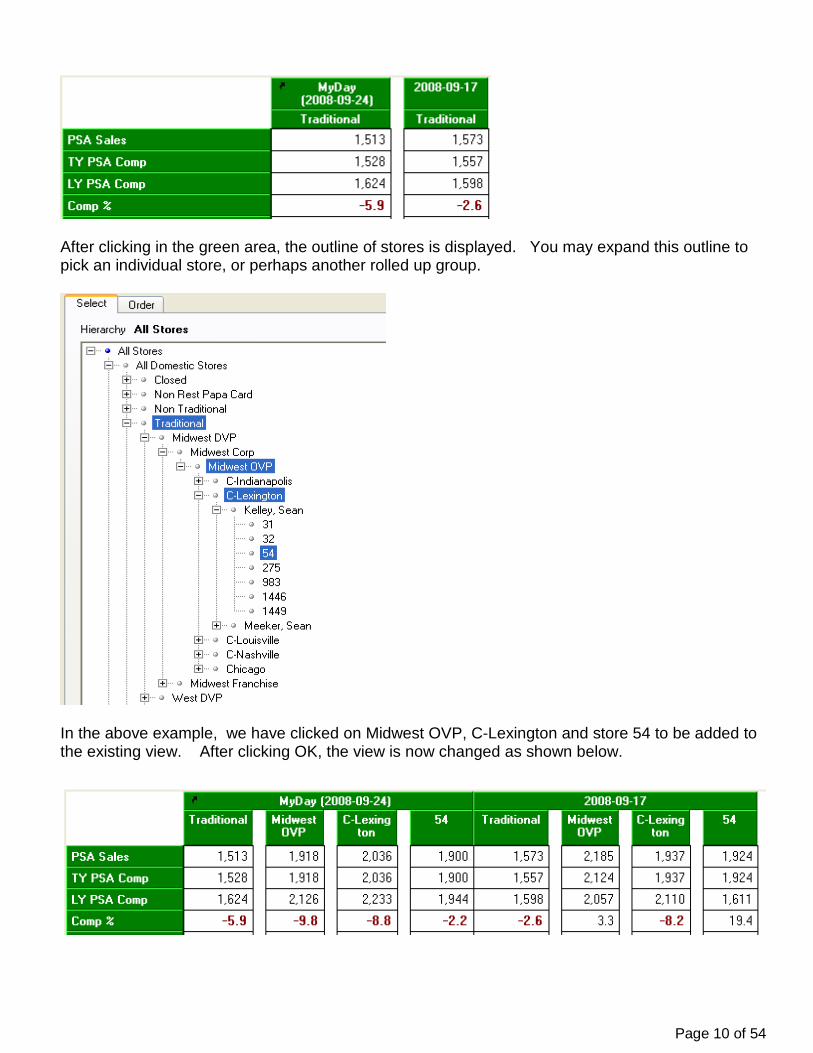
After clicking in the green area, the outline of stores is displayed. You may expand this outline to pick an individual store, or perhaps another rolled up group.
In the above example, we have clicked on Midwest OVP, C-Lexington and store 54 to be added to the existing view. After clicking OK, the view is now changed as shown below.

Page 11 of 54
Alternative Method of changing selected data measures Data measures are typically found in the left column of the view. Right click on the measure you would like to keep. In this example, “Comp% “ is the measure we want to keep on our view. Now select the “Keep only Comp %” from the menu. The view now lists Comp% in the rows, and the various details of your organization outline on the left, such as individual restaurants or restaurant groupings.
Conversely, we could have selected “Deselect Comp%” and all data measures would remain except Comp% which has been deselected.
Switching Columns to Rows
To move the restaurants to the rows and Comp % to the column, simply left click on the Comp % measure, drag it to the restaurant dimension level until you see the mouse take on a symbol similar
to two circling arrows. The appearance of this graphic gives you the indication that the data elements are going to switch places.

Page 12 of 54
Release the mouse button and the view will display as follows:
(Restaurant numbers are masked for privacy.)
Drilling down on a view Most views display summary data only. Each dimension can be drilled on for further detail. At any level, hover your mouse on the right side of the box. You will see an up arrow, a down arrow, or both. The down arrow indicates there is more detail below the current measure. While an up arrow, indicates that a more summarized level of data is available above the current selection.
Time --You can drill down through the week to see each individual day, or through the period to see each individual week, or through the quarter to see each individual period, etc. to the day level – the most detailed level available in this application.
Measures -- Some measures have detail below them. For example, Net Sales. Net sales is a calculation based on Total Sales less Sales Tax less Alternate Sales Tax less Total Bottle Deposits When you drill (click) on the down arrow displayed below:
The underlying detail measures are displayed:
Comp %, once in the row is now in the column. Restaurant groups are now in the row vs. column.

Page 13 of 54
Restaurants -- The initial view will display one column that is a summary for all the restaurants in your group. You can drill down through the various levels in your restaurant organization by clicking on the drill down arrow on the restaurant group text. The drill down and drill up buttons appear when you hold your mouse over the restaurant group field. TIP: If at any time you have drilled or modified a view to the point where you are confused, simply hit the ‘Undo’ button as many times as it takes to bring you back to the original screen.
Turn off automatic refresh to save time If you have several changes to make, it may be more efficient to turn off the automatic refresh and recalculate the data after all changes are made. This is particularly important when you have several restaurants or several time periods you are wishing to analyze. Right click in the white area of the view. The following window appears.
Choose Options at the bottom of the window. The Options window appears.

Page 14 of 54
Default Remove Default The default is to automatically retrieve or refresh data when changes are made to views. Click off the check box next to Automatically Retrieve Data. Click OK. After your first change to the view, a new button has appeared, reminding you that you need to refresh your data. Also notice that the white area where numbers normally appear is blank.
Click on the Get Data button to refresh your information, once all desired changes are made. .
Using suppress zeroes / no data Many times, we are looking at various pieces of information and find that it would be so much easier to see if the view showed only information where a value exists. For example, in the menu mix views, your restaurants may not sell all the items available to be sold. In the example below, suppose we want to hide the row for the data measure, Slice, because none of our restaurants sell pizza by the slice.

Page 15 of 54
There are two methods of getting to Options. First is to click on the arrow button on the tool bar. Secondly, you can hover your mouse in the white area of the book, or the place where numbers typically appear. Right click and the window below appears. Click on Options. In the Options window, click in the check boxes next to Suppress Zeroes and Suppress Missing Data. Notice, you may do this for either columns, rows or both. The screen below shows both options chosen.

Page 16 of 54
Click OK. The view will now look like the following:
Having data take up less space makes it easier to read and easier to use in another application. However, take caution if you are exporting data for use in an Excel master file or template on which other analyses are built. Suppressing rows or columns may result in different data measures on different rows during different time periods, which may in turn cause incorrect data to be captured in existing macros. Another example would be when exporting data into the business plan model that the OSST team has created for franchise business partners. If you make any changes to your book before exporting into Excel, the data elements will not match with the Excel file.

Page 17 of 54
Traffic Light feature You may have already noticed on many views, that the numbers less than zero are displayed in bold, red font if they are below zero. You can add additional visual effects by using the traffic light feature. In the following example, we are going to choose different formatting for comp% above 10 and below 2. Hover your mouse on top of the Comp % measure and right click. Choose Traffic Lights from the available options. When Traffic Lights is chosen, the following window appears.
Enter into the less than text box, a value of 2. In the Text Color, click on the down arrow and choose a color. If desired, choose a different background color by clicking on the down arrow next
to Back Color. Notice you have a drop down box next to Less, indicating there are more options there as well. Enter into the greater than text box, a value of 10. In the Text Color, click on the down arrow and choose a color. If desired, choose a different background color by clicking on the down arrow next to Back Color. For example purposes, we’ve chosen a text of red and a background of yellow for any values less than 2 and a text color of dark green with no change in background for any values over 10. Click OK.

Page 18 of 54
The display now appears as follows: Green values above 10 and Yellow background, red font less than 2. (Restaurant numbers are masked for privacy.) Notice that values between the designated 2 and 10 are unchanged. You may choose many options using the traffic light feature, including actual traffic light colors by clicking on the Text Color box in the top right hand corner of the traffic light window above.

Page 19 of 54
Sort Feature
The sort feature is available on any measure. The sort option can be found on the Member Tab. Sorting may be done in either ascending or descending order. Click on the Sort Select button. The following window will appear:
Data measures can be sorted by row or by column.
Select a data measure by clicking on the measure name in the row or column heading. Using the previous example, click on the Comp % measure and then click on the Sort option radio button, Descending. Next Click OK.

Page 20 of 54
The sort results are as follows: (restaurant numbers are masked for privacy)
Graph Feature Any view can also be turned into a chart. Once you have the data aligned as you wish, simply click on the Layout Tab. It is suggested to keep the number of data elements to a minimum so the chart can be easily interpreted.
By clicking on the BarChart button , this table of data………
……..becomes this chart. (Restaurant numbers are masked for privacy.)
Click back on the Table button and the raw data view returns.

Page 21 of 54
Click on the Both button to see both the data and the chart simultaneously. Using the Both button also maintains the regular functionality of the table view. You may add or delete data from the view, move columns to rows, etc. and the chart will change with you, which is a great feature of OARS.
Click on the down arrow on the Bar chart button to see all other charting options available. Charts, like any data view, can be saved in custom views. In addition, you may copy a chart into another application such as Excel, PowerPoint or Word.

Page 22 of 54
Printing, saving and emailing data from views
First click on the Print Button . The Print window allows the option of printing to a local or network printer, saving the file as a .pdf, or emailing the file as a .pdf. Note that .pdf is typically viewed in Adobe Acrobat. A free, read only version of Adobe Acrobat software is found on the web at www.adobe.com.
Offices using the Microsoft Outlook or Lotus Notes systems for email will find that once you click on the Email as PDF button, the file is moved into your email as a new email to be sent and the PDF version of the view is an attachment. Simply enter the address of the recipient and hit the send button. If you use other email tools, you may simply save the file and then attach it manually through your email system as you would any other file attachment.
Print a view Save a view as a .pdf file Email a view as a .pdf file

Page 23 of 54
Exporting to Excel A view is a single page. The names of the views are on the tab now found at the top of the page. On Cubus, a group of views is saved in a folder. (Previous versions of EV showed the tab at the bottom of the view.)
While the mouse is hovered over the tab name, right click for the following options to appear.
Three options can be chosen here for copying information into Excel:
a. Export to Excel Workbook b. Copy to Clipboard c. Copy with Headers

Page 24 of 54
Export to Excel Workbook When choosing this option, the following window appears.
Choose This View from the Views drop down box if you only want the current view. If you want all views, select the All Views option in the box and click Export.
You also have the option of ignoring all formatting when exporting using this function. Unmark the Formatting check box. The following window will appear to allow you to choose where to save the workbook you are exporting:
Be sure to save the workbook in your desired directory location. You may also change the name of the workbook if desired.

Page 25 of 54
Open the workbook by going to Excel and doing File Open as you would any other Excel workbook.
Copy to Clipboard If the second option is chosen, copy to clipboard, data will be copied to the operating system’s clipboard. The data can then be pasted into Excel or other application where the copy/paste function is available, for example Word or Notepad. The actual column and row headings are not included in what is copied to the clipboard. The results will appear as follows in Excel.

Page 26 of 54
Copy with Headers Makes a copy of the entire page, with row and column headings included, to the clipboard. Once you click on this option, the mouse will change into the shape of an hourglass. If your page is small, this may be barely noticeable. If your page is large, it will take a few moments for the hourglass to return to the regular mouse arrow button. Once the hourglass has changed to the regular mouse button, the copy is complete and data is ready to be pasted into Excel. The results can be pasted in other applications where the copy/paste function is available, for example Word or Notepad. Results will paste as follows into Excel. (Restaurant numbers are masked for privacy.)
After using Copy with Headers, it is important to adjust some formatting so you can use the information efficiently.
• Highlight the entire sheet by clicking in the upper most left square (above 1 and left of A)
• From the Tool bar select Format, Cells.
• Click on the Alignment tab.
• Uncheck the Wrap Text and Merge Cell check boxes
This will allow sorting, copying, grouping, and other functions that merged cells prevent.

Page 27 of 54
Saving a custom view Before saving a view, it is important to understand DynaSelect. DynaSelect is a feature of the
OARS tool that essentially works as a macro. Any time you see the small scroll type symbol at the far right of the view, it means a DynaSelect is being used to create that page.
If you fail to disable the DynaSelect before saving your custom view, any changes you make will be overwritten when the view is brought up again and the existing DynaSelect statement executes. DynaSelect is recommended for creating “dynamic” changes to your views. For example, you want the outline of your organization to always include any new restaurants that may open. When creating the part of the book where restaurants are chosen, make sure DynaSelect is on. If you are creating a stagnant view where you only want to see specific data elements and specific restaurants, you do not need to use DynaSelect. Since any keystrokes done during the time that DynaSelect is teaching are being recorded, these actions must execute every time the view is selected. Try to only record what is needed so that performance of your view is not hindered. An important thing to understand is any time a DynaSelect is being used, you must forget it (essentially remove the old dynamic actions), and re-teach it in order for any changes to take effect. DynaSelect steps:
1. Forget DynaSelect 2. Make any stagnant or fixed changes. 3. Teach DynaSelect 4. Make any “dynamic” changes that you want automatically updated. These would include
sorts or manual calculations or restaurant realignment changes, for example 5. Stop Teaching DynaSelect 6. Save your view in your preferred network or hard drive directory.
While it’s not necessary to go in this order, when creating a custom view, one may find the process flow more helpful. On the view you wish to customize for yourself and save, right click in the white area where numbers are found.

Page 28 of 54
1. From the pop up menu, click on DynaSelect and then Forget DynaSelect…
• A pop up box will ask you if you are sure, choose yes. 2. Before making any changes that require dynamic updating, you may make changes of a
stagnant nature before turning on DynaSelect. These types of changes would typically be restaurant level data elements / measures that you don’t expect to change often. For example, sales, orders, etc.
3. To begin teaching DynaSelect for the more dynamic data elements (such as restaurant alignments, sorts, manual calculations, etc.), right click in the middle of the view again.
• From the pop up menu, click on DynaSelect and then Teach DynaSelect… 4. Create your view as you prefer. (You are essentially recording a macro at this time that will
tell the view what you want to see the next time you bring it up.)
• When you have the view as you want it, right click in the middle of the view again. 5. From the pop up menu, click on DynaSelect and then Stop Teaching.
• After making any changes and stopping DynaSelect, it’s time to save your changes into a custom book.
6. Click on the Save View button.

Page 29 of 54
Change the View Name as desired. Clicking on the down arrow in the Location box will display 3 options.
Shared Views
My Views
Local Views
Only system administrators have the ability to save in Shared Views. If you attempt to save in that location the following message will appear.
Effective September 2009, both the My Views and Local Views options are available to all users. At the end of this section are some tips for converting views that may be saved in the local views tab at the time of the conversion. The Local Views will default to the hard drive of the PC you are using at the time you save the book. Typically the default directory is C:\Documents and Settings\<User_ Name>\ My Documents\My EV Views\<file name>. pvwx. Any time you are cleaning up your PC files, take care not to delete any saved books from your default directory. All saved views will have the .pvwx file extension. When views are saved to this directory, you can only retrieve them when you are working on the computer where the view is saved. The My Views option is tied to a user name vs. a specific computer. The views saved in this folder are actually stored on the server, so you can access those views from any computer where you are accessing OARS under the user name that saved the view. As with the previous version, you may group you’re My Views or your Local Views into folders for easier organization. Using the example above, you can click in the Folder box and give the folder the name Sales as pictured below. If this is the first time you’ve used the folder, you will be asked if you wish to create the folder.

Page 30 of 54
Click Yes. The view will show up in your Local Views tab under the folder created as shown below.
The My Views option works in much the same way. When opting to save a view, select from the drop down box, My Views, and enter a path / folder name in the Folder window.
In addition, as shown above, you can group your custom views in multiple folders if desired. The next time you sign on, you may choose views from the Shared Views, My Views or Local Views tab. Once saved, reopen your custom view to ensure you’ve saved what you intended. Conversion Procedure required for local views during Sept, 09 upgrade:

Page 31 of 54
You will need to convert your local views one at a time. From the Views dialog box… o Open the local views tab. o Select the view you wish to convert and click copy. o Open the new “My Views” tab and select paste. Your view is now in the database and is upgraded to the new version. Once the view has been upgraded, you can then copy it back to local views if that is your preference, or you need to share the file with a colleague via email or file share.

Page 32 of 54
Advanced Features
Using a calculator to compute averages Perhaps we’d like to see an average that may not be part of the existing data measures. Adding a calculation is done with the calculator icon provided on the Member Tab.
Pressing on the calculator button provides the following screen.
Simply pointing at the fields and the desired mathematical operators will create calculations. First to give your calculation some meaning, replace the “Name” with a descriptive name. For example, we’re going to calculate the average delivery charge per day on our view. Name is replaced with “Average Delivery Charge Per Day”
After highlighting the word Name and replacing it with a more meaningful description of the calculation you are performing, click your mouse in the calculator function area to create your calculation.

Page 33 of 54

Page 34 of 54
Next Click on Delivery Charge. Notice the data measure name changes colors and the data measure name is entered in the calculator display.
Choose your operator. In this case, we want “/” for division. Next, click on Store Sales Days. Notice the Store Sales Days measure name is now highlighted and also entered in the calculator after the “/” division key.
Click the “=” sign and see the new measure added to the bottom of the view.

Page 35 of 54
Notice the calculator symbol next to the measure indicating it is a calculated measure added to that view. (This calculation will not appear the next time you bring up this view unless you remember to save it as a custom view as described on page 4 under the heading “Saving a custom view”.)
Another example of a calculation you may want to do is a variance between two time periods or a sum of time periods not provided for in the time dimension outline. Examples of both are provided below. To calculate a variance between two time periods:
Click on the Calculator button in the tool bar. Replace Name with an appropriate title, such as P4 06 vs. P4 05
Click on the P4 2006 time period name in the column. Notice it is now highlighted. Click on the “-“ for the mathematical operator Click on P4 2005 time period name in the column. Notice it is now highlighted. Your calculator window now appears as follows:
Click on the “=” equal sign and then close the calculator window by clicking on the X in the top right corner. Note: Before starting a calculation, the measures in the calculation must be displayed on the screen.
After highlighting the word Name and replacing it with a more meaningful description of the calculation you are performing, click your mouse in the calculator function area to create your calculation.

Page 36 of 54
The view now includes a column that computes a variance for each measure in the rows.
Compute special time periods Perhaps you’ve run a 14 day promotion and you’d like to see how those 14 days did in total. These days are contiguous, but they don’t match up to a normal Monday – Sunday weekly unit. The 14 days cover a 3 week period. Starting on a Friday, June 2, 06 for example and going through Thursday, June 15. Click on the time dimension in the view and select the days / week from the time dimension that you wish to include.

Page 37 of 54
Your view will now appear as follows:
To sum the 14 days, click on the calculator button in the tool bar. Change the Name to “14 Day Promo Sum”
Click on the first date you wish to add to the others, then click the + button; continue until all dates are in the calculation. Click = for the total. Your calculator looks as follows:
After highlighting the word Name and replacing it with a more meaningful description of the calculation you are performing, click your mouse in the calculator function area to create your calculation.
Close the calculator by clicking on the X button

Page 38 of 54
Close the calculator window by clicking on the X in the top right. The view will now appear as follows.
Please Note: While summing the days is possible, it may not be what you truly want to do. This example purposely demonstrates some examples of when you cannot simply sum measures displayed on the views. For example, Open Restaurants is a measure that tells you the number of restaurants with polled data on that particular date. Summing this measure (above) tells you there are now 16,670 open restaurants. Not a reasonable number. Other examples include PSA Sales, PSA Orders, comp % and ticket average. Mathematically it is incorrect to sum up averages. You must use the raw data and recalculate any averages. Exporting the raw data to Excel for more detailed analysis may be a better way to complete the analysis.
Special features – delivered functions and relativity Special features in the calculator tool include some delivered functions and relativity calculations. We’ll cover delivered functions first. If you click on the down arrow next to the f(x) button on the calculator, several delivered functions will appear.

Page 39 of 54
Let’s look at using the Average function which we demonstrated earlier in another fashion. Click on Average. Notice the Name of calculation changes to Average.
Change the name of the calculation for a better description. Notice also that in the calculation box a formula has appeared.
Position your cursor in the parenthesis. Using the same steps as the prior example, click on the Delivery Charge measure, click on the “/” for division and then click on Store Sales Days.
Click on the = sign and the view changes as follows.

Page 40 of 54
Calculations with relativity The calculator also offers the ability to make formulas relative to their position in the view. This works similar (not the same, but similar) to Excel where, for example, in column 3 you are adding the values of column 1 and column 2, or perhaps calculating the difference between column 1 and column 2. The example below, gives us 2006 and 2005 Friday’s for Weeks 1 and Weeks 2 of Period 4 To the view below, I want to add a variance year to year for Week 1.
Click on the Calculator button. Change the Name to 2006 vs. 2005.
Click on the R/C button. Notice it will slightly change color. This gives the relativity property to rows and columns. Click on the time dimension labeled 2006-03-31 in our example. Notice that Time[1] displays in the calculator.
Click on the – sign for your mathematical operator.

Page 41 of 54
Click on 2005-04-01 for the second time element. Notice here the calculator shows the value as Time[2].
Click = and the view changes as follows.
Because we’ve made our calculation relative, now anything we place in column 2 (now occupied by data from 2005-04-01) will subtract from column 1 (now occupied by data from 2006-03-31). The calculation does not have to be redefined, since it is relative to the values that exist in columns 1 and 2. Below is partial view of an example. The only changes made were to the time dimension, when different dates were chosen.

Page 42 of 54
Trending a particular day of the week If we want to trend a particular day of the week, we can use the User Defined Attribute (UDA). Let’s say we want to look at Fridays on a promotion that ran during Period 4 and we want to look at 2006 vs. 2005. First click on the time dimension and then in the selection window, click on the Deselect All button.
By drilling on the time dimension, highlight Period 4 in both 2005 and 2006.
Next Click Lowest From, then click Find
Click Lowest From Then click Find

Page 43 of 54
Notice that clicking on Lowest From will highlight all days under the periods. Clicking on Find will present the following screen. Under Members, click on the radio button next to Selected. Next under Match, click the radio button next to UDA and then click on the down arrow in the empty box in the top right of the window. Choose the day of the week you wish to trend.

Page 44 of 54
After choosing Friday, click on the Find All Button. The outline changes will appear as follows. Notice Friday, 04/01 becomes bolded.
Next, click on the Keep Found button; the outline will now highlight only the Fridays under the Period 4 time dimension in both 2005 and 2006.
Click close on the Find Members window. Click OK in the Time dimension window.
The How area allows you to narrow your search. The default is Containing and you probably won’t have reason to change this very often.

Page 45 of 54
The view of all Friday’s in Period 4 for both 2005 and 2006 is shown is below.

Page 46 of 54
Using Menu Mix application The menu mix application is found in the list of views under Operations – Menu Mix which is current year and prior year, or Operations – Menu Mix Archive which would be all prior years back to 2003.
4 Dimensions vs. 3 Understanding the concept of the Essbase database is important when trying to use the menu mix application. In all Essbase views, data is displayed where the combination (sometimes called intersection) of the measure named in the rows and the columns result in a value saved in the database. For example, if the date selected is “01/01/2008” and the member store “001000” is selected and the data measure is “net sales”, an answer will result only if the selected store has sales for the date selected. Each of these data elements is defined in what is called a dimension. Data is displayed only when each dimension has a matching element. Most applications in OARS contain three dimensions: store, time and data measure. The menu mix application has four dimensions defined. They are: Time – same as other OARS applications Store – same as other OARS applications Products -- the various items sold , including “no product” explained below. Measures – Measures are divided into two types. Store level and product level.

Page 47 of 54
Products – understanding “No Product” is essential to using the menu mix application
Above is a sample of some of the product groupings for items sold by Papa John’s restaurants. Notice that included in this dimension is a measure called No Product. No Products would relate to any measure that is Store Level as opposed to Product Level. This is important to know when using the Measures dimension explained below. Measures – Measures are divided into two types
• Store level – think of these measures where no specific product exists. The store level measures are listed below. The lowest level of data available is on a daily basis.
• Product level – These measures will be associated only with specific products sold, again
summarized on a daily basis at the lowest level.

Page 48 of 54
Products vs. No Products Because Menu Mix has four dimensions, all four must be utilized in a view. It can be tricky to understand the proper Product and Measure data elements to use. Here are some examples of: A) a successful selection of Store Level Measures and No Product dimensions B) a successful selection of Product Level Measures and specific product dimensions C) an unsuccessful match of specific product with Store Level Measures Example A: a successful selection of store level and No Product dimensions Notice in the example below that for the Store measures selected, Net sales and orders, data is available only for the No Product measure. Remember, that net sales and orders are store level measures vs. product level measures.
Example B: a successful selection of product level and specific product dimensions Notice in the example below that the Product measures, menu price (before discounts), quantity and % of orders, show results for the individual products selected.
Notice the % of Orders column. This is the number of items sold divided by the number of orders. In the example to the left, 173% of all orders contain a pizza. Therefore the ratio of pies to order is 1.73.

Page 49 of 54
Example C: an unsuccessful match of specific product with store level dimension. Notice in the example below that the Store Measures selected, Net sales and Orders, will match only with the No Product name. Specific products sold, match only with the Product Measures as displayed in Example B.
Pizzas Pizzas are available in detail by sizes sold. On the measures dimension, click on Pizzas to reveal the detail levels under Pizza.
The “+” sign to the left of Original Crust indicates there is more detail below that measure. Click on Original Crust and find the different crust sizes.

Page 50 of 54
Speciality Pizzas Under the Measures dimension in the Product Level Measures you will find Toppings. There are two types of “toppings”. Specialty Pizzas and Non Specialty pizzas, or topped pizzas. First we will look at Specialties.
Much like the product measures relate only to specific products sold, toppings will relate only to pizzas sold. Recent changes to Profit will also include other Topped and speciality items such as Calzones as pictured below to show a “Toppings Measure” value. As pictured above Specialty can be expanded to include the various specialty pizzas sold. Toppings measure in the outline, the selection below includes Specialty Count and all specialty pizzas included in the Specialty count. All of these selections are under the Product Measures
If you click on the Pizza measure and expand to display all sizes of pizzas as shown below. In addition, click on Pizza Specialties and show the detail to the actual number specialty pizzas sold by crust size and type.

Page 51 of 54
Topped Pizzas As pictured above Specialty can be expanded to include the various specialty pizzas sold or the Non Specialty pizzas sold. Below is an example of using the Non Specialty measures available for the same group of pizzas.
Another feature recently added to Profit allows for double toppings. Double toppings is different than a two topping pizza, since the single topping is truly doubled. You will find doubled toppings under the 1 Topping measure

Page 52 of 54
.
Drinks / Beverages Drinks are labeled as “beverages” on the Product outline. The quantity and price of drinks sold is available for size of drinks only. Brands / flavors such as Coke, Diet Coke, Coke Zero, etc., are not available in the menu mix data at this time.
A sample report of beverages sold by size is below.

Page 53 of 54
Extras Extras are defined as those accompanying products we offer to round out a customer’s meal. Included are such things as chicken strips, wings, desserts, etc. If detail is available on an “extra” product, such as chicken strips, click on the plus sign besides the product description to drill into sizes or flavor profiles sold.
A sample report of extras sold with the above detail on Chicken Strips included, is below.

Page 54 of 54
These are only some examples of the data available in the menu mix views. The following standard views are available.
Remember that Menu Mix uses four dimensions and all four dimensions must be selected properly to return a value. Practice is encouraged. This is a read only database, you can’t mess it up. Feel free to use one of the above views and create your own custom view to be saved in either the My Views or Local Views folder. Refer to the Saving Custom Views section of this document for more information on using My Views and Local Views. Any questions on how to use the Menu Mix application can be directed to [email protected].