opportunities for demand response in california ... · lbnl-6108e opportunities for demand response...
TRANSCRIPT

LBNL-6108E
Opportunities for Demand Response in California Agricultural Irrigation: A Scoping Study
Gary Marks and Edmund Wilcox
iP Solutions Corp
Daniel Olsen and Sasank Goli
Lawrence Berkeley National Laboratory
January 2013

Disclaimer
This document was prepared as an account of work sponsored by the United States Government. While this document is believed to contain correct information, neither the United States Government nor any agency thereof, nor The Regents of the University of California, nor any of their employees, makes any warranty, express or implied, or assumes any legal responsibility for the accuracy, completeness, or usefulness of any information, apparatus, product, or process disclosed, or represents that its use would not infringe privately owned rights. Reference herein to any specific commercial product, process, or service by its trade name, trademark, manufacturer, or otherwise, does not necessarily constitute or imply its endorsement, recommendation, or favoring by the United States Government or any agency thereof, or The Regents of the University of California. The views and opinions of authors expressed herein do not necessarily state or reflect those of the United States Government or any agency thereof or The Regents of the University of California.

i
ACKNOWLEDGEMENTS
This work was sponsored in part by the Demand Response Research Center which is funded by the California Energy Commission (Energy Commission), Public Interest Energy Research (PIER) Program, under Work for Others Contract No. 500-‐‑03-‐‑026 and by the U.S. Department of Energy under contract No. DE-‐‑AC02-‐‑05CH11231.
The authors would like to thank Aimee McKane and Samuel Solis for their contributions to this report. The authors would also like to thank the growers who contributed their time and expertise to the survey, the results of which are included in this report.

ii
ABSTRACT

iii
TABLE OF CONTENTS
EXECUTIVE SUMMARY ........................................................................................................................ 1
Introduction ............................................................................................................................................ 1
Purpose and Objectives ......................................................................................................................... 2
Key Findings ........................................................................................................................................... 2
Identified Data Skews and Trends from Published Sources and Survey .................................. 2
Best Opportunities for Demand Response and Permanent Load Shifting Programs .............. 3
Solutions (or Requirements) for Demand Response and Permanent Load Shifting Programs ............................................................................................................................................................... 4
Potential Grower Acceptance of Demand Response and Permanent Load Shifting ............... 4
Potential Challenges .......................................................................................................................... 6
Recommendations .................................................................................................................................. 6
Benefit to California ............................................................................................................................... 7
CHAPTER 1: Introduction and Background ........................................................................................ 8
1.1 Purpose ............................................................................................................................................ 10
1.2 Report Organization ...................................................................................................................... 10
CHAPTER 2: Parsing Data on Agricultural Irrigation ..................................................................... 11
2.1 Data Sources .................................................................................................................................... 11
2.1.1 Discrepancy in Irrigation Water Use .................................................................................... 11
2.2 Growing Regions ............................................................................................................................ 13
2.2.1 Water ......................................................................................................................................... 16
2.2.2 Energy ....................................................................................................................................... 16
2.3 Water Source ................................................................................................................................... 20
2.3.1 Water ......................................................................................................................................... 20
2.3.2 Energy ....................................................................................................................................... 21
2.4 Irrigation Method ........................................................................................................................... 22
2.4.1 Water ......................................................................................................................................... 24
2.4.2 Energy ....................................................................................................................................... 25
2.5 Crop Type ........................................................................................................................................ 27
2.5.1 Water ......................................................................................................................................... 27
2.5.2 Energy ....................................................................................................................................... 27
2.6 Grower Business Size ..................................................................................................................... 27
2.7 Utility Coverage ............................................................................................................................. 28
CHAPTER 3: Survey Summary ............................................................................................................ 31
3.1 Crops ................................................................................................................................................ 31
3.2 Source of Irrigation Water ............................................................................................................. 31
3.3 Irrigation Method ........................................................................................................................... 32
iv
3.4 Pumps .............................................................................................................................................. 32
3.5 Potential for Demand Response ................................................................................................... 32
3.5.1 Limitations ............................................................................................................................... 32
3.5.2 Automatic Controls ................................................................................................................. 32
CHAPTER 4: Best Opportunities for Demand Response and Permanent Load Shifting Programs ................................................................................................................................................... 33
4.1 Growing Region ............................................................................................................................. 33
4.2 Irrigation Source ............................................................................................................................. 33
4.2.1 On-farm Sources of Water vs. District-Supplied Water .................................................... 33
4.3 Irrigation Method ........................................................................................................................... 34
4.4 Irrigation Systems with Extra Capacity ...................................................................................... 34
4.5 Non-Peak ET Irrigation Periods ................................................................................................... 34
4.6 Large Growers ................................................................................................................................ 35
4.7 Utility Coverage ............................................................................................................................. 35
4.8 Irrigation Systems with Variable Frequency Drives ................................................................. 35
CHAPTER 5: Solutions (or Requirements) for Demand Response and Permanent Load Shifting Programs ................................................................................................................................... 36
5.1 Adequate Irrigation System Capacity ......................................................................................... 36
5.1.1 Capacity Created by Improved Efficiency .......................................................................... 36
5.2 Automatic Controls ........................................................................................................................ 37
5.2.1 Minimal Controls with Remote DRAS Client ..................................................................... 38
5.2.2 Robust Local Controls with Resident DRAS Client ........................................................... 38
5.2.3 OpenADR ................................................................................................................................. 38
5.3 Storage ............................................................................................................................................. 39
5.4 VFDs ................................................................................................................................................. 39
5.5 On-Site Solar Power Generation .................................................................................................. 39
CHAPTER 6: Potential Grower Acceptance of Demand Response and Permanent Load Shifting Programs ................................................................................................................................... 40
6.1 On-Farm Water Supply with Excess Capacity ........................................................................... 40
6.2 On-Farm Water Supply without Excess Capacity (during peak ET) ..................................... 40
6.3 District-Supplied Water ................................................................................................................ 40
6.4 Permanent Load Shifting vs. Demand Response ...................................................................... 41
6.5 Manual vs. Automated Demand Response ................................................................................ 41
6.6 Cost of System Upgrades vs. Financial Incentives .................................................................... 42
6.7 Other Possibly Compelling Motivations .................................................................................... 42
6.7.1 Energy Efficiency and/or Demand Management .............................................................. 42
6.7.2 Remote Pump Monitoring and Control ............................................................................... 43
CHAPTER 7: Potential Challenges and Obstacles to Demand Response and Permanent Load Shifting Programs ................................................................................................................................... 44

v
7.1 Inadequate Irrigation Capacity .................................................................................................... 44
7.1.1 Load Shifting and Demand Response during Non-Peak ET Periods .............................. 44
7.1.2 Upgrade Irrigation System Capacity .................................................................................... 44
7.2 District-Supplied Water ................................................................................................................ 44
7.2.1 District Participation in Demand Response and/or Permanent Load Shifting ............. 44
7.3 Lack of Automatic Controls .......................................................................................................... 45
7.3.1 Participation with Manual Controls ..................................................................................... 45
7.3.2 Integrate Automatic Controls into Irrigation Systems ...................................................... 45
7.4 Smart Meter Installation Schedule ............................................................................................... 45
7.5 Lack of Variable Frequency Drives ............................................................................................. 45
7.5.1 Participation without VFDs ................................................................................................... 45
7.5.2 Integrate VFDs into Irrigation Systems ................................................................................ 46
CHAPTER 8: Future Studies on How to Gain Grower Acceptance for Demand Response ..... 47
8.1 Reasons for Compliance and Non-Compliance with Current TOU programs ..................... 47
8.2 Survey and Rank Barriers to Real-Time Demand Response ................................................... 47
8.3 Determine the Level of Financial Incentives Required for AutoDR ....................................... 48
8.4 ROI Tools ......................................................................................................................................... 48
8.5 Survey of Potential Incentives for Using Automatic Pump Controls .................................... 48
8.6 How Irrigation Practices would have to Change in order to Accommodate Real-Time Demand Response ................................................................................................................................ 48
8.7 Best Way to Structure Programs in order to Maximize Participation .................................... 49
CHAPTER 9: Additional Future Studies ............................................................................................ 50
9.1 Comprehensive Study on Opportunities for Demand Response in California Agricultural Irrigation ................................................................................................................................................ 50
9.2 Update the ITRC Report on California Agricultural Water Electrical Energy Requirements ................................................................................................................................................................. 50
9.3 Study of Permanent Load Shifting vs. Demand Response in California Agricultural Irrigation ................................................................................................................................................ 51
9.4 Study that Characterizes Growers’ and/or Aggregators’ Ability to Deliver Load Shedding ................................................................................................................................................................. 51
9.5 Studies on Potential Capacity Created by Energy Efficiency Measures and How They May Contribute to Demand Response Participation ............................................................................... 51
9.6 Potential Benefits of Variable Flow Rates for Flood Irrigation ................................................ 52
9.7 Survey of Technology that May be Applied to Demand Response and Permanent Load Shifting in California Agricultural Irrigation ................................................................................... 52
9.8 Pilot Studies .................................................................................................................................... 52
9.9 Determine ROI of Upgrading Water Agency Systems for Demand Response ..................... 52
9.10 Study of the Benefits of On-Site Solar Power Generation ...................................................... 52
CHAPTER 10: Conclusion ..................................................................................................................... 53
References ................................................................................................................................................. 55

vi
Glossary .................................................................................................................................................... 58
Appendix A: Survey / Interview Questions ....................................................................................... 60
Farm Information ................................................................................................................................. 60
Contact Information ......................................................................................................................... 60
Crop Types ........................................................................................................................................ 60
Crop Information (per crop) ............................................................................................................... 61
Irrigation System .............................................................................................................................. 61
Pump Information (per pump) ...................................................................................................... 62
Utility Information ............................................................................................................................... 62
Demand Response ................................................................................................................................ 62
AutoDR .............................................................................................................................................. 62
Appendix B: Top Growers in California ............................................................................................ 63
Appendix C: Survey Questionnaire .................................................................................................... 65
Business Information ........................................................................................................................... 65
Contact Information ......................................................................................................................... 65
Crop Types ........................................................................................................................................ 65
Crop Information (per crop) ............................................................................................................... 66
Number of Separate Locations (Farms) where this Crop is grown: ____________ ................ 66
Location of Crop ............................................................................................................................... 67
Number of Acres for this Crop (at this location) ......................................................................... 67
Are there irrigation pumps for this crop at this location? .......................................................... 67
What types of pumps (by power source) and how many of each are used at this location? 67
What electric utility provides power to this location? ................................................................ 68
Is there any self-generation on-site? Check all that apply. ....................................................... 69
Irrigation Method for this Crop ..................................................................................................... 69
Method Used to determine when and for how long to irrigate (check all that apply) .......... 69
Irrigation Season ............................................................................................................................... 69
Frequency and Length of Time for Irrigation (by month) ......................................................... 69
Source of Irrigation Water (check all that apply) ........................................................................ 69
Total Quantity of Water Applied Annually (in AF): _________________ ................................ 70
Total Annual Costs of Irrigation Water ........................................................................................ 70
Electric Pumps by Category ........................................................................................................... 70
Electric Pumps by Power Rating .................................................................................................... 70
Pump Efficiency Audits (by utility or other organization) ........................................................ 70
Pump Control Methods (check all that apply) ............................................................................. 70
Do any of the pumps use Variable Frequency Drives (VFDs)? ................................................. 70
Flexibility in Irrigation Cycles ............................................................................................................ 70
Flexibility in Irrigation Cycle Start Time: ..................................................................................... 70
vii
Flexibility in Interrupting an Irrigation Cycle: ............................................................................ 71
Answer the same questions based on getting a 24-hour notice. ............................................... 71
Flexibility in Irrigation Cycle Start Time with 24-hour notice: .................................................. 71
Flexibility in Interrupting an Irrigation Cycle with 24-hour notice: ......................................... 71
Barriers to Shifting or Interrupting Irrigation Cycles ..................................................................... 71
............................................................................................................................................................. 71
Incentives for Shifting or Interrupting Irrigation Cycles ............................................................... 72
............................................................................................................................................................. 72

viii
LIST OF FIGURES
LIST OF TABLES

1
EXECUTIVE SUMMARY
Introduction
1

2
Purpose and Objectives
•
•
• •
•
Key Findings
Identified Data Skews and Trends from Published Sources and Survey
•
• •
•
•
•
2

3
Best Opportunities for Demand Response and Permanent Load Shifting Programs
Growing Region
Irrigation Source
Irrigation Method
Irrigation System Capacity
Variable Frequency Drives
Grower Business Size
Utility Coverage

4
Solutions (or Requirements) for Demand Response and Permanent Load Shifting Programs
Adequate Irrigation System Capacity
•
•
•
Automatic Controls
Storage
Variable Frequency Drives
On-Site Solar Power Generation
Potential Grower Acceptance of Demand Response and Permanent Load Shifting
3 The Energy Information Administration defines an aggregator as a

5
Excess Irrigation Capacity
On-Farm Water Sources
Permanent Load Shifting vs. Demand Response
Changing Attitudes toward Remote Pump Monitoring and Control

6
Potential Challenges
Inadequate Irrigation Capacity
District-Supplied Water
Lack of Automatic Controls
Smart Meter Installation Schedule
Lack of Variable Frequency Drives
Recommendations
•
• •

7
Benefit to California

8
CHAPTER 1: Introduction and Background

9

10
1.1 Purpose
•
•
• •
•
1.2 Report Organization
• •
•
• • • •

11
CHAPTER 2: Parsing Data on Agricultural Irrigation
2.1 Data Sources
2.1.1 Discrepancy in Irrigation Water Use
4

12

13
Table 1: 2003 Irrigation Water Use
Sources: Burt, et al. 2003, USDA 2003
2.2 Growing Regions
California Agricultural Water Electrical Energy Requirements

14
Figure 1: California ETo Zones
Source: California Irrigation Management Information System

15
Figure 2: ITRC Modified ETo Zones
Source: Burt et al. 2003

16
2.2.1 Water
Table 2: Water Applied by ETo Zone
Sources: Burt et al. 2003 and California Irrigation Management Information System
2.2.2 Energy

17
Table 3: Electical Energy Use by ETo Zone
Sources: Burt et al. 2003 and California Irrigation Management Information System

18
Figure 3: Percent of Total Energy Use by Region
Source: Burt et al. 2003

19
Figure 4: Energy per Arce-Foot of Water
Source: Burt et al. 2003

20
2.3 Water Source
2.3.1 Water
Table 4: AF/year by Source (2007)
Source: USDA 2008
Table 5: AF/year by Source (2002)
Source: USDA 2003

21
Table 6: Water Applied by ETo Zone and Source
ITRC-modified DWR ETo
zone
Irrigation District Surface
Water Delivered (AF/ year)
Irrigation District Ground Water Pumping
(AF/year)
On-Farm Ground Water
Pumping (AF/year)
Total Applied Water by Zone
(AF/year)
1 0 0 123,965 123,695 3 0 0 824,486 824,846 4 0 0 138,046 138,046 6 0 0 959,939 959,939 8 116,140 681 56,387 173,209 9 0 0 880,841 880,841
10 0 0 669,478 669,478 12a 3,025,343 129,393 972,963 4,127,699 12b 960,284 41,071 559,014 1,560,369 14 8,349,919 14,048 425,118 8,789,086 15 4,175,145 505,920 3,880,110 8,561,175 16 2,655,088 43,121 2,533,649 5,231,858 18 4,128,768 0 61,432 4,190,200
Total 23,410,700 734,200 12,085,400 36,230,300 Source: Burt et al. 2003
2.3.2 Energy

22
Table 7: Energy Consumed by ETo Zone and Source
ITRC-modified
DWR ETo zone
Irrig. District Surface Water
Delivered (MWh / year)
Irrig. District Ground Water
Pumping (MWh/year)
On-Farm Ground Water
Pumping (MWh /year)
On-Farm Booster
Pumping (MWh /year)
Conveyance to Irrig. Districts
(MWh/year)
Total Electricity
used by Zone (MWh/year)
1 0 0 54,964 20,852 75,817 3 0 0 365,562 145,076 510,386 4 0 0 61,207 18,132 79,339 6 0 0 401,843 148,034 549,877 8 3,896 137 14,573 21,350 39.957 9 0 0 255,199 87,567 342,767
10 0 0 273,277 58,730 332,077 12a 26,171 27,051 283,381 300,329 636,932 12b 8,307 8,586 159,637 101,075 277,606 14 131,125 2,032 108,394 488,733 450,526 1,180,809 15 514,605 199,386 1,659,804 688,121 1,269,062 4,330,978 16 137,662 8,840 846,938 380,371 1,373,811 18 0 0 14,236 415,152 429,388
Total 821,800 246,000 4,499,000 2,873,500 1,719,600 10,159,900 Source: Burt et al. 2003
2.4 Irrigation Method

23
Table 8: Acres Irrigated by Method, 2002 & 2007
2003 USDA Survey (2002 growing season)
2008 USDA Survey (2007 growing season)
Irrigation Method Acres Irrigated Acres Irrigated Gravity 5,261,073 60% 4,189,852 53% Sprinkler 1,723,040 20% 1,367,179 17% Drip/Micro 1,706,916 20% 2,336,130 29% Subsurface 58,655 1% 66,282 1% Total for All Methods 8,749,684 7,959,443
Source: USDA 2003 & 2008
Figure 5: Acres Irrigated by Method, 2002 & 2007
Source: USDA 2003 & 2008
Table 9: Acres Irrigated by Method
ITRC 2001 evaporation Acres All Furrow 2,380,226 26% All Border Strip and Basin 2,656,321 29% Combination Sprinkler and Furrow 494,778 5% All Sprinkler 1,970,056 21% All Drip/Micro 1,811,622 19% Total for All Methods 9,313,003

24
Source: Burt et al. 2001
Table 10: Percentage of Irrigated Acres by Method
Pacific Institute 2001 Data
Percentage of Total Irrigated Acres
Flood 59% Sprinkler 15% Drip/Micro 24% Other 2% Source: Cooley et al. 2009; Orang et al. 2005
2.4.1 Water
6 The USDA Ranch and Farm Survey “sections” are actually labeled as “Tables”. The term “Sections” is substituted here in order to avoid confusion with the numbered Tables in this document.

25
Table 11: AF by Irrigation Method in 2007
2008 USDA Survey (combined sections 4 and 8)
Irrigation Method
Acres Irrigated
Ave. AF/Acre AF
(section 4) (section 8) Gravity 4,189,852 53% 3.3 13,826,512 59% Sprinkler 1,367,179 17% 2.5 3,417,948 15% Drip/Micro 2,336,130 29% 2.6 6,073,938 26% Subirrigation 66,282 1% 0.7 46,397 0% Totals 7,959,443 23,364,795
Source: USDA 2008
Table 12: AF by Irrigation Method in 2002
2003 USDA Survey (combined Sections 4 and 8) Irrigation Method
Acres Irrigated
Ave. AF/Acre AF
(section 4) (section 8) Gravity 5,261,073 60% 3.3 17,361,541 69% Sprinkler 1,723,040 20% 2.3 3,962,992 16% Drip/Micro 1,706,916 20% 2.3 3,925,907 16% Subirrigation 58,655 1% 0 0% Totals 8,749,684 25,250,440
Source: USDA 2003
2.4.2 Energy

26
Table 13: Energy Requirements by Irrigation Activity
Activity Approximate Energy Requirements (kWh/AF)
Flood Irrigation without On-Farm Lift 0 Lifting Water 10 feet for Flood Irrigation 30
Booster Pumping for Drip/Micro Irrigation 206 Booster Pumping for Standard Sprinklers 284
Source: Cooley et al. 2008
Table 14: Relative Energy by Method
Irrigation Method AF Relative kWh/AF
Relative MWh/year
Gravity 17,700,000 0 Sprinkler 4,500,000 284 1,278,000 Drip/Micro 7,800,000 206 1,606,800 Total 30,000,000 2,884,000
Derived data from USDA 2008 and Cooley et al. 2008

27
2.5 Crop Type
2.5.1 Water
Table 15: Water Applied by Crop Type
Crop Type Percentage of Water Applied
AF of Water Applied
Field Crops 63% 18,900,000 Vegetables 10% 3,000,000
Fruits and Nuts 27% 8,100,000 Total 100% 30,000,000
Source: Derived data from Table 14 and Pacific Institute 2008 and 2009 articles (Cooley 2008 & 2009)
2.5.2 Energy
2.6 Grower Business Size

28
Table 16: Percentage of Acres Irrigated by Size of Farm
Acres Farms % Acres irrigated % 1-49 32,499 72.0 408,070 5.5
50-99 2,865 6.3 309,927 4.2 100-199 3,285 7.3 477,492 6.4 200-499 3,170 7.0 1,012,333 13.6 500-999 1,738 3.9 1,225,449 16.5
1,000 – 1,999 965 2.1 1,307,090 17.6 2,000+ 614 1.4 2,706,646 36.3 Total 45,136 100 7,447,007 100
Source: USDA 2008
2.7 Utility Coverage
Table 17

29
Figure 6: Utility Service Areas
Source: California Energy Commision

30
Table 17: Peak Load and Retail Sales by Utility

31
CHAPTER 3: Survey Summary
3.1 Crops
• • • • • • • • • • • • • • • • •
3.2 Source of Irrigation Water

32
3.3 Irrigation Method
3.4 Pumps
3.5 Potential for Demand Response
3.5.1 Limitations
3.5.2 Automatic Controls

33
CHAPTER 4: Best Opportunities for Demand Response and Permanent Load Shifting Programs
4.1 Growing Region
4.2 Irrigation Source
4.2.1 On-farm Sources of Water vs. District-Supplied Water

34
4.3 Irrigation Method
4.4 Irrigation Systems with Extra Capacity
4.5 Non-Peak ET Irrigation Periods

35
4.6 Large Growers
4.7 Utility Coverage
4.8 Irrigation Systems with Variable Frequency Drives

36
CHAPTER 5: Solutions (or Requirements) for Demand Response and Permanent Load Shifting Programs
5.1 Adequate Irrigation System Capacity
5.1.1 Capacity Created by Improved Efficiency
5.1.1.1 Pump Efficiency
5.1.1.2 Reductions in water applications

37
5.1.1.3 Reduction in Pressure Losses
5.2 Automatic Controls

38
5.2.1 Minimal Controls with Remote DRAS Client
5.2.2 Robust Local Controls with Resident DRAS Client
5.2.3 OpenADR

39
5.3 Storage
5.4 VFDs
5.5 On-Site Solar Power Generation

40
CHAPTER 6: Potential Grower Acceptance of Demand Response and Permanent Load Shifting Programs
6.1 On-Farm Water Supply with Excess Capacity
6.2 On-Farm Water Supply without Excess Capacity (during peak ET)
6.3 District-Supplied Water

41
6.4 Permanent Load Shifting vs. Demand Response
6.5 Manual vs. Automated Demand Response

42
6.6 Cost of System Upgrades vs. Financial Incentives
6.7 Other Possibly Compelling Motivations
6.7.1 Energy Efficiency and/or Demand Management
43
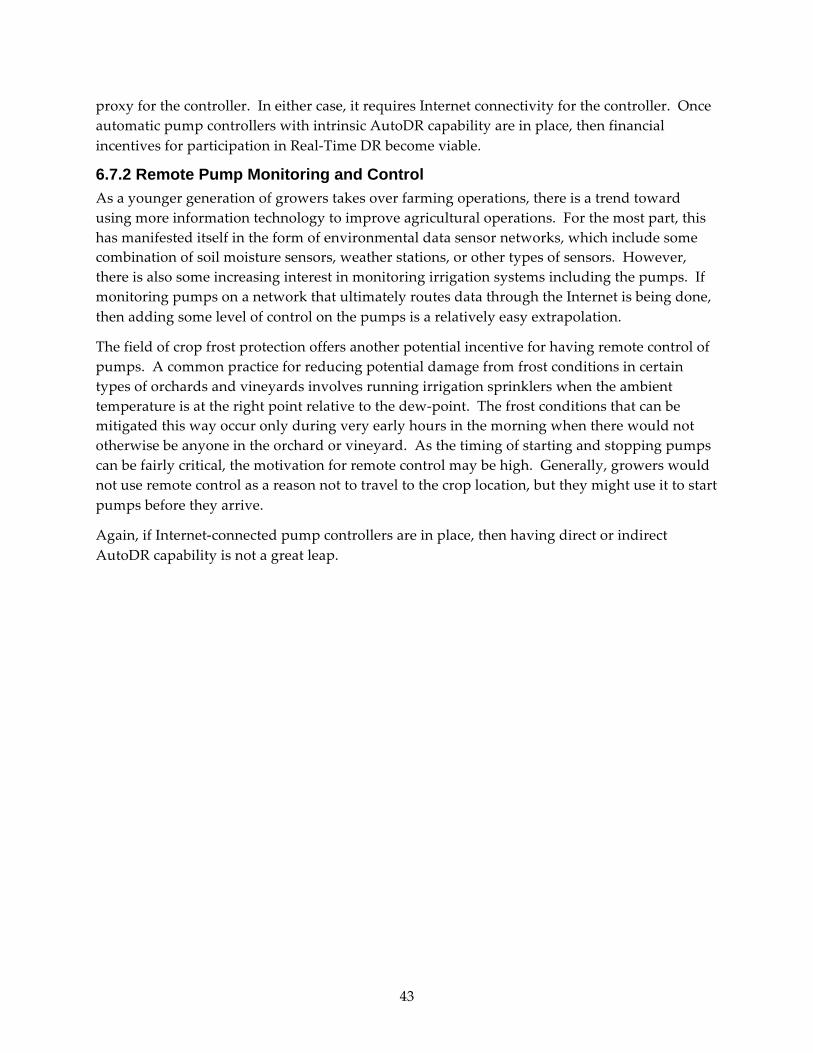
6.7.2 Remote Pump Monitoring and Control

44
CHAPTER 7: Potential Challenges and Obstacles to Demand Response and Permanent Load Shifting Programs
7.1 Inadequate Irrigation Capacity
7.1.1 Load Shifting and Demand Response during Non-Peak ET Periods
7.1.2 Upgrade Irrigation System Capacity
7.2 District-Supplied Water
7.2.1 District Participation in Demand Response and/or Permanent Load Shifting

45
7.3 Lack of Automatic Controls
7.3.1 Participation with Manual Controls
7.3.2 Integrate Automatic Controls into Irrigation Systems
7.4 Smart Meter Installation Schedule
7.5 Lack of Variable Frequency Drives
7.5.1 Participation without VFDs

46
7.5.2 Integrate VFDs into Irrigation Systems

47
CHAPTER 8: Future Studies on How to Gain Grower Acceptance for Demand Response
8.1 Reasons for Compliance and Non-Compliance with Current TOU programs
8.2 Survey and Rank Barriers to Real-Time Demand Response

48
8.3 Determine the Level of Financial Incentives Required for AutoDR
8.4 ROI Tools
8.5 Survey of Potential Incentives for Using Automatic Pump Controls
8.6 How Irrigation Practices would have to Change in order to Accommodate Real-Time Demand Response

49
8.7 Best Way to Structure Programs in order to Maximize Participation

50
CHAPTER 9: Additional Future Studies
9.1 Comprehensive Study on Opportunities for Demand Response in California Agricultural Irrigation
• • • • • •
9.2 Update the ITRC Report on California Agricultural Water Electrical Energy Requirements

51
9.3 Study of Permanent Load Shifting vs. Demand Response in California Agricultural Irrigation
9.4 Study that Characterizes Growers’ and/or Aggregators’ Ability to Deliver Load Shedding
9.5 Studies on Potential Capacity Created by Energy Efficiency Measures and How They May Contribute to Demand Response Participation

52
9.6 Potential Benefits of Variable Flow Rates for Flood Irrigation
9.7 Survey of Technology that May be Applied to Demand Response and Permanent Load Shifting in California Agricultural Irrigation
9.8 Pilot Studies
9.9 Determine ROI of Upgrading Water Agency Systems for Demand Response
9.10 Study of the Benefits of On-Site Solar Power Generation

53
CHAPTER 10: Conclusion
•
• •
•
•
•
•

54
•
•

55
References
Akuacom; LBNL. (n.d.). OpenADR Client Development Program. Retrieved from PIER Demand Response Research Center: http://openadr.lbl.gov/pdf/openadr-client-develop.pdf
Burt, C. (2011a). Characteristics of Irrigation Pump Performance in Major Irrigated Areas of California. California Polytechnic State University (Cal Poly), Irrigation Training and Research Center (ITRC). San Luis Obispo, CA: ITRC. Retrieved from http://www.itrc.org/reports/characteristics.htm
Burt, C. (2011b). Irrigation System Components and Potentials for Energy Conservation. San Luis Opsibo, CA: ITRC. Retrieved from http://www.itrc.org/reports/components.htm
Burt, C. M. (2011c, March 9). Chairman of the Board, Irrigation Training and Research Center (ITRC). (G. Marks, & E. Wilcox, Interviewers) San Luis Obispo, CA.
Burt, C. M., Amon, R., & Cordova, D. (2002, 2007). Electrical Load Shifting in Irrigation Districts - California's Program. Irrigation Association 28th Annual International Irrigation Show (p. 10). San Diego: ITRC, Irrigation Association. Retrieved from http://www.itrc.org/papers/elecloadshift/elecloadshifting.pdf
Burt, C. M., Howes, D. J., & Mutziger, A. (2001). Evapotranspiration Estimates for Irrigated Agriculture in California. Irrigation Association Conference. San Antonio, TX: Irrigation Association. Retrieved from http://www.itrc.org/papers/evaporationest/evaporationestimates.pdf
Burt, C., & Howes, D. (2005). CEC Agricultural Peak Load Reduction Program -Water Agencies-. California Polytechnic State University (Cal Poly), Irrigation Training and Research Center (ITRC). San Luis Obsipo, CA: ITRC. Retrieved from http://www.itrc.org/reports/cecaplrp/final.pdf
Burt, C., & Monte, S. (2008). Conversion to Ground Water Pumping with Drip/Micro Irrigation Systems. California Polytechnic State University (Cal Poly), Irrigation Training and Research Center (ITRC). San Luis Obispo, CA: ITRC. Retrieved from http://www.itrc.org/reports/groundwater/groundwater.pdf
Burt, C., Howes, D., & Wilson, G. (2003). California Agricultural Water Electrical Energy Requirements. California Polytechnic State University (Cal Poly), Irrigation Training and Research Center (ITRC). San Luis Obsipo, CA: ITRC. Retrieved from http://www.itrc.org/reports/energyreq/energyreq.pdf
California Energy Commision (CEC). (n.d.). California Electric Utility Service Areas. Retrieved from California Energy Commision (CEC): http://www.energy.ca.gov/maps/serviceareas/Electric_Service_Areas_Detail.pdf
California Farm Bureau Federation. (n.d.). Retrieved from http://www.cfbf.com/index.cfm
California Irrigation Management Information System (CIMIS). (n.d.). Reference Evapotransiration (ETo) Zones. Retrieved from California Irrigation Management Information System (CIMIS): http://wwwcimis.water.ca.gov/cimis/cimiSatEtoZones.jsp
California Public Utilities Commission. (n.d.). Demand Response. Retrieved from California Public Utilities Commission: http://www.cpuc.ca.gov/PUC/energy/Demand+Response/

56
Center for Irrigation Technology. (n.d.). Advanced Pumping Efficiency Program. Retrieved from pumpefficiency.org: http://www.pumpefficiency.org/
Chiu, A. (2010, March 3). Lead Product Manager, Demand Response Department, Pacific Gas and Electric. (G. Marks, & E. Wilcox, Interviewers) San Francisco, CA.
Cooley, H., Christian-Smith, J., & Gleick, P. (2009). Sustaining California Agriculture in an Uncertain Future. Oakland, CA: Pacific Institute. Retrieved from http://www.pacinst.org/reports/california_agriculture/final.pdf
Cooley, H., Christian-Smith, J., & Gleick, P. H. (2008). More with Less: Agricultural Water Conservation and Efficiency in California, A Special Focus on the Delta. Oakland: Pacific Institute. Retrieved from http://www.pacinst.org/reports/more_with_less_delta
Cooley, H., Christian-Smith, J., Gleick, P. H., Cohen, M. J., & Heberger, M. (2010). California's Next Million Acre-Feet: Saving Water, Energy, and Money. Oakland, CA: Pacific Institute. Retrieved from http://www.pacinst.org/reports/next_million_acre_feet/index.htm
Department of Water Resources. (n.d.). Ground Water Basins in California. Retrieved from Department of Water Resources: http://www.water.ca.gov/groundwater/bulletin118/maps/statewide_basin_map_V3_subbas.pdf
Energy Information Administration. (n.d.) Electricity Terms and Definitions. Retrieved from http://www.eia.gov/cneaf/electricity/page/glossary.html
Griffiths-Sattenspiel, B., & Wilson, W. (2009). The Carbon Footprint of Water. Portland, OR: River Network. Retrieved from http://www.rivernetwork.org/resource-library/carbon-footprint-water
Growing Produce: Top 100 growers. (n.d.). Retrieved from Growing Produce: http://www.growingproduce.com/
Irrigation Training and Research Center (ITRC). (2002). Benchmarking of Flexibility and Needs, Survey of Non-Federal Irrigation Districts. San Luis Obispo, CA: ITRC. Retrieved from http://www.itrc.org/reports/benchmarking/benchmarking2002.pdf
Klein, G., Krebs, M., Hall, V., O'Brian, T., & Blevins, B. (2005). California's Water-Energy Relationship. Sacramento, CA: California Energy Commission. Retrieved from http://www.energy.ca.gov/2005publications/CEC-700-2005-011/CEC-700-2005-011-SF.PDF
LBNL DRRC. (n.d.). Open Automated Demand Response Communication Standards (OpenADR or Open Auto-DR) Development. Retrieved from PIER Demand Response Research Center: http://openadr.lbl.gov/
Marks, G. (2010). Precision Irrigation, A Way to Save Water and Energy While Increasing Crop Yield, A Targeted Approach for California Agriculture. Fremont, CA. Retrieved from http://www.slideshare.net/GaryMarks/precision-irrigation-a-method-to-save-water-and-energy-while-increasing-crop-yield-a-targeted-approach-for-california-agriculture
Masiello, R., Vu, K., Deng, L., Abrams, A., Corfee, K., Harrison, J., & KEMA. (2010). Research Evaluation of Wind Generation, Solar Generation, and Storage Impact on the California Grid. Public Interest Energy Research (PIER) of the California Energy Commission (CEC).
Orang, M., Synder, R., & Matyac, S. (2005). Survey of Irrigation Methods in California. Department of Water Resources (DWR) and University of California Davis. DWR and UC Davis.

57
Retrieved from http://www.waterplan.water.ca.gov/docs/cwpu2005/vol4/vol4-data-surveyofirrigationmethods.pdf
Pacific Gas and Electric. (n.d.). Smart Meter Installation Progress. Retrieved from PG&E: http://www.pge.com/myhome/customerservice/smartmeter/deployment/
Perez Urrestarazu, L., & Burt, C. M. (2011). Characterization of Pumps for Irrigation in Central California: Potential Energy Savings. San Luis Obispo, CA: ITRC.
USDA Census of Agriculture. (2003). Farm and Ranch Irrigation Survey. Washington D.C.: USDA. Retrieved from http://www.agcensus.usda.gov/Publications/2002/FRIS/
USDA Census of Agriculture. (2008). Farm and Ranch Irrigation Survey. Washington D.C.: USDA. Retrieved from http://www.agcensus.usda.gov/Publications/2007/Online_Highlights/Farm_and_Ranch_Irrigation_Survey/index.php
Wikler, G., Bran, I., Piette, M. A., & Kiliccote, S. (n.d.). Mystified by Automated Demand Response? Association of Energy Service Professionals. Retrieved from http://70.32.94.23/Auto-DR/files/AESParticle.pdf

58
Glossary

59

60
Appendix A: Survey / Interview Questions
Farm Information
Contact Information
Crop Types
• • •

61
Crop Information (per crop)
Irrigation System

62
Pump Information (per pump)
Utility Information
Demand Response
AutoDR
63
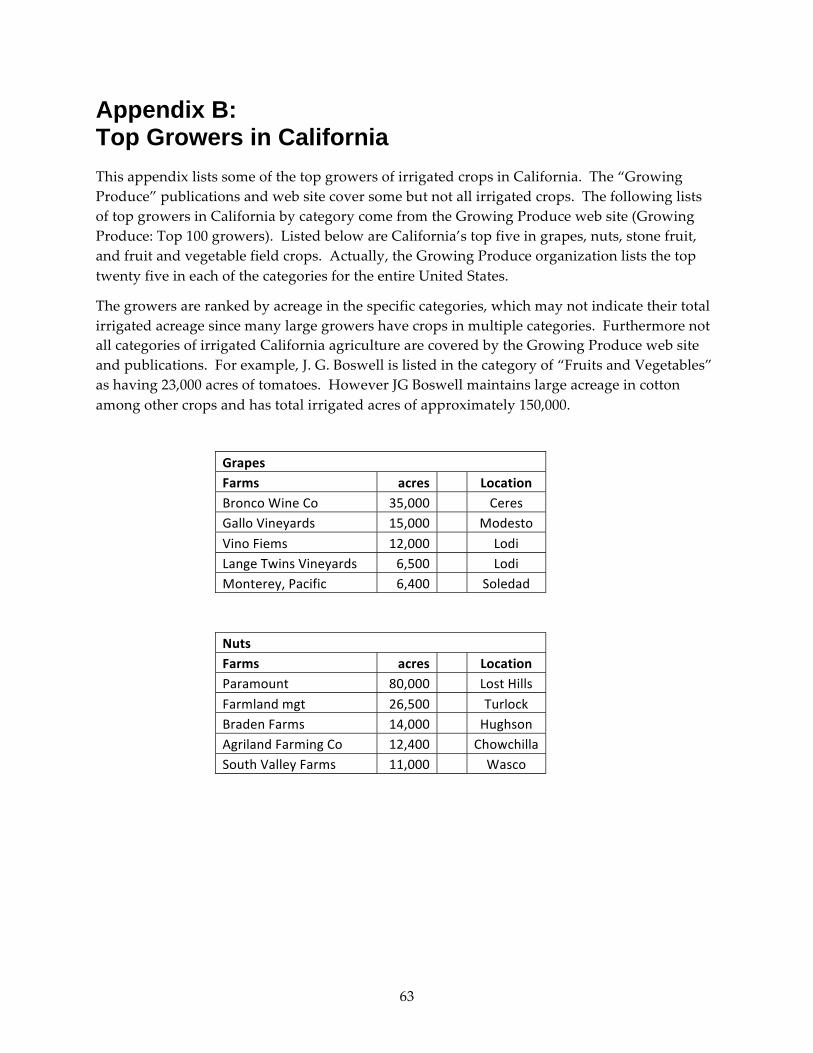
Appendix B: Top Growers in California

64

65
Appendix C: Survey Questionnaire
Business Information
Contact Information
Crop Types

66
Crop Information (per crop)
Number of Separate Locations (Farms) where this Crop is grown: ____________
67
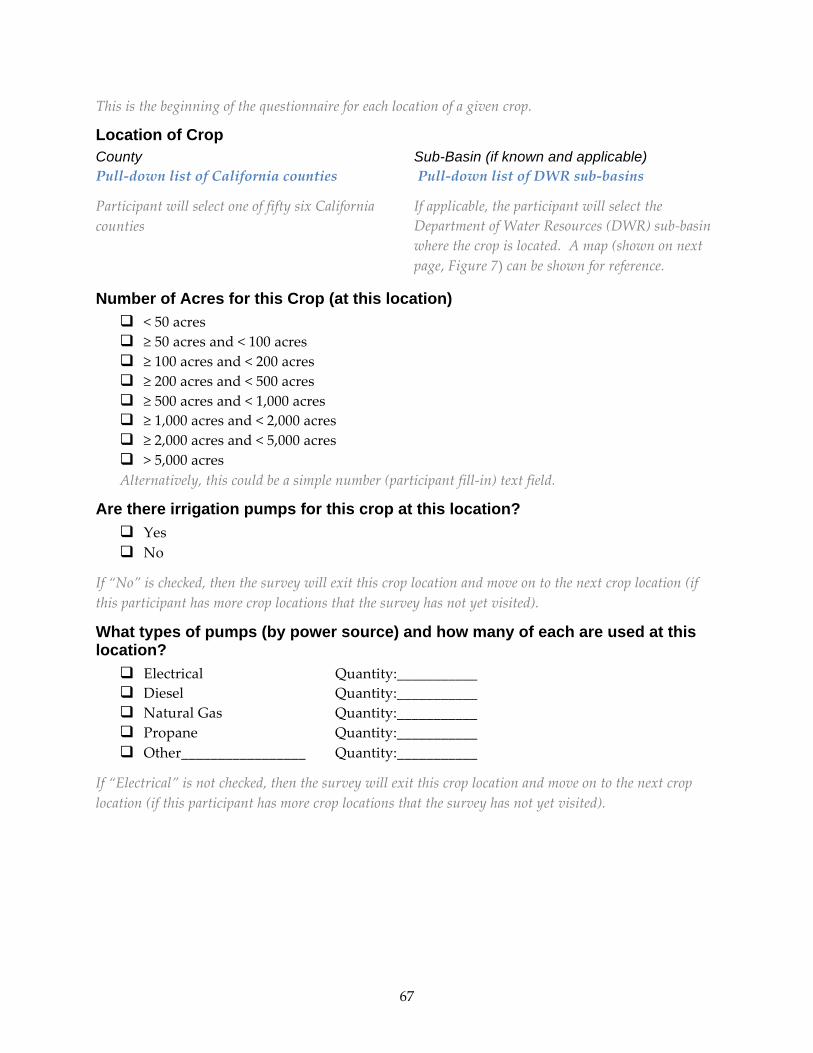
Location of Crop
County Pull-down list of California counties
Sub-Basin (if known and applicable) Pull-down list of DWR sub-basins
Number of Acres for this Crop (at this location)
Are there irrigation pumps for this crop at this location?
What types of pumps (by power source) and how many of each are used at this location?

68
Figure 7: Groundwater Basins in California
Source: Department of Water Resources
What electric utility provides power to this location?

69
Is there any self-generation on-site? Check all that apply.
Irrigation Method for this Crop
Method Used to determine when and for how long to irrigate (check all that apply)
Irrigation Season
Frequency and Length of Time for Irrigation (by month)
Source of Irrigation Water (check all that apply)

70
Total Quantity of Water Applied Annually (in AF): _________________
Total Annual Costs of Irrigation Water
Electric Pumps by Category
Electric Pumps by Power Rating
Pump Efficiency Audits (by utility or other organization)
Pump Control Methods (check all that apply)
Do any of the pumps use Variable Frequency Drives (VFDs)?
Flexibility in Irrigation Cycles
Flexibility in Irrigation Cycle Start Time:

71
Flexibility in Interrupting an Irrigation Cycle:
Answer the same questions based on getting a 24-hour notice.
Flexibility in Irrigation Cycle Start Time with 24-hour notice:
Flexibility in Interrupting an Irrigation Cycle with 24-hour notice:
Barriers to Shifting or Interrupting Irrigation Cycles

72
Incentives for Shifting or Interrupting Irrigation Cycles