opportunities for private sector involvement in the
TRANSCRIPT

UNIVERSITY OF KWAZULU-NATAL
OPPORTUNITIES FOR PRIVATE SECTOR INVOLVEMENT IN THE CONTAINER MARKET INDUSTRY IN THE PORT OF DURBAN
By Shivani Patel 931 300503
A dissertation submitted in partial fulfilment of the requirements for the degree of Master of Commerce
School of Accounting, Economics and Finance Unit of Maritime Law and Maritime Studies
Supervisor: Professor Trevor Jones
30 NOVEMBER 2015

i
DECLARATION
I, Shivani Patel declare that:
(i) The research reported in this dissertation, except where otherwise indicated, is my
original research;
(ii) This dissertation has not been submitted for any degree or examination at any other
university;
(iii) This dissertation does not contain other persons’ data, pictures, graphs or other
information, unless specifically acknowledged as being sourced from other persons;
(iv) This dissertation does not contain other persons’ writing, unless specifically
acknowledged as being sourced from other researchers. Where other written sources
have been quoted, then:
a. Their words have been re-written but the general information attributed to them has
been referenced;
b. Where their exact words have been used, their writing has been placed inside
quotation marks, and referenced;
(v) Where I have reproduced a publication of which I am author, co-author or editor, I have
indicated in detail which part of the publication was actually written by myself alone and
have fully referenced such publications; and
(vi) This dissertation does not contain text, graphics or tables copied and pasted from the
Internet, unless specifically acknowledged, and the source being detailed in the
dissertation and in the references sections.
Signed: _____________________________
Date: _____________________________

ii
ACKNOWLEDGEMENTS
I would like to thank my family for their patience, understanding and encouragement while I was
engaged in this process. I would also to like thank my peers and colleagues at Bulk Connections
and Bidvest Freight for their support, advice and encouragement. Last, but not least, I would like
to thank Professor Trevor Jones for his guidance and the University of KwaZulu-Natal for offering
an inspiring Master’s Degree course in Maritime Studies.

iii
ACRONYMS & ABBREVIATIONS
BC - Bulk Connections
BOT - Build Operate Transfer
CD - Chart Datum
DCT - Durban Container Terminal
DWT - Dead Weight Tonnage
FOB - Free on Board
GCMPH - Gross Crane Moves Per Hour
IRR - Internal Rate of Return
JNPCT - Jawaharlal Nehru Public Terminal
LOA - Length overall
MPDC - Maputo Port Development Company
NSICT - Nhava Sheva International Container Terminal
PRSA - Port Regulator of South Africa
RMG - Rail Mounted Gantries
RTG - Rubber Tyred Gantries
SADC - Southern African Development Community
SOC - State-owned company
STS - Ship-to-shore
SWH - Ship Working Hour
TEU - Twenty Foot Equivalent Unit
TFR - Transnet Freight Rail
TNPA Transnet National Ports Authority
TPT - Transnet Port Terminals
TTU - Truck Trailer Units
UNCTAD - United Nations Conference on Trade and Development

iv
GLOSSARY OF TERMS
Air Draft: The measurement from the water level to the highest point concerned on a
vessel
Chart Datum: The lowest tide level that can be predicted to occur
Draft: The distance from the waterline to the lowest point of the keel of a vessel
Handymax: Bulk carriers between 40 000 to 59 000 DWT
Panamax: Bulk Carriers that are restricted by their length and width to transit the
Panama Canal. Length overall restricted to 289.5m and width 32.3m, given
current lock dimensions.
Under keel clearance: Measurement from the harbour floor to the keel of the vessel (flat steel plate
at the bottom of a vessel). This was recently changed from 300 to 600 mm by
Transnet (2014)
Vertical clearance: Excess distance after air draft, that allows a vessel to safely pass under an
object

v
ABSTRACT
Transnet, the state-owned freight transport company, is responsible for rail transport, pipelines, port
and marine services as well as many terminal operations within the port. The container terminal
handling industry in South Africa is run predominantly by Transnet Port Terminals from Durban, Port
Elizabeth, Ngqura and Cape Town. There are currently no private operators that handle containers in
the scale handled by Transnet.
The main object of this dissertation is to show by means of various case studies from both developed
and developing economies that the involvement of the private sector results in increases in
efficiencies and productivity. This has the net result of increasing the cost competitiveness of exports
and reducing the landed cost of imports.
As no new container terminals are being built in the short to medium term, this paper considers the
financial feasibility of two different scenarios; one where a private bulk handling terminal in the Port
of Durban is converted to a multi-purpose terminal handling containers, and the other where the same
terminal is fully converted to a container handling terminal.
The results indicate that due to the significant capital investment in running a container terminal, and
the operational and land size restrictions, the full conversion to a container terminal would not be
feasible. The lower capital investment and the flexibility of handling both bulk and containers makes
the business case for the multi-purpose terminal more feasible.

vi
CONTENTS DECLARATION .................................................................................................................................... i
ACKNOWLEDGEMENTS ...................................................................................................................... ii
ACRONYMS & ABBREVIATIONS ......................................................................................................... iii
GLOSSARY OF TERMS........................................................................................................................ iv
ABSTRACT ......................................................................................................................................... v
CHAPTER ONE ................................................................................................................................... 1
INTRODUCTION ................................................................................................................................. 1
1.1 Background and Context ......................................................................................................... 1
1.2 Scope of the Proposed Research Work .................................................................................... 3
1.3 Study Overview ....................................................................................................................... 3
CHAPTER TWO .................................................................................................................................. 5
LITERATURE REVIEW AND CONCEPTUAL UNDERPINNINGS ................................................................ 5
2.1 Economic function of a port .................................................................................................... 5
2.2 Port Authority Models............................................................................................................. 6
2.2.1 Landlord ports .................................................................................................................. 6
2.2.2 Tool ports ......................................................................................................................... 6
2.2.3 Operating ports ................................................................................................................ 6
2.3 Perfect competition and natural monopolies .......................................................................... 7
2.4 Port Costs ............................................................................................................................... 7
2.4.1 Port charges ..................................................................................................................... 7
2.4.2 Vessels time in the port .................................................................................................... 8
2.4.3 Cargo handling costs ........................................................................................................ 8
2.5 Port Performance and productivity .......................................................................................... 8
2.5.1 Crane moves per hour ...................................................................................................... 9
2.5.2 Dwell time ........................................................................................................................ 9
2.5.3 Berth occupancy ratio ...................................................................................................... 9
2.5.4 TEU’s per hectare ........................................................................................................... 10
2.5.5 Yard occupancy ratio ...................................................................................................... 10
2.5.6 Quay line design and shape ............................................................................................ 10
2.6 The South African Ports System............................................................................................. 11
2.7 Transnet National Ports Authority (TNPA) ............................................................................. 13
2.7.1 Market Demand Strategy and Capital Investment........................................................... 14
2.8 Transnet Port Terminals (TPT) ............................................................................................... 15
2.8.1 Proposed new terminal - Ngqura Manganese Facility ..................................................... 15
2.8.2 Proposed new terminal - Durban Dig-out Port (DDOP).................................................... 16

vii
2.9 Transnet Freight Rail (TFR) .................................................................................................... 17
2.10 Inter-port Competition ........................................................................................................ 17
CHAPTER THREE .............................................................................................................................. 19
PORT PRODUCTIVITY ....................................................................................................................... 19
3.1 TEU per hectare .................................................................................................................... 19
3.2 Cranes per running metre of berth ........................................................................................ 19
3.3 Gross crane moves per hour and Container moves per ship working hour ............................. 19
3.4 Berth occupancy ................................................................................................................... 22
3.5 Dwell time ............................................................................................................................ 22
CHAPTER FOUR ............................................................................................................................... 24
THE EFFECTS OF PRIVATIZING .......................................................................................................... 24
4.1 India – Port of Jawaharlal Nehru ........................................................................................... 24
4.2 Malaysia – Kelang Container Terminal ................................................................................... 25
4.3 Africa .................................................................................................................................... 26
4.3.1 Port of Maputo .................................................................................................................. 26
4.3.2 Apapa Container Terminal - Nigeria .................................................................................... 26
4.4 South America - Brazil ........................................................................................................... 27
4.5 The South African context ..................................................................................................... 28
CHAPTER FIVE.................................................................................................................................. 30
CASE STUDY: BULK CONNECTIONS .................................................................................................. 30
5.1 Land Size ............................................................................................................................... 30
5.2 Berth Depths ......................................................................................................................... 32
5.3 Rail Sidings ............................................................................................................................ 33
5.4 Equipment required for container handling........................................................................... 34
5.4.1 Gantry cranes / quay-side cranes.................................................................................... 34
5.4.2 Truck-Trailer Units (TTU’s) .............................................................................................. 38
5.4.3 Reach stackers ............................................................................................................... 38
5.4.4 Rubber tyred gantries (RTG’s) and Rail mounted gantries (RMG’s).................................. 39
5.5 Software ............................................................................................................................... 41
5.6 Secondary staging area ......................................................................................................... 41
5.6.1 Umbogintwini rail siding ................................................................................................. 41
5.6.2 Bayhead Rail siding ......................................................................................................... 42
5.6.3 Racecourse rail siding ..................................................................................................... 43
5.7 Financial Feasibility ............................................................................................................... 43
5.7.1 Short Term – Multi-purpose facility .................................................................................... 44
5.7.1.1 Overview of the short-term conversion to containers ................................................... 45

viii
5.7.1.2 Benefits of the Proposed Conversion ........................................................................... 45
5.7.1.3 Capital Expenditure ..................................................................................................... 45
5.7.1.4 Expenses ..................................................................................................................... 45
5.7.1.5 Financial results ........................................................................................................... 46
5.7.1.6 Conclusion................................................................................................................... 46
5.7.2 Long term – dedicated container handling facility .............................................................. 46
5.7.2.1 Overview of the long-term conversion from bulk to containers .................................... 47
5.7.2.2 Model Assumptions ..................................................................................................... 47
5.7.2.4 Capital Expenditure ..................................................................................................... 47
5.7.2.5 Expenses ..................................................................................................................... 48
5.7.2.6 Financial results ........................................................................................................... 48
5.7.2.7 Conclusion................................................................................................................... 48
CHAPTER SIX.................................................................................................................................... 50
CONCLUSION ................................................................................................................................... 50
REFERENCES .................................................................................................................................... 51

ix
LIST OF FIGURES
Figure 1: Projected growth in Containerised volumes. Source: Transnet Port Development Plan
(2014) ............................................................................................................................................... 2
Figure 2: Port of Durban. Source: Transnet National Ports Authority Port Development Framework
Plans 2014 Presentation .................................................................................................................. 12
Figure 3: Crane moves per hour. Source: Transnet Annual Report 2015, 2013 & 2011 ..................... 20
Figure 4: Container moves per ship working hour. Source: Transnet Annual Report 2015, 2013 &
2011 ................................................................................................................................................ 21
Figure 5: Aerial view of Bulk Connections ....................................................................................... 31
Figure 6: Pier 1 Container terminal ................................................................................................. 31
Figure 7: Bulk Connections Rail Siding ............................................................................................. 33
Figure 8: Bulk Connections container crane ..................................................................................... 35
Figure 9: Graphical depiction of air draft.......................................................................................... 36
Figure 10: Number of Container Vessels able to berth at Bluff berths. Source: This Study .............. 37
Figure 11: Truck trailer units – Bulk Connections ............................................................................. 38
Figure 12: Movement of containers from vessel to stack (Source: Brinkmann 2011) ....................... 39
Figure 13 : Block Stacking: Source Brinkmann (2011) ..................................................................... 40
Figure 14: Linear Stacking: Source Brinkmann (2011) ...................................................................... 40
Figure 15: Umbogintwini Rail siding ................................................................................................. 42
Figure 16: Bayhead rail siding ......................................................................................................... 42
Figure 17: Racecourse rail siding ..................................................................................................... 43
Figure 18: Allocated short/medium and long term container stacking area at BC ............................ 44

x
LIST OF TABLES
Table 1: Private versus public split of operating licenses .................................................................. 13
Table 2: Gross crane moves per hour .............................................................................................. 20
Table 3: Container moves per ship working hour ............................................................................ 20
Table 4: Top terminals worldwide (Total crane moves per hour) ..................................................... 22
Table 5: Comparison of Bulk Connections to Pier 1 .......................................................................... 32
Table 6: Bulk Connections berth depth and length of quayside ....................................................... 33
Table 7: Profitability of short-term conversion to multi-purpose terminal ....................................... 46
Table 8: Profitability of conversion to a full container terminal ....................................................... 48

1
CHAPTER ONE
INTRODUCTION
1.1 Background and Context
The Port of Durban is one of the busiest ports in Africa, handling over 74 million tons of cargo
a year and 4000 vessel calls (Transnet National Port Authority (TNPA) Development Plan
2014). It is South Africa’s premier multi-cargo port and is also the leading port in the SADC
region. It serves the KwaZulu-Natal province, the Gauteng region as well as the wider
Southern African hinterland. Durban port also possesses some “hub” port characteristics,
from transshipment spokes extending to regional destinations and beyond. It acts as the
gateway between Far East trade, South-South trade, Europe and USA, and East & West Africa
regional trade.
The container terminal in the Port of Durban ranks as one of the largest and busiest container
facilities in Africa. It operates as two terminals – Pier 1 and Pier 2 – that have a combined
capacity of 3.6 million TEU (twenty foot equivalent units) per annum and handle 65 percent
of South Africa’s total seaborne container volumes (Transnet Port Terminals website). It is
currently operating close to its installed and design capacity as 2.8 million TEU was handled
for the 12 months to March 2015 (Transnet website). Transnet Port Terminals (TPT), a division
of Transnet SOC Limited, which is South Africa’s state-owned freight transport company, runs
all the container terminals in South Africa. Currently there are no private terminals in the
South African ports that manage container volumes in the scale handled by TPT.
Based on the United Nations Conference on Trade and Development (UNCTAD) 2015 report,
world container volumes saw an increase of 5.1 percent in 2014 with China making up the
largest proportion of these volumes. Containerized trade as it stands makes up one sixth of
total international seaborne trade and half of its total value (UNCTAD, 2015, 66). South
African container volumes, although making up only one percent of global volumes, have seen
annual average container volume growth of 5.2 percent over the last six years with growth
tapering off to 1.25 percent to the year ending March 2015 (Transnet annual report 2015).
Container volumes handled for the twelve months to March 2015 was 4.7 million TEU across
all the South African ports (Transnet Annual Report, 2015). Transnet in their 2014 Port
Development Plan estimated that approximately 14.8 million TEU’s will be handled by 2044
(See Figure 1), of which 8.8 million will be handled in Durban. The first phase of construction
for the new Dig-Out Port at Durban’s old airport site is expected to start between 2021 and
2025, so every indication is that overall container volumes are set to increase.

2
Figure 1: Projected growth in Containerised volumes. Source: Transnet Port Development Plan
(2014, p126)
With the current container terminal in Durban operating close to its notional capacity, there
is an increased opportunity for the private sector to become involved in container handling
operations. However, with limited land within the Port, and with current lease holders being
bedded down to 25 year lease contracts with Transnet, there is little possibility of suitable
land becoming available to new private operators to handle containers. The prospect of re-
aligning existing private bulk or break-bulk terminals within the port to cater for containerised
cargoes does, however, present more realistic possibilities.
Bulk Connections, a subsidiary of Bidvest South Africa, currently runs a specialist bulk handling
terminal in the Port of Durban. An average of four million tons are handled per year in
Handysize and smaller Panamax vessels, with the largest single export shipment being 62 000
tons. The site spans an area of approximately 21 hectares and includes a rail siding and four
berths, with depths alongside varying from 8.5 to 10 metres. Manganese, which is one of the
core minerals used in the production of steel, and coal which is used for domestic heating,
are the primary minerals handled. With coal and iron ore prices falling to eight and ten year
lows (PWC Mine 2015 and Hume, 2015), South African exporters are struggling to come in
under the Free on Board (FOB) selling price due to the high transport costs. The unavailability
of rail and high cost of road transport has forced many customers to cut back on Durban
exports in favour of lower-cost routes through Richards Bay and Port Elizabeth.
Neither the commodity market slump nor the stumbling Chinese economy look set to improve
in the short term. In addition, as Transnet Port Terminals just recently obtained a permanent
license to operate a manganese terminal at Ngqura, indications are that manganese volumes
will slowly be lost to Ngqura. So, with the world demand for cleaner energy (reducing coal
volumes) and manganese volumes being re-directed to Transnet Port terminal sites in Ngqura
and Saldanha, an opportunity opens up for Bulk Connections to add container capacity.

3
1.2 Scope of the Proposed Research Work
The scope of the proposed research work will consider the South African port system, the
model under which it is operated and managed, the role of private operators in the container
industry, international productivity norms and a case study for private sector involvement in
local container handling. The following will be addressed as part of the study:
The public versus private interface in the South African port system;
The role that Transnet plays in the freight logistics system of South Africa;
The role that private operators currently play in the Port of Durban with respect to
containerised volumes;
The effect that privatisation and competition has had in the ports sector in developing
economies;
Productivity levels that are deemed efficient for shipping lines visiting South African
ports;
Using a bulk handling terminal in the Port of Durban as a case study, addressing the
feasibility of converting either a portion of the site in the short term and/or the entire
site in the long term to handle containers. This would involve a detailed analysis of the
following:
The area of land required both in the short term and in the long term
to make this a feasible option together with the capacity constraints for
both options;
The level of capital investment required to provide suitable capacity at
acceptable risk levels;
Whether the current berth depths support the type and size of
container vessels that are currently visiting the Port of Durban;
The suitability of Bulk Connections’ container cranes to handle
proposed volumes at a rate comparable to Durban Container Terminal
or the extent and value of modifications required in order to meet
these requirements;
Whether container trains can be handled on the current rail siding and
the possibility of volumes being taken off site via rail instead of road;
A financial model to address the feasibility and the minimum required
returns to satisfy shareholders in order to proceed with the
investment;
Identification of possible sites along the rail route that could be used as
an interim storage solution awaiting container collection.
The aim of the study will be to assess the potential for private sector involvement in the
containerised industry in Durban, to investigate the implications for overall port productivity,
and to seek to understand the ripple effects this may have on growth in the rest of the
economy.
1.3 Study Overview
This study is divided into six chapters. Chapter One covers the background, scope and study
overview. Chapter Two provides the conceptual underpinnings and discusses the public

4
versus private interface, port costs, productivity, pricing models and different port authority
models. It also provides the background to the South African ports and freight logistics
system. This forms the theoretical background to the study. Chapter Three discusses the
effects that privatisation has had in the port sector of developing and developed economies.
Chapter Four considers productivity levels that are deemed efficient for shipping lines visiting
South African ports and for cargo owners whose commodities pass through those ports.
Chapter Five analyses Bulk Connections as a case study to assess whether the addition of
container capacity may be practicable and financially feasible. Chapter Six provides the final
conclusions to the study.

5
CHAPTER TWO
CONCEPTUAL UNDERPINNINGS
The role that the sea freight industry plays in global trade is significant. It allows countries to make
use of a transport mode that can move huge volumes of cargo from one part of the world to another
at very competitive prices. With ship owners becoming increasingly concerned about remaining cost
competitive in a dynamic market, port productivity and efficiency have come under the spotlight. The
more efficient and effective a port is, the more the economy and the country stands to benefit through
increases in the cost–competitiveness of its exports and reductions in the landed cost of imports, but
unfortunately the converse applies as well. These productivity and efficiency levels have a ripple effect
on the rest of the economy. A port’s cargo handling abilities, handling costs and ship turn-around time
play a critical role in the decision making of ship owners and cargo owners through their respective
decisions on optimal port and through-transport options.
2.1 Economic function of a port
A port can be regarded as a critical transportation node that facilitates both exports and imports whilst
at the same time assisting in the development and growth of the local economy. It can also be defined
as the interface between sea and land transport. It acts as the gateway through which goods and
passengers are transferred between shore and ship (Goss, 1990). The basic function of a seaport as
described by Goss (1990) is to minimize the cost of through transport. He states that a true measure
of the economic efficiency of a port is determined by the total costs of passing cargo through it.
Other objectives of seaports as described by Suykens (1986), include:
Maximize volumes handled through existing facilities
Maximize profits
Maximize returns on capital invested
Maximize employment levels within the port and/or region
Minimize transport costs
These objectives of seaports are clearly evident in Transnet’s own mission statement to “…....be a
focused freight transport company, delivering integrated, efficient, safe, reliable and cost-effective
services to promote economic growth in South Africa. We aim to achieve this goal by increasing our
market share, improving productivity and profitability and by providing appropriate capacity to our
customers ahead of demand” (Transnet website).
In South Africa, total logistics costs have been estimated to represent 15.2% of GDP (Fridge, 2007,1).
These costs make up approximately 2-3 percent of the final delivered cost of typical high-value liner
type cargoes and approximately 20-50 percent in the case of lower-value bulk cargoes. Port costs
alone making up around one seventh of total transport costs across the entire logistics chain (Ibid., 4).
Although they are not the biggest contributor to overall transport costs, they are by no means an
unimportant part of the value chain. These high transport costs together with the efficiency and
capacity of the national logistics system are regarded as one of the main binding constraints to the
government’s economic development program (Ibid.). Lowering the cost of doing business is seen to
be critical, in light of the sensitivity of foreign trade to high freight costs and the distance to market of
South Africa’s major trading partners (Ibid.).

6
More efficient seaports thus result in more efficient international transport services that have the
direct result of more trading partners which inevitably results in higher exports and imports. In order
to improve our competitiveness with the rest of the world and increase global trade, it is imperative
to reduce costs along the logistics chain.
2.2 Port Authority Models
There are essentially three different port management models which differ according to the level of
responsibility assumed by the private and public sectors. They are commonly known as:
Landlord port model
Tool Port model
Operating (Comprehensive) Port model
From a public sector viewpoint, assuming that the port authority is a public entity, the Operating port
model offers the greatest level of control followed by the Tool model and then the Landlord model.
The Operating model has traditionally been the dominant management model in Africa, however as
African governments are beginning to shift towards privatization in the port sector, the landlord model
is being increasingly adopted either wholly or partially.
2.2.1 Landlord ports
Landlord ports are characterized by a mix of both public and private sector participation. The port
authority acts as the landlord, whilst the cargo handling and port operations are carried out by private
companies. Examples of landlord ports include Rotterdam, Amsterdam and Hamburg and the Apapa
Container Terminal in Nigeria. This type of port model is the dominant model in larger and medium-
sized ports. In essence the interface of this kind of model is the quay edge; everything on the land
side of the quay edge is in the private realm and everything on the sea side is in the domain of the
Port Authority.
A lease is usually entered into by the port authority with the private operating companies. A rental is
paid based on a fixed sum per square meter per year. The private operators provide their own
buildings, offices, warehouses and equipment required to run their operations.
2.2.2 Tool ports
In the tool port model, the port authority maintains both the port infrastructure as well as the superstructure (ie wharf sheds, cranes, forklift trucks). All equipment owned by the port authority is usually handled by port authority staff. Private operators usually handle cargo on board the vessels and on the quay side. The Port of Chittagong in Bangladesh and the larger French ports (the so-called “ports autonome”) are examples of Tool ports. (Port Reform tool kit: Alternative port management structures & ownership models, 2015)
2.2.3 Operating ports
Operating ports have a predominantly public character. Under this type of model the port authority
provides the complete range of services, from owning, maintaining and operating every asset within
the port to cargo handling, stevedoring and storage solutions. An example of this type of model is the
Port of Mombasa in Kenya, which is owned and managed by the Kenyan Port Authority.
In a survey conducted by Suykens (1986) of European ports in terms of the way in which they were
managed, he found that Germany, Holland, Belgium, France and Italy operated more of a landlord
port model ie all maritime access routes and connections to the hinterlands were the responsibility of
the central authorities and all cargo-handling operations were rendered by private operators. In the
same vein, the ports of Singapore and Hong Kong, which are geographically very close, have different

7
port management models. Singapore has a port authority which performs all the functions within the
port area whereas Hong Kong has most of their port functions in the private sector and what is
interesting is that both ports have a reputation of being highly efficient.
Suykens (1986) therefore concludes that there is no single ‘best’ structure of managing and organizing
ports, however there are ways of improving their efficiencies.
2.3 Perfect competition and natural monopolies
Monopolies are categorized as industries that have a high barrier to entry, and have a single producer
that acts as a price maker. These industries are characterized by a lack of competition and a lack of
substitutes. Perfectly competitive markets on the other hand have many producers and consumers
and there are no barriers to entry and exit.
Historically most ports have been built and operated by governments due to the substantial
infrastructural requirements namely quay walls, entrance channels, breakwaters and berths. This
resulted in natural monopolies being created. There are many contrasting views amongst authors on
which type of ownership structure ie private versus public reaps better port efficiencies. Notteboom
et al (2000) maintained that port performance is not a function of ownership structure whereas
DeMonie (1996) was of the view that private investors’ pursuit of profit maximization could
undermine long-term investment in facilities. There are also various other case studies of terminals
all over the world showing that private sector involvement does achieve higher efficiencies in the port
terminal environment. This will be covered in greater detail in Chapter four.
Serrano and Trujillo (2005) noted that ports that adopt a partially public and private model, ie where
the authority provides the infrastructure and essential services and where cargo handling and marine
services are provided by private firms, have been generally viewed as the benchmark that other ports
aspire to. They stated that ports were adopting this model as it enhanced performance and
efficiencies. A further study conducted by Tongzon and Heng (2005) suggested that operational
efficiencies and competitiveness can be increased by private participation, however full port
privatization was not useful in improving port efficiencies.
2.4 Port Costs
Port costs can generally be divided into three broad categories according to Goss (1990). They are:
Port dues as payment for basic marine infrastructure and marine services;
Vessels time in the port ie vessel turnaround time; and
Cargo handling costs
2.4.1 Port charges
Port charges are fees that are charged to ship owners and cargo owners that cover the cost of
navigation channels, fairways, piloting, docking, breakwaters etc. According to Bennathan & Walters
(1979), port tariffs ought to reflect the relative cost of the services provided so that the appropriate
ship technology is chosen.
In a recent study performed by the Ports Regulator of South Africa (Ports Regulator of South Africa,
2015), comparisons were made between South Africa and other international ports in terms of port
costs and terminal handling charges. Costs charged by the National Port Authority to users in the
container and automotive sectors were charged at a premium of 166 percent above the global
average. Durban and Cape Town ports featured as the most expensive in terms of total port costs
compared to 15 other ports selected in the sample. Jawaharlal Nehru (India) and Vladivostok (Russia)
reflected the lowest port costs in the same sample.

8
In terms of broad approaches to port management, operations and pricing, there are two widely
known doctrines that underlie practices and policies adopted by various ports. They are known as the
European doctrine and the Anglo-Saxon doctrine (Bennathan & Walters, 1979, 1). The European
doctrine basically views ports as elements in social overhead capital, and as development engines that
may contribute to the ‘progress of the industry and trade in the hinterland’ (Ibid., 3). As such the
achievement of financial break-even, or the earning of accounting profits are subordinated to these
overarching developmental objectives. On the other hand the Anglo-Saxon approach takes a
narrower view of ports as self-standing financial entities, to which the achievement of reasonable
rates of profit and returns on capital invested serve as the essential rationale behind all investment
decisions, and hence the principal objective of pricing policy is to set tariffs at levels that generate
revenues in excess of associated costs.
A third doctrine, the Asian Doctrine, contends that all port assets and related infrastructure should be
in the public sector (Lee and Flynn, 2011, 796). Due to import and export commodity prices of
developing countries being more sensitive to international transport costs, the Asian port pricing
framework is based on administered pricing, cross-subsidization and the public enterprise approach.
This public enterprise approach entails part of the total construction costs being allocated to social
overhead capital as the port is seen to have a major impact on the national and regional economy.
Port charges are then set accordingly.
It appears that the Anglo Saxon approach is the approach that the South African port authorities have
adopted in their pricing methodology. This methodology enables them to recover their investments,
and other categories of their costs as well as earn a profit commensurate with the risk that they bear.
The revenue that is so determined is then allocated to the various port users by means of the tariff
structure. The question then is, would ports that adopt this doctrine be automatically priced higher
than those that adopt either the European or Asian doctrines?
2.4.2 Vessels time in the port
A vessels time in the port is defined by Goss (1990) as “the opportunity cost of the ship’s time, roughly
equivalent to its time-related operating costs (wages, insurance, repairs….) plus the profit that could
be earned elsewhere”.
2.4.3 Cargo handling costs
Cargo-handling costs, which are probably the most significant of the three elements identified above,
are charged for moving or transferring cargo from the quay side to the vessel or vice versa. The more
productive a terminal is in transferring this cargo, the lower a vessel’s time in port which then
contributes to lower port costs. Productivity and efficiencies at cargo-handling terminals therefore
play a crucial role in port performance which ultimately affects costs. Port performance and
productivity will now be looked at in greater detail.
2.5 Port Performance and productivity
According to DeMonie (1987), port performance cannot be assessed based on a single measure or a
single all-encompassing value but rather on the duration of a ship’s stay in the port, the quality of the
cargo-handling and the quality of the service to inland transport. In container terminals, there are a
variety of key performance indicators that are used to measure day to day terminal management for
both short-term and long-term planning. Ratios that are typically measured include:
Crane moves per hour
Dwell time
Berth occupancy ratio

9
TEU’s per hectare
Yard occupancy ratio
Quay line design and shape
These indicators will be discussed below.
2.5.1 Crane moves per hour
The most frequently used indicator of productivity or the quality of cargo-handling is “gang output”
or “containers per gross crane hour” or GCMPH. This can be defined as the number of moves or cycles
that a crane can achieve within a given period. The cycle is the movement of the crane from the
quayside to the vessel and then back again. The annual handling capacity of an individual quay crane
is approximately 130 000 moves, based on 24 moves per hour (Drewry, 2010, 2). The global average
is around 110 000 reflecting that actual results deviate from the theoretical capacity due to a host of
factors. These factors include the type of vessel that is being worked, the skill of the operator, the
speed in which containers are fed to and from the stacks and the extent to which cranes have to be
moved between holds (Ibid.).
In the situation where there is no truck waiting to take the container away to the stack or alternatively
no container to deliver to the crane, this will result in an interruption of crane operations. A five
minute delay each hour, could result in a loss of two moves per hour which on a 24 hour port call could
result in an additional 1.9 hours in the port (Drewry, 2010, 19)
In a recent article by Drewry Shipping Consultants, it is interesting to note that with containerized
vessels getting bigger and bigger, berth productivity does not necessarily increase in line. A 19 000
TEU vessel which is 50% bigger than a 13 000 TEU vessel, only reflected a 20% increase in the number
of crane moves per day. This arises from the fact that the overall length (loa) of container vessels
generally increases less than proportionately with their TEU carrying capacity. The vessels have
become beamier, deeper and are stacked higher and wider. Consequently, additional gantry cranes
cannot readily be deployed on available quayside alongside the vessel, since vessel length has not
increased appreciably with increased ship size (Drewry, 2015).
2.5.2 Dwell time
Another port performance measure used often in the containerized industry due to space constraints
at terminals is “Container dwell time”. This measures the time in days that a container stays at the
terminal, before clearance from the yard to the final consignee, or before loading onto a vessel.
Terminals aim to keep this number as low as possible. The longer a container remains in the terminal,
the lower the throughput that a terminal of fixed spatial dimensions can achieve.
Dwell time for imports is the time that a container remains in the yard from the time it is discharged
from a vessel to the time it is taken out of the terminal gate. Most terminals across the world grant a
5-7 day free dwell time (Drewry, 2010,6) for imports before storage fees start being calculated. Dwell
time for exports is the number of days that a container is in the yard prior to its being loaded onto a
vessel. Terminals usually set a date for export containers arriving, to avoid a situation where
containers arrive too early. Export dwell times are usually around 3 to 5 days (Ibid.).
2.5.3 Berth occupancy ratio
The berth occupancy ratio can be defined as the proportion of time that a vessel is alongside a given
berth. It is calculated by dividing the number of hours the berth is occupied by the number of hours
that the berth is available.
10
Berth time is a component that if reduced can significantly affect a vessel’s turnaround time. “A ship’s
waiting time for a berth” and a ship’s “time at the berth” are two crucial measures that face ports with
acute congestion. Ideally the shipping lines would prefer immediate berthing, no waiting time and a
larger number of berthing points. On the other hand ports prefer reducing their capital infrastructure
as much as they can whilst at the same time achieving high berth occupancy levels (De Monie,
op.cit.,10). The duration of stay is thus a vital indicator of the quality of service offered to port users.
Berth occupancies of 70% or more are indicative of congestion and a decline of services whereas berth
occupancies of 50% or less signify underutilization of resources (Ibid.). Based on the Drewry study,
an optimum level of berth occupancy for a typical multi-berth container terminal is estimated to be
65 percent (Drewry, op.cit, 6). Once the congestion point of a terminal is reached, queuing of vessels
increases significantly and service quality drops. Dedicated terminals with set scheduled ship arrivals
are deemed to have higher berth occupancy levels than when compared to common-user terminals
that have a more mixed ship arrival pattern. The congestion point at these common user terminals is
reached typically at a much lower berth occupancy level.
2.5.4 TEU’s per hectare
TEU’s per hectare measures yard productivity in a container terminal. It indicates how intensively the
yard infrastructure is utilized in processing throughput as well as the capacity a terminal has in storing
boxes for loading, unloading and transshipment. In a study (Ports Regulator of South Africa, 2015)
performed by the Port Regulator, which benchmarked South African container ports to a sample of 15
other container ports of varying sizes throughout the world, the average container terminal size was
shown to be 262 hectares. Durban Container Terminal (DCT) has a land area of 185 hectares which
in terms of this study is well below the international average (Ports Regulator of South Africa, 2015).
In terms of TEU’s handled per hectare, according to the Drewry (2014) study, the global average of
throughput per annum was 24 791 TEU’s per hectare. In terms of the Port Regulator study based on
a smaller sample of ports the average was 22 344 TEU per hectare. This study reported a strong
relationship between volumes handled and the size of the respective terminal. Durban’s TEU per
hectare worked out to 14 930 per hectare which was well below the average. Shanghai container
terminal on the other hand was the highest at 94 380 TEU per hectare (Ports Regulator of South Africa,
2015). This indicates that Durban has a sub-optimal use of available terminal area. However this
cannot be viewed in isolation and market share or available volumes need also be taken into
consideration.
2.5.5 Yard occupancy ratio
A container yard can be split into a number of slots that are used for stacking containers. These slots
are not simply ground slots but they also take into account the maximum stacking height. The yard
occupancy ratio is therefore calculated by dividing the number of containers in the yard at any given
time by the total number of slots available. This ratio is usually quoted as a percentage.
The international norm is regarded as 70% as this allows maximum efficiency of a terminal. The more
full a stack is, the more double handling is required which not only reduces efficiencies but increases
costs.
2.5.6 Quay line design and shape
In order to achieve maximum utilization in a terminal, the design and shape of the quay working area
is very important. Container terminals that were designed as such from the outset compared to
general cargo or bulk terminals that were converted to container terminals have large variances in
terminal efficiencies. According to Drewry, the most effective shape is a box shape with three equal-

11
length quays. The following are also listed as important factors that would affect terminal
productivity:
All berths should be equidistant from the central point of the container stack
A similar draft at all quay walls would permit all vessels calling (including those arriving out of
their nominated time windows) to be berthed at another quay without materially affecting
any landside operations. Also customers need not wait for their preferred berth to clear.
A terminal that has a straight line quay tends to be less efficient because if a vessel has to
berth away from its optimal berth, longer distances have to be traveled to move containers
to and from the stack. Also there would be a lot more localized congestion in one particular
area which reduces performance.
The least efficient layout is a terminal that has been converted from general cargo or bulk
cargo operations. The land area in these terminals is disproportionate to quay lengths, the
drafts may be shallower, berths are shorter and vessels will more likely end up queuing.
2.6 The South African Ports System
Prior to 2002, the control of the South African ports lay in the hands of Portnet which was
subsequently divided into the SA Port Authority and the SA Port Operations (SAPO). As a result of the
White Paper on National Transport Policy, Portnet was restructured to facilitate the proposed
privatisation process (McPherson, 2004, 84). The ownership of the port would be vested with the
National Ports Authority to allow for better control of port infrastructure, and terminals would be
concessioned or opened up to the private sector. The restructuring allowed Portnet to fit into the
more conventional landlord/operator model (Ibid.).
In 2002, the SA Port Authority became the National Ports Authority (NPA) and the South African Port
Operations (SAPO) became a separate entity now known as Transnet Port Terminals. “The NPA
performs landowner and regulatory functions and is responsible for the development and
management of port property and infrastructure, the supply of marine services to vessels and marine
safety” (McPherson, 2004, 84). The NPA in turn leases out cargo handling operations to TPT. Both
NPA and TPT fall under Transnet and are thus effectively owned by Government. The South African
ports therefore represent one of the few examples in the world (seven of the top 100 ports) whereby
all three port functions, namely regulator, landowner and operator, are all under public control (Ibid.)

12
Figure 2: Port of Durban. Source: Transnet National Ports Authority Port Development Framework
Plans 2014 Presentation
The port of Durban has a total land and water area amounting to 1854 hectares with the water surface
at high tide being 892 hectares and 679 hectares at low tide (Ports.co.za, 2015). Figure 2, above is a
graphical representation of the Port of Durban indicating where the different types of cargoes are
handled from. Transnet Port terminals (TPT), through the Pier 1 & 2 container terminals, the
automotive terminal and the Point and Maydon Wharf multi-purpose terminals, lease approximately
35% of this land. The balance of the land is occupied by private terminals, commercial transport
logistics companies, the ship repair yard and some of the back of port area. If one had to exclude the
Maydon Wharf berths, which no particular company has dedicated access to, TPT would have
monopoly or dedicated access rights to 60% of the quay space in the rest of the port.
In order to be able to operate within any port in South Africa, two things are essential namely:
a Lease and
an operating license.
Transnet owns all the land in the eight commercial ports. A lease would need to be entered into by
operators/terminal handlers in order to use the land. Leases are usually entered into for a 25-year
period, with five-year renewal options. The possibility of new entrants coming into the market is
remote as operators that currently lease land have invested significant capital expenditure over a
period of time and usually have long tenure left on their leases. Barriers to entry are therefore high.
Aside from having a lease with TNPA, an operating license is required as well. The operating license
specifies requirements around maintenance of the terminal, performance and safety measures,
reporting requirements, Broad Based Black Economic Empowerment (BEE), and details around the
types of cargo that can be handled. The duration of the license period is usually the same as the lease.

13
Within the port of Durban, 54 licenses have been issued, of which Transnet has six (Transnet website).
Table 1 reflects the breakdown of the different categories of licenses issued in the Port of Durban.
(Transnet Operator Licenses Issued: Port of Durban, n.d.)
Table 1: Private versus public split of operating licenses: Source: details obtained from website
As is clearly evident the only segment of the industry that Transnet has no involvement in is the Liquid
bulk industry. The private sector on the other hand does not have a license to operate in either the
Containers or Automotive sectors.
It appears that private firms have been granted operating licenses to handle cargo, provided they are
not in direct conflict with the business/cargo handled by the state. Competition is therefore restricted
to specific commodity types that are non-core activities of TPT. This introduces serious constraints to
competition across the full spectrum of port functions and access to cargoes.
2.7 Transnet National Ports Authority (TNPA)
TNPA, a division of Transnet SOC Limited, manages and runs the eight commercial ports in South
Africa, in a landlord capacity. They are responsible for the safe, effective and efficient functioning of
the national port system. Their service offering can be divided into two categories namely the
provision of port infrastructure and the provision of maritime services. The regulatory and legislative
environment under which they operate is the National Ports Act 2005 (Act No. 12 of 2005). In terms
of Chapter 3, Clause 11 of the Act, some of their core functions include:
To plan, provide, maintain and improve port infrastructure;
To control land use within ports;
To provide or arrange for road or rail access to the ports;
To provide or arrange adequate, affordable and efficient port and marine related services;
and
To exercise licensing and controlling functions in respect of port services and facilities.
TNPA therefore controls who can operate within the port, what their lease conditions are, and what
products they can handle (in terms of their operating license). Over and above this they have the
power to determine the level of capital expenditure that can be invested into the various ports either
via deepening of berths, strengthening of quay walls, deepening entrance channels or investment in
port infrastructure.
Of the eight commercial ports, the only ports that have visible and extensive private participation are
Durban and Richards Bay. All major port operations in the other ports, other than liquid bulk and the
fruit terminal in Cape Town, are managed by Transnet Port Terminals (TPT) with the overall control
and regulation of the port being managed by TNPA.
What is interesting to note is that when the National Ports Act came into being in 2005, it listed its
main object as “to promote and improve efficiency and performance in the management and
operation of the ports” and to “strengthen the State’s capacity to separate operations from the
landlord function within ports” (National Ports Act, Chapter 1, section 2 (b) & e(i)).
Dry Bulk Liquid Bulk Multi-purpose Break-bulk Containers Automotive Total
Public 1 0 2 1 1 1 6
Private 8 24 12 4 0 0 48
Total 9 24 14 5 1 1 54

14
Section three of the Act goes on to state that as soon as the Act takes effect, the Shareholding Minister
must ensure that the National Ports Authority of South Africa must be incorporated as a company,
with its memorandum and articles of association registered under the name “National Ports Authority
(Pty) Ltd” with the State being the sole shareholder. To date, however, this has not occurred and
every indication is that there is no intention by Transnet Limited to excise TNPA from its sphere of
control.
In a report to Parliament in February 2010, Transnet Group Executive Buyou Kahla was reported as
having stated that the National Ports Act of 2005 provides for the corporatization of the National Ports
Authority. He said the prospect of having the business broken up as well as that of "corporatization"
were realities and risks that had "to be placed before potential investors". He further commented
that the possibility of corporatization would jeopardize Transnet's ability to raise capital and any move
to corporatize the para-statal would also put it in breach of its major loan agreements.
This could be the reason that TNPA hasn’t been excised from Transnet’s sphere of control. This,
however, has far reaching implications in terms of competition and productivity within the South
African Ports system.
2.7.1 Market Demand Strategy and Capital Investment
President Jacob Zuma announced in his State of the Nation address in 2012 that Transnet would invest
more than R300 billion over a seven year period to modernize the country’s rail, ports and pipelines
infrastructure. The aim was to achieve a significant increase in freight volumes that would not only
rejuvenate the South African economy but also create new jobs and address poverty and inequalities.
Of these funds, R200 billion was to be channeled to Transnet Freight Rail (TFR) to expand their rail
infrastructure and increase capacity. Successful implementation of this Market Demand strategy
would result in Transnet’s revenue trebling from R46 billion to R128 billion over a seven year period,
at least in terms of Transnet’s estimates (Transnet Freight Rail, 2015).
In terms of Transnet’s 2014 Port Development Plan, expansion projects in the short term included the
infill and stack reconfiguration of Durban Container Terminal (DCT) and development of a new
dedicated passenger terminal. TNPA’s medium-term projects included the infill and stack extension
onto Salisbury Island of Pier 1 container terminal, the berth deepening and channel widening of
Maydon Wharf and adding liquid bulk capacity by the addition of five extra berths. The expansion of
Pier 1 will add 1.4 million TEU capacity to the current 700 000 TEU capacity at Pier 1. This will be as a
result of expanding landside operations and adding two new deep berths (2014 Transnet Port
Development Plan).
Maydon Wharf currently has 15 berths measuring a total of 2 809 metres and handles different
commodities from bulk, break-bulk to containers (Hutson, 2014). The cost of reconstruction and
deepening of Maydon Wharf berths 1-4 and 13-14 is estimated at around R760m (Engineering News:
Transnet awards R760m Maydon Wharf reconstruction contract, 2014). The new quays would be able
to accommodate larger vessels as well as provide suitable load carrying capacity for handling cargo
over those berths. Currently berths 8-13 form part of TPT’s Multi-Purpose Terminal and has become
an important “overflow” terminal for handling of containers (Hutson, 2014).
As a result of berthing areas being extended lengthwise during the Maydon Wharf upgrade, the future
Maydon Wharf will have a reduced number of 9 berths compared to 15 (Hutson, 2014). In a notice of
intent by TNPA, it was stated that TNPA will in future retain full control over all the berths and that no
leaseholder will be granted dedicated berthing rights (Ibid.).

15
According to the Transnet website current projects that Transnet are also busy with are:
Saldanha Iron Ore Expansion (60 to 80mtpa)
3rd Tippler at Saldanha Iron Ore Terminal
Ngqura Container Terminal Phase 2A (Equipment)
Pier 1 Phase 2 Infill Infrastructure & Cargo Handling Equipment (1 180 000 TEUs)
Richards Bay Expansion
Richards Bay Quayside Equipment
DCT Berth 205 Extension Infrastructure (400 000 TEUs) and Cargo Handling Equipment
Cape Town Container Terminal Expansion
Straddle Carrier Replacement at Port Elizabeth Terminal
In March 2015, Public Enterprises Minister Lynne Brown officially opened berths 3 & 4 at the Ngqura
Container Terminal. This investment entailed the building and deepening to 16 metres of the two
additional berths at the container terminals. In addition two mega-max ship-to-shore cranes, 18
rubber tyred gantries and 48 haulers and bathtub trailers were purchased. The total investment by
TPT and TNPA totaled R2 billion. This investment increased the terminals operating capacity from 800
000 TEU to 1.5 million TEU and its design capacity to 2.2 million TEU. The minister stated that this
investment will enable the terminal to handle larger container vessels, improve efficiencies and vessel
turnaround times and increase customer satisfaction. (Transnet: Minister Brown marks massive
Transnet investment in Ngqura, 2015)
What is interesting to note is that a majority of TNPA’s capital investment both short and long term
has been aimed at improving capacities at TPT-run terminals. There are no indications in the short to
medium term of any capital investment for privately-run terminals in terms of deepening of berths or
strengthening of quay walls.
2.8 Transnet Port Terminals (TPT)
Transnet Port Terminals (TPT), also a division of Transnet SOC Limited, manages many of the terminals
in the eight commercial ports. TPT currently has a monopoly in the automotive market and is
dominant in the break bulk and container-handling segments. Although TPT operates the three
dedicated deep sea container terminals in Durban, Cape Town and Ngqura, it does not have a total
monopoly as there are a few private sector stevedoring companies that handle a small volume of
containers at their own private multi-purpose berths.
2.8.1 Proposed new terminal - Ngqura Manganese Facility
South Africa holds more than 80 percent of the worlds’ manganese resources. It is used in the
production of steel and there is no satisfactory substitute in this application. It is in demand globally
due to its high grade and South Africa has approximately 46 percent Manganese content in its ore
compared to China which has less than 20 percent (DMT Geosciences, 2015). Manganese is mined
almost exclusively in the Northern Cape Province, in the Kalahari and the Postmasburg manganese
fields. Its closest and most efficient export route is thus from the Eastern Cape.
Manganese is currently being exported from Port Elizabeth and to a smaller scale through Durban and
Saldanha. The Port Elizabeth terminal is currently operating at its installed capacity of 5.5 million tons.
Because of these terminal capacity constraints, manganese has found an outlet via other means; up
to 700 000 tons has been handled using skiptainers at the Port Elizabeth multi-purpose terminal and
16
over one million tons at the container terminal. Up to three million tons have also been exported
from Durban.
Transnet announced that they would move the shipment of manganese ore from Port Elizabeth to
Ngqura Port, 20 kilometres north-east of Port Elizabeth, by 2019. The capacity of the new terminal
will be 16 million tons ramping up to a possible 20 million tons per annum. In August 2015 cabinet
granted TPT the operating license to run the Manganese terminal at Ngqura (Fin24, 2015, August 14)
Transnet plans to spend R30.1 billion over the next seven years expanding rail and port infrastructure
in the Eastern Cape (Mahlaka, 2015). The first phase costing R2.3 billion will be used to upgrade the
rail infrastructure by introducing new passing loops for 200-wagon trains that will run from
Postmasburg to Coega (Fin24, 2015). All of this is aimed at promoting economic growth and
development in the Eastern Cape.
Whilst all of this will help improve the local economy, what is interesting to note is that a facility was
granted to TPT to manage without it being opened up to the private sector. Section 56 of the Ports
Act states that if the Ports Authority enters into any agreement with a person with respect to the
design, construction, rehabilitation, development, finance, maintenance or operation of a port
terminal or port facility - they may only do so if entered into with a procedure that is “fair, equitable,
transparent, competitive and cost-effective.
Section 79 (1) of the Ports Act reads:
“The Minister may, in writing, direct the Authority to perform a specified act within the Authority’s
power or not to perform a specified act, if such direction is necessary………to promote the national,
strategic or economic interests of the Republic……”
So although the private sector was not included in the tender process for the terminal, which should
have occurred in terms of S 56, the overarching conditions of S 79 seem to have been applied in
granting TPT the license to operate the manganese facility in Ngqura.
2.8.2 Proposed new terminal - Durban Dig-out Port (DDOP)
Due to capacity constraints at the container terminal in Durban, extensive pre-feasibility studies have
been conducted by Transnet into the construction of a new Container terminal at the old Durban
International Airport Site in Durban. The new facility will see capacity increasing from 2.8 million TEU
to between nine and twelve million TEU by 2040 (Engineering news, Feb 2014)
According to an article by Business Report, Transnet group strategy general manager presented that
the following had already been conducted by Transnet with respect to the new Dig-out port:
Landside geotechnical investigations had been undertaken
Biodiversity due diligence study and contamination/groundwater assessment was completed
A sustainability steering committee was established to oversee design, development and
operations of the dig-out port
Met-ocean investigations to establish current and wind data were completed
Hydrographic surveys on the seabed configuration were finished
Media reports indicate that this project will cost in the region of R75-R100 billion and would take
between 20 to 40 years to complete. The first phase of construction was expected to start between
2021 and 2025 (Business Report, Feb 2015). However, Richard Vallihu TNPA Chief Executive,
mentioned in a recent business-to-business breakfast (December 2015) that construction of the dig-
out port would be “shifted out a bit”. He declined to provide a start date (Comins, 2015).

17
Jamie Simpson, an international adviser and expert on port development has warned Transnet against
pursuing the dig-out port saying that efforts should rather be redirected to maximizing efficiencies at
the existing facilities. His contention is that a capital investment plan and operational improvement
plan should be developed that should address demand in the next 5-10 years. Once this is done then
only can Transnet ‘weigh up’ whether a bigger port is in fact needed in light of market conditions and
availability of finance (Manda, 2015).
Should the dig-out port come out for tender in the foreseeable future, the question arises whether
Section 56 will be applied in terms of inclusion of the private sector in a fair and equitable process or
would Section 79 be applied again in terms of a ministerial decree being given to TPT as this is deemed
to be in “the promotion of the national, strategic and economic interests” of the country.
The trebling of Transnet’s profits after their seven year Market Demand Strategy (MDS) strategy would
seem to be in the economic interests of the country, however the effect on port users in terms of
higher costs and the possible loss of port traffic to neighbouring ports cannot be discounted as this
could have far reaching implications for the future growth and sustainability of the local economy.
Goss states that should the policy of a country be that of maximizing profits, this is likely to be harmful
when there is no competition between ports (Goss, 1990, 219).
2.9 Transnet Freight Rail (TFR)
Transnet Freight Rail (TFR) is the largest division of Transnet Ltd, making up approximately 60% of
total Transnet revenue and profits (Transnet Annual Report 2015). They specialize in the transfer of
freight that includes automotive, containers, lime & cement, coal, grain, fuel, manganese etc.
Considering that TPT and the private terminals share commonalities in terms of the same kind of cargo
handled ie coal, manganese, wheat, maize and break bulk, a possible conflict arises in terms of rail
allocations to TPT terminals versus private terminals. Durban has seen a steady rise in manganese
exports over the last few years as a result of the Port Elizabeth terminal reaching capacity. With high
levels of demand, and most of the cargo being road-trucked to Durban, albeit at a higher rate,
manganese volumes have found an outlet from private terminals in the port of Durban for the last 2-
4 years.
However, the recent slump in commodity prices over the last eight months has not only resulted in
decreased volumes through the private terminals in Durban, but Transnet’s recent action of equalizing
rail rates to their two terminals in Port Elizabeth and Saldanha, has had a debilitating effect on volumes
passing through the private terminals in Durban.
With Transnet being both the terminal operator and controller of rail logistics, a conflict of interest
could arise from prioritizing their own terminals at the expense of the private terminals.
2.10 Inter-port Competition
Kaselimi and Notteboom in a recent article (Kaselimi & Notteboom, 2015) stated that the Landlord
port model or governance model adopted by Transnet creates a factual monopoly in the container
terminal business in South Africa. TPT does not face competition locally in this market segment
however competition is faced from global terminal operators in neighbouring countries specifically
Maputo (Mozambique), Walvis Bay (Namibia) and the ports on the islands of Mauritius and
Madagascar. They contend further that if container terminal operations are opened up to outside
terminal operators, this could change the competitive dynamics in the region. Their model considers
opening up the Container terminal in the Port of Ngqura to private operators. They believe this will
bring a new balance to the port business in South Africa. Operational efficiencies will increase due to
inter-port competition, which will far outweigh the fact that TPT has one less terminal to operate.

18
Transnet, they contend is a public entity and profit maximization should not be its primary objective.
The positive impact of better quality services, distribution channels and corridors being improved will
boost the economy of the area surrounding the ports as well as the hinterland. The contention of the
authors is that there are far reaching benefits to opening up the market to private operators.
According to the Administered Prices Study conducted by the Trade and Industry Chamber (FRIDGE,
2007, 3), ports that are leaders in both pricing and performance measures around the world are
usually located in regions that are characterized by high degrees of competition.
South African ports are administered on a national level with uniform national tariffs being applicable
to all ports. There is no inter-port competition and virtually no price competition (Mcpherson, 2004).
In terms of South Africa’s port pricing, port charges are based on revenue targets set by Transnet.
These pricing principles may be argued not only to be distortionary and harmful to trade, but also to
militate against government’s desire to lower the costs of doing business in South Africa. According
to the FRIDGE study, this kind of strategic port pricing should be phased out completely. (FRIDGE,
op.cit., 53).
Transnet, in the South African model, is both the Landlord and the Operator which creates a potential
problem if both the private and public sector are competing for the same cargos. In addition Transnet
Freight Rail, the countries rail operator, responsible for bringing in a significant portion of the cargo
into the ports is also a division of Transnet SOC Limited. This could further exacerbate the problem of
Transnet terminals gaining priority over private terminals over all incoming rail cargo. Further to this
TNPA are granted the authority to issue operating licenses. This has the potential to seriously
compromise competition should the range of cargoes handled by private operators be limited.

19
CHAPTER THREE
PORT PRODUCTIVITY
In 2014 the Ports Regulator of South Africa conducted a benchmarking exercise on the productivity of
the South African container and automotive terminals (Durban, Port Elizabeth, Ngqura and Cape
Town) to 16 other terminals all over the world. The aim of the study was to highlight areas where
South African terminals were performing well, but also to identify areas where improvements needed
to be made. The ports were selected based on publicly available information that was comparable
but also on a number of factors including:
South Africa’s trading partners in the BRICS countries namely Brazil, Russia, India and China;
Developing countries similar to South Africa in terms of economic growth rates;
Same trade routes of vessels calling at South African ports and
Ports that are comparable in terms of volumes handled (Ports Regulator of South Africa,
2015).
The Port Regulator Study compared South African container terminals to a group of terminals that
varied in terms of volumes handled; some were similar and others were significantly higher (eg. Ports
of Shanghai, Rotterdam and Antwerp). Berth, yard and crane productivity ratios were compared for
all 20 ports selected in the sample. Several of these performance indicators will be discussed in the
Chapter sections that follow.
3.1 TEU per hectare
Since container volumes handled at South African ports were in many instances lower than those
recorded at international comparator ports, the South African port system performed below certain
other countries when measuring TEU’s per hectare, suggesting that they could have a more productive
and efficient use of their terminal area (Port Regulator Benchmarking Report, 2014/15). The average
TEU per hectare for the sample size was 22 344 with all South African terminals well below this
average. Durban was the highest of all the local ports, at 14 930 per hectare. Shanghai showed the
highest TEU’s per hectare for the sample at 94 380 per hectare. This analysis reflects that capacity at
our local ports has not been fully exploited.
3.2 Cranes per running metre of berth
For the sample of 20 terminals selected, the average length of working quayside (or berth length) per
crane was 144 metres (Benchmarking SA ports, 2015, 22). Durban, Port Elizabeth, Ngqura were below
the average indicating that they have more cranes per running metre of berth when compared to the
sample. Durban has 1 crane per 117 metres of berth and Ngqura 1 crane per 72 metres of berth.
Shanghai was the lowest at 28, meaning that a crane is positioned every 28 metres, which could be
justified considering volumes handled.
In terms of volumes handled, Durban (2.8 million TEU) is very similar to the Gioia Tauro and Bahia De
Algeciras; however their berth metre per crane was 197 and 186 metres respectively, indicating that
Durban may have too many cranes per metre of berth and may possibly be over-capitalised in terms
of gantry superstructure.
3.3 Gross crane moves per hour and Container moves per ship working hour
What the benchmarking report did not contain was information or statistics around gross crane moves
per hour (GCMPH) which is defined as the number of moves or cycles that a crane can achieve within

20
a given period. When Public Enterprise Minister Malusi Gigaba unveiled the seven new Ship-to-shore
cranes in the Port of Durban in 2013, he mentioned that the improved capabilities of the cranes would
result in a massive jump in productivity. He stated that terminal efficiencies will increase from 26
GCMPH to 33 GCMPH (27% improvement) over the following three years and container moves per
ship working hour would consequently increase from 68 containers to 85 containers an hour (Greve,
2013). This does not appear to be the case from the statistics reported by Transnet in their Annual
reports as noted in Table 2 and 3 below, as gross crane moves per hour have in fact declined in 2014
and 2015 compared to statistics reported in 2013.
Table 2 reflects statistics on crane moves per hour and container moves per ship working hour that
were obtained from published Transnet Annual reports. An interesting fact to note is that even with
significant capital expenditure, crane moves per hour have in fact declined over the last two years.
Pier 1’s crane moves per hour dropped from 24 moves per hour in 2014 to 22.2 moves per hour in
2015. Pier 2 also decreased from 25 moves to 24 moves per hour for the financial year ending March
2015.
2011 2012 2013 2014 2015
Pier 1 26 27 23 24 22.2
Pier 2 23 23 28 25 24
Table 2: Gross crane moves per hour. Source: Transnet Annual Report 2015, 2013 & 2011
Container moves per ship working hour is defined as the number of containers that a terminal is able
to load and discharge within an hour after adjusting for any delays out of the terminals control. This
ratio declined in the last two years for Pier 2, however Pier 1 has shown an improvement.
2011 2012 2013 2014 2015
Pier1 40 44 43 46 48
Pier2 47 42 62 59 58
Table 3: Container moves per ship working hour. Source: Transnet Annual Report 2015, 2013 & 2011
Figure 3: Crane moves per hour. Source: Transnet Annual Report 2015, 2013 & 2011
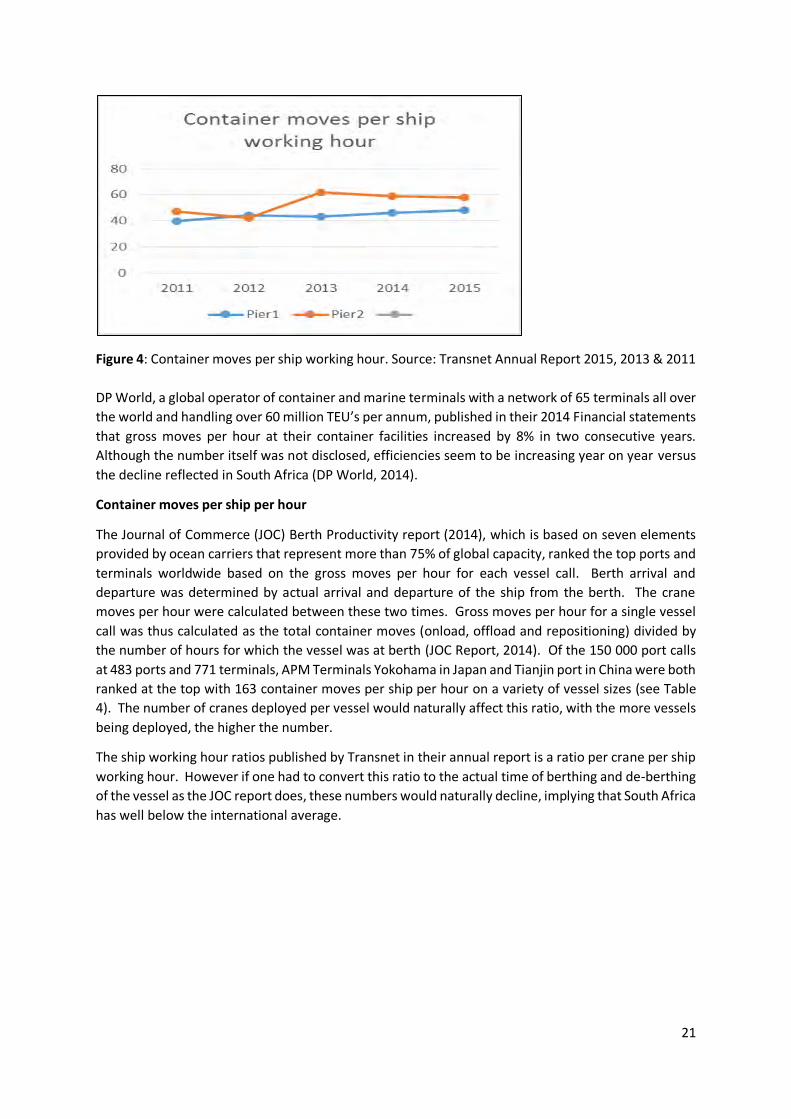
21
Figure 4: Container moves per ship working hour. Source: Transnet Annual Report 2015, 2013 & 2011
DP World, a global operator of container and marine terminals with a network of 65 terminals all over
the world and handling over 60 million TEU’s per annum, published in their 2014 Financial statements
that gross moves per hour at their container facilities increased by 8% in two consecutive years.
Although the number itself was not disclosed, efficiencies seem to be increasing year on year versus
the decline reflected in South Africa (DP World, 2014).
Container moves per ship per hour
The Journal of Commerce (JOC) Berth Productivity report (2014), which is based on seven elements
provided by ocean carriers that represent more than 75% of global capacity, ranked the top ports and
terminals worldwide based on the gross moves per hour for each vessel call. Berth arrival and
departure was determined by actual arrival and departure of the ship from the berth. The crane
moves per hour were calculated between these two times. Gross moves per hour for a single vessel
call was thus calculated as the total container moves (onload, offload and repositioning) divided by
the number of hours for which the vessel was at berth (JOC Report, 2014). Of the 150 000 port calls
at 483 ports and 771 terminals, APM Terminals Yokohama in Japan and Tianjin port in China were both
ranked at the top with 163 container moves per ship per hour on a variety of vessel sizes (see Table
4). The number of cranes deployed per vessel would naturally affect this ratio, with the more vessels
being deployed, the higher the number.
The ship working hour ratios published by Transnet in their annual report is a ratio per crane per ship
working hour. However if one had to convert this ratio to the actual time of berthing and de-berthing
of the vessel as the JOC report does, these numbers would naturally decline, implying that South Africa
has well below the international average.
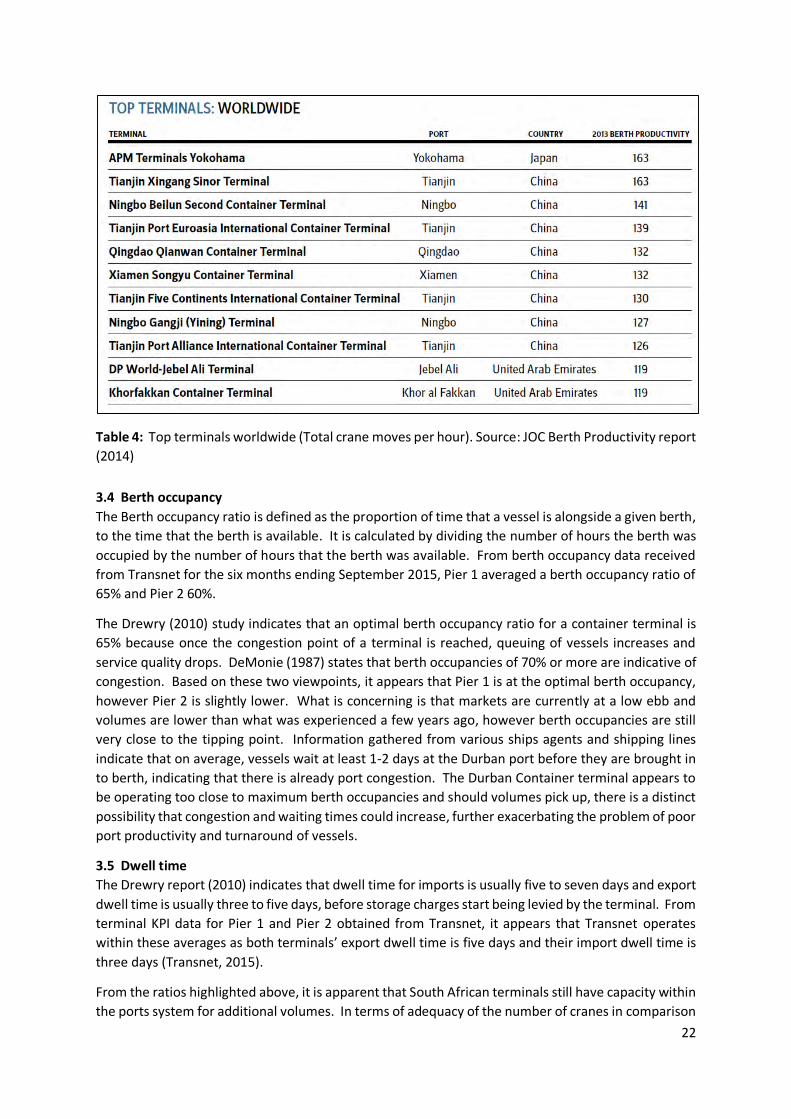
22
Table 4: Top terminals worldwide (Total crane moves per hour). Source: JOC Berth Productivity report
(2014)
3.4 Berth occupancy
The Berth occupancy ratio is defined as the proportion of time that a vessel is alongside a given berth,
to the time that the berth is available. It is calculated by dividing the number of hours the berth was
occupied by the number of hours that the berth was available. From berth occupancy data received
from Transnet for the six months ending September 2015, Pier 1 averaged a berth occupancy ratio of
65% and Pier 2 60%.
The Drewry (2010) study indicates that an optimal berth occupancy ratio for a container terminal is
65% because once the congestion point of a terminal is reached, queuing of vessels increases and
service quality drops. DeMonie (1987) states that berth occupancies of 70% or more are indicative of
congestion. Based on these two viewpoints, it appears that Pier 1 is at the optimal berth occupancy,
however Pier 2 is slightly lower. What is concerning is that markets are currently at a low ebb and
volumes are lower than what was experienced a few years ago, however berth occupancies are still
very close to the tipping point. Information gathered from various ships agents and shipping lines
indicate that on average, vessels wait at least 1-2 days at the Durban port before they are brought in
to berth, indicating that there is already port congestion. The Durban Container terminal appears to
be operating too close to maximum berth occupancies and should volumes pick up, there is a distinct
possibility that congestion and waiting times could increase, further exacerbating the problem of poor
port productivity and turnaround of vessels.
3.5 Dwell time
The Drewry report (2010) indicates that dwell time for imports is usually five to seven days and export
dwell time is usually three to five days, before storage charges start being levied by the terminal. From
terminal KPI data for Pier 1 and Pier 2 obtained from Transnet, it appears that Transnet operates
within these averages as both terminals’ export dwell time is five days and their import dwell time is
three days (Transnet, 2015).
From the ratios highlighted above, it is apparent that South African terminals still have capacity within
the ports system for additional volumes. In terms of adequacy of the number of cranes in comparison

23
with similar terminals handling the same volumes, it appears sufficient. The productivity, however, in
terms of crane moves per ship working hour does not match even their own optimistic forecasts. This
has a considerable cost effect on vessels visiting the port as it affects vessel turnaround time which
ultimately affects the end cost to the user.

24
CHAPTER FOUR
THE EFFECTS OF PRIVATIZING
There have been many articles and case studies written on the advantages of privatizing ports and the
benefits that can be reaped by the national economy. Privatization has been reported in some case
studies to improve operational efficiencies, profitability, and output but on the counter side, it is said
to decrease labour intensity.
Karl Socikwa, Chief Executive of Transnet Port Terminals told delegates at the African Ports Evolution Conference (Magwaza, 2014), that privatisation of ports would not guarantee efficiencies nor optimise performance. Chris Wells, acting chief executive of Transnet stated in 2010 that high investment was more important to improvement than privatisation. It is apparent from these two statements that Transnet’s view is that privatisation is not a tool that can be used to optimise and improve efficiencies to grow the local economy.
This Chapter will explore these apparently opposing views by outlining some international instances (almost all from ports in developing countries), where greater private participation has been introduced into port systems, often with salutary consequences, and at other times with apparently positive influences on operations that remain in the public realm.
4.1 India – Port of Jawaharlal Nehru
India, a country that has 12 major ports and 185 minor ports, was opened up to the private sector in the 1990’s in keeping with the policy of economic liberalisation (Mehta, 2007).
Indian ports were known for their inefficiencies which resulted in higher port costs and sea transport costs which made them non-competitive in international markets (Ray, 2004). Due to their long waiting times to berth, the bigger carrying lines and the more cost-efficient vessels refused to stop at Indian ports resulting in containerized cargo being transshipped in Dubai, Singapore or Colombo with higher resultant costs and longer transit times. In addition corrupt practices of port staff in India resulted in additional costs being incurred which was ultimately borne by the end user. All of this resulted in the cost of imports and exports being overpriced and uncompetitive (Ibid.)
The Jawaharlal Nehru Port, one of the 12 major ports, is located within the Mumbai harbour on the
west coast of India. This was the first port in India to be opened up to the private sector in the 1990’s
(Ray, 2004). The organizational model of the port was changed from a service level port to a landlord
port model. Initially plans were in place to open up the existing container terminal within the
Jawaharlal Nehru port to the private sector. However, this was later shelved in order to protect the
interests of labour and other groups. Instead, it was decided to invite the private sector to construct
a new container terminal on a Build Operate Transfer (B-O-T) basis for a period of 25 years with the
terminals fixed assets to be handed back to the port authority at a written-down value at the end of
the lease period (Ray, 2004)
Thirty companies from India and abroad purchased the bid document, however the contract was
awarded to P&O Ports, Australia. This was India’s first ever private container terminal christened the
Nhava Sheva International Container Terminal (NSICT) and it commenced operations in 1999. From
its inception the new terminal provided stiff competition to the Jawaharlal Nehru Public Container
terminal (JNPCT), causing traffic diversions in favour of NSICT due to better performance (Ray, 2004).
This carried on for a period of two years. However, with the support of the labour unions and a change

25
in the mindset and practices of the staff, the public terminal started improving efficiencies and
productivity and there was a reverse trend of traffic diversion back towards the public terminal.
Two lessons learnt from the private terminal involving labour practices was the introduction of an
official incentive scheme that would assist port workers in expediting cargo movements and the
introduction of a “hot seat exchange” system that would result in no breaks between shifts thus
increasing labour productivity. The official incentive scheme replaced unethical practices that was
prevalent in the port system (Ray, 2004).
At the time the case study was published (2004), the Jawaharlal Nehru port, as a result of the modern
and highly efficient private terminal earned the distinction of being the world’s 29th largest container
port and India’s most successful port. By opening up competition in the Jawaharlal Nehru port,
improvements were discernible in that not only did port traffic increase but so did productivity levels
(up by two thirds) and vessel turnaround times (up by one third) (Mehta, 2007).
The overall message from this case study is that private sector involvement can be introduced in such
a way that it does not replace public sector involvement but rather introduces a healthy competitive
environment whereby everyone stands to benefit. The introduction of the private sector not only
helped with inter-port competition but also with intra-port competition.
The biggest beneficiaries of the whole reform process were the exporting and importing community
(the family of Indian cargo owners or shippers) of the country who were given a more efficient outlet
to trade with the rest of the world.
4.2 Malaysia – Kelang Container Terminal
In a World Bank Study conducted in 1992 of 12 cases of divestiture from State-owned enterprises,
evidence indicated that there was a definite case of benefits to privatization (Haarmeyer & Yorke,
1993). 11 of the 12 cases found that there was a general increase in the net welfare to the
government, buyers, consumers, workers and others, irrespective of whether there was full or partial
privatization (Ibid.).
In the analysis of the Kelang Container Terminal that was divested from the Kelang Port Authority,
(Kelang being Malaysia’s principal port), results indicated that the divestiture was an “unqualified
success” (Haarmeyer & Yorke, 1993). Kelang accounted for two-thirds of Malaysia’s containerized
trade and was the country’s first sale under the government’s privatization program.
The privatization process started in 1985, and the newly incorporated private company was granted a
21 year lease, whereby rental was negotiated to be paid to the port authority on an annual basis and
included a variable component for volume throughput. All 801 employees were absorbed by the new
private company and employment was guaranteed for at least five years. Privatisation turned out to
be a boon for these employees as five years later, in 1990, their compensation rates were 83% higher
than their public sector counterparts (Ibid.). Aside from a significant rise in labour costs, there was an
equally impressive rise in labour productivity.
Five years on, container traffic had increased by 75%, there was a decline in unit costs and a halving
of repair, maintenance and administration costs. The World Bank, in discussions with the terminal
union officials, identified seven factors that explained the increase in productivity. They were:
More labour input into decision making
New feeling of “belonging” resulting in less loitering and absenteeism
Incentive bonuses
Work force restructuring

26
Work force flexibility
Improved marketing
New technology (Haarmeyer & Yorke, 1993)
Of the seven factors listed above, five are purely labour related issues. The Kelang case offers a
powerful presumption that by improving incentives and better labour management practices and
technology, workers are automatically more productive which makes the terminal more efficient but
also enables the workers to earn a higher compensation – a win-win situation for all.
4.3 Africa
4.3.1 Port of Maputo
Maputo is the capital of Mozambique which lies on the East Coast of Africa. It is an Indian Ocean port
that has seen steadily increasing volumes over the last 10 years. The Port covers an area of 129
hectares and 3000 metres of wharves that range in depth from 8 to 12 metres (World Port source
website). It went from handling 5 million tons in 2003 to handling 19.5 million tons in 2014 (Port of
Maputo presentation). Due to its strategic geographical position serving the southeastern coast of
Africa, it is an important trade link for landlocked countries such as Zimbabwe, Botswana and
Swaziland. In 2000 the government of Mozambique handed the port of Maputo over to the Maputo
Port Development Company (MPDC), a public/private participation deal, with 51% held by the MPDC
and the remainder by government. The 51% is owned by a consortium made up of DP World (40%),
Grindrod (40%) and Mozambique’s state-owned railway company (20%) (Port of Maputo website). A
25 year concession agreement to manage and develop the port was awarded to the MPDC, who took
over in April 2003 (Ibid.). They immediately launched into a priority works program by investing
USD$70 million into upgrading of road and rail connections with South Africa and Zimbabwe (Ports
website)
Currently the MPDC is involved in a $100 million project to deepen the access channel of the port from
11 metres to 14.2 metres (Venter, 2015). This project will allow access to fully-laden Panamax vessels
and will be completed by the middle of 2016. The aim of the project (per Alan Olivier, CEO of Grindrod
– shareholder of MPDC), was to make the Maputo port more competitive from a pricing point of view.
Due to pricing pressure in the commodity markets, the port was required to become more efficient in
terms of loading and discharging vessels faster and being able to handle bigger vessels.
In addition, the recent reduction in tariffs by the Port of Maputo, has made Grindrod’s car terminal
more cost competitive when compared to Transnet’s car terminal facilities in Durban and Port
Elizabeth. This will allow the terminal to be more cost effective and competition will become more
fierce with Durban’s car terminal facilities that are themselves reaching capacity.
Maputo is gradually increasing its share of containers, bulk goods and now automotives which it is
slowly winning away from the South African ports. South Africa therefore in the medium to long term
could face increasing competition with the Port of Maputo that is investing significantly in increasing
their capacity and improving efficiencies.
4.3.2 Apapa Container Terminal - Nigeria
In the 1990’s Nigerian ports were plagued with increasing inefficiencies, long turn-around times for
vessels and rising container dwell time. In addition their labour force was unproductive, overstaffed
and engaged in corrupt practices (Mohiuddin & Jones, 2008). All of this led to excessive port-related
charges. On top of all of this the Nigerian Ports Authority required permission from either the
President of the country or the Minister of Transport for all major decisions which led to an inefficient

27
and lengthy decision making process (Ibid.). There was excessive government interference, a
burdensome bureaucratic structure and conflicting roles as regulator and operator.
Nigeria undertook a major port reform strategy in 2006 as part of a drive to bring the port sector in
line with international best practice. Concession of all ports was handed over to the private sector.
The aim of the concessions was to boost efficiency of the port operations, decrease port costs and
accelerate economic development to make Nigeria the hub for international trade in West Africa. In
a study of Nigeria’s six ports performed by Nwanosike (2010) five years post concession, the results
revealed a remarkable increase in efficiency in the year that the terminal operators took over the
operation of the ports. In addition cargo throughput and ship traffic increased considerably after the
concession indicating that the Nigerian ports had regained traffic that had been lost to neighbouring
countries in the pre-concession era.
In 2006 the Apapa Container terminal in Lagos Nigeria, now the busiest container terminal in West
Africa, was privatized to APM Terminals. APM invested USD $220 million since obtaining the
concession and has significantly improved terminal productivity. Vessel waiting time reduced by 70%
from 30 days to nine days, within a few months of APM taking over. Records were also set in 2009
(three years after concessioning) where container vessels were loaded within two days compared to
six days a year earlier. Constant improvements and investment in efficiencies has resulted in vessel
waiting time being altogether eliminated and container volumes doubling in the last eight years (Boyd,
2015).
4.4 South America - Brazil
Brazil has 34 public ports and 129 private terminals with 70% of the cargo being moved by private
terminals (Maritime Trade Intelligence, 2014). Before privatization was introduced to Brazil in 1993,
ports were inefficient, had high operating costs and suffered from low productivity (Burke, 2007).
These inefficiencies and handling charges that were almost double those of international ports
resulted in exporters losing up to $5 billion in export opportunities (Ibid.). As part of the drive to make
the economy more competitive, the Brazilian government passed a ports modernization law in 1993
that transferred the administration of the ports to the State Authority and transferred some of the
operations of the ports to the private sector.
The lease of the container terminal at the Port of Rio Grande was awarded to a private consortium for
a period of 25 years. After a significant investment of $50 million, new technology was introduced
and productivity increased by 234% over a five year period. Container moves increased from 80 000
to 300 000 over this period, exceeding all forecasts (Burke, 2007). This not only improved transport
logistics in Southern Brazil but created more skilled employment in the region.
Another port in Brazil, the Port of Salvador was privatized in 2000. It was rated by customers as Brazil’s
worst port due to its shallow draft and quays so short that smaller vessels had to unload a bit at a time
(Economist, 2013). Again a 25 year lease was awarded to a private consortium. In the last decade,
the private operators, Wilsons Sons have spent 260 million Reais (the equivalent of USD $70 million)
in replacing equipment, lengthening quays and increasing water depth alongside berths, with the
result that capacity has doubled (Ibid.). With export volumes improving and container volumes
increasing by 300 percent over a five year period (2000-2005), this had the knock-on effect of
attracting big international companies to the region (Burke, 2007).

28
4.5 The South African context
From the various case studies mentioned in this chapter, from India to Brazil to Nigeria and Malaysia, all have indicated improved port efficiencies and productivity as a result of increasing competition and private sector participation in the port sector. Interestingly enough many of these case studies involved specifically the privatisation of container terminals. South Africa is interesting in that the container industry is the only market that private operators have not been allowed to get involved in. Container Operating licenses within the port of Durban, Cape Town and Ngqura have only been granted to TPT. The question one has to ask is why has the private sector been excluded from this particular market? A recent press article (Moorcroft, 2015) indicated that a private company (Siyakhaphuka) has taken Transnet to the Competition Commission on the grounds that it had not been given the rights to operate a container facility in Richards Bay. The initial proposal for this facility was made to Transnet seven years ago and despite the company’s strong case and appeals from the industry, Transnet maintains that Richard Bay operations should focus on four main activities namely coal, break-bulk, dry bulk and liquid bulk. The company accused Transnet of anti-competitive behaviour in trying to prevent the construction and operation of the container terminal. They maintain that opening up the terminal would draw Richards Bay into the global container shipping network but it would also attract the major shipping lines and create thousands of direct and indirect job opportunities. In addition it should bring many economic benefits to the port in terms of increased imports and exports. The company in its statement said that it had the backing, including the funding of Maersk, a major international container shipping line as well as an international container terminal operator (APM Terminals). This case is still currently under review before the Ports Regulator and Competition Commission. Notteboom and Kaselimi (2015) stated in a recent article in Port Technology that should container
terminal operations be opened up to outside terminal operators, the competitive dynamics in the
region could be changed. Their study considered opening up the container terminal in the Port of
Ngqura to private operators. They hold the view that this will bring a new balance to the port business
in South Africa as operational efficiencies will increase due to inter-port competition. This will have a
positive impact in terms of better quality services and distribution channels and corridors being
improved that will have a knock-on effect of boosting the economy of the area surrounding the ports
as well as the hinterland.
Notteboom has written extensive articles on hub ports in terms of the South African context.
Essentially a hub port is a port that facilitates global trade to smaller hubs and distribution networks.
Notteboom (2011) performed an analysis of the South African container port system with the aim to
identify via multi-criteria analysis which of the three South African ports (Durban, Ngqura or Richards
Bay) would best suit a hub port configuration. His analysis concluded that Ngqura was the best choice
in terms of a hub as it met the objectives of contributing towards the sustainable development of the
South African and Sub-Saharan African community.
Further, he contends that should Ngqura be made a hub, import and export cargo will be at a
disadvantage due to higher cargo dues and terminal handling charges as a result of double and triple
handling of transshipped containers. In addition, with Ngqura being further away from Gauteng, the
main hinterland region, inland costs would be higher. From a ship operating perspective, however,
the single call option would be more favourable versus the multi call option as savings and cost
reductions could be made in marine charges, port dues and ship costs. The hub port configuration
could only work if rates for transshipment cargo could be lowered and rail rates out of Ngqura to
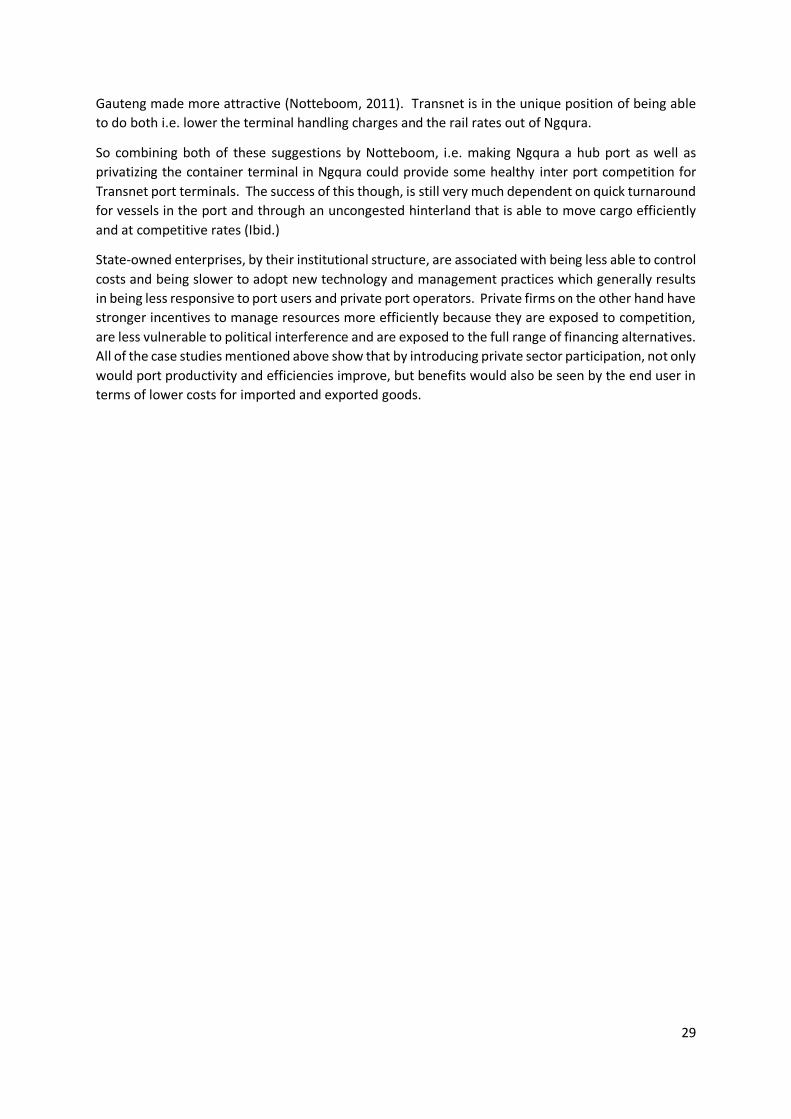
29
Gauteng made more attractive (Notteboom, 2011). Transnet is in the unique position of being able
to do both i.e. lower the terminal handling charges and the rail rates out of Ngqura.
So combining both of these suggestions by Notteboom, i.e. making Ngqura a hub port as well as
privatizing the container terminal in Ngqura could provide some healthy inter port competition for
Transnet port terminals. The success of this though, is still very much dependent on quick turnaround
for vessels in the port and through an uncongested hinterland that is able to move cargo efficiently
and at competitive rates (Ibid.)
State-owned enterprises, by their institutional structure, are associated with being less able to control
costs and being slower to adopt new technology and management practices which generally results
in being less responsive to port users and private port operators. Private firms on the other hand have
stronger incentives to manage resources more efficiently because they are exposed to competition,
are less vulnerable to political interference and are exposed to the full range of financing alternatives.
All of the case studies mentioned above show that by introducing private sector participation, not only
would port productivity and efficiencies improve, but benefits would also be seen by the end user in
terms of lower costs for imported and exported goods.

30
CHAPTER FIVE
CASE STUDY: BULK CONNECTIONS
Bulk Connections is a multi-purpose bulk handling facility situated in the Island View area in the Port
of Durban that has a capacity to handle 5.5 million tons of dry bulk minerals. The terminal specializes
in the soft or gentle handling of products for both import and export. They handle a wide range of
commodities which includes coal, coke, manganese and chrome. Sized sensitive bulk products that
break easily or are large and lumpy can be handled just as easily as grains, powders or concentrates.
Designed especially for degradation-sensitive cargoes, the terminal is capable of loading in excess of
20 000 tons per ship per day.
The cargoes are transported to the terminal either in block trains of up to 65 wagons at a time or via
road trucks. They are then stacked into designated stockpiles and once the allotted shipment is
received they are loaded onto vessels either via bottom discharge containers or conveyors. The
containers are transported to the vessel and lowered into the vessels hatch, whereupon the doors
open and the product flows out. The two container cranes have the flexibility of handling 20 and 40
foot containers as well as break bulk.
The conveyor system runs in excess of 2000 tons per hour and at a rate of 40 000 tons per day. Vessels
are discharged by grab unloaders that can either load road or rail wagons directly. The stacks can
accommodate up to 600 000 tons of pre-assembled product at any given time; however, 400 000 tons
is considered optimum for the infrastructure on hand.
Bulk Connections was chosen as a case study for the handling of containers due to its land area,
dedicated berths and rail sidings, all of which will be discussed in detail below. What needs to be borne
in mind, however, is that containers can only be handled on site if a multi-purpose or container
operating license is given by TNPA and the lease agreement is adjusted accordingly. It is not the
intention of this paper to address the intricacies around this process.
Comparisons have been made between Pier 1 and Bulk Connections (BC) to determine the suitability
of BC handling containers in any capacity.
5.1 Land Size
The Bulk Connections site covers an area of 21.8 hectares. The land parcel area is extremely long and
narrow, 2.2 km long by only 210 metres at its widest section and 10 metres wide at its narrowest
section. It is located between the northern extremity of the Island View/Fynnlands Complex and the
harbour mouth’s south pier that lies at the end of the Bluff. Bulk Connections has four berths of
varying depths with a 743 metre long quayside.

31
Figure 5: Aerial view of Bulk Connections
The Durban Container Terminal, managed by Transnet Port Terminals, is operated from two Piers in
the Port of Durban namely, Pier 1 and Pier 2. These piers have a land area of approximately 19.7
hectares and 110 hectares respectively (Transnet’s Pier 1 & 2 fact sheet). Considering Bulk
Connections’ similarity in land size to Pier 1, albeit in different dimensions, comparisons have been
made between Bulk Connections and Pier 1.
Figure 6: Pier 1 Container terminal
Pier 1 (Figure 7), operated and managed by TPT, was originally a multi-purpose terminal before it was
converted to a container-handling facility in 2007. It was created to absorb the growth in container
traffic after the Durban Container terminal reached its maximum capacity (Transnet website). Pier 1

32
accounts for almost one fifth of the TEU’s handled by the Durban Container Terminal today. It has 4
992 ground slots with a capacity to hold a maximum of 24 960 TEU’s at any point in time. The terminal
utilizes rubber tyred gantries and haulers to load and unload vessels (Pier 1 fact sheet). It provides
two berths with a 660 metre long quayside and berth depths of approximately 12.2 metres per the
October 6, 2015 harbour masters’ sounding.
Pier 1 and Bulk Connections have almost the same land size or area, however the disparities arise in
the shape of the land. Pier 1 is box shaped and BC is rather irregular and almost tear dropped in shape.
According to Drewry’s (2010) analysis, an ideal quay line design and shape should be a box shape as
this is fundamental in achieving the maximum utilization, and has a significant effect on quay line
performance. Brinkmann (2011) suggests that for new terminals being constructed, depth of land of
between 600-800 metres would be ideal. Bulk Connections (BC) is at an immediate disadvantage. This
does not necessarily discount the possibility of handling containers in its entirety.
The Drewry study also contends that the berths should ideally be equidistant from the central point
of the container stack. This may work in favour of Bulk Connections due to its long thin land area;
however, the fact that the four Bulk Connections’ berths have varying depths could pose a problem
should handling of bigger vessels become the norm. In terms of quay side length Bulk Connections is
at an advantage of being marginally longer than Pier 1. Should Transnet at some stage decide to
deepen the berths, this would work in favour of Bulk Connections in that not only would they be able
to handle vessels with a deeper draft but they will be able to accommodate vessels with a longer LOA
as well.
Table 5: Comparison of Bulk Connections to Pier 1
5.2 Berth Depths
With the new generation of vessels getting larger and larger as demand by sea increases, the question that arises is whether the Bulk Connections berths could practicably support these bigger vessels. When the entrance channel was widened a few years ago, the outer entrance channel was deepened to 19 metres shallowing to 16.5 metres draft in the inner channel (Ports website). This has allowed vessels from Handymax to Post-Panamax to visit the Port (Ibid.).
The Port of Durban has 64 berths of which 8 are purely for container vessels (Transnet website). The
depth of the container vessel berths range from 8.5 metres to 12.2 metres per the October 6 sounding
obtained from the harbour master.
The Bulk connections site has access to 4 dedicated berths with varying quay-side lengths and depths.
Quay side lengths vary from 148m to 238m and draft depths vary from 8.5m to 10m. The Panamax
vessel is the largest vessel that can be handled on the Bulk Connections berths. The berths are
technically designed to handle vessels of 40 000 tons, however vessels of up to 65 000 tons have been
handled. Due to the restrictions of length and depth of the berths, berthing and loading of the newer
vessels have become more complex and trickier over the years.
Parameter Bulk Connections Pier 1
Land size 21.8 hectares 19.7 hectares
Shape of land Tear drop Square
Length of quay side 733 660
Number of berths 4 2
Berth depths Betw 8.5m to 10.5m Betw 8.5 and 12.2m

33
Bulk Connections berths Berth depth (metres) Length of quay side (metres)
1 8.5 148
2 9.7 177
3 8.5 180
4 10 238
Table 6: Bulk Connections berth depth and length of quayside
Although the overall quayside length is longer compared to Pier 1, the varying berth depths do pose a
problem. The maximum draft of 10 metres and quayside length of 238 metres is much lower than
Pier 1’s draft of 12.2 metres and maximum quayside length of 351 metres (Pier 1 fact sheet). This will
drastically affect the size and length of vessel that can be handled. Container vessels of the size and
magnitude handled by Pier1, may not be able to be accommodated at the Bulk Connections’ berths,
however this does not discount the smaller cellular vessels.
5.3 Rail Sidings
Bulk Connections has the largest private siding network in the Port of Durban. The siding is called
“Wests” and has a siding number of 651 958 (See Figure 8). It is connected to the main line and all
incoming trains are brought directly from the mines into the exchange yard. Bulk Connections shunts
all rail wagons on site using their own locomotives as this has proved to be the most efficient way to
move cargo to exactly where it is required. Three locomotives (two 55 ton and one 35 ton), are
operated and maintained by terminal staff.
Figure 7: Bulk Connections Rail Siding
Rail traffic to and from the terminal is managed jointly by Bulk Connections and Transnet Freight Rail
staff. Distances from the terminal to the South African mines range between 300 to 900 kilometres.

34
Trains are usually scheduled to arrive on a regular basis at the terminal, based on a vessel’s loading
plan. This is to ensure that there is sufficient cargo stockpiled prior to vessel arrival. Traffic en route
is constantly monitored with changes and adjustments made to the sequencing of traffic by the
terminals operations management.
The terminal currently receives between 10-15 fifty-wagon trains on a weekly basis with an 18 hour
turnaround, however with the recent slump in the commodity markets, this has slowed to an average
of 8-10 trains a week. The terminal has a capacity to handle 28 fifty wagon trains a week. With
increased congestion on our roads due to road trucks, there is a drive by Transnet to move product
back to rail. The fact that Bulk Connections has such a big rail siding is an advantage in that container
volumes can be brought in and moved off site via rail thus reducing congestion within the Port
confines. BC would easily be able to accommodate two 100 TEU container trains on a daily basis and
be able to turn them around within the required time.
Currently BC does not have a rail account with TFR as all bulk commodities coming into the site via rail
are handled and negotiated between TFR and the customers directly. Should BC wish to proceed with
handling of containers, an account would have to be opened up directly with TFR. Although this
appears quite easily done, there is no guarantee of the number of trains that will be received into the
terminal either on a weekly or monthly basis. Bulk commodity trains received into the terminal have
more often than not been problematic as arrival times are never guaranteed with many of the trains
arriving on the weekend.
All administration and disbursement costs would have to be settled with TFR by BC and then recovered
directly from the end customer. Rail therefore appears to be more administratively difficult and
burdensome from a cash flow point of view as there is a time lag between outlays to TFR and receipt
from the end customer.
The Durban Container terminal has three rail lines. Eight fifty-wagon trains are received at Kings Rest
Station on a daily basis with plans to ramp this up to eleven trains in the short to medium term. Once
wagons arrive at Kings Rest Station they are diverted to either Pier 1 or Pier 2 Container terminals.
Although there is a drive to move cargo from road to rail, competitive road truck rates together with
the double handling that rail entails, still makes road the preferred transport choice. Unless TFR has
a serious look at their freight rates and service delivery, road volumes may be here to stay. If that is
the case, road volumes through the Island View complex, where Bulk Connections is situated, could
cause severe traffic concerns. Bulk Connections is within a National Key Point and permits are
required by all persons entering. The increased administration and traffic problems within the rather
confined area could be problematic.
Bulk Connections at its busiest time was handling approximately 300 road trucks delivering dry bulk
minerals a day, so operations management are familiar with safety and operational requirements.
However should road truck volumes substantially increase due to container traffic, special
arrangements may need to be made to have road trucks pick up and deliver after hours ie six in the
evening to six in the morning to reduce congestion in the Island View area.
5.4 Equipment required for container handling
5.4.1 Gantry cranes / quay-side cranes
Bulk Connections has the advantage of having access to four dedicated berths. It currently has two
container cranes that load vessels via bottom discharging containers (See Figure 9). The container
cranes have the ability to handle both 20 foot and 40 foot containers. The cranes have a safe working
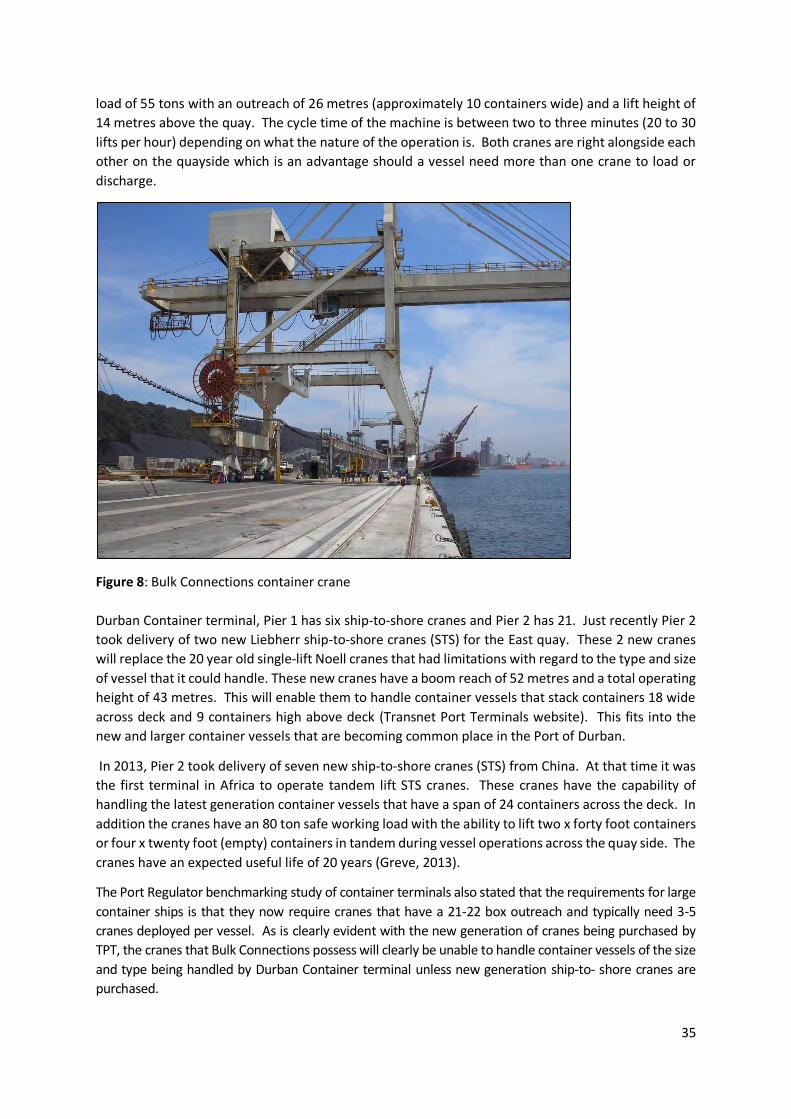
35
load of 55 tons with an outreach of 26 metres (approximately 10 containers wide) and a lift height of
14 metres above the quay. The cycle time of the machine is between two to three minutes (20 to 30
lifts per hour) depending on what the nature of the operation is. Both cranes are right alongside each
other on the quayside which is an advantage should a vessel need more than one crane to load or
discharge.
Figure 8: Bulk Connections container crane
Durban Container terminal, Pier 1 has six ship-to-shore cranes and Pier 2 has 21. Just recently Pier 2
took delivery of two new Liebherr ship-to-shore cranes (STS) for the East quay. These 2 new cranes
will replace the 20 year old single-lift Noell cranes that had limitations with regard to the type and size
of vessel that it could handle. These new cranes have a boom reach of 52 metres and a total operating
height of 43 metres. This will enable them to handle container vessels that stack containers 18 wide
across deck and 9 containers high above deck (Transnet Port Terminals website). This fits into the
new and larger container vessels that are becoming common place in the Port of Durban.
In 2013, Pier 2 took delivery of seven new ship-to-shore cranes (STS) from China. At that time it was
the first terminal in Africa to operate tandem lift STS cranes. These cranes have the capability of
handling the latest generation container vessels that have a span of 24 containers across the deck. In
addition the cranes have an 80 ton safe working load with the ability to lift two x forty foot containers
or four x twenty foot (empty) containers in tandem during vessel operations across the quay side. The
cranes have an expected useful life of 20 years (Greve, 2013).
The Port Regulator benchmarking study of container terminals also stated that the requirements for large
container ships is that they now require cranes that have a 21-22 box outreach and typically need 3-5
cranes deployed per vessel. As is clearly evident with the new generation of cranes being purchased by
TPT, the cranes that Bulk Connections possess will clearly be unable to handle container vessels of the size
and type being handled by Durban Container terminal unless new generation ship-to- shore cranes are
purchased.

36
From a review of Port Bar Chart reports, it appears that many smaller cellular vessels are loading and
discharging containers at Maydon Wharf using the two TPT cranes as well as ships gear, so even if BC cranes
cannot be used at all because of crane restrictions, ships gear is still an alternative to load and discharge
containers.
Air draft
In determining the maximum size of vessel that can be handled at Bulk Connections, the tides have to
be taken into consideration. Tides are very important when berthing and loading vessels as tides
affect the vessels under keel clearance and vertical clearance between it and the ship loaders/cranes.
Many vessels are tidal, meaning that they may be restricted in terms of their arrival and departure
schedules due to under keel clearance reasons. These vessels can only enter and leave the port at
high tide.
The air draft can be measured as the difference between the water level and the highest point on a
vessel, which is usually the hatch combs for a bulk loading vessel (see Figure 10). Vertical clearance is
the excess distance after air draft that allows a vessel to safely pass under an object. Failing to
calculate the air draft correctly and not having sufficient vertical clearance could lead to significant
damages to both the vessel and quay side equipment.
Air draft is one of the most common problems facing every vessel that comes in to berth at the Port
of Durban. Some larger vessel callers, particularly when in ballast or lightly loaded, are associated
with larger air draft, which causes problems when product needs to be loaded into the vessel. This is
due to the clearance between the crane and the vessel/hatch not being sufficient to avoid contact
between them.
High tides are convenient regarding under keel clearance and moving in or out of the harbour,
however they restrict the vertical clearance between the vessel and the quay crane as the vessel rides
higher. Low tides are convenient regarding vertical clearance but restrictive concerning under keel
clearance and moving in or out of the port.
Figure 9: Graphical depiction of air draft

37
For the two container handling cranes at Bulk Connections, air draft was calculated as 18 metres from
Chart datum, with a one-metre vertical clearance. Clearly the current quay cranes at Bulk Connections
will be unable to service the larger vessels due to height restrictions of the crane. Unless modifications
are carried out to the crane in terms of increasing its height and lengthening its boom, vessel sizes will
be restricted due to air draft and not having sufficient vertical clearance from the crane.
An analysis was done for the 12 months ending August 2015 of all container vessels that came into
the Port of Durban. Their LOA (length overall), their beam, and their draft (forward and aft) was
ascertained from information gathered from Transnet reports. Unfortunately data on air draft was
unavailable. The reason for the analysis was to determine what percentage of these vessels based
on their LOA and draft would have been able to be accommodated at the Bulk Connections berths
(Bluff Berths).
For the 12 month period, statistics obtained reflected that 2 286 container vessels entered the Port of
Durban. Of this, 713 (31%) would have been able to be accommodated at Bluff Berth 4, 9% (201) at
Bluff Berth 3, 8% (184) at Bluff berth 2 and 91 (4%) at Bluff berth 1 (See Figure 11). This indicates that
without too much additional capital investment in terms of deepening of berths and strengthening of
quay walls, smaller container vessels could be handled at the Bluff Berths with the use of either ships
gear or Bulk Connections’ two container cranes.
Figure 10: Number of Container Vessels able to berth at Bluff berths. Source: This Study
Bulk Connections is in the rather unfortunate position of not having similar draft along the entire quay
wall. Should a large vessel with a draft of 10 metres arrive off schedule, it will be unable to berth at
another berth on the quay wall which could cause increases in delays and congestion. Unfortunately
berth deepening at the Bluff berths does not appear to be in either the short or medium term horizon
for TNPA capital investment. Cost estimates for this kind of project is loosely in the region of R1 million
per metre of quay side which equates to approximately R743 million for the BC berths. This is a
significant investment and one that TNPA does not have in its medium to long term strategy.
The current cranes, although old and below spec compared to the modern cranes used at Pier 1 &Pier 2
are still able to handle the smaller cellular vessels that make up approximately 31% of container traffic in
the port.

38
These vessels currently call at the Multi-purpose terminals in Maydon Wharf and the Point (and from time
to time at the DCT) and volumes are handled by both TPT and some private operators. TPT have four
cranes at the Point terminal and two at Maydon Wharf. Private operators do not have the advantage of
having their own cranes at Maydon Wharf, as a result of which they make use of ships gear to load and
discharge vessels. Productivity at these terminals is consequently well below the levels achieved at the
Pier 1 and 2 container terminals.
5.4.2 Truck-Trailer Units (TTU’s)
A truck-trailer unit is a horizontal transport vehicle that relies on lifting equipment to place and
remove containers on its trailer. Bulk Connections has a fleet of 15 such truck-trailer units that are
used when loading products via the container cranes (See Figure 12). Pier 1 on the other hand has a
fleet of 45 such truck-trailer units (Pier 1 fact sheet).
Figure 11: Truck trailer units – Bulk Connections
5.4.3 Reach stackers
Reach-stackers are known in the industry to have great flexibility as well high operational productivity.
They are ideally suited for smaller terminals that do not have a high throughput of containers, and are
a good choice for countries with less-skilled labour (Brinkmann, 2011). The smaller private multi-
purpose terminals operating from Maydon Wharf use reach-stackers extensively.
How this would work is that the quay crane would offload the container on a TTU that would then
transport the container to the stack. The reach-stacker would then pick up the container off the TTU
and place onto the stack. Reach-stackers can also be used for stacking in the yard as well as loading
and unloading rail wagons and road trucks (See Figure 13)

39
Figure 12: Movement of containers from vessel to stack (Source: Brinkmann 2011)
The question then is, what is the optimum number of TTU’s and reach-stackers required for all the
landside operations? Having too many will cause congestion and having too few will cause the system
to become idle thus increasing inefficiencies (Brinkmann, 2011). According to Brinkmann, 3-4 reach-
stackers and 4-5 TTU’s are required per quay crane. The advantage of this system of stacking is that
it involves a low level of capital investment as well as low operating costs. On the other hand a
potential disadvantage is that it is quite labour intensive and there is a possibility of disturbance in the
stacking area due to trucks being loaded/unloaded (Ibid.).
Based on the type of equipment mentioned above, the storage capacity if one had to stack three-high
would be 350 TEU per hectare and if stacking four-high, the storage capacity would increase to 500
TEU per hectare (Brinkmann, 2011, 32). Brinkmann suggests limiting stacking to two-deep and three-
or four-high to avoid too much reshuffling. Private terminals operating containers on a small scale in
the Maydon Wharf area are using the block stacking method and are able to stack approximately 1000
TEU per hectare by stacking five-high. Operating costs may well be higher due to the rather dense
stacking method and increased number of moves per container. Pier 1 on the other hand has 4 992
ground slots and is able to store a maximum of 24 960 TEU’s at any point in time. It is able to do this
by stacking five-high and six-wide with a 10 metre gap between each stack.
Considering that space is a constraint at Bulk Connections, a stack height as great as feasible and as
small a space as possible between stacks would be desirable. The problem though is that the higher
one stacks, the better one utilizes storage space, however the individual units become less accessible.
This results in containers being handled too many times which increases operational costs.
5.4.4 Rubber tyred gantries (RTG’s) and Rail mounted gantries (RMG’s)
The Durban Container Terminal operates from Pier 1 and Pier 2 which run independently of each other
and have different operating methods. Pier 1 makes use of the block stacking method. This method
is typical of stacking areas that are compact or smaller. It consumes a smaller ground area and has
less spacing (See Figure 14). Pier 2 on the other hand uses the linear stacking method (See Figure 15).
In this layout, container rows are separated by spaces and very wide terminal roads (Brinkmann, 2011,
27). The different methods are influenced not only by space constraints but also by the type of
equipment that is used. Pier 1 uses Truck-trailer units (TTU’s), Rubber-tyred gantries (RTG’s) and Rail
mounted gantries (RMG’s) to stack containers whereas Pier 2 makes use of Straddle carriers and
RMG’s to stack containers (Pier 1 & 2 fact sheet). Both these methods involve high capital investment
and are typical of very large container terminals.
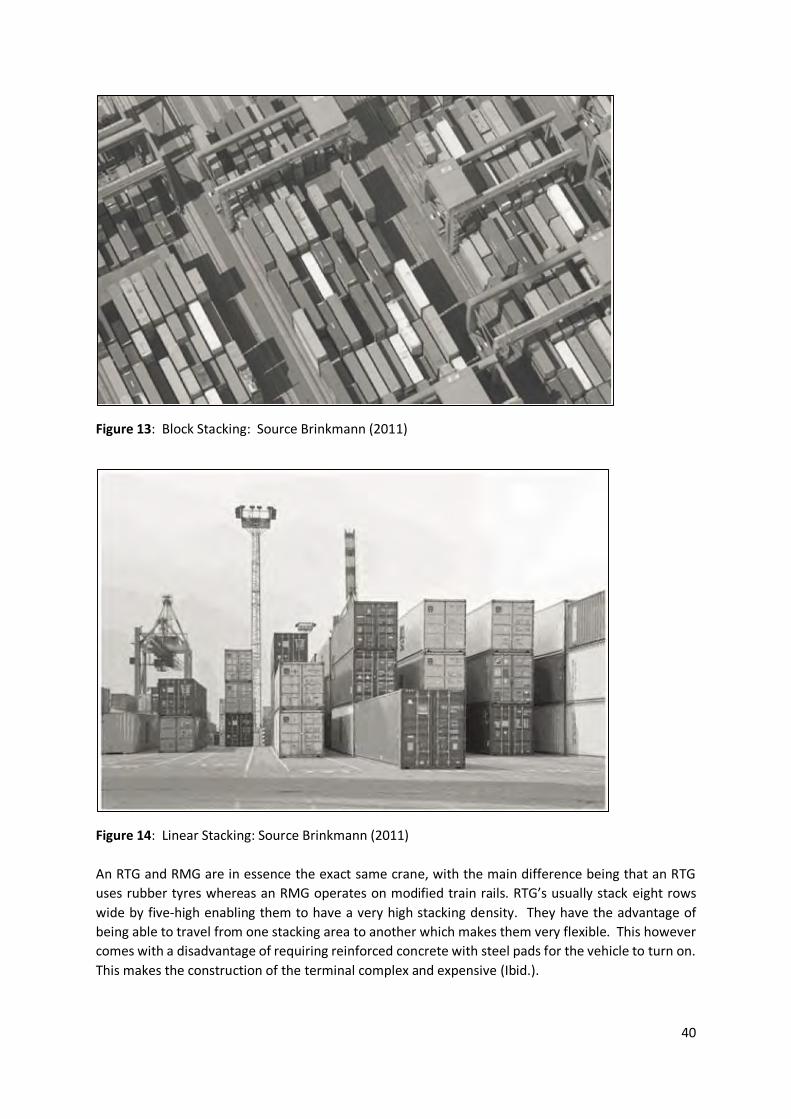
40
Figure 13: Block Stacking: Source Brinkmann (2011)
Figure 14: Linear Stacking: Source Brinkmann (2011)
An RTG and RMG are in essence the exact same crane, with the main difference being that an RTG
uses rubber tyres whereas an RMG operates on modified train rails. RTG’s usually stack eight rows
wide by five-high enabling them to have a very high stacking density. They have the advantage of
being able to travel from one stacking area to another which makes them very flexible. This however
comes with a disadvantage of requiring reinforced concrete with steel pads for the vehicle to turn on.
This makes the construction of the terminal complex and expensive (Ibid.).

41
RMG’s are the bigger version of the RTG’s. They have the ability to stack wider, higher and faster than
a RTG and therefore come with a more expensive price tag. They are however less mobile than a RTG
but more durable, reliable and have cheaper running and operating costs (Ibid.) The capital
investment into these machines have been taken into consideration in the long-term financial model
in the next section.
The decision by Bulk Connections to either run the entire terminal as a container facility or only a
portion, will have an impact on the kind of equipment that is required.
5.5 Software
Due to the volumes handled in the container industry, a powerful and modern software system is
required that is able to handle all the intricacies around tracking any single container at any point in
time. The Durban Container Terminal makes use of a software system called Navis Sparcs N4. This
system is in operation in more than 117 sites all over the world and is a sophisticated and modern
platform that enables the terminal to optimize efficiencies, improve the customer experience through
real-time access to terminal information and reduce paper-based processes (Navis website).
A system of this nature comes with a hefty price tag; however, should Bulk Connections wish to
proceed in the long term with using the entire facility for handling of containers, a software system
the likes of Navis is a necessity. The long-term financial model includes the capital investment into a
software system of this magnitude.
The small private operators that handle containers in the port make use of in-house developed
software as the capital investment into a system like Navis cannot be justified with the kind of volumes
being handled.
5.6 Secondary staging area
Should Bulk Connections wish to proceed in the long term with handling containers only, a secondary
staging/storage area may need to be considered, due to the limited space at Bulk Connections and
the constraints around handling road volumes. The ideal model would be that all containers coming
off vessels would be directly loaded onto trains that would then off load at the staging/storage area
or be taken directly into the hinterland. For containers off loaded at the staging area, road trucks
would then pick up directly from this point. This will not only move congestion away from the port,
but will also help Transnet in its drive to move cargo from road to rail.
The opposite would then work for containers being loaded onto vessels. The staging area would store
all containers and these would be railed into the site once the vessel is due for arrival. Three possible
staging areas have been considered that are on the rail line and that meet the requirements in terms
of space, and access to the national roads. Aside from identifying these possible staging areas due to
their close proximity to the rail line, it is not the intention of this study to delve into the detail of
whether these sites are available or not in terms of rental/purchase or the capital investment required
in converting them to a secondary staging area . The three staging areas identified are:
Umbogintwini rail siding
Fynnlands rail siding
Racecourse rail siding
5.6.1 Umbogintwini rail siding
The Umbogintwini rail siding is 24 kilometres south of the port of Durban. The land area is almost
rectangular in shape and covers an area of 2.67 hectares. It is 92 metres wide by 320 long (See Figure

42
16). Based on the same stacking ratio of Pier 1 this would enable roughly 3 382 TEU’s to be stored on
site.
Figure 15: Umbogintwini Rail siding
5.6.2 Bayhead Rail siding
The Bayhead rail siding is a long thin siding and in terms of hectares is very similar to Umbogintwini.
It is 2.5 hectares long and the advantage is that it runs parallel to the rail lines in Bayhead. Road trucks
that currently collect or deliver TEU’s do not need to deviate too much from where they currently
deliver to, namely the Durban Container terminal. The disadvantage is that it is a long thin site and
there could be problems due to congestion. The site is 860 metres long and 26 metres deep (See
Figure 17).
Figure 16: Bayhead rail siding

43
5.6.3 Racecourse rail siding
The third staging area identified is a piece of land adjacent to the old Clairwood Racecourse, that is
approximately 15 kilometres from the Port of Durban. The land area is 2.68 hectares and also adjacent
to a rail siding. It is not a typical box shape but rather a long this area. It is 810 metres long and 58
metres deep at its widest section and 15 metres deep at its narrowest section (See Figure 18).
Figure 17: Racecourse rail siding
Of the three identified staging areas, Umbogintwini is probably the most favourable due to its box like
shape and its proximity to the freeway.
Based on the analysis above, Bulk Connections, given its physical configuration, will never compete
with Pier 1 & Pier 2 in terms of the type and size of vessels handled due to BC’s berths not been deep
enough or long enough and due to the shape of the land not being the ideal “box-shape”. They do,
however, have an advantage over Maydon Wharf that is currently handling containers and has no rail
siding.
BC has two small container cranes on four dedicated berths and is able to handle at least two trains a
day on their rail siding. In addition as the maximum draft depths at Maydon Wharf matches those of
BC, this implies that all container vessels currently loading and discharging at Maydon Wharf could be
handled at BC.
5.7 Financial Feasibility
The objective of managing any successful terminal, including a container terminal, is to decrease the
cost of operations whilst at the same time maintaining or improving service quality. The three main
resources in a container terminal are the yard (where all the containers are stacked), the equipment
and the people. The more efficiently these three resources can be managed, the greater the
sustainability of the terminal operations, and the better the services provided to cargo owners and
the carrying lines.
Bulk Connections is already at an advantage as most of the site is concreted and they are in possession
of two yard cranes that can handle small container vessels. They are also in possession of a fleet of
15 truck-trailer units that can carry containers. Both a short-term and long-term financial model have
been considered to determine the feasibility of the company entering into the container market. The

44
short-term model deems the terminal to be a multi-purpose terminal handling both bulk and
containers whilst the long-term model assumes that the entire facility will be dedicated to handling
containers only.
5.7.1 Short Term – Multi-purpose facility
Should Bulk Connections wish to proceed with handling bulk minerals as well as containers, space will
be constrained, thus limiting volumes handled. The area earmarked for container operations, in the
short term, at the Bulk Connections facility was measured as 2000 square metres (2 hectares) – see
Figure 19. Based on Brinkmann’s calculation this would enable between 700-1000 TEU’s to be stored
on site. If one had to stack five-high and four-deep, as the private terminals are doing at Maydon
Wharf, this would enable 2 000 TEU’s to be stored in a 2 hectare area. Applying the Pier 1 ratio of
land size to container capacity, the maximum TEU’s that could be stored approximates to 2534 TEU
for the two hectares.
Figure 18: Allocated short/medium and long term container stacking area at BC
Short Term option for container handling – 2 hectares
Medium Term option for additional container handling
Long term option with entire site used for container handing
The best option according to Brinkmann (2011) in terms of equipment requirements for multi-purpose
terminals is TTU’s and reach-stackers. Based on Brinkmann’s study, three or four reach stackers and
four or five truck-trailer units will be required for each quay crane. Bulk Connections’ fleet of 15 truck-
trailer units will be more than sufficient to meet this requirement. For the proposed short-term
financial model an investment into six reach-stackers was taken into consideration.
The financial model is based on meeting the minimum requirements of a 40% return on funds
employed which is the rate required by the holding company. TPT’s tariff book was used as a guide
to determine container-handling charges. These charges per the tariff book are marginally lower at
the Multi-purpose terminals compared to Pier 1 & Pier 2. As the short-term case study assumes that
the company will be utilizing the terminal for bulk as well as containers, it was thought more prudent
to use the lower rates charged by TPT at the multi-purpose terminals. These rates however were
further discounted by 15% due to contingencies and unknown costs in the industry. As a starting point
a revenue rate of R1000 per TEU was used.

45
5.7.1.1 Overview of the short-term conversion to containers
The main components of the short-term conversion include:
The purchase of six new reach-stackers and
The installation of a software system to manage containers
This is a fairly quick conversion as lead times to have this up and running will probably be around 2-3
months, as key equipment items would be imported directly from overseas.
As a result of Bulk Connections sister companies handling small volumes of containers at Maydon
Wharf, synergies could be experienced by sharing software systems that have already been
developed.
5.7.1.2 Benefits of the Proposed Conversion
The anticipated benefits of the conversion to containers in the short term include:
Better utilization of 2 000 square metres of land along the quay side;
30% additional operating profit in year one compared to handling dry bulk;
A stable, longer-term revenue source considering projected volume increases and capacity
constraints at current container terminals
In assessing the viability of the expansion the following assumptions have been made:
The annual throughput in year one is anticipated to be 46 800 TEU which is the equivalent of
3 900 TEU per month (or 900 TEU per week), escalating at 3% per annum.
Handling rates of R1000 per TEU escalating by 6% per annum.
The opportunity cost of bulk volumes lost as a result of the conversion has not been taken
into consideration
5.7.1.3 Capital Expenditure
The total capital expenditure requirement for the conversion has been estimated at R45 million, made
up as follows:
6 x Reach-stackers R36.0m
Software system R 1.0m
Concreting portion of site R 5.0m
Contingencies R 3.0m
The cost estimates presented in this section have been derived from experience in the maritime
industry and on current market-related rates and prices obtained from specialize suppliers and
contractors.
5.7.1.4 Expenses
The additional costs taken into consideration in this model were staff costs, maintenance costs, diesel
costs and stevedoring charges.
18 additional staff were included in the model, to operate the six reach stackers, and based
on a standard three-shift system.
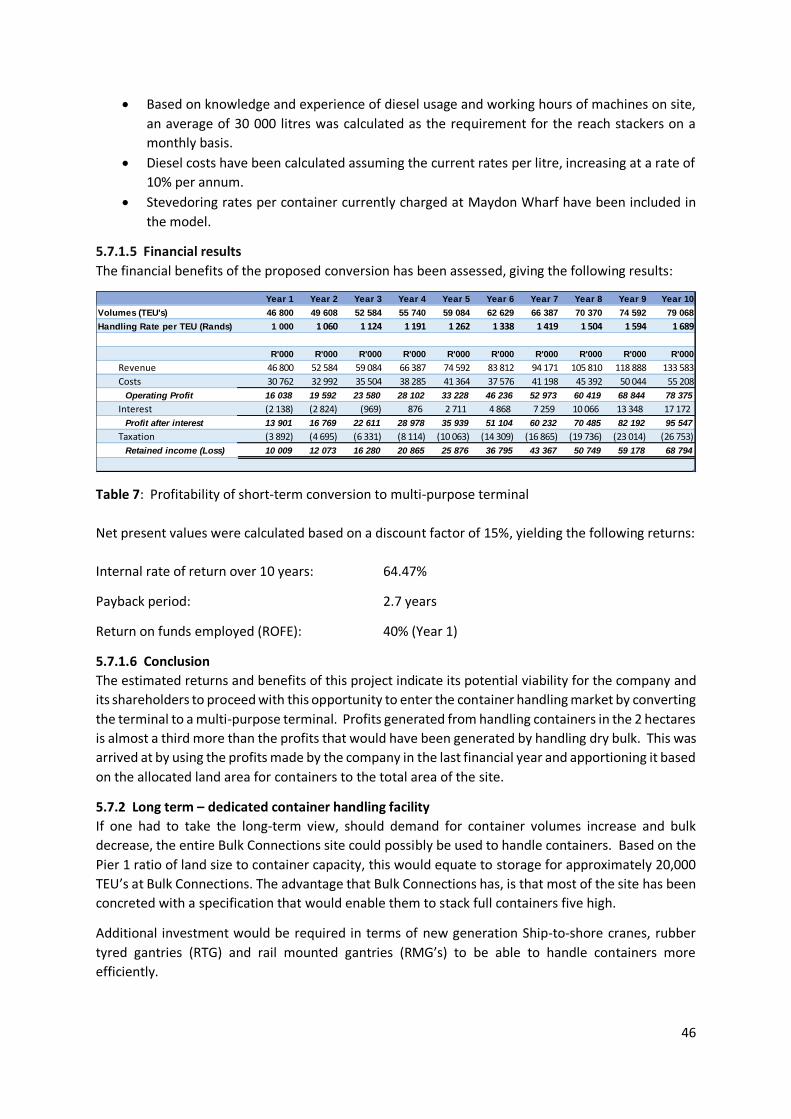
46
Based on knowledge and experience of diesel usage and working hours of machines on site,
an average of 30 000 litres was calculated as the requirement for the reach stackers on a
monthly basis.
Diesel costs have been calculated assuming the current rates per litre, increasing at a rate of
10% per annum.
Stevedoring rates per container currently charged at Maydon Wharf have been included in
the model.
5.7.1.5 Financial results
The financial benefits of the proposed conversion has been assessed, giving the following results:
Table 7: Profitability of short-term conversion to multi-purpose terminal
Net present values were calculated based on a discount factor of 15%, yielding the following returns:
Internal rate of return over 10 years: 64.47%
Payback period: 2.7 years
Return on funds employed (ROFE): 40% (Year 1)
5.7.1.6 Conclusion
The estimated returns and benefits of this project indicate its potential viability for the company and
its shareholders to proceed with this opportunity to enter the container handling market by converting
the terminal to a multi-purpose terminal. Profits generated from handling containers in the 2 hectares
is almost a third more than the profits that would have been generated by handling dry bulk. This was
arrived at by using the profits made by the company in the last financial year and apportioning it based
on the allocated land area for containers to the total area of the site.
5.7.2 Long term – dedicated container handling facility
If one had to take the long-term view, should demand for container volumes increase and bulk
decrease, the entire Bulk Connections site could possibly be used to handle containers. Based on the
Pier 1 ratio of land size to container capacity, this would equate to storage for approximately 20,000
TEU’s at Bulk Connections. The advantage that Bulk Connections has, is that most of the site has been
concreted with a specification that would enable them to stack full containers five high.
Additional investment would be required in terms of new generation Ship-to-shore cranes, rubber
tyred gantries (RTG) and rail mounted gantries (RMG’s) to be able to handle containers more
efficiently.
Year 1 Year 2 Year 3 Year 4 Year 5 Year 6 Year 7 Year 8 Year 9 Year 10
Volumes (TEU's) 46 800 49 608 52 584 55 740 59 084 62 629 66 387 70 370 74 592 79 068
Handling Rate per TEU (Rands) 1 000 1 060 1 124 1 191 1 262 1 338 1 419 1 504 1 594 1 689
R'000 R'000 R'000 R'000 R'000 R'000 R'000 R'000 R'000 R'000
Revenue 46 800 52 584 59 084 66 387 74 592 83 812 94 171 105 810 118 888 133 583
Costs 30 762 32 992 35 504 38 285 41 364 37 576 41 198 45 392 50 044 55 208
Operating Profit 16 038 19 592 23 580 28 102 33 228 46 236 52 973 60 419 68 844 78 375
Interest (2 138) (2 824) (969) 876 2 711 4 868 7 259 10 066 13 348 17 172
Profit after interest 13 901 16 769 22 611 28 978 35 939 51 104 60 232 70 485 82 192 95 547
Taxation (3 892) (4 695) (6 331) (8 114) (10 063) (14 309) (16 865) (19 736) (23 014) (26 753)
Retained income (Loss) 10 009 12 073 16 280 20 865 25 876 36 795 43 367 50 749 59 178 68 794

47
The overriding limitation, however, is that the Bulk Connections’ berth depths do not support the type
and size of containerized vessels that are currently visiting the Durban Container Terminal. The model
assumes that berth depths will be deepened by TNPA to match those of the Durban Container
Terminal.
5.7.2.1 Overview of the long-term conversion from bulk to containers
The main components of the long term conversion include:
The purchase of five ship-to shore cranes
Two Rail mounted gantries
22 Rubber tyred gantries
45 Truck trailer units
2 reach stackers
The installation of NavisN4 software system
Pier 1 makes use of six ship-to-shore cranes (Pier 1 fact sheet). Per the Port Regulator container
benchmarking study, it shows that Durban has more cranes per running metre of quay when
compared to the sample average. Based on the average of one crane per 144 metres of berth, BC
would require five ship to shore cranes.
Pier 1 makes use of 22 rubber tyred gantries, and a fleet of 45 truck trailer units (Pier 1 fact sheet).
This is assumed to be the same number required by BC.
This could take between 18-24 months due to the customization of software and lead times in
ordering and delivering of equipment from overseas.
5.7.2.2 Model Assumptions
A lease term of 25 years will be secured with TNPA;
Existing assets that are being written off have not been included in the model as this will
detract from the aim of showing financial feasibility of running a container terminal;
TNPA invest in deepening all four of Bulk Connections berths to match those of the Durban
container terminal;
No additional cost for stevedoring as the company will perform their own stevedoring
function;
The financial model assumes a flat fee of R1200 per 20 foot container in year one increasing
by six percent per annum. Additional storage fees and depot handling charges which are billed
by TPT and the smaller private operators have not been included in the model and
The annual throughput will start as 360 000 TEU (30 000 TEU per month) in year one ramping
up by 10 percent per annum, and reaching capacity of 637 000 TEU in year seven. Based on
BC’s terminal size compared to Pier 1, this appears realistic provided that demand is present.
5.7.2.4 Capital Expenditure
The total capital expenditure requirement for the conversion of Bulk Connections to a container
handling facility has been estimated at R1 091m, made up as follows:
5 x Ship to shore cranes R 750.0m
22 x Rubber tyred gantries R 99.0m
2 x Rail mounted gantry R 16.0m
2 x Reach stackers R 12.0m

48
45 x Truck-trailer units R 90.0m
Navis software R 90.0m
Contingencies R 34.0m
5.7.2.5 Expenses
Major additional costs that have been included in the model:
100 more staff that include administration staff and crane drivers ;
additional maintenance costs due to added fleet of plant and equipment
5.7.2.6 Financial results
The financial benefits of the proposed conversion has been assessed, giving the following results:
Table 8: Profitability of conversion to a full container terminal
Net present values were calculated based on a discount factor of 15%, yielding the following returns:
Internal rate of return over 20 years: 18.87%
Payback period: 6.6 years
Rate of return: 40% (Year 4)
5.7.2.7 Conclusion
Converting the entire BC terminal to handling containers would entail an investment of approximately
R1 billion. The company would probably only consider an investment of this magnitude if the berths
along its quay walls could be deepened. Without this commitment from the Port Authority (Transnet),
such a substantial investment would be unfeasible. Based on the payback period and internal rate of
return on this investment, the shareholders may take the project under consideration.
5.7.3 Summary of the opportunity
Bulk Connections may be one of the most suitable private container terminals, however it is not going
to be part of the major league and be able to handle major volumes. Rather its position in the
container market will be one of reserve player which helps out and supports the main terminal and
shipping lines in times of need. This mixed approach of handling both containers and bulk will enable
Bulk Connections to fill gaps in the market at short notice with relatively low risk and entry costs.
The broad scope of the container handling operation at Bulk Connections would be as follows:
Berth 4 (225 metres long and 10 metres deep) would be committed to container vessels;
Year 1 Year 2 Year 3 Year 4 Year 5 Year 6 Year 7 Year 8 Year 9 Year 10
Volumes (TEU) 360 000 396 000 435 600 479 160 527 076 579 784 637 762 637 762 637 762 637 762
Handling Rate per TEU (import/export (full) 1 229 1 315 1 407 1 506 1 611 1 724 1 844 1 974 2 112 2 259
Handling Rate per TEU (import/export (empties) 1 097 1 174 1 256 1 344 1 438 1 539 1 646 1 762 1 885 2 017
R'000 R'000 R'000 R'000 R'000 R'000 R'000 R'000 R'000 R'000
Revenue 417 360 491 233 578 181 680 519 800 971 942 743 1 109 608 1 187 281 1 270 390 1 359 318
Costs 349 230 368 218 388 956 411 639 436 486 445 748 475 710 503 230 532 767 564 468
Operating Profit 68 130 123 015 189 224 268 880 364 485 496 995 633 898 684 050 737 623 794 850
Interest (49 095) (89 301) (77 174) (60 061) (36 786) (5 934) 18 741 46 498 77 411 111 344
Profit after interest 19 035 33 713 112 051 208 819 327 699 491 061 652 640 730 549 815 034 906 193
Taxation (5 330) (9 440) (31 374) (58 469) (91 756) (137 497) (182 739) (204 554) (228 210) (253 734)
Retained income (Loss) 13 705 24 273 80 677 150 349 235 943 353 564 469 900 525 995 586 825 652 459

49
The two small container cranes would be dedicated to container handling operating at a
combined handling rate of 30 crane moves per hour;
Approximately two hectares would be dedicated to store containers which is the equivalent
of 30 000 TEU per annum;
Two trains per day of 100 TEU per train would be able to be handled comfortably. This
translates to a possible 60 000 TEU per annum, but is dependent on TFR operations and their
capacity;
One hundred road trucks per day is deemed possible (the other 150 would be reserved for
bulk);
Current terminal software is licensed to handle up to 50 000 TEU per annum;
Based on a berth occupancy of only 32% and three (small) vessel calls per week, the annual
opportunity is calculated to be 45 000 TEU per annum which is lower than the Terminal’s
physical capacity.
Therefore the targeted capacity of the container handling opportunity is only 45 000 TEU per annum
which represents only a fraction of the terminal’s physical capacity.

50
CHAPTER SIX
CONCLUSION
The handling of containers in the South African ports is predominantly performed by Transnet-run
terminals. Private sector competition is negligible as Transnet are the only beneficiaries of container
operating licenses within the Ports. Container handling (together with the automotive industry)
consequently remain the two key port operations from which the private sector has been excluded.
It has been demonstrated in many similar ports around the world that introducing a private operator
(big or small) has made a positive influence in opening up new port business opportunities, driving up
efficiencies and improving the turnaround of both vessels and their cargoes.
Transnet’s Durban container terminals are already operating close to notional capacity, so allowing a
small private operator into this market will take some of the pressure off their terminals, allowing
them to focus on the larger more efficient vessels, thereby extending their effective handling capacity.
Smaller private terminals (like Bulk Connections) could pick up some of the smaller, more complex
container shipments, generally also transported in somewhat smaller and slower-working vessels, to
introduce a new dimension of competition whilst reducing vessel waiting time. A further advantage
of introducing a new terminal into the container market is that new road and rail routes could be used,
thereby relieving pressures on the existing entry points.
Although the current berth depths do support approximately 30% of containerized vessels visiting the
port, the Bulk Connections’ berths would have to be deepened in order to compete with the type and
size of vessels that are berthing at the Durban Container Terminal.
The study reflects that it may well be financially feasible for an existing private terminal such as Bulk
Connections to be converted to a multi-purpose terminal handling both bulk and containers. However,
the level of public and private capital investment required, together with the complication of the
shape of the land, makes it an unviable solution to handling containers only.
Clearly there is an opportunity for the private sector to get involved in the container handling industry
which would be mutually beneficial for Transnet and private operators, and above all for the family of
port users.

51
REFERENCES
Boyd, T. (2015, January 12). APM Terminals. Retrieved from APM Terminals equipment investments
continue at Algeciras and Apapa: http://www.apmterminals.com/news/press-
releases/2014/12/apmt-equipment-investments-continue-at-algeciras-and-apapa
Brazilian terminals' chief favours port privatisation. (2014, April 18). Retrieved from Maritime Trade
Intelligence: http://maritimeintel.com/brazilian-terminals-chief-favours-port-privatisation
Brinkmann, B. (2011). Operations Systems of Container Terminals: A Compendious Overview.
Chapter 2, . 25-39.
Burke, N. (2007). IFC's experience in the Transport Sector. Retrieved from www.ifc.org:
http://www.ifc.org/wps/wcm/connect
Comins, L. (2015, December 1). Durban dig out port plan on hold. Retrieved from www.iol.co.za:
http://www.iol.co.za/news/politics/durban-dig-out-port-plan-on-hold-1.1953476
De Monie, G. (1987). Measuring and Evaluation Port Performance and Productivity. UNCTAD
Monograph on Port Management, No6.
De Monie, G. (1996). Privatisation of port structures. Ports for Europe: Europ's Maritime Future in a
changing environment. European Interuniversity Press, Brussels.
DMT Geosciences. (2015). DMT Geosciences. Retrieved from DMT Geosciences:
http://dmtgeosciences.ca/geosciences/geology/technical-reports
DP World. (2014). Retrieved from www.dpworld.com:
http://web.dpworld.com/wpcontent/uploads/2014/05/22294
Drewry. (2010, November 23). Container Terminal capacity and Performance Benchmarks. United
Kingdom: Drewry Publishing.
Drewry Maritime Research. (2015). Container Insight. Retrieved from www.drewry.co.uk:
http://ciw.drewry.co.uk/release-week/2015-12
Engineering News: Transnet awards R760m Maydon Wharf reconstruction contract. (2014, April 4).
Retrieved from http://www.engineeringnews.co.za
Fin24. (2015, August 14). Fin24 - Transnet license for Manganese Terminal. Retrieved from
www.fin24.com: http://www.fin24.com/Economy/Cabinet-grants-Transnet-license-for-
manganese-terminal
FRIDGE. (2007). Fund for Research into Industrial Development Growth and Equity (FRIDGE).
Administered prices study on Economic inputs Ports Sector. Trade & Industry Chamber.
Goss. (1990). Economic Policies and Seaports. Maritime Policy and Management, Volume 17, No.3,
207-219.
Greve, N. (2013, May 13). Engineering News. Retrieved from www.engineeringnews.co.za:
http://www.engineeringnews.co.za/article/transnet-unveils-7-cranes-in-durban-as-port-
development-project-advances
Haarmeyer, D., & Yorke, P. (1993). Port Privatisation: An international perspective.

52
Hume, N. (2015, October 7). Austrailia Thermal Coal price at 8-year-low. Retrieved from
www.ft.com: http://www.ft.com/intl/cms/s/0/339d3796-6cf9-11e5-aca9-
d87542bf8673.html
Hutson, T. (2014, December 4). Ethekwini Maritime Cluster: All change at Durban's Maydon Wharf.
Retrieved from www.maritimecluster.co.za: http://www.maritimecluster.co.za/index.php
JOC Group. (2014). Berth productivity. The trends, outlook and market forces impacting ship
turnaround times. Retrieved from www.joc.com:
www.joc.com/sites/.../Port_productivity/portProductivity_whitepaper.pdf
Kaselimi, & Notteboom. (2015, September 11). Port Technology. Retrieved from
www.porttechnology.org:
Notteboomhttp://www.porttechnology.org/technical_papers/the_value_of_opening_termi
nals_to_private_operators
Lee, P., & Flynn, M. (2011). Charting a New Paradigm of Container Hub Port Development Policy: The
Asian Doctrine. Transport Reviews, Vol 31, No 7, 791-806.
Magwaza, N. (2014, September 4). No Need for SA to privatise ports - Transnet. Retrieved from
www.iol.co.za: http://www.iol.co.za/business/news/no-need-for-sa-to-privatise-ports-
transnet
Mahlaka, R. (2015, March 10). Transnet invests in Ngqura Capacity expansion. Retrieved from
www.moneyweb.co.za: http://www.moneyweb.co.za/news/economy/transnet-invests-in-
ngqura-capacity-expansion/
Manda, S. (2015, February 2015). Durban dig-out Port: "Think Again". Retrieved from www.iol.co.za:
http://www.iol.co.za/business/news/durban-dig-out-port-think-again-1.1821443
Mcpherson, B. (2004). Port Pricing. Unpublished honours dissertation, University of natal.
Mehta, P. (2007). A functional competition policy for India. Retrieved from www.pradeepmehta.com:
www.pradeepmehta.com/.../competition_and_regulation_in_india_2007...
Mine 2015 - The gloves are off. (2015). Retrieved from PWC.co.za:
https://www.pwc.co.za/en/assets/pdf/mine-2015.pdf
Mohiuddin, & Jones. (2008). Nigerial Port Reform and concession.
Moorcroft, M. (2015, March 5). New move in Richards Bay Container terminal spat. Retrieved from
www.zululandobserver.co.za: http://zululandobserver.co.za/61288/new-move-in-bay-
container-terminal-spat/
(2005). National Ports Act No 12.
Notteboom, T. (2011). An application of multi-criteria analysis to the location of a container hub port
in South Africa. Maritime Policy & Management, 38, 51-79.
Port of Maputo. (2015). Retrieved from www.portmaputo.com: http://www.portmaputo.com/port-
maputo-presentations/
Port of Maputo sets new record in cargo handling. (2015). Retrieved from www.portmaputo.com:
http://www.portmaputo.com/the-port-of-maputo-sets-new-record-in-cargo-handling-2
53
Port Reform tool kit: Alternative port management structures & ownership models. (2015). Retrieved
from www.ppiaf.org: http://www.ppiaf.org/sites/ppiaf.org/files/documents/toolkits
Ports Regulator of South Africa. (2015). Benchmarking South African Ports: container and automotive
terminals 2014/15.
Ports Regulator of South Africa. (2015). SA port Terminals: capacity and utilisation review 2014/15.
Ports.co.za. (2015). Retrieved from www.ports.co.za: http://ports.co.za/maputo.php
Ray, A. (2004). Managing Port Reforms in India: Case study of Jawaharlal Nehru Port Trust (JNPT)
Mumbai.
Schroder, L. (2013). Port of Durban Container Terminal. University of Pretoria.
Serrano, M., & Trujillo, L. (2005). Reforms and Infrastructure: Efficiency in Spain's Container ports.
Washington: The World Bank.
Suykens. (1986). Ports should be efficient. Maritime Policy and Management, Volume 17, No. 3, 105-
126.
The Economist: The road to hell. (2013, September 28). Retrieved from The Economist:
http://www.economist.com/news/special-report/21586680
Tongzon, J., & Heng, W. (2005). Port privatisation, efficiency and competitiveness: Some empirical
evidence from container ports (terminals). Department of Economics, National University of
Singapore, 405-424.
Transnet. (2011). Retrieved from www.transnet.net:
www.transnet.net/InvestorRelations/Pages/AnnualResults-2011.aspx
Transnet. (2013). Retrieved from www.transnet.net:
www.transnet.net/InvestorRelations/Pages/AR2013.aspx
Transnet. (2015, October 23). Retrieved from Transnet: www.transnet.net/AboutUs/Overview.aspx
Transnet. (2015). Retrieved from www.transnet.net:
www.transnet.net/InvestorRelations/Pages/Annual-Results-2015.aspx
Transnet Freight Rail. (2015). Retrieved from www.transnetfreightrail.net:
www.transnetfreightrail.net/MDS/pages/Overview
Transnet National Ports Authority Port Development Framework Plan. (2014). Retrieved from
Transnet National Ports Authority:
http://www.transnetnationalportsauthority.net/Infrastructure%20and%20Port%20Planning
/Documents
Transnet Operator Licenses Issued: Port of Durban. (n.d.). Retrieved from
www.transnetnationalportsauthority.net:
www.transnetnationalportsauthority.net/../Terminal%20Operator%20Lic
Transnet Port Terminals. (2015). Retrieved from www.transnetportterminals.net.
Transnet: Minister Brown marks massive Transnet investment in Ngqura. (2015, March 9). Retrieved
from www.transnet.net: www.transnet.net/.../MINISTER%20BROWN%20MARKS%20MASSIV

54
Venter, I. (2015, February 25). Grindrod to invest in Maputo Port, R Bay Coal & Africa Rail projects.
Retrieved from www.engineeringnews.co.za:
http://www.engineeringnews.co.za/article/grindrod-to-invest-in-maputo-port-rbay-coal-
and-africa-rail-projects
Walters, B. &. (1978). Port Pricing and Investment Policy for developing countries.
World Port Source. (2015). Retrieved from www.worldportsource.com:
http://www.worldportsource.com/ports/commerc/MOZ_Port_of_Maputo_656.php
Wyngaardt, M. (2012, November 21). Engineering News. Retrieved from
www.engineeringnews.co.za: http://www.engineeringnews.co.za/article/tpt-takes-delivery-
of-new-tandem-lift-ship-to-shore-cranes