opportunities to enhance capital productivityfile/ey-opportunities-to-enhance-ca… · ·...
TRANSCRIPT

Opportunities to enhance capital productivityMining and metals megaprojects
How EY can help
Why spending millions in up-front planning, engineering and design is not driving improved predictability and controlCost and schedule control: a key risk and major opportunity
Capital megaprojects: declining but still massive
Drilling down to the core issues and causes
Achieving capital productivity
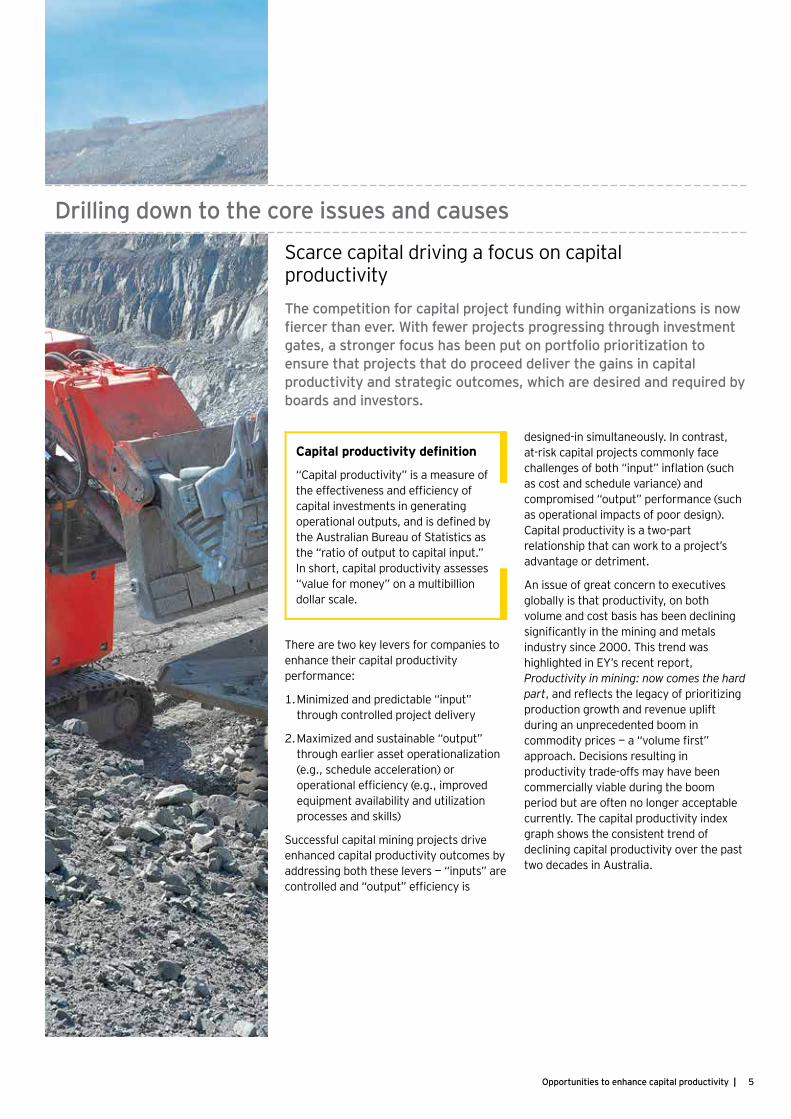
Scarce capital driving a focus on capital productivity
The devastating impact on capital productivity
The impact of overruns
Addressing the risks
Driving improved predictability and control
Implementing effective governance and reporting frameworks
Allocating adequate cost and time contingency
Enhancing the value of contingency planning
Conclusion
03
14
15
05
09
Contents

Opportunities to enhance capital productivity | 3
Cost and schedule control: a key risk and major opportunity
With projects of this scale, every overrun impacts total shareholder return, ROCE, capital productivity, corporate performance and strategic outcomes. In turn, overrun risks are driving an unprecedented level of scrutiny on the project, program and portfolio disciplines of cost and schedule control.
Based on our study results, EY has developed a root cause model to analyze the drivers of overruns and capital
c c fiare predictable; others are surprising. Overruns occur despite large investments by mining and metals companies to enhance up-front engineering practices and increase delivery maturity. We believe that there are overlooked opportunities to
fic c c
fi c cfor preventing cost and schedule overruns
The productivity of invested capital is a key issue for CEOs across the minin sect r T is cus reflects t e si ni c nce nd t e
c en e c ie in predict e return n in estment utc meswhen delivering complex multibillion dollar asset developments. New data captured through a recent global study by EY has revealed that overruns to the sanctioned budget and schedule commitments are the n rm it ur me pr ect s mp e r up s in n er ebudget overrun of a staggering 62%.
Why spending millions in up-front p nnin engineering and design is not driving improved predictability and control
that are often de-prioritized and underinvested:
• Flagging of emerging risks: implementing governance, and reporting frameworks with lead
c flc fic
mitigated• Adequate cost and time contingency:
allocating cost and time contingency across the projects’ life cycle to avoid risk-driven budget and schedule variances
• Scenario planning: enhancing the value of contingency planning through enhanced delivery scenario planning
Complemented by a broad uplift in delivery-discipline maturity, these enablers
ficcapital productivity realization. In this paper, we will:
• fiour study
• Propose a root cause model • Examine key considerations in applying
these critical enabling techniques
averagebudget overrunon megaprojects
62%

| Opportunities to enhance capital productivity4
Falling commodity prices and a rising supply surplus are ushering in a period of restraint in capital project investment across the
c fi chave been scrapped, shelved or sent back for re-planning, with a recent study identifying aggregate cuts in capital expenditure of more than US$27b since January 2012. Following a robust peak in growth of 27% in 2012, mining and metals capital spending declined by 10% in 2013 and is expected to have dipped by a further 15% over 2014.1
Despite the reduction in capital spending, projects continue to be developed because of the long lead times of approvals and construction and the need to prepare the next wave of supply to be available as the cyclical upswing inevitably occurs. For organizations in the mining and metals sector, the funding, planning and delivery of capital projects is core business and a key element of effective business strategy that must continue throughout the economic cycle.
Source: EY analysis; Engineering and Mining Journal’s annual survey of mining investment; “Riding the rising tide of global growth,” Deutsche Bank, 19 February 2014, via Thomson One.
Global mining and metals capex (US$b)
1. “Riding The Rising Tide of Global Growth,” Deutsche Bank research, 19 February 2014, via Thomson One.
142
2012
127
2013
108
2014f
96
2015f
Capital megaprojects: declining but still massive
Opportunities to enhance capital productivity | 5
There are two key levers for companies to enhance their capital productivity performance:
1. Minimized and predictable “input” through controlled project delivery
2. Maximized and sustainable “output” through earlier asset operationalization (e.g., schedule acceleration) or
fic cequipment availability and utilization processes and skills)
Successful capital mining projects drive enhanced capital productivity outcomes by addressing both these levers — “inputs” are c fic c
The competition for capital project funding within organizations is now ercer t n e er it e er pr ects pr ressin t r u in estmenttes str n er cus s een put n p rt i pri riti ti n t
ensure that projects that do proceed deliver the gains in capital pr ducti it nd str te ic utc mes ic re desired nd re uiredboards and investors.
designed-in simultaneously. In contrast, at-risk capital projects commonly face c fl cas cost and schedule variance) and compromised “output” performance (such as operational impacts of poor design). Capital productivity is a two-part relationship that can work to a project’s advantage or detriment.
An issue of great concern to executives globally is that productivity, on both volume and cost basis has been declining
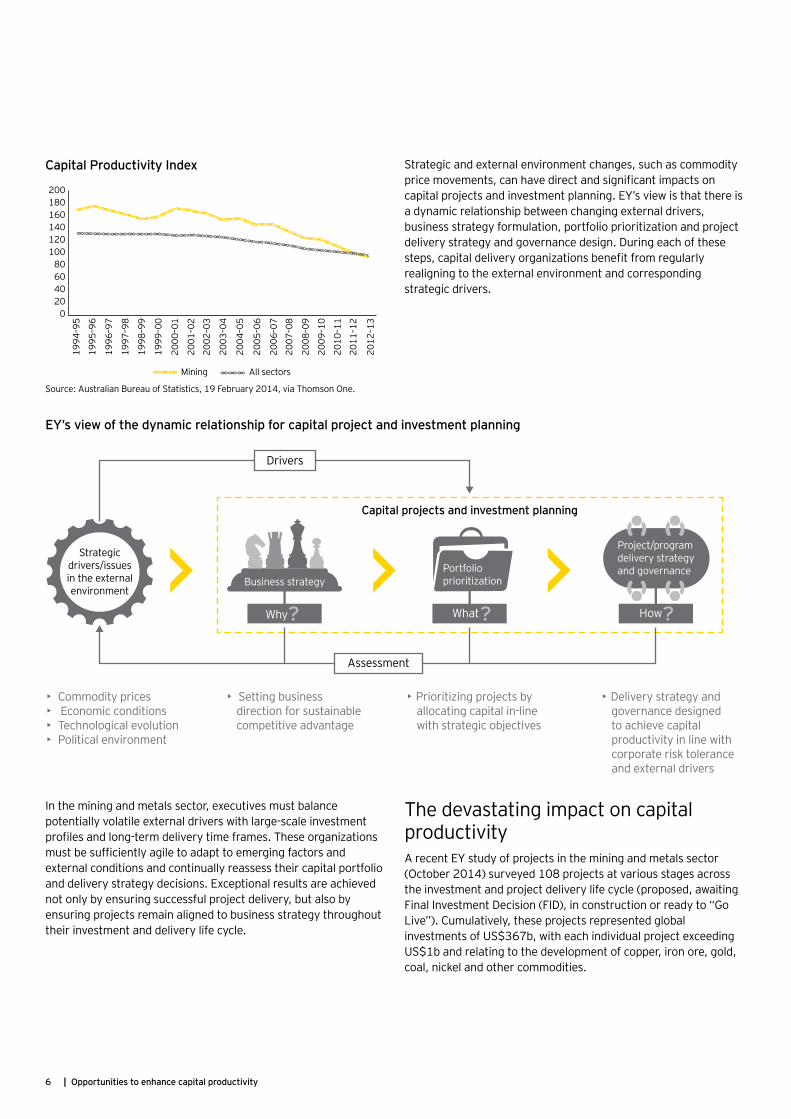
ficindustry since 2000. This trend was highlighted in EY’s recent report, Productivity in mining: now comes the hard part fl c cproduction growth and revenue uplift during an unprecedented boom in c c fiapproach. Decisions resulting in productivity trade-offs may have been commercially viable during the boom period but are often no longer acceptable currently. The capital productivity index graph shows the consistent trend of declining capital productivity over the past two decades in Australia.
Capital productivity definition
“Capital productivity” is a measure of c fic c
capital investments in generating fi
the Australian Bureau of Statistics as the “ratio of output to capital input.” In short, capital productivity assesses “value for money” on a multibillion dollar scale.
Scarce capital driving a focus on capital productivity
Drilling down to the core issues and causes
| Opportunities to enhance capital productivity6
Strategic and external environment changes, such as commodity c c c fic c
capital projects and investment planning. EY’s view is that there is a dynamic relationship between changing external drivers, business strategy formulation, portfolio prioritization and project delivery strategy and governance design. During each of these
c firealigning to the external environment and corresponding strategic drivers.
In the mining and metals sector, executives must balance potentially volatile external drivers with large-scale investment
fific c
external conditions and continually reassess their capital portfolio and delivery strategy decisions. Exceptional results are achieved not only by ensuring successful project delivery, but also by ensuring projects remain aligned to business strategy throughout their investment and delivery life cycle.
Capital Productivity Index
Source: Australian Bureau of Statistics, 19 February 2014, via Thomson One.
EY’s view of the dynamic relationship for capital project and investment planning
200180160140120100
80604020
0
1994
–95
1995
–96
1996
–97
1997
–98
1998
–99
1999
–00
2000
–01
2001
–02
2002
–03
2003
–04
2004
–05
2005
–06
2006
–07
2007
–08
2008
–09
2009
–10
2010
–11
2011
–12
2012
–13
Mining All sectors
Strategicdrivers/issuesin the externalenvironment
Business strategy
Capital projects and investment planning
Portfolioprioritization
Project/programdelivery strategyand governance
Why What How
Drivers
Assessment
• Commodity prices• Economic conditions• Technological evolution• Political environment
• Setting business direction for sustainable competitive advantage
• Prioritizing projects by allocating capital in-line with strategic objectives
• Delivery strategy and governance designed to achieve capital productivity in line with corporate risk tolerance and external drivers
The devastating impact on capital productivity A recent EY study of projects in the mining and metals sector (October 2014) surveyed 108 projects at various stages across the investment and project delivery life cycle (proposed, awaiting Final Investment Decision (FID), in construction or ready to “Go Live”). Cumulatively, these projects represented global investments of US$367b, with each individual project exceeding US$1b and relating to the development of copper, iron ore, gold, coal, nickel and other commodities.
Opportunities to enhance capital productivity | 7
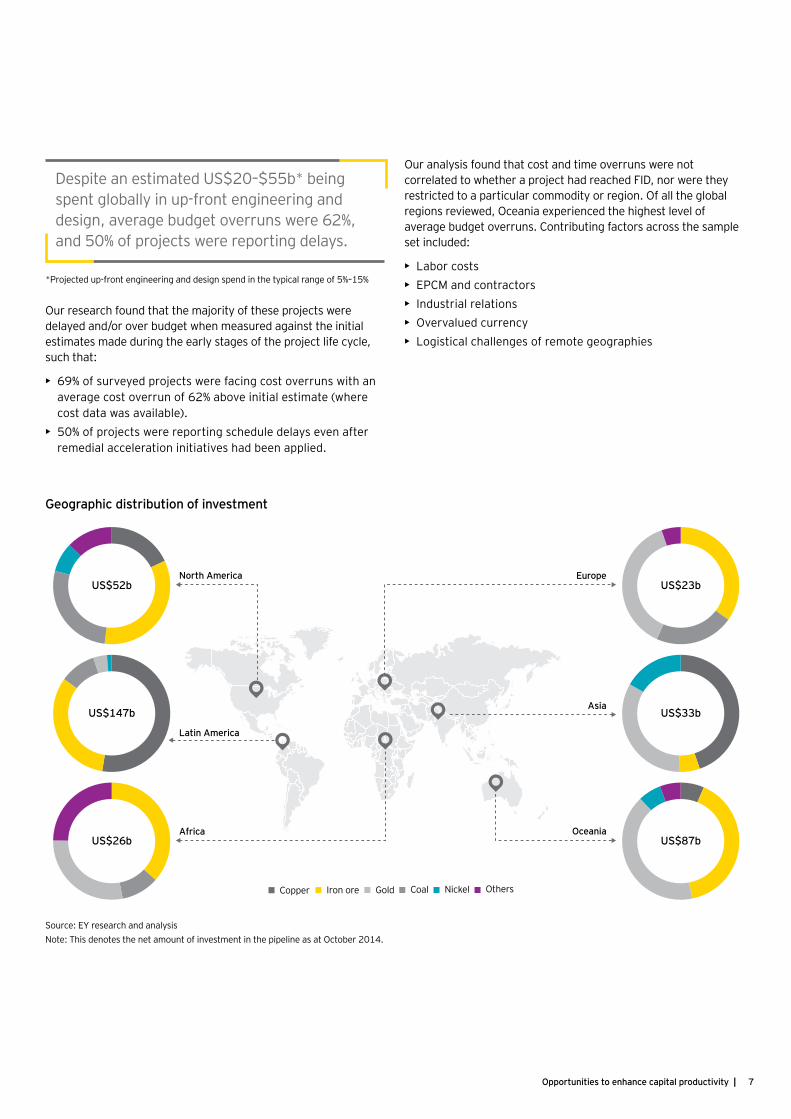
Our research found that the majority of these projects were delayed and/or over budget when measured against the initial estimates made during the early stages of the project life cycle, such that:
• 69% of surveyed projects were facing cost overruns with an average cost overrun of 62% above initial estimate (where cost data was available).
• 50% of projects were reporting schedule delays even after remedial acceleration initiatives had been applied.
Our analysis found that cost and time overruns were not correlated to whether a project had reached FID, nor were they restricted to a particular commodity or region. Of all the global regions reviewed, Oceania experienced the highest level of average budget overruns. Contributing factors across the sample set included:
• Labor costs• EPCM and contractors• Industrial relations• Overvalued currency • Logistical challenges of remote geographies
Geographic distribution of investment
North America
Latin America
Europe
OceaniaAfrica
Asia
Copper Iron ore Gold Coal Nickel Others
US$52b
US$147b
US$26b US$87b
US$23b
US$33b
Source: EY research and analysisNote: This denotes the net amount of investment in the pipeline as at October 2014.
*Projected up-front engineering and design spend in the typical range of 5%–15%
Despite an estimated US$20–$55b* being spent globally in up-front engineering and design, average budget overruns were 62%, and 50% of projects were reporting delays.
| Opportunities to enhance capital productivity8
The impact of overruns Higher commodity prices in the past few decades have concealed the impact of declining productivity as well as the consequences of budget and schedule overruns. Many of the analyzed projects were approved when commodity prices were on a trajectory cyclical upswing. Recent volatility, and a downward trend, in commodity prices have rendered many of these projects high on the cost curve, with some performing above the marginal cost of production, given the current prices.
c fi c cand greater investor demand for capital discipline continue to be key decision-making considerations, executive appetite for cost and schedule variations is low. Mining and metals organizations must understand the factors that lead to project schedule and cost overruns, and adequately plan to successfully manage and deliver their projects. Continuing the current trend of poor capital productivity, performance is not consistent with adequate returns into the future.
Many of the projects studied that experienced overruns were fl c c A number of these projects made media headlines due to their underperformance. For example:
• A major copper and gold operation in Central Asia: The National Finance Minister had been quoted as saying: “No one understands why the project has gone US$2b over budget.”
• A major iron ore project in Brazil: To date, the project has experienced an overrun from the initial estimate of
c c ficcompany has gone on record to say that “they are working very hard” to ensure no more delays or cost overruns on the project.
• A Brazilian megaproject: This project saw capital costs escalate from US$3.6b in 2007 to US$8.8b in 2013. Media sources have described this investment as one of this
fic c
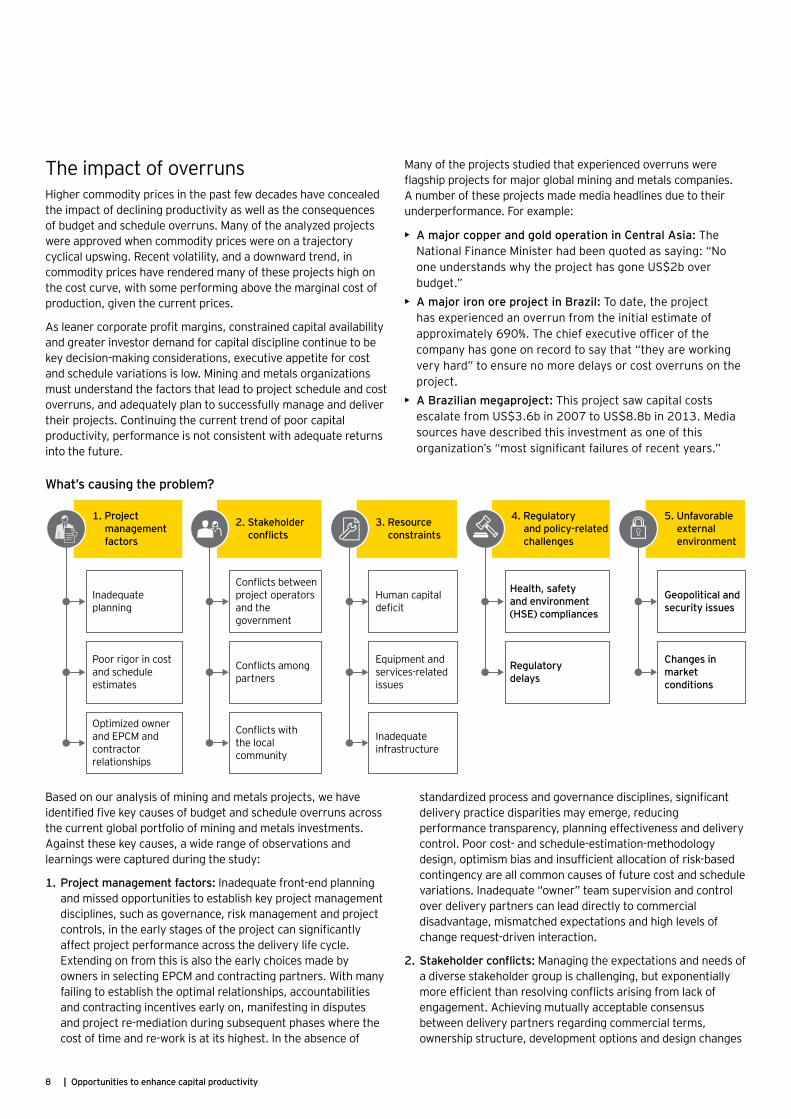
Based on our analysis of mining and metals projects, we have fi fi c c c
the current global portfolio of mining and metals investments.Against these key causes, a wide range of observations and learnings were captured during the study:
1. Project management factors: Inadequate front-end planning and missed opportunities to establish key project management disciplines, such as governance, risk management and project c c c ficaffect project performance across the delivery life cycle. Extending on from this is also the early choices made by owners in selecting EPCM and contracting partners. With many failing to establish the optimal relationships, accountabilities and contracting incentives early on, manifesting in disputes and project re-mediation during subsequent phases where the cost of time and re-work is at its highest. In the absence of
Inadequate planning
Poor rigor in cost and schedule estimates
Optimized ownerand EPCM andcontractorrelationships
1. Project management factors
fl cproject operators and the government
fl cpartners
fl cthe local community
2. Stakeholder c nflicts
Health, safety nd en ir nment
E c mp i nces
Regulatory delays
4. Regulatory nd p ic re ted
challenges
e p itic ndsecurit issues
n es inmarket c nditi ns
5. Unfavorable external en ir nment
Human capital fic
Equipment and services-related issues
Inadequate infrastructure
3. Resource c nstr ints
What’s causing the problem?
c c c ficdelivery practice disparities may emerge, reducing performance transparency, planning effectiveness and delivery control. Poor cost- and schedule-estimation-methodology
fic ccontingency are all common causes of future cost and schedule variations. Inadequate “owner” team supervision and control over delivery partners can lead directly to commercial disadvantage, mismatched expectations and high levels of change request-driven interaction.
2. t ke der c nflicts Managing the expectations and needs of a diverse stakeholder group is challenging, but exponentially
fic c fl c cengagement. Achieving mutually acceptable consensus between delivery partners regarding commercial terms, ownership structure, development options and design changes
Opportunities to enhance capital productivity | 9
was also seen as a key driver of delays. Local community engagement and management is a common area of underinvestment requiring dedicated management and a tailored engagement approach.
3. Resource constraints: While resource constraints have eased relative to the 2011-2012 period, megaprojects continue to
fic c fic cinfrastructure resources for which supply constraints are common. Where multiple projects are being delivered simultaneously in a single region, the market for high-performing human capital and critical equipment could be
fl c cquality outputs and project delays. In regions where infrastructure investment is slow to catch up with exploration and development, access to resources, such as water, power, rail and roads, is often costlier and time-consuming than initially planned.
4. Regulatory and policy-related challenges: Many of the study projects had faced delays associated with regulatory
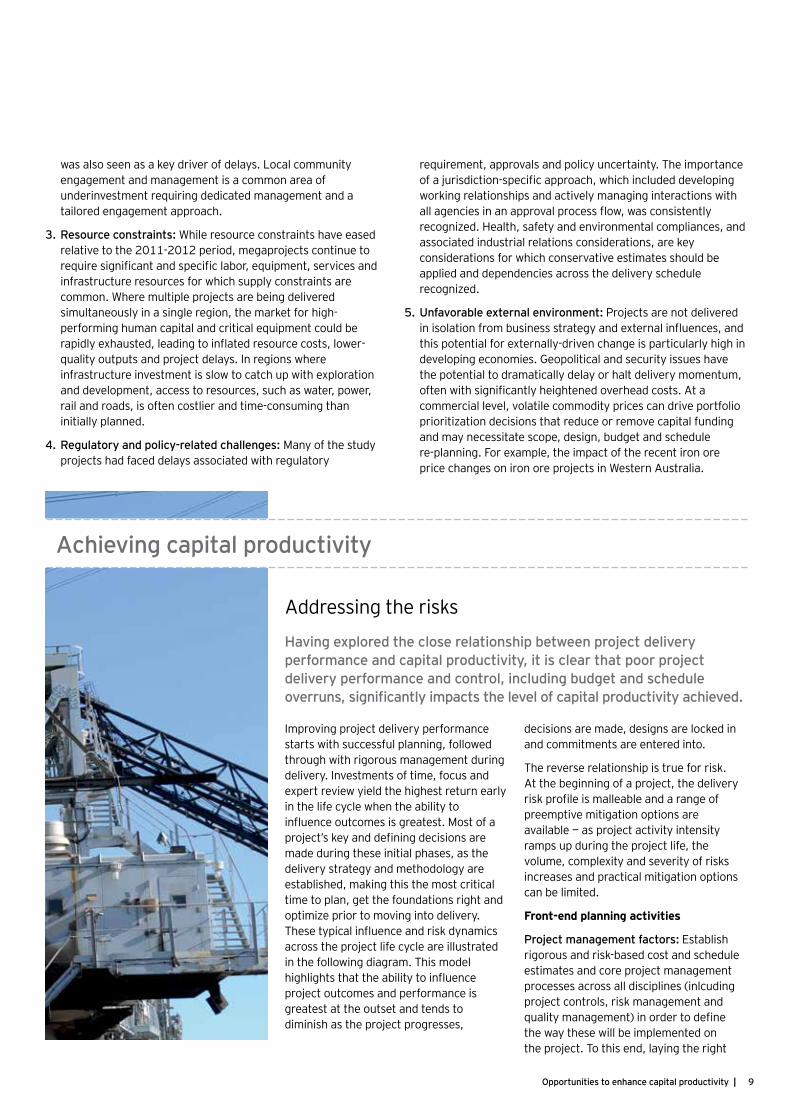
Achieving capital productivity
requirement, approvals and policy uncertainty. The importance c c fic c c c
working relationships and actively managing interactions with c c fl c
recognized. Health, safety and environmental compliances, and associated industrial relations considerations, are key considerations for which conservative estimates should be applied and dependencies across the delivery schedule recognized.
5. Unfavorable external environment: Projects are not delivered fl c
this potential for externally-driven change is particularly high in developing economies. Geopolitical and security issues have the potential to dramatically delay or halt delivery momentum,
fic ccommercial level, volatile commodity prices can drive portfolio prioritization decisions that reduce or remove capital funding and may necessitate scope, design, budget and schedule re-planning. For example, the impact of the recent iron ore price changes on iron ore projects in Western Australia.
Addressing the risks
Having explored the close relationship between project delivery per rm nce nd c pit pr ducti it it is c e r t t p r pr ectde i er per rm nce nd c ntr inc udin ud et nd sc edu e
erruns si ni c nt imp cts t e e e c pit pr ducti it c ie ed
Improving project delivery performance starts with successful planning, followed through with rigorous management during delivery. Investments of time, focus and expert review yield the highest return early in the life cycle when the ability to
fl c cc fi c
made during these initial phases, as the delivery strategy and methodology are established, making this the most critical time to plan, get the foundations right and optimize prior to moving into delivery.
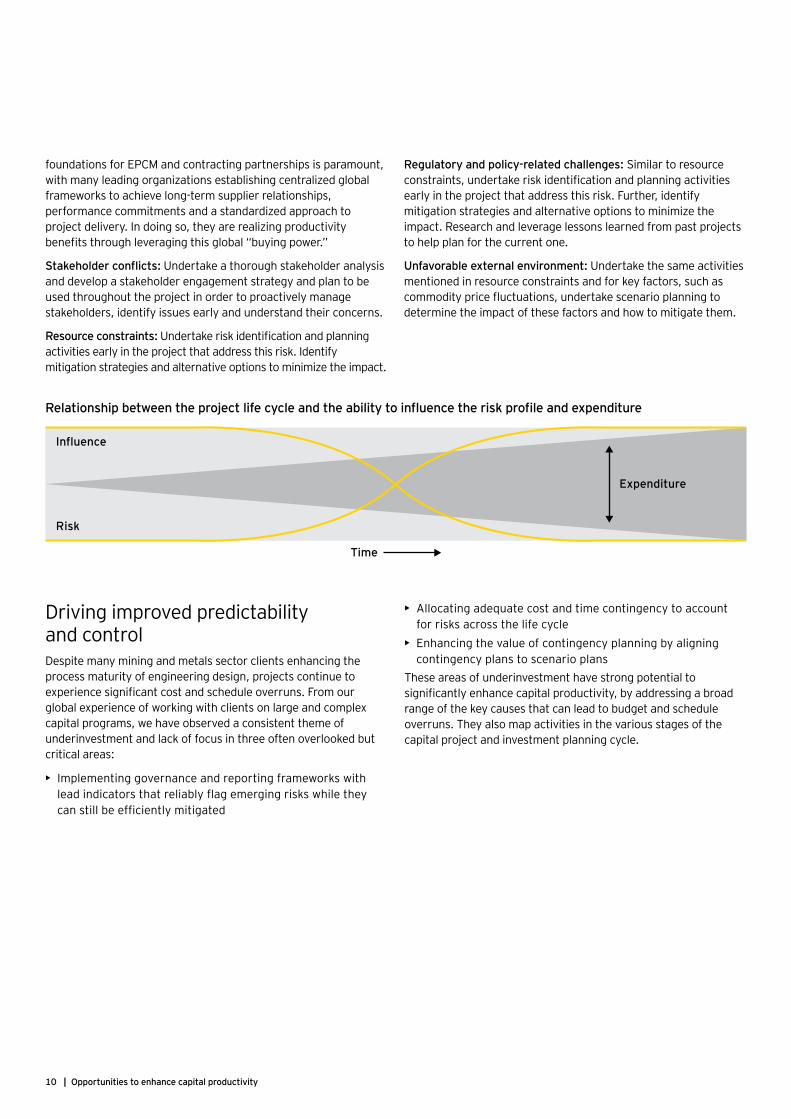
c fl c cacross the project life cycle are illustrated in the following diagram. This model
fl cproject outcomes and performance is greatest at the outset and tends to diminish as the project progresses,
decisions are made, designs are locked in and commitments are entered into.
The reverse relationship is true for risk. At the beginning of a project, the delivery
fipreemptive mitigation options are available — as project activity intensity ramps up during the project life, the volume, complexity and severity of risks increases and practical mitigation options can be limited.
Front-end planning activities
Project management factors: Establish rigorous and risk-based cost and schedule estimates and core project management processes across all disciplines (inlcuding project controls, risk management and
fithe way these will be implemented on the project. To this end, laying the right
| Opportunities to enhance capital productivity10
Influence
Expenditure
Risk
Time
Re ti ns ip et een t e pr ect i e c c e nd t e i it t influence t e risk pr e nd expenditure
Driving improved predictability and controlDespite many mining and metals sector clients enhancing the process maturity of engineering design, projects continue to
c fic c cglobal experience of working with clients on large and complex capital programs, we have observed a consistent theme of underinvestment and lack of focus in three often overlooked but critical areas:
• Implementing governance and reporting frameworks with c fl
c fic
• Allocating adequate cost and time contingency to account for risks across the life cycle
• Enhancing the value of contingency planning by aligning contingency plans to scenario plans
These areas of underinvestment have strong potential to fic c c c
range of the key causes that can lead to budget and schedule overruns. They also map activities in the various stages of the capital project and investment planning cycle.
foundations for EPCM and contracting partnerships is paramount, with many leading organizations establishing centralized global frameworks to achieve long-term supplier relationships, performance commitments and a standardized approach to project delivery. In doing so, they are realizing productivity
fi
t ke der c nflicts Undertake a thorough stakeholder analysis and develop a stakeholder engagement strategy and plan to be used throughout the project in order to proactively manage stakeholders, identify issues early and understand their concerns.
Resource constraints: ficactivities early in the project that address this risk. Identify mitigation strategies and alternative options to minimize the impact.
Regulatory and policy-related challenges: Similar to resource c fic cearly in the project that address this risk. Further, identify mitigation strategies and alternative options to minimize the impact. Research and leverage lessons learned from past projects to help plan for the current one.
Unfavorable external environment: Undertake the same activities mentioned in resource constraints and for key factors, such as c c fl c cdetermine the impact of these factors and how to mitigate them.
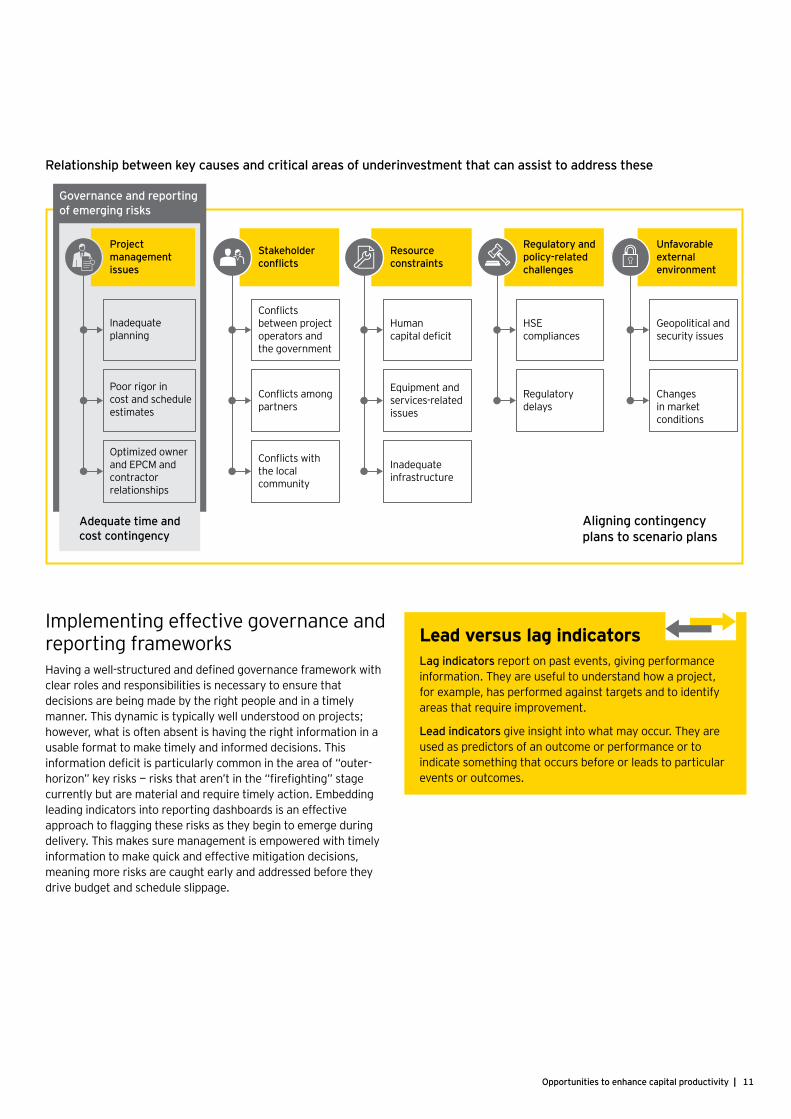
Opportunities to enhance capital productivity | 11
Relationship between key causes and critical areas of underinvestment that can assist to address these
Conflicts amongpartners
Conflicts withthe localcommunity
Stakeholderconflicts
Conflictsbetween projectoperators andthe government
Regulatorydelays
Regulatory andpo icy-relatedchallenges
HSEcompliances
Changesin marketconditions
Unfavorableexternalenvironment
Geopolitical andsecurity issues
Equipment andservices-relatedissues
Inadequateinfrastructure
Resourceconstraints
Humancapital deficit
Adequate time andcost contingency
Governance and reportingof emerging risks
A igning contingencyplans to scenario plans
Project management issues
Inadequateplanning
Poor rigor incost and scheduleestimates
Optimized ownerand EPCM andcontractorrelationships
Implementing effective governance and reporting frameworks
c fi cclear roles and responsibilities is necessary to ensure that decisions are being made by the right people and in a timely manner. This dynamic is typically well understood on projects; however, what is often absent is having the right information in a usable format to make timely and informed decisions. This
fic c cfi fi
currently but are material and require timely action. Embedding leading indicators into reporting dashboards is an effective
c fldelivery. This makes sure management is empowered with timely information to make quick and effective mitigation decisions, meaning more risks are caught early and addressed before they drive budget and schedule slippage.
Lead versus lag indicatorsLag indicators report on past events, giving performance information. They are useful to understand how a project, for example, has performed against targets and to identify areas that require improvement.
Lead indicators give insight into what may occur. They are used as predictors of an outcome or performance or to indicate something that occurs before or leads to particular events or outcomes.
| Opportunities to enhance capital productivity12
Key questions• Do your dashboards focus on lag or lead indicators?
• Are you getting the right information to change direction before risks eventuate or poor performance is reported by a lag indicator?
Leading indicators exist across the range of delivery disciplines. Taking stakeholder management as an example, sample metrics to be considered include the number of stakeholder queries, the number of open queries, time of response and the number of complaints. Where these stakeholder complaints and query metrics indicate stakeholder concerns are not being addressed in a timely manner, they can be powerful lead indicators that signify
ficbudget and schedule performance impacts. Using lead indicators to monitor delivery performance is a proven technique enabling early awareness and intervention. Similarly, effective lead indicators, which every project should consider monitoring, include contingency drawdown rates (i.e., contingency funding consumption over time) and orphan-risk levels (i.e., no owners or mitigations). Both are effective indicators of risk management and planning alignment maturity. The former enables monitoring of contingency spend, which, when done in parallel to monitoring and analyzing remaining risks, can facilitate an assessment to determine if it is adequate to account for these risks or if a
c fica project that may exceed its allocated contingency; thus, mitigations could be developed earlier. For the latter, having an indicator of the number of orphan risks enables the immediate
fic c it poses a threat they could eventuate and becomes issues that impact schedule or budget. From the indicator, action could be taken to allocate either a responsible person or mitigation measures to ensure these risks do not go unmanaged and potentially adversely impact the project.
Having dashboards that focus on lag indicators provides detail on how a program or project has performed. However, it does not provide insight into what to expect in the future nor enable proactive decision-making and planning that is enabled by leading indicators.
There are typical lead indicators, such as those discussed above, which are useful for most projects. However, an investment in identifying bespoke indicators that are directly relevant to a given project and its success factors is what will drive the most value to ensure delivery teams are getting the right information to steer their projects to success.
To develop a dashboard that incorporates leading indicators requires insight into a project/program’s key risks and uncertainties, as well as, an understanding of how it is being managed and implemented and its key activities. This enables the
fic c c ccprecursors to particular risks eventuating.
Allocating adequate cost and time contingency Every project and program has a degree of risk and uncertainty. It’s for this reason that every project and program needs some form of contingency allocation and a corresponding contingency management process. Effective contingency provision begins with
c fic c cc c fic fic
Leading contingency approaches start from this base and, rather than ‘’set and forget,” revalidate contingency alignment at key stage-gating intervals to ensure an appropriate contingency
c fl cinformation that has come to light. Combined with change control-aligned draw-down processes and contingency depletion monitoring, these contingency control disciplines are the essential building blocks of an integrated contingency management approach.
In formulating initial cost and schedule estimates that would directly inform portfolio prioritization decision-making, the
c fi cbenchmarks and robust quantitative analysis is crucial. To support
c c fi c cestimates need to account for not only the base value of works but also an appropriate probability-based provision for possible changes, risks and uncertainty. These provisions are known as contingency and are made in relation to events and forces for which there is a level of likelihood and impact ambiguity. The broad range of events and forces to be considered span both the external environment (such as political, economic, environmental and social considerations) and the internal organizational, portfolio, program or project environment.
Including appropriate levels of contingency in business cases put forward for investment decisions ensures that these decisions are based on the best possible view of likely total capital cost and time. By appropriately considering the probability and impact of risks on delivery, the potential for unforeseen and unmitigated cost and schedule impacts is greatly reduced.
As a project progresses through its delivery life cycle, the risk fi c c
realized. With these changes, ongoing management and reevaluation of contingency throughout the life cycle is essential.
Opportunities to enhance capital productivity | 13
A
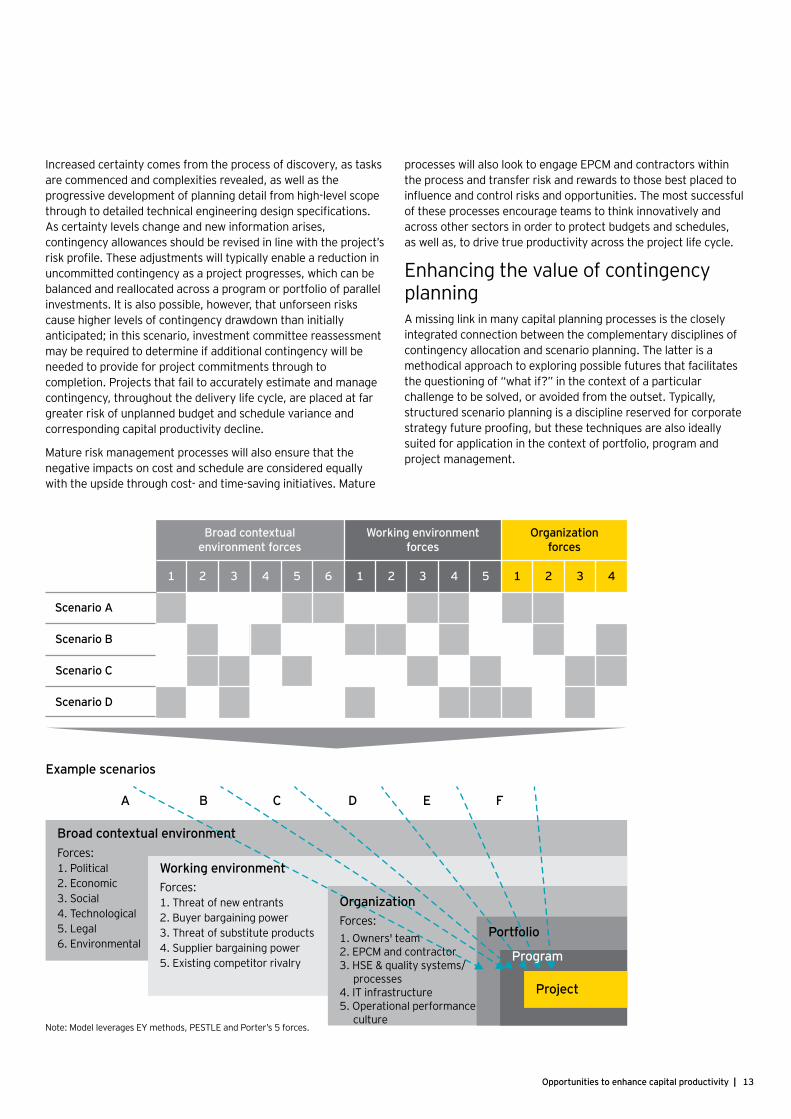
Forces:1. Political2. Economic3. Social4. Technological5. Legal6. Environmental
Broad contextual environment
B C D E F
Forces:1. Threat of new entrants2. Buyer bargaining power3. Threat of substitute products4. Supplier bargaining power5. Existing competitor rivalry
Working environment
Forces:1. Owners' team 2. EPCM and contractor 3. HSE & quality systems/ processes4. IT infrastructure5. Operational performance culture
Organization
Portfolio
Program
Project
1
Broad contextualenvironment forces
Scenario A
Scenario B
Scenario C
Scenario D
Working environmentforces
Organizationforces
1 12 2 23 3 34 4 45 56
Example scenarios
Increased certainty comes from the process of discovery, as tasks are commenced and complexities revealed, as well as the progressive development of planning detail from high-level scope
c c c fic As certainty levels change and new information arises, contingency allowances should be revised in line with the project’s
fi c cuncommitted contingency as a project progresses, which can be balanced and reallocated across a program or portfolio of parallel investments. It is also possible, however, that unforseen risks cause higher levels of contingency drawdown than initially anticipated; in this scenario, investment committee reassessment may be required to determine if additional contingency will be needed to provide for project commitments through to completion. Projects that fail to accurately estimate and manage contingency, throughout the delivery life cycle, are placed at far greater risk of unplanned budget and schedule variance and corresponding capital productivity decline.
Mature risk management processes will also ensure that the negative impacts on cost and schedule are considered equally with the upside through cost- and time-saving initiatives. Mature
processes will also look to engage EPCM and contractors within the process and transfer risk and rewards to those best placed to
fl c c ccof these processes encourage teams to think innovatively and across other sectors in order to protect budgets and schedules, as well as, to drive true productivity across the project life cycle.
Enhancing the value of contingency planning A missing link in many capital planning processes is the closely integrated connection between the complementary disciplines of contingency allocation and scenario planning. The latter is a methodical approach to exploring possible futures that facilitates the questioning of “what if?” in the context of a particular challenge to be solved, or avoided from the outset. Typically, structured scenario planning is a discipline reserved for corporate
fi csuited for application in the context of portfolio, program and project management.
Note: Model leverages EY methods, PESTLE and Porter’s 5 forces.
| Opportunities to enhance capital productivity14
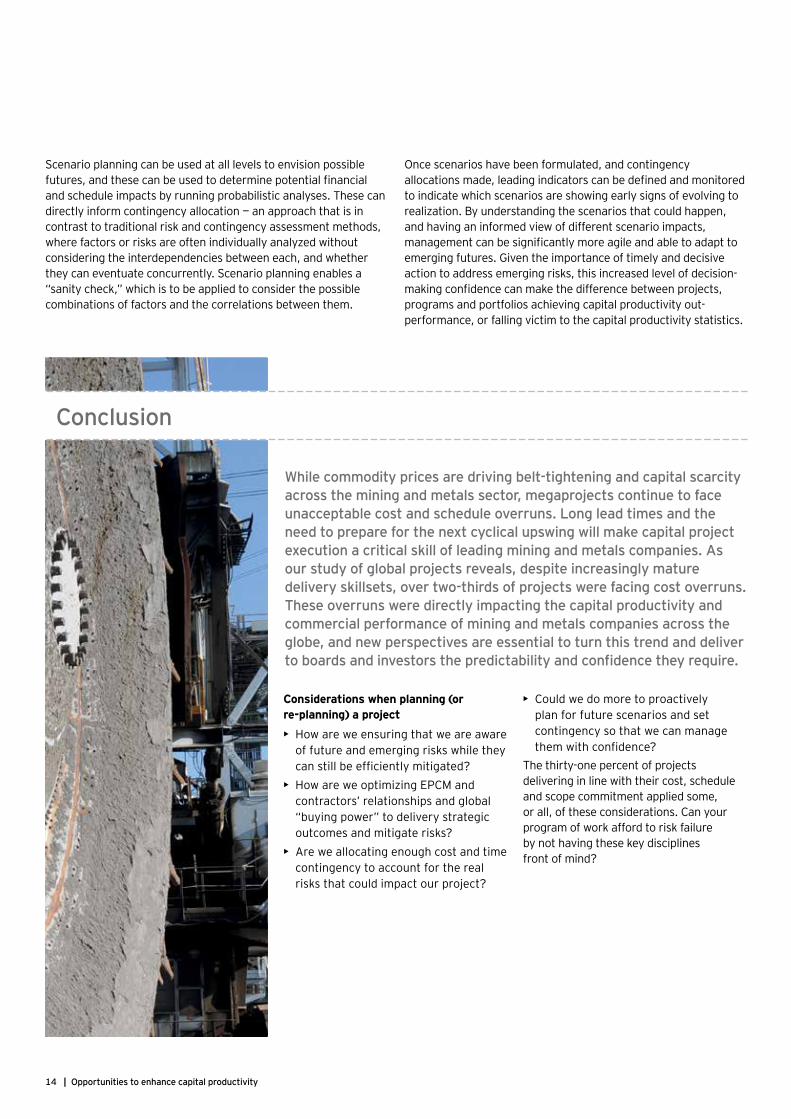
While commodity prices are driving belt-tightening and capital scarcity cr ss t e minin nd met s sect r me pr ects c ntinue t ce
unacceptable cost and schedule overruns. Long lead times and the need to prepare for the next cyclical upswing will make capital project execution a critical skill of leading mining and metals companies. As ur stud pr ects re e s despite incre sin m ture
de i er ski sets er t t irds pr ects ere cin c st errunsThese overruns were directly impacting the capital productivity and commercial performance of mining and metals companies across the
e nd ne perspecti es re essenti t turn t is trend nd de i ert rds nd in est rs t e predict i it nd c n dence t e re uire
Scenario planning can be used at all levels to envision possible c fi c
and schedule impacts by running probabilistic analyses. These can directly inform contingency allocation — an approach that is in contrast to traditional risk and contingency assessment methods, where factors or risks are often individually analyzed without considering the interdependencies between each, and whether they can eventuate concurrently. Scenario planning enables a “sanity check,” which is to be applied to consider the possible combinations of factors and the correlations between them.
Once scenarios have been formulated, and contingency c c c fi
to indicate which scenarios are showing early signs of evolving to realization. By understanding the scenarios that could happen, and having an informed view of different scenario impacts,
c ficemerging futures. Given the importance of timely and decisive action to address emerging risks, this increased level of decision-
c fi c c c cprograms and portfolios achieving capital productivity out-performance, or falling victim to the capital productivity statistics.
Conclusion
Considerations when planning (or re-planning) a project
• How are we ensuring that we are aware of future and emerging risks while they c fic
• How are we optimizing EPCM and contractors’ relationships and global “buying power” to delivery strategic outcomes and mitigate risks?
• Are we allocating enough cost and time contingency to account for the real risks that could impact our project?
• Could we do more to proactively plan for future scenarios and set contingency so that we can manage
c fi cThe thirty-one percent of projects delivering in line with their cost, schedule and scope commitment applied some, or all, of these considerations. Can your program of work afford to risk failure by not having these key disciplines front of mind?
Opportunities to enhance capital productivity | 15
How EY can help Given the current mining and metals landscape, and the challenges and pitfalls inherent in the delivery of megaprojects, companies are struggling to effectively deliver on their agreed-upon plans and strategies. Compounding these delivery challenges, capital projects are now delivered in an environment where stakeholders increasingly demand improved performance, reduced risk and greater transparency over delivery decisions.
Prior to and during investment, stakeholders increasingly ask for independent assessment of key decisions and plans. While often
fiassessment and challenge, both in terms of pacifying stakeholder demands for transparency and ensuring unbiased assessment of project business case, delivery plans, budgets and key stage-gate decisions, mean that it is now a valued tool for portfolio managers and board executives who wish to avoid the optimism bias commonly seen on failing projects.
With our closely linked transactions advisory, tax and advisory service teams, and our global team of mobile capital projects industry professionals, EY is able to provide independent, whole-life support and advice to our clients. We bring the skills,
fic c c
program and portfolio teams across the capital planning and delivery life cycle from initiation and setup of business cases and commercial delivery structures, through feasibility and into project design, construction, commissioning and handover.
The depth of our commercial knowledge, across the mining sector and project life cycle, means that our capital projects team is ideally positioned to help you manage the risk of your capital projects and portfolio:
• Uniquely acting through direct intervention• c fic c
development, construction or commissioning• Advising on portfolio risk and performance and stage-gate
approval decisions at the board levelWe have a history of helping global mining organizations overcome the different capital project issues outlined within this document, gathering and developing leading practices collaboratively with our clients. That means that we are able to play an active and valuable role in almost any team and can quickly source skills and advice as and where our clients’ needs arise.
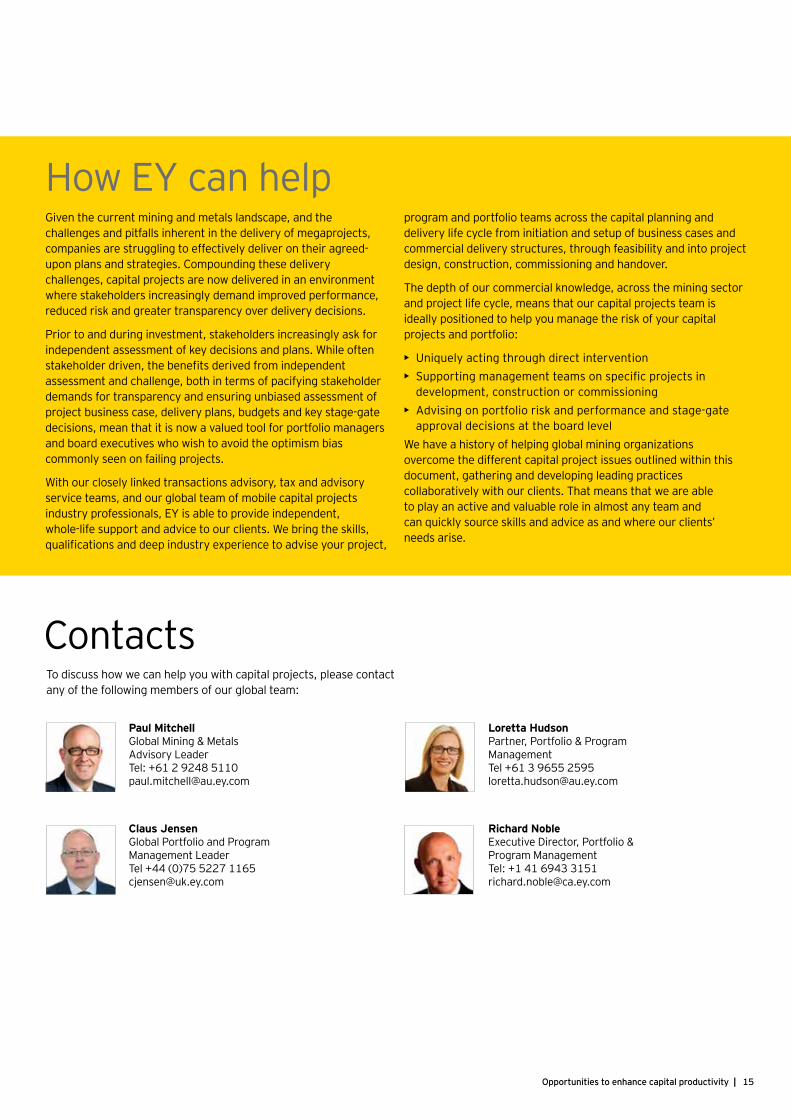
Paul MitchellGlobal Mining & Metals Advisory Leader Tel: +61 2 9248 [email protected]
Claus JensenGlobal Portfolio and Program Management Leader Tel +44 (0)75 5227 [email protected]
ContactsTo discuss how we can help you with capital projects, please contact any of the following members of our global team:
Loretta HudsonPartner, Portfolio & Program Management Tel +61 3 9655 [email protected]
Richard NobleExecutive Director, Portfolio & Program ManagementTel: +1 41 6943 3151 [email protected]

About EYEY is a global leader in assurance, tax, transaction and advisory services. The insights and quality services we deliver help build trust and confidence in the capital markets and in economies the world over. We develop outstanding leaders who team to deliver on our promises to all of our stakeholders. In so doing, we play a critical role in building a better working world for our people, for our clients and for our communities.
EY refers to the global organization, and may refer to one or more, of the member firms of Ernst & Young Global Limited, each of which is a separate legal entity. Ernst & Young Global Limited, a UK company limited by guarantee, does not provide services to clients. For more information about our organization, please visit ey.com.
© 2017 EYGM Limited.All Rights Reserved.
EYG no. 04319-174GBL
BMC AgencyGA 1005459
ED None.
This material has been prepared for general informational purposes only and is not intended to be relied upon as accounting, tax or other professional advice. Please refer to your advisors for specific advice.
ey.com/miningmetals
EY | Assurance | Tax | Transactions | AdvisoryHow EY’s Global Mining & Metals Network can help your businessWith increasingly positive sentiment in the sector, miners are focused on restoring balance sheet strength and liquidity in preparation for growth. The sector’s key opportunity is still productivity. Although many have made productivity improvements, the critical next wave of gains needs a strong focus on loss elimination, with digital being a key enabler.
fic c cimplement strategic initiatives, with deep sector knowledge to
fi c ccapital planning, and through to operational improvement programs, such as productivity and digital enablement.
EY Global Mining & Metals LeaderMiguel Zweig+55 11 2573 [email protected]
AfricaWickus Botha+27 11 772 [email protected]
BrazilAfonso Sartorio+55 21 3263 [email protected]
CanadaJim MacLean+1 416 943 [email protected]
ChileMaría Javiera Contreras+56 2 676 [email protected]
China and MongoliaPeter Markey+86 21 2228 2616 [email protected]
Commonwealth ofIndependent StatesBoris Yatsenko+7 495 755 98 [email protected]
r nce uxem urre E
Christian Mion+33 1 46 93 65 [email protected]
JapanAndrew Cowell+81 3 3503 [email protected]
IndiaAnjani Agrawal+91 22 6192 [email protected]
NordicsLasse Laurio+35 8 405 616 140
fi c
OceaniaScott Grimley+61 8 9429 [email protected]
United Kingdom & IrelandLee Downham+44 20 7951 [email protected]
United StatesBob Stall+1 404 817 5474 [email protected]
Service line contactsEY Global Advisory LeaderPaul Mitchell+61 2 9248 [email protected]
EY Global Assurance LeaderAlexei Ivanov+7 495 228 36 [email protected]
EY Global IFRS LeaderTracey Waring+61 3 9288 [email protected]
EY Global Tax LeaderAndrew van Dinter+61 3 8650 [email protected]
EY Global Transactions LeaderLee Downham+44 20 7951 [email protected]
Area contacts