opportunity assessment for the u.s. flexible packaging ... · flexible packaging industry ......
TRANSCRIPT
1
SAI INDUSTRIAL LLC
OPPORTUNITY ASSESSMENT FOR THE U.S. FLEXIBLE PACKAGING INDUSTRY
A presentation to
FLEXIBLE PACKAGING ASSOCIATION
February 24, 2012
VISIT SAI’S WEBSITE FOR MORE INFORMATION
www.strategicanalysis.com
BELGIUM ● BRAZIL ● CHINA ● INDIA ● JAPAN ● RUSSIA ● SINGAPORE ● UNITED STATES
The purpose of the document is to share with the client SAI’s proposed format and preliminary findings to date. The format and information contained in the document is subject to change as SAI completes its field research and analysis. In addition, any outstanding deliverables and clerical errors will be addressed in the final report. SAI will issue the formal report upon project completion.
PROJECT OBJECTIVES
• Update information• Focus on trends that favor flexible• Look for low flexible penetration
Update previous research
• Cost• Materials• Equipment and capital• Market perceptions
Determine challenges
• Globalization• Sourcing strategies• Materials costsIdentify trends
SAI (FPA7) 1
• Sustainability
• Differences between flexible and rigid• Find opportunities• Identify threats
Profile
opportunities
2
SCOPE
Scope Description
Industry Flexible packaging Materials includes paper, resins, plastic film, foil or combinations
Packaging format FlexibleTargeted non-flexible
Corrugated PaperboardGlass
Rigid compositeRigid metalRigid plastic
End-use category Retail foodRetail non-foodInstitutional food
Institutional non-foodIndustrialMedical and pharmaceutical
Geographic United States
Time period 2002 2010 forecast to 2015
SAI (FPA7) 2
Time period 2002, 2010 forecast to 2015 (Market value based on both growth and inflationary levels)
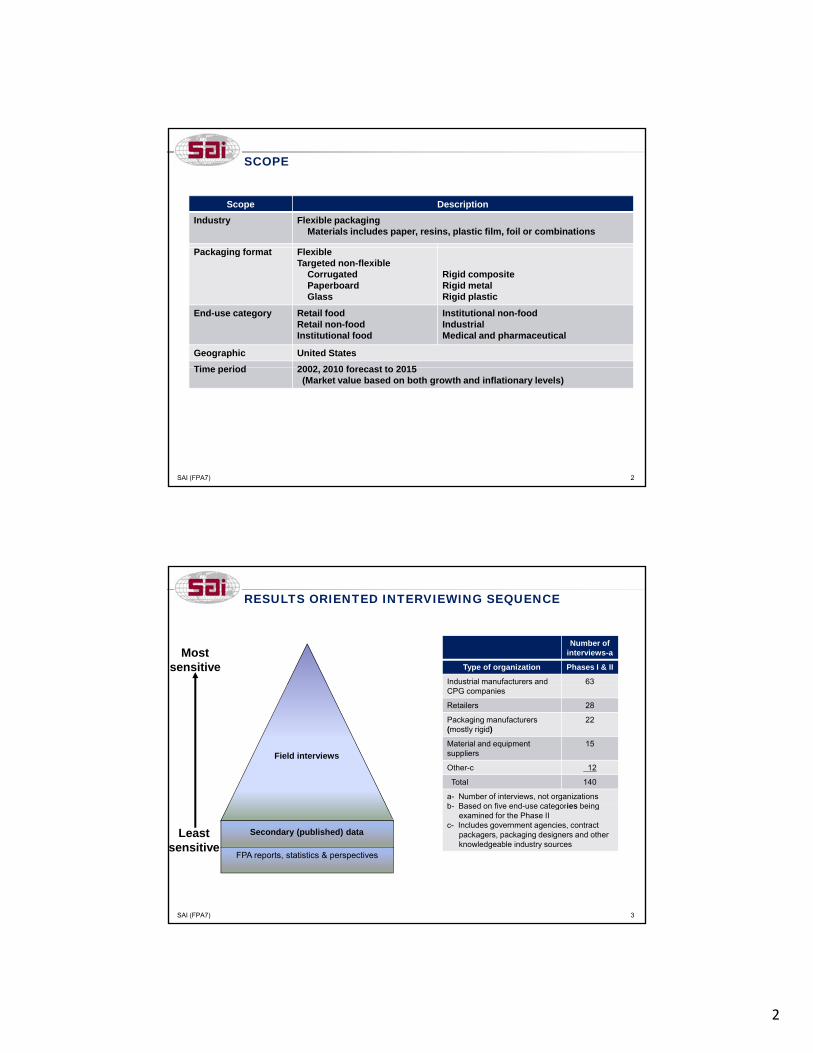
RESULTS ORIENTED INTERVIEWING SEQUENCE
Number of interviews-a
Type of organization Phases I & II
Industrial manufacturers and 63
Mostsensitive
CPG companies
Retailers 28
Packaging manufacturers(mostly rigid)
22
Material and equipmentsuppliers
15
Other-c 12
Total 140
a- Number of interviews, not organizationsb Based on five end use categories being
Field interviews
SAI (FPA7) 3
b- Based on five end-use categories being examined for the Phase II
c- Includes government agencies, contract packagers, packaging designers and other knowledgeable industry sources
Secondary (published) dataLeastsensitive
FPA reports, statistics & perspectives
3
EXAMPLES OF PHASE II INTERVIEWS: RETAIL FOOD AND NON-FOOD
SAI (FPA7) 4
EXAMPLES OF PHASE II INTERVIEWS: INDUSTRIAL, INSTITUTIONAL, MEDICAL
SAI (FPA7) 5
4
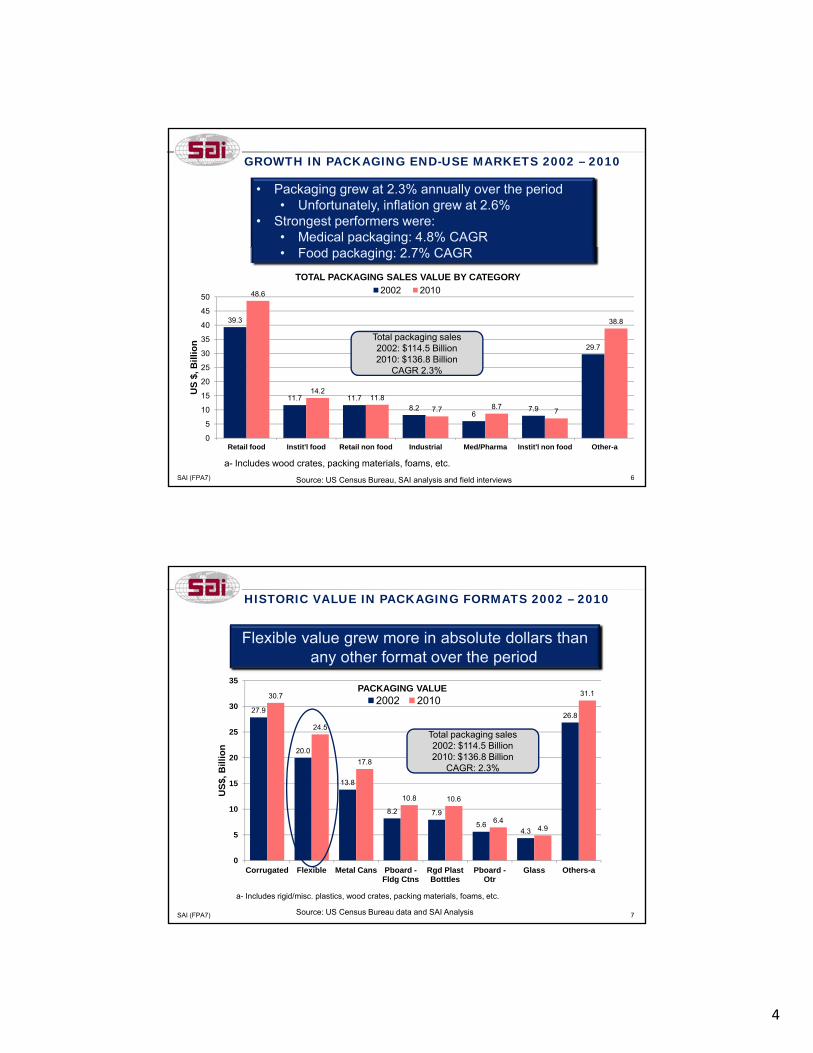
GROWTH IN PACKAGING END-USE MARKETS 2002 – 2010
• Packaging grew at 2.3% annually over the period• Unfortunately, inflation grew at 2.6%
• Strongest performers were:• Medical packaging: 4.8% CAGR
39.3
29.7
48.6
38.8
25
30
35
40
45
50
Bil
lio
n
TOTAL PACKAGING SALES VALUE BY CATEGORY
2002 2010
Total packaging sales2002: $114.5 Billion2010: $136.8 Billion
CAGR 2 3%
• Food packaging: 2.7% CAGR
SAI (FPA7) 6
11.7 11.78.2
67.9
14.211.8
7.7 8.77
0
5
10
15
20
25
Retail food Instit'l food Retail non food Industrial Med/Pharma Instit'l non food Other-a
US
$, B CAGR 2.3%
Source: US Census Bureau, SAI analysis and field interviews
a- Includes wood crates, packing materials, foams, etc.
HISTORIC VALUE IN PACKAGING FORMATS 2002 – 2010
Flexible value grew more in absolute dollars than any other format over the period
35PACKAGING VALUE
27.9
20.0
13.8
26.8
30.7
24.5
17.8
10.8 10.6
31.1
15
20
25
30
US
$, B
illi
on
PACKAGING VALUE2002 2010
Total packaging sales2002: $114.5 Billion2010: $136.8 Billion
CAGR: 2.3%
SAI (FPA7) 7Source: US Census Bureau data and SAI Analysis
8.2 7.9
5.64.3
6.44.9
0
5
10
Corrugated Flexible Metal Cans Pboard -Fldg Ctns
Rgd Plast Botttles
Pboard -Otr
Glass Others-a
a- Includes rigid/misc. plastics, wood crates, packing materials, foams, etc.
5
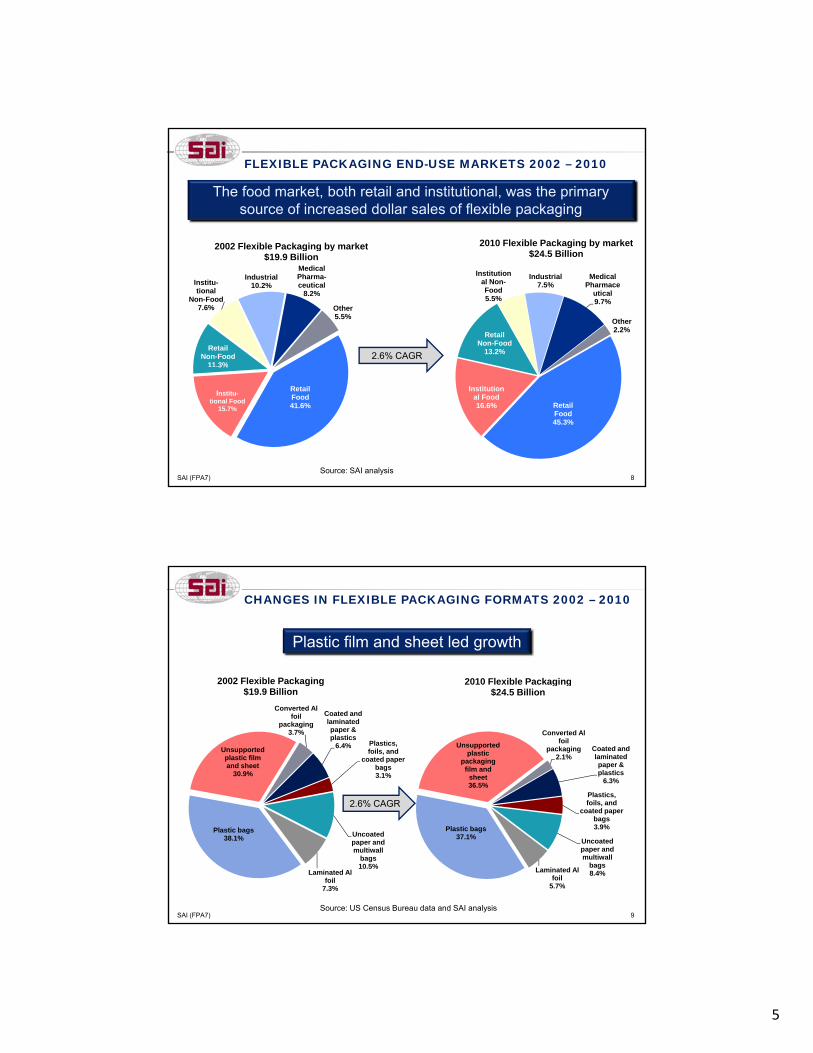
FLEXIBLE PACKAGING END-USE MARKETS 2002 – 2010
2002 Flexible Packaging by market 2010 Flexible Packaging by market
The food market, both retail and institutional, was the primary source of increased dollar sales of flexible packaging
Retail Non-Food
11.3%
Institu-tional
Non-Food7.6%
Industrial10.2%
Medical Pharma-ceutical
8.2%
Other5.5%
2002 Flexible Packaging by market$19.9 Billion
Retail Non-Food
13.2%
Institutional Non-Food5.5%
Industrial7.5%
Medical Pharmace
utical9.7%
Other2.2%
g g y$24.5 Billion
2.6% CAGR
SAI (FPA7) 8
Retail Food41.6%
Institu-tional Food
15.7%
3%
Retail Food45.3%
Institutional Food16.6%
Source: SAI analysis
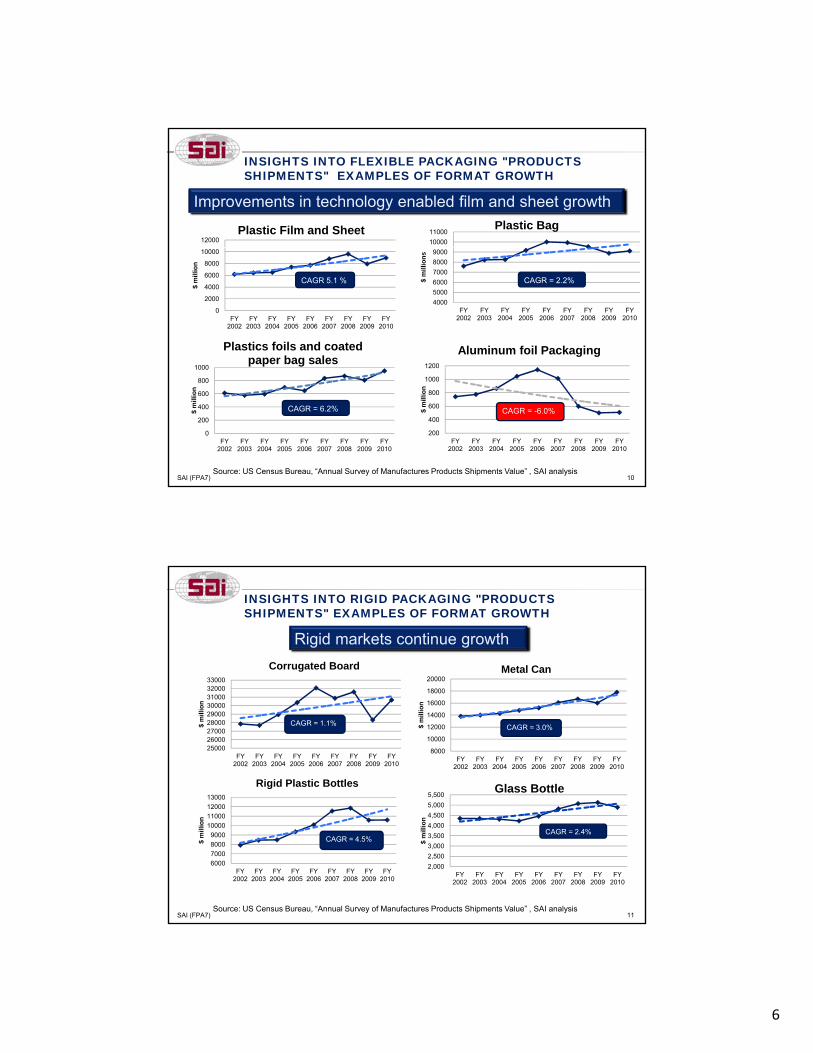
CHANGES IN FLEXIBLE PACKAGING FORMATS 2002 – 2010
2002 Flexible Packaging 2010 Flexible Packaging
Plastic film and sheet led growth
Coated and laminated paper & plastics
6.4% Plastics, foils, and
coated paper bags3.1%
Unsupported plastic film and sheet
30.9%
Converted Al foil
packaging3.7%
g g$19.9 Billion
Coated and laminated paper & plastics
6.3%
Plastics, foils, and
Unsupported plastic
packaging film and
sheet36.5%
Converted Al foil
packaging2.1%
g g$24.5 Billion
2 6% CAGR
SAI (FPA7) 9
Uncoated paper and multiwall
bags10.5%
Laminated Al foil
7.3%
Plastic bags38.1%
foils, and coated paper
bags3.9%
Uncoated paper and multiwall
bags8.4%Laminated Al
foil5.7%
Plastic bags37.1%
2.6% CAGR
Source: US Census Bureau data and SAI analysis
6
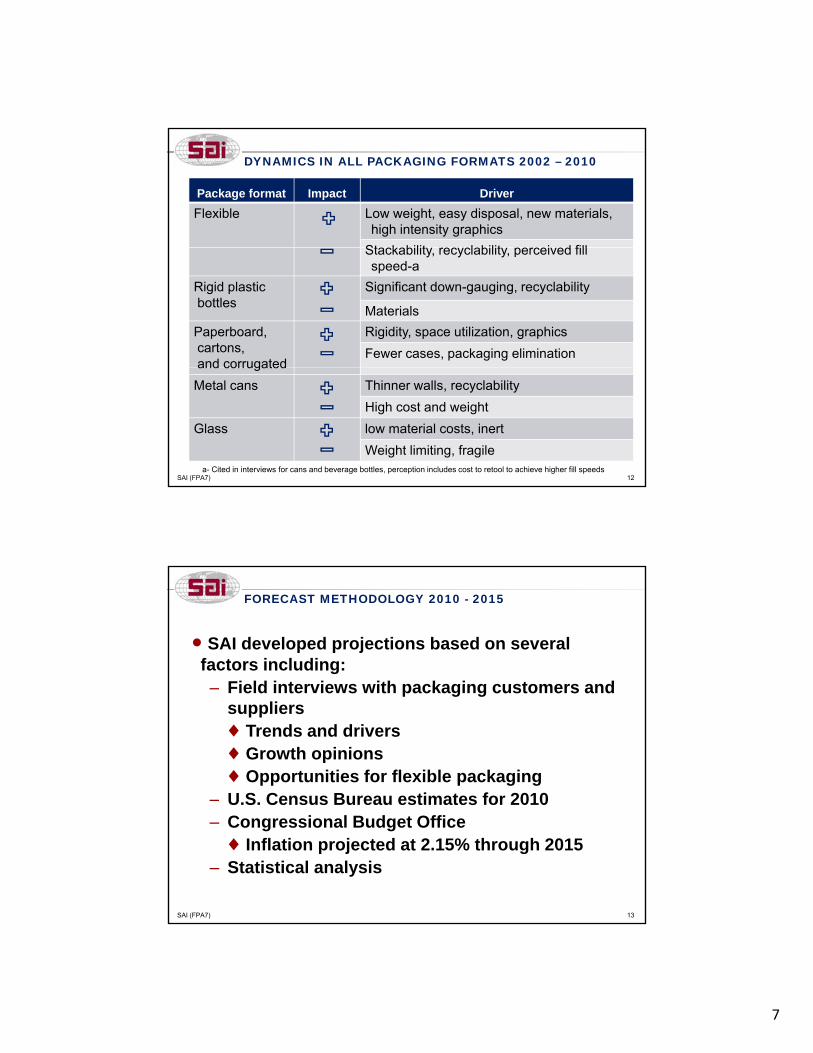
INSIGHTS INTO FLEXIBLE PACKAGING "PRODUCTS SHIPMENTS" EXAMPLES OF FORMAT GROWTH
Improvements in technology enabled film and sheet growth
12000Plastic Film and Sheet
10000
11000Plastic Bag
0
2000
4000
6000
8000
10000
FY 2002
FY 2003
FY 2004
FY 2005
FY 2006
FY 2007
FY 2008
FY 2009
FY 2010
$ m
illio
n
4000
5000
6000
7000
8000
9000
FY 2002
FY 2003
FY 2004
FY 2005
FY 2006
FY 2007
FY 2008
FY 2009
FY 2010
$ m
illio
ns
CAGR = 2.2%CAGR 5.1 %
1000
Plastics foils and coated paper bag sales
1200
Aluminum foil Packaging
SAI (FPA7) 10Source: US Census Bureau, “Annual Survey of Manufactures Products Shipments Value” , SAI analysis
0
200
400
600
800
1000
FY 2002
FY 2003
FY 2004
FY 2005
FY 2006
FY 2007
FY 2008
FY 2009
FY 2010
$ m
illio
n
CAGR = 6.2%
200
400
600
800
1000
1200
FY 2002
FY 2003
FY 2004
FY 2005
FY 2006
FY 2007
FY 2008
FY 2009
FY 2010
$ m
illio
n
CAGR = -6.0%
INSIGHTS INTO RIGID PACKAGING "PRODUCTS SHIPMENTS" EXAMPLES OF FORMAT GROWTH
Rigid markets continue growth
33000
Corrugated Board20000
Metal Can
2500026000270002800029000300003100032000
FY 2002
FY 2003
FY 2004
FY 2005
FY 2006
FY 2007
FY 2008
FY 2009
FY 2010
$ m
illio
n
CAGR = 1.1%
8000
10000
12000
14000
16000
18000
FY 2002
FY 2003
FY 2004
FY 2005
FY 2006
FY 2007
FY 2008
FY 2009
FY 2010
$ m
illio
n
CAGR = 3.0%
12000
13000
Rigid Plastic Bottles
5 000
5,500Glass Bottle
SAI (FPA7) 11
6000
7000
8000
9000
10000
11000
12000
FY 2002
FY 2003
FY 2004
FY 2005
FY 2006
FY 2007
FY 2008
FY 2009
FY 2010
$ m
illio
n
CAGR = 4.5%
Source: US Census Bureau, “Annual Survey of Manufactures Products Shipments Value” , SAI analysis
2,000
2,500
3,000
3,500
4,000
4,500
5,000
FY 2002
FY 2003
FY 2004
FY 2005
FY 2006
FY 2007
FY 2008
FY 2009
FY 2010
$ m
illio
n
CAGR = 2.4%
7
DYNAMICS IN ALL PACKAGING FORMATS 2002 – 2010
Package format Impact Driver
Flexible Low weight, easy disposal, new materials, high intensity graphics
Stackabilit rec clabilit percei ed fillStackability, recyclability, perceived fill speed-a
Rigid plasticbottles
Significant down-gauging, recyclability
Materials
Paperboard, cartons, and corrugated
Rigidity, space utilization, graphics
Fewer cases, packaging elimination
SAI (FPA7) 12
and corrugated
Metal cans Thinner walls, recyclability
High cost and weight
Glass low material costs, inert
Weight limiting, fragilea- Cited in interviews for cans and beverage bottles, perception includes cost to retool to achieve higher fill speeds
FORECAST METHODOLOGY 2010 - 2015
● SAI developed projections based on several factors including:
Field interviews with packaging customers and– Field interviews with packaging customers and suppliers♦ Trends and drivers♦ Growth opinions♦ Opportunities for flexible packaging
– U.S. Census Bureau estimates for 2010U.S. Census Bureau estimates for 2010– Congressional Budget Office♦ Inflation projected at 2.15% through 2015
– Statistical analysis
SAI (FPA7) 13

8
TECHNOLOGY DRIVERS AND TRENDS
ItemApplicable
market Trend/Driver
Light-weighting/ sustainability
RF, IF Reduces cost, uses less material Requires new dies, processing equipment and materials
New films RF, IF, MP Woven and laminated structures, bio films, others to reduce cost, improve barrier properties, sustainability
Pouchtechnology
RF, IF, IN Improved materials and equipmentMore sizes, dispensing/closure/sealing designs,
faster fill speeds
Microwave packaging
RF Convenience, new food products
Market codes: RF Retail Foods IF Institutional Foods MP Medical PharmaceuticalMarket codes: RF- Retail Foods, IF- Institutional Foods, MP- Medical Pharmaceutical, IN- Industrial, RNF- Retail Non-Food
SAI (FPA7) 14
“Manufacturers of packaged goods everywhere face two constant challenges. One is to reduce their environmental footprint to the minimum. The other is to cut costs.” –Manager, Packaging
CONSUMER PACKAGED GOODS MARKET TRENDS AND DRIVERS
ItemApplicable
market Trend/Driver
Right sized packaging RF, IF, MP Proliferation of pack sizes
Market timing RF, IF, MP Requires more pack sizes based on pay cycles, more SKUs – Wal-Mart leading
Sustainability All Broader definition of “sustainability”Tipping point for purchaseCorporate and consumer pressure More regulation
Concentrates RF, IF, IN, MP Increased concentration reduces units
Private label RF, IF, RNF, MP
Value mindset, retailers don’t want to give fitMP up profits
Market codes: RF- Retail Food, IF- Institutional Foods, MP- Medical Pharmaceutical, IN- Industrial, RNF- Retail Non-Food
SAI (FPA7) 15
“The paycheck cycle we’ve talked about before remains extreme…..adjusting pack sizes, large pack sizes at the beginning of the month, small pack sizes at the end of the month.” Bill Simon, CEO of Wal-Mart U.S.

9
CONSUMER TRENDS AND MARKET DRIVERS
ItemApplicable
market Trend/Driver
Focus on All Cost consciousness holdingFocus on price
All Cost consciousness holding
Varied sizes RF, IF, INF Ease of use through single serve, family packaging, re-sealable packages, etc.
Natural content
RF, IF Consumer trend to seek natural content impacts packaging
Private label RF, RNF, MP Continuing value with no significant sacrifice. Retailers unlikely to give back shelf space
Market codes: RF Retail Food IF Institutional Foods MP Medical PharmaceuticalMarket codes: RF- Retail Food, IF- Institutional Foods, MP- Medical Pharmaceutical, IN- Industrial, RNF- Retail Non-Food
SAI (FPA7) 16
FINANCIAL TRENDS AND DRIVERS
ItemApplicable
market Trend/Driver
Raw material costs All Drive to reduce costChanges in raw materials
Capital investment All Reluctance to invest slowed pimplementation of new technologies
Economic recovery All Weak recovery resulted in reluctance to invest in development, expansion and capital
Corporate consolidations
All Industry continues to consolidate, changing competitive pressures
Market codes: RF- Retail Food, IF- Institutional Foods, MP- Medical Pharmaceutical, IN- Industrial, RNF- Retail Non-Food
SAI (FPA7) 17
“Resin obsoletions, increased raw material costs, and increased energy prices. Our business has made a concerted effort to tighten our control over raw-material supply.” Manager, Medical Flexibles
“Companies will use more flexible packaging if it is cheaper. Cost is a major hurdle since investment in new packaging equipment is necessary!” Packaging Manager, Beverage Manufacturer

10
CHANGES IN FLEXIBLE VERSUS RIGID 2010 - 2015
150
PROJECTED PACKAGING SALES Rigid Flexible
● Increases reflect economic recovery and long-term industry growth● Flexible is projected to gain share from rigid
2010 Packaging$136.8 Billion
2015 Packaging$161.1Billion
112.3131.1
24.5 30.1
0
50
100
150
2010 2015
US
$, B
illi
on
g
-a
-a
a- Rounded
SAI (FPA7) 18
Flexible 17.9%
Rigid 82.1%
Flexible18.7%
Rigid81.3%Total: 3.3% CAGR
FLEXIBLE PACKAGING END-USE MARKET GROWTH 2010 –2015
2010 Flexible Packing$24 5 Billion
2015 Flexible Packaging$30 1 Billion
Growing economy will lift all marketsparticularly non-food markets
Retail Food
Institutional Non-
Industrial7.5%
Medical Pharmace
utical9.7%
Other2.2%
$24.5 Billion
Retail Food
Industrial7.4%
Medical Pharma-ceutical
9.1%
Other5.8%
$30.1 Billion
4.2% CAGR
SAI (FPA7) 19Source: SAI analysis
Food45.3%
Institutional Food
16.6%
Retail Non-Food
13.2%
Food5.5%
Food43.5%
Institu-tional Food15.5%
Retail Non-Food13.1%
Institu-tional Non-Food5.5%

11
FLEXIBLE PACKAGING MATERIAL GROWTH 2010 - 2015
Improved technology will benefit film and sheet due to an expanding market and some substitution within flexible packaging
Coated and laminated
pkg materials
6.3%
Plastics, foils, and coated
paper bags3.8%
Uncoated paper and multiwall
bagsPlastics
Aluminum foil
packaging2.4%
2010 Flexible Packaging$24.5 Billion Coated and
laminated pkg
materials6.4%
Plastics, foils, and coated
paper bags4.9%
Uncoated paper and multiwall
bags7.2%
FlexiblePlastics
Aluminum foil
packaging1.7%
2015 Flexible Packaging$30.1 Billion
SAI (FPA7) 20
8.8%
Flexible packaging
foil6.7%
Plastic bags
38.0%
packaging film and sheet34.0%
Flexible packaging
foil4.7%
Plastic bags
33.8%
Plastics packaging film and sheet41.2%
4.2% CAGR
MARKET PENETRATION OPPORTUNITYRETAIL/INSTITUTIONAL – CANS – SOUPS,VEGETABLES, OTHER
Item Requirement
Potential application Pouches for condensed, concentrated or other soups, canned vegetables
Current packaging “Tin can” is the common package – all sizes
Packaging requirement Long shelf life, food safety, good display graphics, shelf display/presentation, shelf space utilization
Motivation for switching
Lower weight, sustainableEasy to open and useLong shelf life
Technical/commercial requirements
Investment is the key issueShelf displaySt k bilit
SAI (FPA7) 21
StackabilityCustomer acceptance
Hurdles Shelf space and stackabilityfill speed
Other considerations FDA/USDA compliance, sustainability, recyclability, carbon footprint
Leading edge products Restaurant and single serve pouches12 lbs

12
MARKET PENETRATION OPPORTUNITYRETAIL FOOD – GLASS – HIGHLY PROCESSED FOODS, FRUITS, OTHER
Item Requirement
Potential application Replace glass in all marketsFruits, gravies, sauces, other
Current packaging Glass bottles, jars
Packaging requirement Product safety/protectionFDA/USDA regulationsSustainability/Cost
Motivation for switching Lighter weightShrinkage protection
Technical/commercial requirements
Cost to change including investmentRecyclability
SAI (FPA7) 22
Hurdles Long shelf life, safetyCapital equipment expense
Other considerations Wal-Mart’s sustainability index ranks flexible packaging higher than glass
Leading edge product Specialties
MARKET PENETRATION OPPORTUNITYRETAIL FOOD – PLASTIC BOTTLES – NON-CARBONATED
Item Requirement
Potential application
Individual serve packages for juices, energy drinks,others
Current packaging Mixed group of bottles, pouches, boxesCurrent packaging Mixed group of bottles, pouches, boxes
Packaging requirement
Light weight, cost savings, sustainable, resealable Display ready
Motivation for switching
Easy to grab, open and useNew cost effective plastic materialsSustainable packages
Technical/commercial requirements
Use of existing pouch equipment is a plusHigh fill speeds
SAI (FPA7) 23
Hurdles Cost of changeRecyclability
Other considerations Use of existing equipment Consumer acceptanceCompetition from thinner plastic bottles
Leading edge product Single serve, toss and go
13
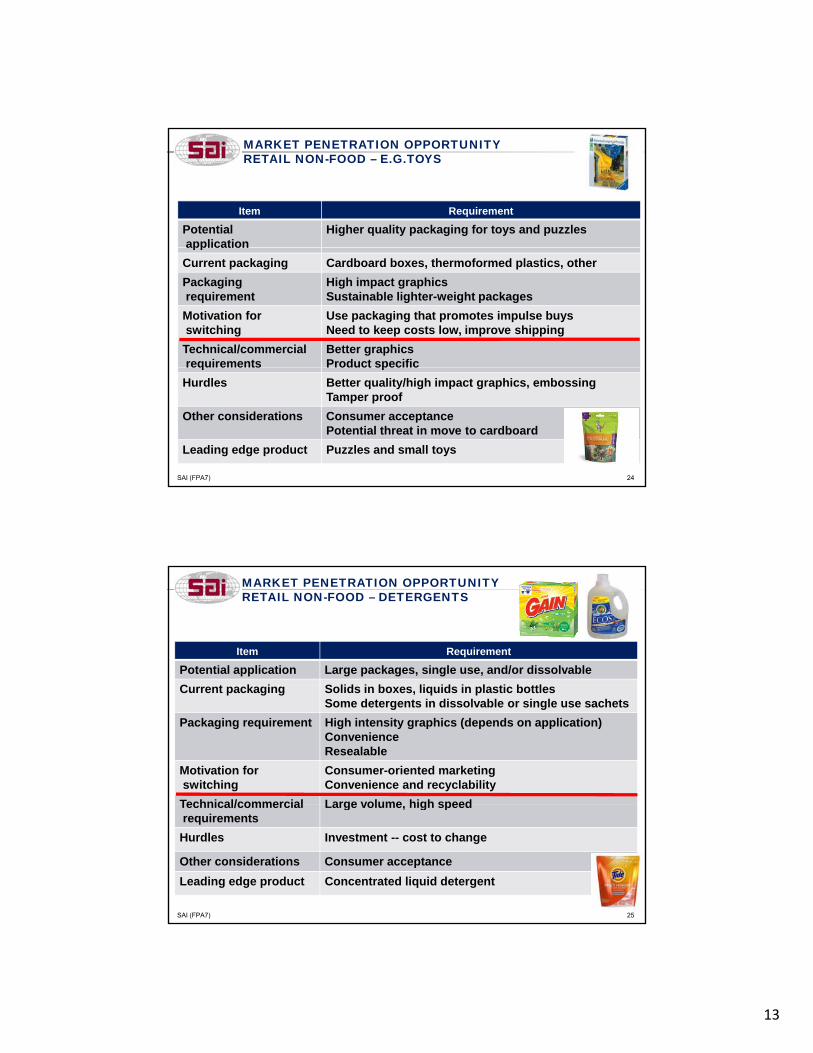
MARKET PENETRATION OPPORTUNITYRETAIL NON-FOOD – E.G.TOYS
Item Requirement
Potential application
Higher quality packaging for toys and puzzlesapplication
Current packaging Cardboard boxes, thermoformed plastics, other
Packaging requirement
High impact graphicsSustainable lighter-weight packages
Motivation for switching
Use packaging that promotes impulse buys Need to keep costs low, improve shipping
Technical/commercial requirements
Better graphics Product specific
SAI (FPA7) 24
requirements Product specific
Hurdles Better quality/high impact graphics, embossingTamper proof
Other considerations Consumer acceptancePotential threat in move to cardboard
Leading edge product Puzzles and small toys
MARKET PENETRATION OPPORTUNITYRETAIL NON-FOOD – DETERGENTS
Item Requirement
Potential application Large packages, single use, and/or dissolvable
C t k i S lid i b li id i l ti b ttlCurrent packaging Solids in boxes, liquids in plastic bottlesSome detergents in dissolvable or single use sachets
Packaging requirement High intensity graphics (depends on application)ConvenienceResealable
Motivation for switching
Consumer-oriented marketingConvenience and recyclability
Technical/commercial Large volume high speed
SAI (FPA7) 25
Technical/commercial requirements
Large volume, high speed
Hurdles Investment -- cost to change
Other considerations Consumer acceptance
Leading edge product Concentrated liquid detergent

14
MARKET PENETRATION OPPORTUNITYRETAIL NON-FOOD – PERSONAL CARE
Item Requirement
Potential application Body wash, shampoo, conditioner, etc.Refill pouches
Current packaging Plastic bottles, small volume of refill pouches, sachets
Packaging requirement
High quality, attractive shelf appearance
Motivation for switching
Less material, lower cost, transportation advantages
Technical/commercial requirements
Capital cost required to change to new packagingHigh volume requires fast fill speed
SAI (FPA7) 26
requirements High volume requires fast fill speed
Hurdles fill speedRecyclability
Other considerations Customer acceptance
Leading edge product Liquid soap refill
NEW MARKET OPPORTUNITYINDUSTRIAL – AGRICULTURAL CHEMICALS
Item Requirement
Potential application Replacement of 1 to 5 gallon containers
C t k i HDPE l b t l l th l tiCurrent packaging used
HDPE, polycarbonate, polypropylene, other plastic bottles, buckets and bags
Packaging requirement
Agricultural chemicals considered hazardousMust contain materials, and survive transportation,accidents, etc.
Motivation for switching
Lightweight, disposability and sustainability
Technical/commercial Packages must meet UN Packaging Requirements
SAI (FPA7) 27
Technical/commercial requirements
Packages must meet UN Packaging Requirements U.S. DOT/49 CFR
Hurdles Meet company and government specifications
Other considerations Resealability a plus
Leading edge product Under developmentNew
Concept

15
NEW MARKET OPPORTUNITYINSTITUTIONAL FOOD – BULK DRIED FRUIT
Item Requirement
Potential application Bulk dried fruit specifically Wholesale food overallWholesale food overall
Current packaging Boxes and rigid totes
Packaging requirement Suitable for transport of bulk dried fruits and other products
Motivation for switching Weight reduction Storage of emptiesCost
T h i l/ i l C it l dit f ki d h dli
SAI (FPA7) 28
Technical/commercial requirements
Capital expenditure for packing and handling equipment
Hurdles Cost to change
Other considerations Customer acceptance
Leading edge product Wholesaler requestNew
Concept
KEY FINDINGS FOR FLEXIBLE PACKAGING
Strengths
Low cost
Light weight
New barrier and physical properties
Weaknesses
High cost of switching
Fill speed
Stackability
Shelf densityp p
Net sustainable
Graphics
Easy to store and use
Shelf density
Not easily recyclable
New to consumer
Opportunities
Plastic bottle, tin cans and glass replacement
Potential low cost polyethylene
Threats
Competition from lightweight cans and plastic bottles
Energy and material price
SAI (FPA7) 29
Potential low cost polyethylene feedstockUse of new materials and bio-based materialsContinued penetration in the food market
Energy and material price spikes
Consumer acceptance
Perceived environmental/safety