opportunity day - dcs-digital.com · puriku lipton others 16,143 mio. thb rtd tea market ... step...
TRANSCRIPT

Opportunity Day ICHITAN Group Public Co., Ltd.
FY 2014

Financial Results & Position1
2
Contents
Investment Highlights3
2
Business Information
Bireley's4
5 Ichitan Indonesia

3
Sale Revenue & Net Profit
1,229
1,497
2,063
1,3601,259
191 202
407266
145
0
500
1,000
1,500
2,000
2,500
Q4/2013 Q1/2014 Q2/2014 Q3/2014 Q4/2014
Sale Revenue Net Profit
2.44 % YoY
-7.43 % QoQ
-24.08 % YoY
-45.49 % QoQ
MB.

4
Sale Revenue & Net Profit
6,4846,179
8841,079
0
1,000
2,000
3,000
4,000
5,000
6,000
7,000
FY 2013 FY2014
Sale Revenue Net Profit
22.06 %
-4.7 %Net Profit Margin (%)2013 = 14%2014 = 17%
Gross Profit Margin (%)2013 = 32%2014 = 34%
MB.
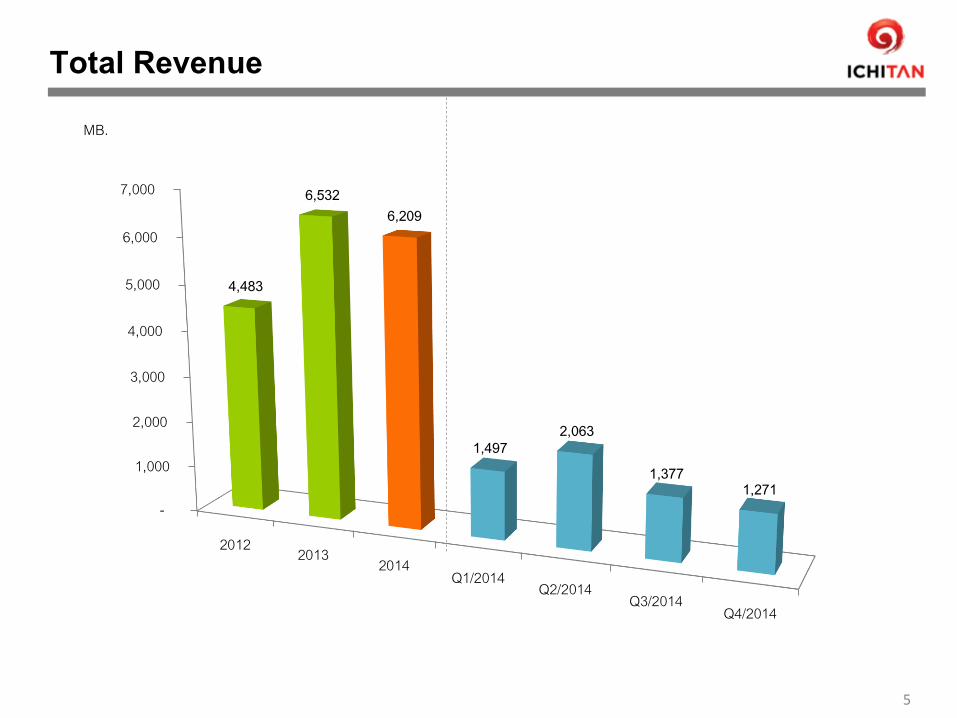
Total Revenue
5
-
1,000
2,000
3,000
4,000
5,000
6,000
7,000
2012 2013 2014Q1/2014 Q2/2014 Q3/2014
Q4/2014
4,483
6,532 6,209
1,497 2,063
1,377 1,271
MB.

Total Expenses
6
531
931 774
270 219 149 136
-
200
400
600
800
1,000
2012 2013 2014 Q1/2014 Q2/2014 Q3/2014 Q4/2014
COGSSelling expenses
2,866
4,425 4,065
950 1,373
928 814
-
1,000
2,000
3,000
4,000
5,000
2012 2013 2014 Q1/2014 Q2/2014 Q3/2014 Q4/2014
Administrative expenses
135 130
250
34 42 16
159
-
100
200
300
2012 2013 2014 Q1/2014 Q2/2014 Q3/2014 Q4/2014
SG&A (%)2013 = 16%2014 = 17%
13% 66%
4%
14%
14%
73%
68%
2%3%
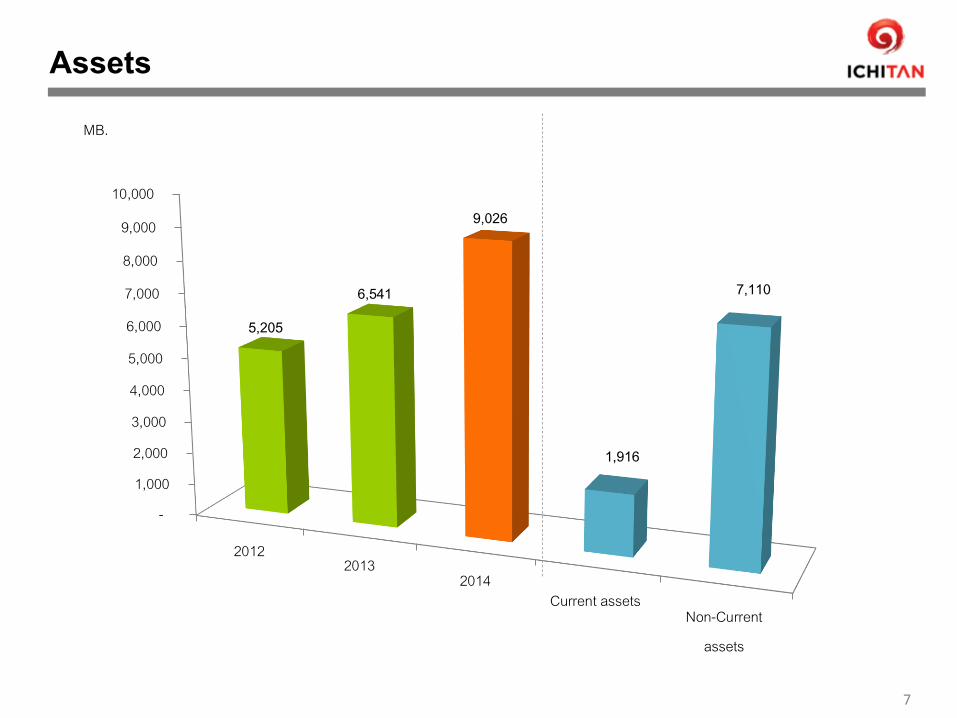
Assets
7
- 1,000
2,000
3,000
4,000
5,000
6,000
7,000
8,000
9,000
10,000
20122013
2014Current assets
Non-Currentassets
5,205
6,541
9,026
1,916
7,110
MB.

Liabilities
8
- 500
1,000
1,500
2,000
2,500
3,000
3,500
4,000
4,500
5,000
20122013
2014Current liabilities
Non-Currentliabilities
4,224 4,573
2,813
1,022
1,791
MB.

Total Shareholder’s Equity
9
-
1,000
2,000
3,000
4,000
5,000
6,000
7,000
20122013
2014
1,074 1,968
6,213
MB.

Financial Ratios
10
ROE (%)
51%67%
26%
2012 2013 2014
ROA (%)
8%
15%
14%
2012 2013 2014
D/E Ratio (Times)
1.90 1.20
0.50
2012 2013 2014

Financial Results & Position
Business Information2
11
Contents
Investment Highlights3
1
4 Bireley's
5 Ichitan Indonesia

Quality
Effectiveness
Giving back to Society
To be a leader in beverage business with both quality and innovation that grows along with
the society
Pursuit of achieving higher quality and more innovative product
Implementing new technologies to assist production and reduce time
Marketing strategy through actions of giving back to the society
Goals in Operating Business
12

7,798
9,481
13,177
16,14315,405
0
2,000
4,000
6,000
8,000
10,000
12,000
14,000
16,000
18,000
2010 2011 2012 2013 2014
Growth prospect in the RTD tea marketRTD tea Market Share 2013
RTD tea market value 2013 is 16,143 million Baht.
RTD tea market CAGR 26% in between 2009-2013
Source: Retail Index Nielsen Jan 2014
Ichitan becomes market leader with 42% market share
13
Market value of RTD tea in Thailand
Mio. THB
42%
39%
9% 4%6%
#1Oishi
Puriku Lipton
Others
16,143 Mio. THB
RTD tea Market Share 2014
43.8%
37.7%
7.5% 4%7%Oishi
Puriku Lipton
Others
#115,405
Mio. THB

400
600
1000 1000
200 200 200 200OEM
OEM
OEM
OEM
75 45
200
200
0
200
400
600
800
1,000
1,200
1,400
Y.2011 Y.2012 Y.2013 Y.2014 Y.2015 F Y.2011 Y.2012 Y.2013 Y.2014 Y.2015
Future Plan
9%
Increasing production capacity to 1,000 Bottles/yearPET Production (Million Bottles/year) UHT Production(Million Brik/year)
MAR – SEP12 +1 MAR13 +1APR 14 APR JUL 12
14
OEM ratio has tendency to decrease continuously in the future after increasing production capacity in phase 2
2 2Production Line 3 5 2 2
+1 Y.2015
6
100%
47%
25%
45% 3%
(Capex =750 MB.)In April 2015
+1SEP 14
2
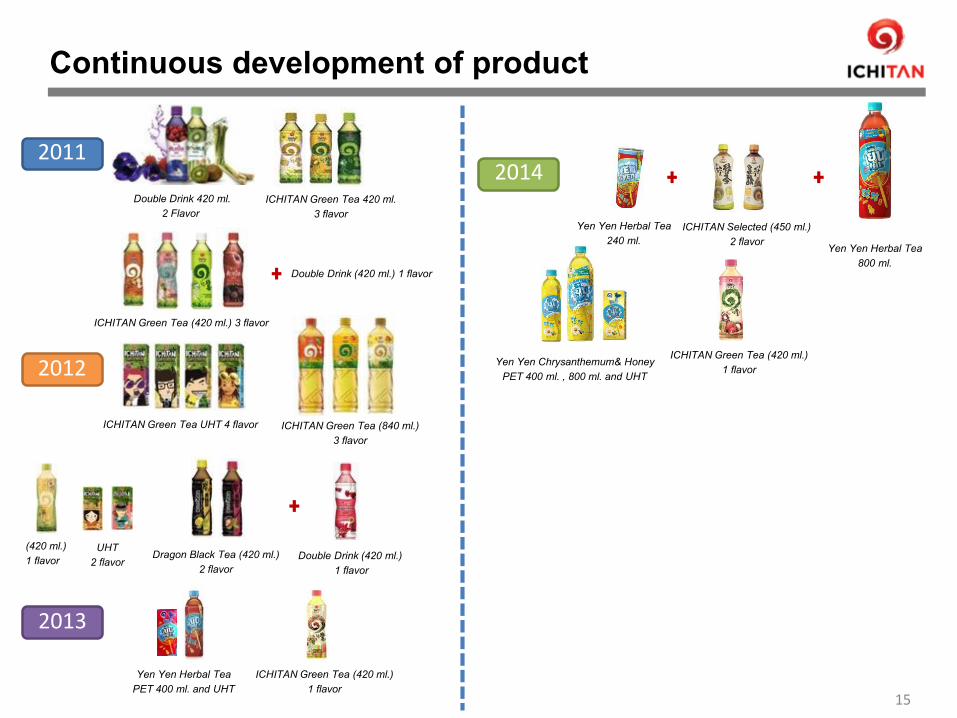
Continuous development of product
15
2011
Double Drink 420 ml.2 Flavor
ICHITAN Green Tea 420 ml.3 flavor
ICHITAN Green Tea (420 ml.) 3 flavor
Double Drink (420 ml.) 1 flavor
2012
ICHITAN Green Tea UHT 4 flavor ICHITAN Green Tea (840 ml.) 3 flavor
(420 ml.) 1 flavor
UHT2 flavor Dragon Black Tea (420 ml.)
2 flavorDouble Drink (420 ml.)
1 flavor
2013
Yen Yen Herbal TeaPET 400 ml. and UHT
ICHITAN Green Tea (420 ml.)1 flavor
2014
Yen Yen Herbal Tea240 ml.
ICHITAN Selected (450 ml.)2 flavor Yen Yen Herbal Tea
800 ml.
Yen Yen Chrysanthemum& HoneyPET 400 ml. , 800 ml. and UHT
ICHITAN Green Tea (420 ml.)1 flavor

49%
50%
Retail Channel and Distribution Channel
1) Modern Trade
2) Traditional Trade
IGT TT Retail that DKSH could not reach
Wholesaler network and partner of Singha nation wide
Thailand (99%)
Export (1%) o AEC Laos, Cambodia, Burma
Take note: % from total sales of beverage16

Proportion of Income by Distribution Channels
17
Modern Trade49%
Traditional Trade50%
Export1%
6,484Million Baht
Y2013 Sales GT/YY/DD = 76/23/1 Y2014 Sales GT/YY = 51/49
Modern Tarde, 55.72%
Traditional Trade, 43.98%
Export, 0.30%
6,179.1Million Baht

Executive Summary
18
• 2015 Target Revenue 7,500 MB. Growth 21%
Bireley’s : 600 MB.
Export : 280 MB.
OEM : 120 MB.

Contents
Investment Highlights3
1
2
19
Business Information
Financial Results & Position
4 Bireley's
5 Ichitan Indonesia

Investment Highlights
5. Effective control on cost and expense resulting in continuing profit rate.
8. Got exempt from tax as according to BOI for 8 years (March 2012 to February 2020)
2. The management team with long experience in building RTD tea market.
3. Step to the leader position with the leading brand strategy by using innovative marketing tools that is effective without negative consequence to the outcome.
1. Ready to drink tea has no limitation in term of growth. The business entrepreneurs are the key driver to grow the market.
6. Expecting the increase of profit resulting from the decreasing of OEM proportion on production after increase own production capacity from 1,000 millions bottles to 1,200 millions bottles per year.
4. Continued growth on both income and profit.
7. High return on investment with 17% net profit in 2014 and with the dividend policy no less than 40%
20
Contents
Investment Highlights
4
1
2
21
Business Information
Financial Results & Position
3
Bireley's
5 Ichitan Indonesia

Established 1920’sCalifornia

23
- The company paid only 80 million baht for lifetime ownership of Bireley's trademark in Thailand
- and another 10 million baht for each 15 other market. There are Cambodia, South Korea, Canada, Myanmar, Philippines, Malaysia, Singapore, United States of America, China, India, Hong Kong, Bangladesh, Indonesia, Taiwan and Vietnam.
- Another 10 million baht for the right of beverage recipe.
Bireley’s

24
Bireley’s

Contents
Investment Highlights
5
1
2
25
Business Information
Financial Results & Position
3
Bireley's4
Ichitan Indonesia

26
PT. Atri Pasifik50%
ICHITAN50%
PT. Sigmantara Alfindo60%
Mitsubishi Corporation 40%
ICHITAN Indonesia

27
Product

INDONESIA MARKET OVERVIEW
JKT
Sumatra21.1%
Java53.8%
Borneo5.7% Sulawesi 7.3%
Lesser Sunda 5.4%
Maluku 5.3%
WesternNew Guinea
253,899,5364th Rank of World Population1st Rank of ASEAN Population

29
RGB
PET
CUP
TETRA
2 Febuary 2014 JV Co., Market Stratergy, JKT, Indonesia

Q & A
30