optical coherence tomography - neurovasc exchange · 2016-08-25 · • optical coherence...
TRANSCRIPT

Optical Coherence Tomography

Disclosure Information
Demetrius Lopes MD
The following relationships exist related to this presentation:
University Grant/Research Support: Rush University
Industry Grant Support: Medtronic, Stryker, Blockade, Microvention, Siemens
Consultant Fee: Name of company(s): Medtronic, Penumbra, Stryker, Terumo
Stock or Shareholder: Blockade, Pulsar, MIVI, Crowdoptic, Three Rivers
Honorarium: Name of company(s): Penumbra, Medtronic, Stryker, Microvention
Speaker’s Bureau: Name of company(s) : Penumbra, Medtronic, Stryker, Terumo, Siemens
Employee (any industry): Name of company(s) : None
Fiduciary Position: Name of company(s) : None
Other Financial or Material Support: Name of company(s) : None
Off label use of products may be discussed in this presentation.

• Optical Coherence Tomography (OCT) is an imaging modality able
to provide high-resolution images of vessels in vivo
• While intravascular ultrasound (IVUS) uses backscattered
ultrasound, OCT uses reflected light to create cross sectional
images of the vessel
IVUS OCT

The C7-XR™ OCT Imaging System
Dual monitors and remote
output for multiple sight lines
Easy mouse
and keyboard control
Small footprint
for easy placement
Multiple export options
including RW/DVD
C7 Dragonfly™
Imaging Catheter

0.035″/2.7 F with hydrophilic coating Quick-connect hub
3 c.c. purge syringe
C7 Dragonfly™ Imaging Catheter
2.7 F shaft Lens Lens marker
Tip marker
2 cm mini-rail
Guidewire exit port

Imaging Lens
Beam is redirected orthogonal to axis

A Simple and Fast Procedure
• Cross with C7
Dragonfly™ monorail
imaging catheter
• Inject 10-12cc of
contrast
• The automatically
triggered imaging scan
is performed in less
than five seconds

OCT in Medical Imaging
Resolution (m)
CT/MRI
Ultrasound
Microscopy
Human Eye Electro-microscopy
3D
2D
10-1 10-2 10-3 10-4 10-5 10-6 10-7
OCT
mm mm

Common Cardiovascular Imaging Modalities
Mechanism 2D/
3D
Resolution Penetration Usage
Angiography X-ray attenuation by
contrast
2D ~100 um All body Blood vessel narrowing
CT Tissue x-ray
attenuation
3D ~ 500 um All body Calcification of vessel
wall
Intravascular MR Tissue hydrogen
content. Hydrogen atoms’ spin
1D NA 1-5 mm Lipid content in vessel
wall
Intravascular
ultrasound
Sound wave
reflection/scattering due to mechanical properties
3D 100-200um 5-10mm Vessel narrowing, plaque
formation and composition, stents
Anigrography Reflection properties
of vessel wall surface
2D ~ 10 um Surface imaging,
need blood clearing
Thrombus, epithelial
damage
OCT Optical scattering,
absorption and birefringence of vessel wall
3D 10-20 um 1-2 mm
Need blood clearing
Vessel narrowing, plaque
formation and composition, thrombus, epithelial damage, stents

Comparison of Imaging Modalities
Image Modality Resolution Fibrous Cap Lipid Core Calcium Thrombus
IVUS 100μm + ++ +++ +
Angioscopy Unknown + ++ ─ +++
OCT 10μm +++ +++ +++ +
Thermography .5mm ─ ─ ─ ─
Spectroscopy not applicable + ++ ++ ─
Intravascular MRI 160μm + ++ ++ +
SENSITIVITY KEY
+++ = >90% ++ = 80%~90% + = 50%~80% ─ = <50%
Journal of Atherosclerosis, Thrombosis and Vascular Biology 2003;23:1333-1342
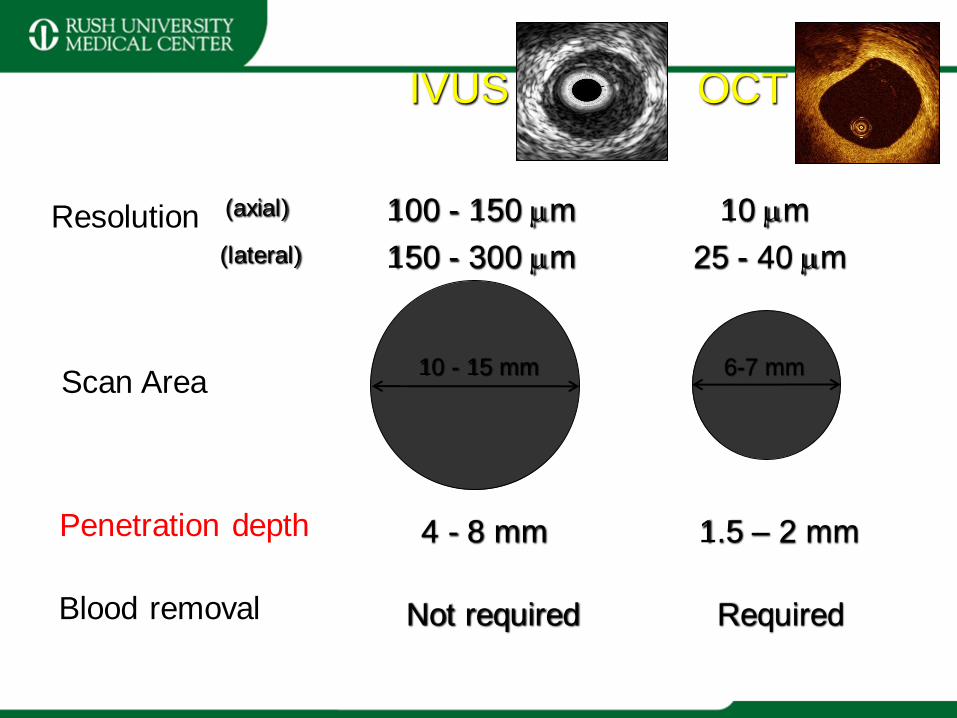
IVUS OCT
Resolution 100 - 150 mm (axial)
(lateral) 150 - 300 mm
10 mm
25 - 40 mm
4 - 8 mm Penetration depth 1.5 – 2 mm
Scan Area 6-7 mm 10 - 15 mm
Required Not required Blood removal

Excellent Measurement Accuracy Percent Error by Phantom: OCT
-4
-2
0
2
4
6
8
10
12
14
16
2 2.2 2.4 2.6 2.8 3 3.2 3.4 3.6
Phantom Diameter (mm)
Err
or
(%) 2.5mm
3.0mm
3.5mm
Percent Error by Phantom: IVUS
-4
-2
0
2
4
6
8
10
12
14
16
2 2.2 2.4 2.6 2.8 3 3.2 3.4 3.6
Phantom Diameter (mm)
Err
or
(%)
2.5mm
3.0mm
3.5mm
OCT IVUS
Phantom Diameter (mm) Phantom Diameter (mm)
Err
or
(%)
Err
or
(%)
OCT IVUS
Mean diameter error 0.98% 4.75%
Max diameter error 2.86% 14.00%
In-vitro phantom study
OCT IVUS
Mean area error 1.87% 9.53%
Max area error 5.72% 32.18%
Data on file: AQ/LLI/DOCS/14437

FACT™ Focused Acoustic Computed Tomography
New Transducer Technology
Design Goals
• Sub 50 micron axial
resolution
• Visualization of entire
plaque and vessel wall
without needing to flush to
clear blood
FACT – Animal Study Image

•Highest resolution in all in vivo
imaging technology (10-20µm)
•Correlation with histology and
other intravascular modalities
(IVUS, angioscopy)
•Lumen contour detection
Easy, very fast,
reproducible
Advantages of OCT
Why OCT?
•Stent evaluations
•Vessel measurement
•Post stenting evaluation
•New stent development
•Stent “healing”
•Vulnerable plaque
•Thin cap (<65µm)
•Macrophages
•Lipid
•(Macro) Calcification
•Thrombosis detection
Clinical demands

OCT for stent evaluation
Strut apposition
Follow up
Strut coverage

New implanted stents
Stent follow-up (neointima growth)
OCT and Stents
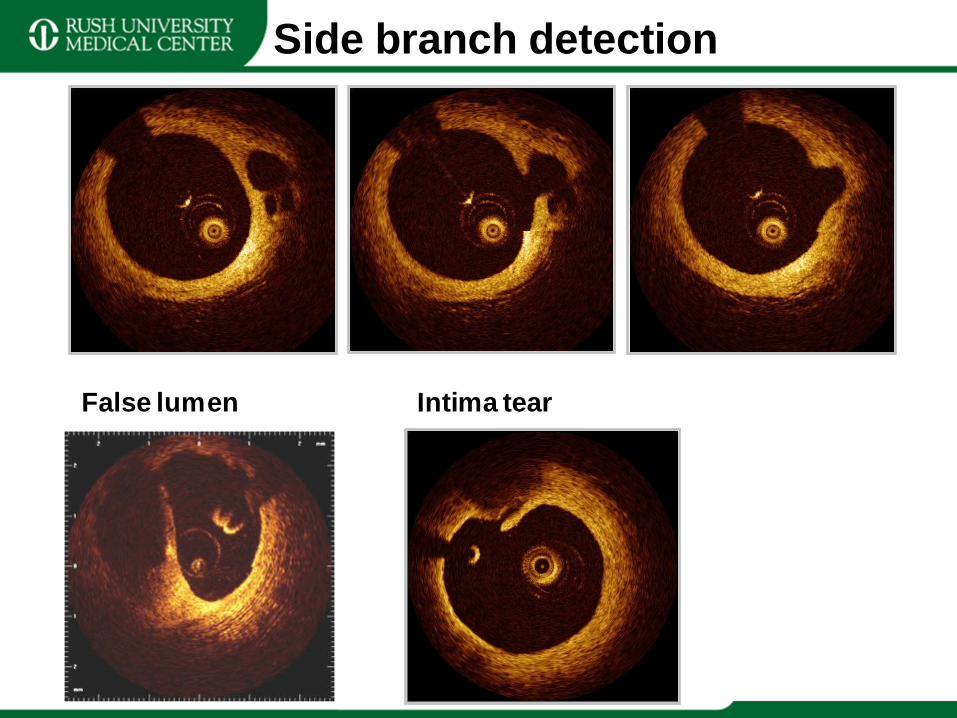
Side branch detection
False lumen Intima tear

OCT Tissue Characterization Preliminary Results
OCT image features:
1. Signal intensity
2. Attenuation
3. Edge sharpness
4. Texture
Histology features:
1. Staining colors
2. Cellular morphology

Cap
Lipid core
Thin-cap Necrotic Core
TCFA without macrophage infiltration: Two-layer structure.
Diffuse boundary formed by the cap and the underlying core

Atherosclerotic plaque composition
Fibrous
Homogeneous signal-
rich region
Fibrocalcific
Well-delineated, signal-poor
region with sharp borders
Lipid-rich
Signal-poor region with
diffuse borders
Yabushita et al. Circulation 2002;106(13):1640-5.
Sensitivity and specificity: 71-79% and 97-98% for fibrous, 95-96% and 97% for fibrocalcific and 90-94% y 90-
92% for lipid-rich plaques.

• The prospective, multicenter, ABSORB study evaluated the safety and
efficacy of a fully absorbable everolimus eluting stent (BVS*) for the
treatment of de novo single coronary stenosis.
• OCT substudy in Rotterdam after implantation, at 6 months and 2 years.
*Bioabsorbable Vascular Solutions, Inc, an affiliate of Abbott
Laboratories, located in Mountain View, CA
OCT for the evaluation of new generation stents
Bioabsorbable stents.
Serruys et al. Lancet 2009; 373: 897–910
BL 6M 2Y

Precise Vessel Measurement
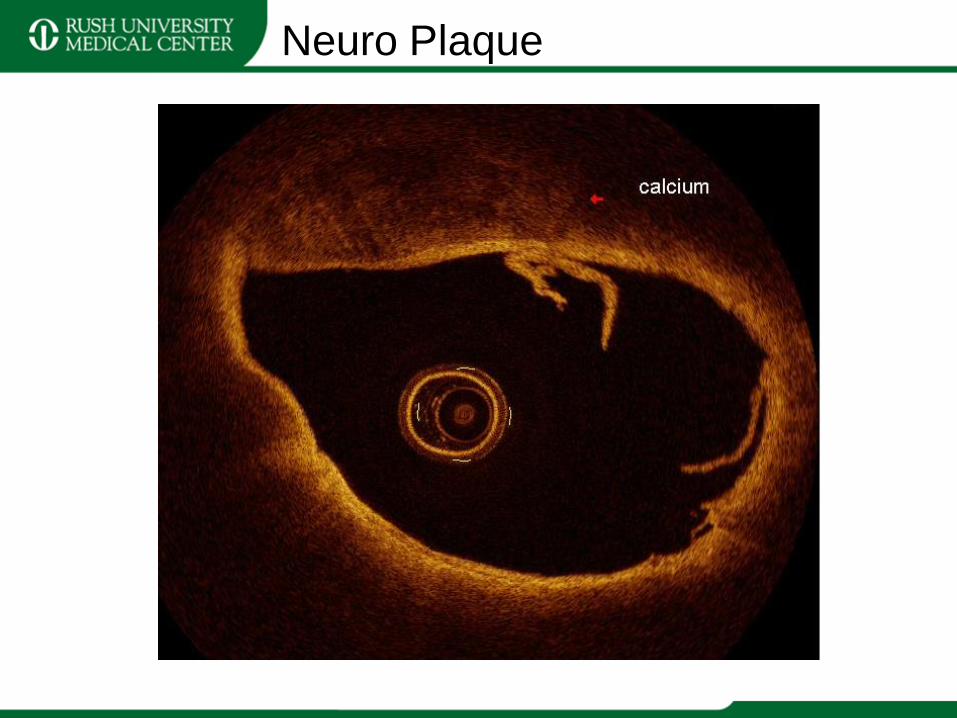
Neuro Plaque

MCA – Lenticulostriate perforators

MCA – Lenticulostriate perforators

Anterior Cerebral Artery

Relationship pipeline - perforator

Basilar post Pipeline

P-com artery (smallest)


Transverse sinus imaging

Stent endothelialization monitored
with intravascular imaging and
histology in porcine
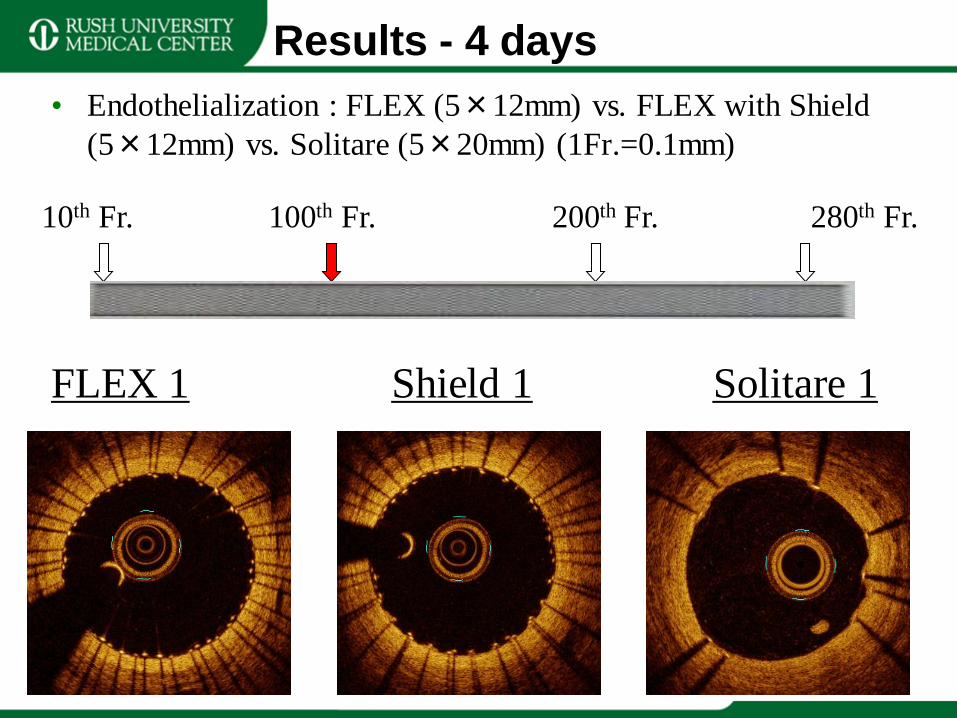
Results - 4 days
• Endothelialization : FLEX (5×12mm) vs. FLEX with Shield
(5×12mm) vs. Solitare (5×20mm) (1Fr.=0.1mm)
FLEX 1 Shield 1 Solitare 1
10th Fr. 100th Fr. 200th Fr. 280th Fr.

Endothelialization of device over time in a porcine model

Thank you