optical communication - telenor
TRANSCRIPT


1Telektronikk 2.2005
Optical fibre was first installed in telecom networksaround two decades ago. At that time most of us, engi-neers included, had never heard of photonics – binocu-lars, cameras, spectacles, and contact lenses more orless covered all the optics we cared to know about.Since then the field of fibre optics and photonics hasgrown to become arguably one of the top ten techno-logical achievements of the previous century and hashad an enormous socio-economic impact. The inven-tion of the laser and the commercial use of optical fibrein telecom have been the turning points and the keyenablers for the transition from the industrial era of theprevious centuries to the so-called information era andthe knowledge economy we are witnessing today. Thefield of photonics covers a large scope, from medicalapplications, sensors, and CD players, to optical com-munications. This issue of Telektronikk is devoted tooptical communications, in particular optical networks.
Optical transmission has led to an increase of the sin-gle cable transmission capacity by a factor of 3000and has the potential to increase it many times over.Fibre has enabled transatlantic transmission withoutrepeaters and many tens of parallel high capacitychannels in one fibre cable. This massive capacityincrease has meant a complete paradigm shift for thetelecom network and the telecom sector as a whole.Cost per bit is dramatically reduced and no longer dic-tated by transmission distance. Bandwidth is in practiceno longer a luxury resource. These have been centralfactors in order to enable the convergence betweentelecom and datacom – converging services, terminals,and networks – and the creation of the high capacitynetworks we are so accustomed to today. Telecommu-nications has been transformed from being the busi-ness of providing voice connections to becoming avery advanced sector that embraces a whole range ofservices, rather central to our every day activities andtransactions, at work and leisure in and out of thehome. The way we do business, retrieve and storeinformation, learn, entertain ourselves, shop – com-municate at all – has been and is continuously beingdramatically changed by the new global digital space.
Imagine a scenario without optical fibre, with copperwires of limited capacity between network nodes.Network ownership and maintenance would still haverequired a fortune, cost per bit would still have beenhuge, and abolishing the telecom monopoly wouldhave been obsolete. The Internet Protocol (IP) wouldhave remained a university exercise, satellite tele-
vision would probably have prevailed over cable; wewould still have mobile phones for voice and text,however, at considerably higher cost per bit, and thecost of advanced data-based services over fixed ormobile terminals would have been prohibitive forwide public use.
As revolutionizing as it has been, the real potential ofoptical technologies does not lie with high capacitytransmission from A to B. The real potential of photon-ics lies with its ability to switch large quantities of dataefficiently quickly and transparently (i.e. independentof format), and the flexibility it can provide in a net-work context by interplaying with other technologies orother network layers. Photonics possesses unique char-acteristics that complement these of IP – it can increasethroughput dramatically, rationalize and automate net-work processes, and provide robustness and quality ofservice differentiation. The evident prevailing of IPgives a strong incentive for the introduction of morephotonics inside network nodes, i.e. besides its use intransmission equipment. It is indeed symptomatic andnot accidental that large IP routers have exclusivelyoptical interfaces and that it costs less than one tenth asmuch to switch interfaces optically than it costs to passthem through an IP router. Also resource managementand protection take place increasingly at optical channelrather than IP packet level. Optical technologies andfunctions are becoming a larger and larger part of the IProuter – IP is going optical! Photonics will graduallypenetrate the very core of IP routers and replace partsof the switching matrices themselves. Reflections onthese, together with an overview of optical networks,are further discussed in the introductory article in thisissue. An overview of the historical development andcurrent state-of-the-art of optical transmission is givenby Aasmund Sudbø. A number of articles are devotedto core network architecture, the introduction of opticalcross connects, reliability, and network control. Emerg-ing and future solutions are in particular discussed.Also, two articles are devoted to optical packet switch-ing, a future technology that can increase flexibility. Itis a pleasure to have three articles on the real issuesinvolved in building planning and testing a network,based on the experience from Norway.
The above relate to the evolution in the inner part ofthe network. However, fibre optics progresses towardsthe end user to provide broadband connections to thehome, and large-scale Fibre-to-the-Home deploymentshave been taking place internationally in the past five
Guest editorial – Optical Communications
E V I Z O U G A N E L I
Evi Zouganeli
is Senior
Research
Scientist at
Telenor R&D
ISSN 0085-7130 © Telenor ASA 2006

2 Telektronikk 2.2005
years or so, especially in Asia. The development isjust catching up in the US and is markedly slower inEurope, so it will still be a while before we observehigh penetration rates here. Yet the fact remains in-disputable – Fibre-to-the-Home is slowly but steadilybecoming a reality at long last. Developments in theaccess network are addressed by two articles, one onexisting and emerging technological solutions andone on the underlying market forces and the eco-nomics of fibre to the home. Ultimately, in order topress costs really down, efficient photonic integratedcircuits will need to be developed, as discussed in abrief review article on photonic integration.
But the world is evidently going wireless, so what isthe future of optical fibre, a wire line technology?Mobility poses by no means a threat to optical fibretechnologies. The need for mobility combined withthe growing requirement for increasingly broadbandconnections speak for more fibre, closer and closer tothe end-user, because wireless technologies haveinherent bandwidth limitations. Hence fibre and wire-less/mobility are complementary rather than compet-ing technologies, though they may be competing insome cases in the short term. Every mobile networkuses a fixed network backbone. Fixed and mobile ser-vices and terminals converge and so do the underlyingnetwork infrastructures as well as all network mecha-nisms that need to go seamless between domains.Operators and providers of mobile services will grad-ually need to address converged broadband servicesand hence relate to both mobile terminals and homes.The role of fibre and of broadband optical networkswill therefore become increasingly central and visiblealso for operators and providers that currently focuson the mobile telecom market. Metro optical networksare in particular interesting in this context.
The metro network has become especially important inthe last five years or so. A number of players – such asmunicipalities, internet service providers, networkoperators, etc. – are present in the metro area. Newtechnological solutions can be easier adopted in themetro area because of its limited extent. Proximity tothe end user makes it a determining part of the networkwith respect to performance, quality of service, andcost. Flexibility in resource allocation and the possibil-ity to reuse the available resources are extremely
Evi Zouganeli holds a PhD in Optoelectronics (1992), an MSc in Telecom (1988), both from University College
London, a BSc in Applied Physics from the University of Patras, Greece (1985), and a Master of Management
(2001) from the Norwegian School of Management. After postdoctoral work at the Swiss Federal Institute of
Technology (ETH, Zurich), she joined Telenor R&D in 1994 where she has focused on high capacity optical
networks, broadband access, network migration and upgrading strategies, and technology evaluations – on
contract from Telenor Business Units and in a number of European collaboration projects. She is a member of
a number of international technical management and evaluation committees and is currently a senior research
scientist at Telenor R&D.
email: [email protected]
important characteristics here, as discussed in a sepa-rate article on metro network evolution.
It is an honour and a challenge to present the currenttopic, optical communications, to an industry that hasbeen reborn because of it and at the same time hasdeveloped some form of technophobia in the course ofits own transformation and expansion. The sector hasundergone radical restructuring in the past ten yearsas well as experienced a particularly steep bubbleperiod. After 150 years of technology focus in amonopolistic environment, incumbent operators arenow on denial when it comes to technology and theimportance of having a good grasp on it. Incumbentshave had to embrace new skills and adapt to the mar-ket challenges of a highly competitive dynamicallychanging sector. Telecom equipment vendors, theoriginal developers of optical technology, have had todownsize this part of their business at the same timethat they embrace the idea of a more central role indesigning and running networks and explore therealms of IP. IP router manufacturers on the otherhand, have evidently recognized the significance ofphotonic technology and its ability to disrupt theirbusiness and are both investing in it and graduallyincorporating it in their products. Computer manufac-turers have realized the possibilities opened by opti-cal networks and the extension of their business toenterprise networks and distributed computing.Finally, many key components and modules aredeveloped and produced by specialized small-medium enterprises.
The players that timely recognize and exploit the fur-ther potential of photonic technology in the data andtelecom sector will have a considerable head start inthe race ahead. Photonics can create a second revolu-tion, this time by revolutionizing network architec-ture, increasing throughput quality and flexibility,simplifying service creation and delivery, and en-abling completely new value-added services. So,I dare say – watch this space!
I hope you will find much of interest in this issue –enjoy reading!
ISSN 0085-7130 © Telenor ASA 2006

3
IntroductionTelecommunications has been dramatically trans-formed in the past couple of decades with a hugeimpact on the everyday life of the average consumer.Mobile phones are an indispensable item in every-one’s pocket or purse, surfing the internet is not justfor nerds, hot spots are to be found in hotels andpetrol stations, wireless local area networks arebroadly used also in our home. One in two has a lap-top in western Europe, and downloading files andmusic from the internet is something many do. Theworld is going digital, global and on the net and it’sbecome difficult to recall that only ten years ago mostof us had neither laptop nor mobile phone …
The internet and the Internet Protocol (IP) havecaught the headlines quite often in the past decadeand the importance of mobility and new mobile ser-vices is broadly understood. However, the primeenabler behind a lot of this development remains byand large invisible. The advent of optical fiber trans-mission in the networks has been the key enabler forthis evolution. The convergence between telecom anddatacom and the prevalence of IP in the networkwould simply not have been possible were it not forthe abundant transmission capacity the optical fiberprovides. The introduction of optical fiber in the mid80s increased the transmission capacity per linkfrom a max of 565 Mbit/s in copper wires to around1.5 Tbit/s in an optical fiber today, increasing thetotal bandwidth per cable by a factor of 3000 withintwenty years. At the same time the maximum trans-mission distance has been increased to several hun-dreds of kilometers from a couple of km in copperwires. It is fair to say that the optical fiber has revolu-tionized telecom networks and transformed telecom-munications to a sustainable business and a driver forthe information era.
The idea of transmitting high-capacity signals in theform of light pulses down hair-thin strands of glassmay have sounded somewhat spaced out once. It was
early realized that optical fiber has a tremendousbandwidth and that the main issue would be to findtechnically feasible and economical ways to capital-ize on this potential. Also the low electromagneticinterference of the medium makes it ideal for securecommunication – something that appealed in particu-lar to the defense industry that provided the vitalearly sponsoring of the field.
The impact optical fiber transmission has had on thenetwork is by and large well appreciated by telecomengineers, however, the technology is understandablyenough not quite known to the average user of tele-com services. This is bound to change dramatically inthe coming years when broadband connections usingfiber to the building or home become more common,a trend that is clearly already on its way.
Competition and changing telecomlandscapeThe convergence of voice services with data and mul-timedia services, mobility requirements, and the pres-ence of several competing players in the market haschanged the telecom landscape for good. This is a farcry from the monopoly years. We have entered an erawhere new paradigms are dominating corporate,social as well as private life and where datacom isbecoming an important part of our life. Despite someups and downs in the forecasts, the fact remains thatnetwork traffic has continued to increase with a stag-gering 115 % per year on a global basis in the pastyears. Voice traffic and the corresponding revenuesfall gradually but steadily and more and more ser-vices are delivered over IP. Data traffic surpassedvoice traffic in volume a while ago and data trafficdoes pose different requirements on network perfor-mance from what voice does. In contrast to trafficgenerated by telephony, data traffic patterns arehighly unpredictable, asymmetric in terms of loaddistribution, and bursty in nature. Convergence in theapplications front, the potential for more sophisti-
Optical networks: From point-to-point transmission to fullnetworking capabilities
E V I Z O U G A N E L I
Evi Zouganeli
is Senior
Research
Scientist at
Telenor R&D
Telektronikk 2.2005
Optical technology has led to an increase of the single cable transmission bandwidth by three orders
of magnitude in the past twenty years enabling high capacity IP networks and the start of the so-
called information era. Yet whereas optical transmission is a mature business, the potential of optical
networking is far from being exploited. Optical network functionality appears to be the answer to effi-
cient and reliable data-centric networks, a technology that complements IP. This article aims at giving
an overview of the driving forces behind optical networking, the potential offered by it, the challenges
encountered, and the current state-of-the-art.
ISSN 0085-7130 © Telenor ASA 2005

4 Telektronikk 2.2005
cated services and the requirement for tailored billingmechanisms in view of the expanding competition inthe liberalized telecom market, create a positive feed-back loop that further strengthens the requirement formore dynamic and flexible networks. In addition,because of the dramatic increase in the capacity car-ried by each cable (of the order of Tbit/s), it ismandatory to have reliable and fast ways to restorethe network in case of fiber cut or other failure and tobe able to prioritize traffic depending on the carriedservice. These call for new and improved ways tobuild our networks.
In the years of the telecom bubble an amazingamount of innovation was generated in the opticalspace with something like 600 start-up companiesworldwide. The demand for high performance highcapacity networks appeared to be pressing at thattime and a lot of development work needed to takeplace before we could enjoy the super-duper net-works that could support all these brand new serviceseveryone was expecting would emerge. Many of theissues that needed to be addressed in order to createrobust long-distance transparent and high capacitynetworks were addressed and to an extent solved inthe years of the bubble. Because of the large amountof money burned on optical network technologies, thebubble period stigmatized the optical field for a whileand discouraged investments further. However, onthe technical front, although clearly all problems arefar from solved, this innovation generated a greattechnical confidence in the field that came with betterknowledge of the potential as well as the limitationsof the technology.
In the meantime, in the quiet years that have fol-lowed, advancements in other areas and technologieshave clarified a number of issues that were unsettledsome years ago and that are determining factors forthe overall landscape with regard to services, market,competition and technological alternatives. Let ushave a brief overview of these in the following.
Broadband penetration
The main bottleneck in the network is in the accesspart. Ever higher capacity has been introduced in thetransport network with the use of wavelength multi-plexed systems combined with higher bit-rates perchannel. In the access part of the network on the otherhand, relatively low bandwidth was delivered to pri-vate customers until only a few years ago. The reasonfor this is that whereas transport network investmentsaddress a large number of subscribers, the investmentcost per subscriber associated with an upgrading ofthe access network is tremendous. When it comes toaccess bandwidth, the details have varied somewhatfrom continent to continent but the underlying situa-
tion has been somewhat similar everywhere: privateconsumers have had telephone lines at 64 kbit/s,internet via the telephone line or via ISDN (128kbit/s), and television via coax cable. This haschanged dramatically in the past five years or so, pri-marily with the introduction of ADSL (xDSL) accessbut also because of the deployment of a good deal ofFiber to the Home / Building (FttH/FttB) especiallyin Asia Pacific but also in the US and sporadicallyalso in Europe. The number of FttH subscribers inJapan has surpassed 4 millions (Q3 2005). NTT hasannounced investments of USD 47 billion in FttH intotal, aiming at 30 million Japanese homes passed by2010 [1].
Broadband adoption is surging throughout Europe aswell, however, there is still scope for growth in com-ing years. The total number of broadband access isexpected to quadruple [2] over the next five years.Heavy Reading projects that broadband subscribersin this region will grow from 38 million at the end of2004 to 128 million at the end of 2009, representing apenetration rate of 69 %. FttH is forecasted to grow to9 million subscribers worldwide in the next two years[3]. The main driver behind this evolution is triple-play services, i.e. integrated voice, data and video.This service requires an estimated 20 Mbit/s down-stream, whereas the upstream bandwidth is ratherlower, at least at first, due to the prevailing role ofxDSL in the broadband penetration globally. xDSL isan inherently asymmetric technology and its currentdominance is bound to have a determining effect onservice characteristics in the first years.
The high penetration of broadband access will have adramatic effect on the total traffic volume in our net-work as well as on the type of traffic generated, sincehigher bandwidth will not be consumed by morevoice but rather by a gradually and steadily decreas-ing percentage of voice traffic in the network.
Rationalized network architectures:
IP/MPLS prevalence and network
convergence
The way networks are built today is by no means effi-cient. In most current networks the SONET/SDH net-work infrastructure has provided a guaranteed levelof performance and reliability for voice calls andleased lines. Existing networks have been designedfor telephony and are thus adequate for handlingstatic traffic patterns but are rather inefficient in han-dling the new traffic patterns that are dominated bydata services. For historical reasons, most networkstoday comprise a number of layers as services havebeen based on ATM, SDH, or Ethernet (see Figure1). In addition, again due to legacy, many operatorsoperate more than one network, e.g. a separate circuit
ISSN 0085-7130 © Telenor ASA 2005
10 Telektronikk 2.2005
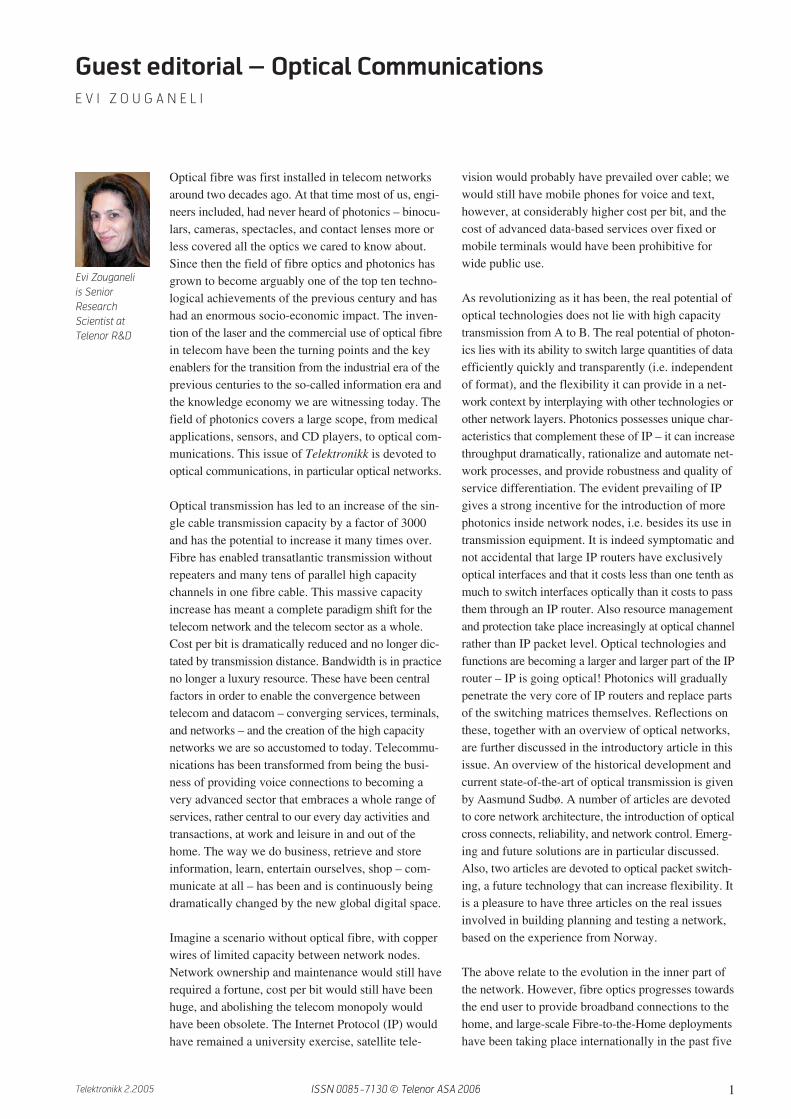
An OXC provides several key functions in a largenetwork [10]:
• Service provisioning
An OXC can be used to provide end-to-end lightpathsin a large network in an automated manner. Remotelyconfigurable OXCs allow re-configurability of thenetwork to respond to traffic changes. “Point-and-click” provisioning of optical channels (OCh’s) canbe achieved using OXCs. Bandwidth can be allocatedon-demand or “created” at the parts of the networkwhere it is required. Note that an OCh is not neces-sarily all-optical along the end-to-end link; neither isit necessarily one single wavelength along the wholelink.
• Protection and restoration
Protecting the network against fiber cuts or equip-ment failure at the node. The OXC combined withmonitoring equipment can provide swift restorationof huge amounts of traffic by redirecting wavelengthsfrom the failed paths to alternative paths. This func-tion may be complemented with wavelength con-version.
• Wavelength conversion
Lightpaths need not use one single wavelengththrough the whole network since this complicateswavelength management in the network. The possi-bility to implement a moderate degree of wavelengthconversion gives flexibility especially in dynamicnetworks. Wavelength conversion may be performedall-optically, e.g. using semiconductor amplifiers ina Mach-Zehnder interferometer [11], a system thatresults in 2R regeneration of the signal and is a popu-lar one. Another alternative is to use optoelectronicconversion and retransmit at a new wavelength,which has the advantage of fully regenerating the sig-nal but is rather expensive and currently has to takeplace per channel. The OXC is a natural location toperform wavelength conversion.
• Multiplexing and grooming
In its purest form the OXC is all-optical. However,the OXC comprises also an add-drop part where mul-tiplexing and grooming of ingress and egress signalscan take place.
OXCs are just emerging and currently relativelyexpensive network elements. The main systems usedtoday are opaque and employ an electrical core. Alarge number of alternative all-optical solutions havebeen explored, however, some time is still requiredbefore the winning technologies are identified andOXCs become mature, broadly-used systems. A verystraightforward way to realize an all-optical OXC isto use the well-known generic switch architectures,such as Clos or perfect Shuffle, and realize theseusing optical switches and fiber connections. Simi-larly, Broadcast-and-Select type switching matricescan be realized optically using semiconductor opticalamplifiers (SOAs) that block the signal when they areoff and let it pass through when they are on.
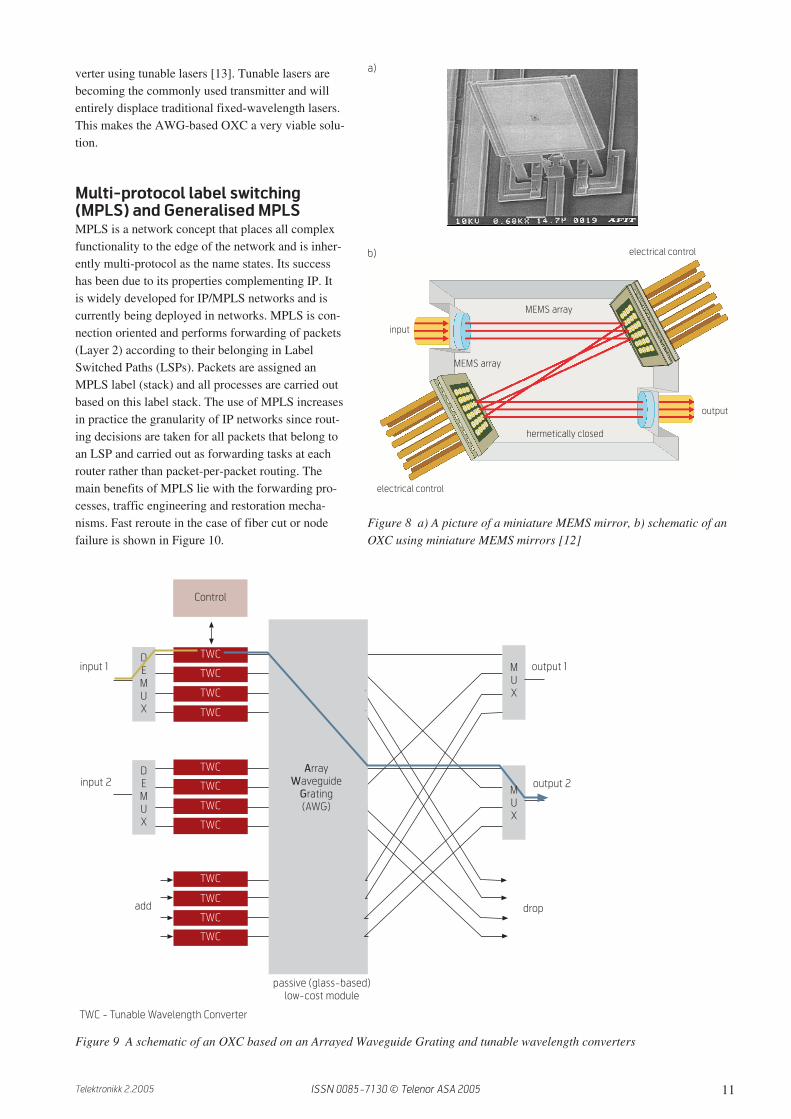
One of the most prominent OXC solutions is basedon a two-dimensional or three-dimensional array ofminiature mirrors (MEMS based) that measure only afew tens of µm width each. One such mirror and anOXC based on two arrays of MEMS mirrors areshown schematically in Figure 8 [12].
In recent years the advent of widely tunable lasers haspromoted a new OXC architecture that uses tunablelasers and Array Waveguide Gratings (AWG) asshown in Figure 9. The AWG is a mature componentthat is used to make optical multiplexers and de-mul-tiplexers. Its function is to provide “hard wired”wavelength dependent connections following a table.The port a signal will exit the OXC from, is explicitlydetermined by its wavelength and the AWG input itarrives at. Hence the OXC is re-configured by tuningthe wavelength of the signal in a wavelength con-
Figure 7 Schematic of an optical cross-connect; optoelectronic (top),all-optical (bottom)
input
input
transponder
OXC
Rx Rx Tx
Electrical
Cross
Connect
input
input
output
output
Rx
Rx
Rx
Rx
Tx
Tx
Tx
Tx
Opaque OXC
output
output
Transparent OXC
Tx
Electrical
Cross
Connect
add/drop
ISSN 0085-7130 © Telenor ASA 2005

11Telektronikk 2.2005
verter using tunable lasers [13]. Tunable lasers arebecoming the commonly used transmitter and willentirely displace traditional fixed-wavelength lasers.This makes the AWG-based OXC a very viable solu-tion.
Multi-protocol label switching(MPLS) and Generalised MPLSMPLS is a network concept that places all complexfunctionality to the edge of the network and is inher-ently multi-protocol as the name states. Its successhas been due to its properties complementing IP. Itis widely developed for IP/MPLS networks and iscurrently being deployed in networks. MPLS is con-nection oriented and performs forwarding of packets(Layer 2) according to their belonging in LabelSwitched Paths (LSPs). Packets are assigned anMPLS label (stack) and all processes are carried outbased on this label stack. The use of MPLS increasesin practice the granularity of IP networks since rout-ing decisions are taken for all packets that belong toan LSP and carried out as forwarding tasks at eachrouter rather than packet-per-packet routing. Themain benefits of MPLS lie with the forwarding pro-cesses, traffic engineering and restoration mecha-nisms. Fast reroute in the case of fiber cut or nodefailure is shown in Figure 10.
Figure 8 a) A picture of a miniature MEMS mirror, b) schematic of anOXC using miniature MEMS mirrors [12]
Figure 9 A schematic of an OXC based on an Arrayed Waveguide Grating and tunable wavelength converters
input
output
electrical control
electrical control
hermetically closed
MEMS array
MEMS array
a)
b)
D
E
M
U
X
Array
Waveguide
Grating
(AWG)
input 1
input 2
add drop
Control
passive (glass-based)
low-cost module
M
U
X
output 1
output 2
TWC
TWC
TWC
TWC
TWC
TWC
TWC
TWC
TWC
TWC
TWC
D
E
M
U
X
TWC - Tunable Wavelength Converter
M
U
X
TWC
ISSN 0085-7130 © Telenor ASA 2005
12 Telektronikk 2.2005
An extension of MPLS – Generalized MPLS(GMPLS) – has been proposed by IETF to includethe time and optical wavelength domains. The aim isto achieve a more flexible labelling and forwardingmechanism that uses a generalized label, which isapplicable to a variety of technologies and networks.For IP routers the labels designate principally inputand output ports. For an OXC they designate inputand output ports as well as wavelength, or band ofwavelengths. The hierarchy of different labels inGMPLS is schematically shown in Figure 11.
The main aims of GMPLS are to [14]:
• provide a framework for real time provisioning ofoptical channels;
• adopt optical technology and encompass the devel-opment and deployment of a new class of pro-grammable OXCs;
• allow the use of uniform semantics for networkcontrol in hybrid networks that consist of bothOXCs and label switching routers.
The impact of the introduction of GMPLS in the inte-gration of the IP and the optical layer is potentiallyhuge. GMPLS makes it possible for routers to “see”optical wavelengths and wavebands as manageableresources. One single forwarding decision may betaken for a whole wavelength or a whole set of wave-lengths that correspond to a large volume of packets.The whole forwarding process can be carried outmuch more efficiently and the throughput of the IPnetwork dramatically improved. It also makes senseto perform protection and restoration processesdirectly at optical level, either in a separate controlplane or directly by IP/GMPLS routers in a peer-to-peer architecture. These are discussed in a later sec-tion.
Why optical functionalityIn order to understand why it is important and advan-tageous with optical functionality, consider the fol-lowing. IP routers have now reached a processingcapacity of the order of 1 Tbit/s with several opticalinterfaces at 2.5 Gbit/s or 10 Gbit/s. IP packets aretypically between 300 and 1500 bytes. Hence a 1Tbit/s IP router processes 100 – 500 million IP pack-ets per second where packets undergo an opto-elec-tronic conversion at each node, their MPLS label isread and rewritten, and they are retransmitted (Figure12). The deployment of MPLS has providedIP/MPLS networks with two important features thatpure IP networks lack: forwarding capabilities at LSPlevel, and more efficient restoration using tunnelingtechniques in fast reroute. Fast reroute can attain arestored path within 50 ms. However, it would beinteresting to see how these things scale and how“fast” fast reroute actually is when network size andtraffic interest increase. After all even with its fasttunneling techniques, MPLS needs to process several1000s of LSPs in order to reroute the traffic in onefiber in a typical network.
These underline an emerging clear bottleneck in IP/MPLS networks. IP/MPLS routers have the wronggranularity to handle multi-Terabit networks and arenot scalable in a sustainable way. A router with320 Gbit switching capacity requires half an ETSIrack today. Larger matrices are realized by intercon-necting several racks to an electronic switchingmatrix using optical cables. Power dissipation percm3 makes further miniaturization of electronicsincreasingly challenging so that an infinite reductionof size to match increasing processing capacity willnot be possible. Optical technologies can eliminatethese bottlenecks. For example, multiplex sectionprotection in the optical layer, shown in Figure 13, iscarried out by rerouting a drastically reduced numberof LSPs as compared with Figure 10.
Figure 11 The hierarchy of labels that can be used inGMPLS
Figure 10 Fast reroute in MPLS requires rerouting of thousands ofLSPs in a typical network
R1 R2 R6 R7R5
R4R3
Time-
slot
Wave-
length
Band Fibre Bundle
ISSN 0085-7130 © Telenor ASA 2005
13Telektronikk 2.2005
A quick look at the cost of interfaces today underlinesthis trend rather clearly. The cheapest 10 Gbit/s inter-face is an Ethernet interface and it costs around USD50 – 70,000. A Packet over SONET 10 Gbit/s inter-face costs around four times that much. By contrast,the current price of optoelectronic OXCs is quotedper interface and lies at USD 6,000 per 10 Gbit/sport, which is at worst one tenth of the cost of thecorresponding IP interface. This can be interpreted tomean that the cross-over point for the introduction ofoptical cross connects today is when the traffic inter-est between node pairs in the network is around 1/10of the capacity of the optical channel, i.e. around 1Gbit/s. Upgrading costs and protection/restorationimprovements in an optically cross connected net-work favors optical networks and push the cross-overpoint even lower.
Network architecturesWith regard to architecture alternatives for an IP overoptical network, the determining aspect is whetherand to what degree the control plane of the opticalnetwork will be integrated with IP or independentfrom it. The IP and optical control planes can in otherwords be loosely or tightly coupled in terms of,firstly, the details of the optical network topology,resources, and routing information that is revealed tothe IP layer, and secondly, the degree of control IProuters have on optical network elements and thus thedegree to which they can determine the exact pathsthrough this optical network. Three architectureoptions can be identified from this point of view:
The overlay model
In this architecture option the optical network has fullcontrol over its network resources by means of a fullyindependent optical control plane. The AutomaticallySwitched Optical Network (ASON) has been pro-posed by ITU-T in accordance with the overlaymodel. A schematic of ASON is shown in Figure 14.All communication with client networks in an ASONis done via the User Network Interface (UNI) thatcarries all signaling information exchanged betweenASON and its clients as well as the actual signalstransported by the network (via the physical layerpart of the interface). The client networks request aconnection between two edge nodes, requesting alsoa set of quality related characteristics for this connec-
Figure 12 A schematic of the forwarding process inan IP/MPLS router
Figure 13 Multiplex section protection at the optical layer
point to point WDM
IP/MPLS
OEO
payload label
R1 R2 R6 R7R5
R4R3
OXC7OXC6
OXC4OXC3
OXC2OXC1 OXC5
Switch
OCC
Network
management
system
ASON control plane
Transport plane
user
signaling
clients
e.q. IP,
ATM,
TDM
NMI-T
clients
e.q. IP,
ATM,
TDM
NMI-A
E-NNI
I-NNIUNI
OCC OCC OCC
Switch Switch
Figure 14 A schematic of the Automatically Switched Optical Network,according to the overlay model
ISSN 0085-7130 © Telenor ASA 2005
14 Telektronikk 2.2005
tion. These characteristics do not only regard band-width but also e.g. delay, jitter, degree of protectionetc. The client networks have otherwise no controlover the exact routing and priority received within theoptical network. GMPLS is used in the separate con-trol plane.
ASON provides end-to-end OCh connections to itsclients with a certain QoS, as agreed via service levelagreements (SLA) with the client. These connectionscan be static, established via the management system,or dynamic. Three types of OCh services can be pro-vided: Permanent OCh connection, soft-permanentOCh connection, automatically switched OCh con-nection. The latter provides an end-to-end opticalchannel connection activated by direct signaling fromthe client network. Establishment and tear down ofthis service is handled automatically by the ASONcontrol plane and the client is notified accordingly.An extensive field trial of user controlled automati-cally switched connections has taken place and is upand running in Japan [15]. It is nonetheless unclearwhether this type of solution will prevail.
In the overlay model an “intelligent optical network”carries out part of the network functionality. Oneadvantage of this model is that it is a multi-clientsolution, which can accommodate technologies otherthan IP that many operators will need to relate to, atleast for a while. Separating the two control planesimplies also that the two parts may evolve, beadapted, and be optimised independently, which isa good future-proof policy. The optical network pro-vides here a universal platform that is not tied to onespecific protocol but is open to any future new-com-ers. The disadvantage of the overlay model, on theother hand, is that it requires the creation of a newcontrol plane that to an extent may duplicate func-tionality and may introduce delays – repeating whatis the old problem with layered networks. It can beexpected that as IP gradually displaces alternativetechnologies, the overlay architecture will at somepoint become an anachronism.
The peer model
In this architecture the control planes of the opticalnetwork and IP are fully integrated such that IProuters and optical switching nodes (OXCs) are
Figure 15 Schematic of a router with widely tunable wavelength interfaces and integrated OXC functionality using an Array Waveguide Grating and the arrangement in Figure 9
Control IP/MPLS
switch matrix
OXC
Rx Rx Rx Rx Rx Rx Rx Rx Tx Tx Tx Tx Tx Tx Tx Tx
input fibres
output fibres
I/O
interfaces
I/O
interfaces
I/O
interfaces
I/O
interfaces
Tx=tunable optical interfaces
ISSN 0085-7130 © Telenor ASA 2005

15Telektronikk 2.2005
peers. The two networks are merged into a new inte-grated network that is managed in a unified way sothat the optical network topology is fully visible torouters. A single protocol is run through all domainsand establishes paths through all network elementsin a seamless manner.
The view is to keep the optical part unintelligent andrely on IP intelligence to run the network. The advan-tage of this architecture stems exactly from the factthat it is IP-centric. The architecture is scalable, func-tionality is not duplicated and conflicts between sev-eral control planes do not arise. On the other hand,this architecture demands that information regardingthe optical network elements is advertised to routers,resulting in excessive information flows within thenetwork. Finally, this architecture is not inherentlymulti-client, an aspect that may be important forsome operators (e.g. incumbents). Despite its draw-backs, the peer-to-peer model may be the architecturethat will be adopted in the longer term since IPindeed is dominating the scene.
The advent of tunable lasers may promote the peermodel. As tunable lasers become more mature andcheaper, they are gradually and steadily replacing themost common fixed wavelength lasers – DFBs. IProuters use today 10 Gbit/s optical interfaces that arebound to be tunable lasers in the near future. As soonas tunable laser interfaces are introduced, it will bepossible to realize OXC functionality by adding anAWG at the output of the router as shown in Figure15 according to the arrangement in Figure 9. Wave-lengths are steered by the router using GMPLS andhence it may be most natural to employ a peer model.
QoS in optical networksAn optical network can provide service differentia-tion based upon a set of parameters – such as priority,delay, jitter, etc., as well as dependability aspects –following IP resource handling models [14]. The dif-ferent classes or bundles of classes are carried by thesame channel or set of channels. This way, differenti-ation can take place and be handled optically, withoutintervention or knowledge at the IP layer, makingsome processes – such as restoration – much simpler,swifter and more efficient.
Reference networkThe network can be seen as comprising three parts:The core and long-haul part, the metropolitan areanetwork, and the access part. Traditionally the corepart is a national network connecting major cities.The changes of the telecom landscape and increasedcompetition have given rise to both larger and smaller
core networks, e.g. extending a whole continent orproviding a backbone to a local mobile operator. Themetro network has emerged as an important part ofthe network in the past years. Typically, a metro net-work extends over a large city or a province, com-prises less aggregated traffic than the core as it iscloser to customers and end users, and involves lowercapacities than the core. Finally the access part is thepart that provides a connection between an end user(e.g. a home) or a business to the metro and core net-works.
Optical metro networksAs capacity increases, the role of the metro networkbecomes increasingly important. Metro networks arealso small arenas where newcomers can easier estab-lish themselves and where new technology can easierbe employed. This increases the dynamics in this partof the network and allows swifter changes. CWDMis broadly used in new metro deployments today,OADMs are quite common and R-OADMs startbeing deployed. Legacy metro networks have beenlayer upon layer of SDH rings. Some of these arebeing upgraded using NG-SDH, however, the trendtowards Ethernet based services promotes packet-based networks that are significantly more cost-effi-cient. The introduction of optical functionality in themetro area is rather evident.
Access bandwidth increases with the introduction ofbroadband to the home, storage applications, the useof IT by government, hospitals, universities, banksand businesses. In addition, there is an increasingnumber of public wireless access hot-spots. A metronetwork shall serve all these accesses and ideally pro-vide bandwidth on demand when required. It isexpected that automatic provisioning will be intro-duced in metro networks, at first controlled by themanagement system rather than via a UNI. A futureoptical metro network can provide flexible bandwidthallocation to a plethora of services and access tech-nologies and facilitate seamless mobility independentof access technology. Optical metro networks can e.g.provide feeder functionality to relatively simple wire-less antennas by centralizing processes, moving allintelligence to the central office and using RF overFiber techniques [16]. An example of a flexiblebroadband optical metro network is schematicallyshown in Figure 16 where different segments or ser-vices may be carried by different sets of wavelengthsand where QoS may make use of the optical wave-length domain. Optical metro networks may initiallybe ring based, however, mesh networks are to gradu-ally replace these, provided cost-efficient OXCs areavailable.
ISSN 0085-7130 © Telenor ASA 2005

16 Telektronikk 2.2005
Fiber in the accessFiber has just entered the private access space withFiber to the Home solutions in the past years, and isprogressing at high speeds. The drivers behind thisevolution are the success of triple play services com-bined with increased competition, an increasinglymaturing optical technology due to its broad applica-tion in other parts of the network, and the superiorityand futureproofness of Fiber-to-the-Home. The maincompeting technology in Europe is xDSL (VDSL,ADSL+2). However, the maximum reach of xDSLtechnology is an inversely quadratic function of thetransmitted bandwidth. Triple play services requirebandwidths of around 20 Mbit/s and above – a band-width that requires a fiber node closer to the sub-scriber (within 1 km for highly asymmetric VDSL at26 Mbit/s downstream and dramatically reduced forthe somewhat more symmetric varieties). At the sametime, fiber to the home terminals and solutions areavailable at a cost that is comparable to high capacityxDSL solutions (e.g. VDSL), and the cost of instal-ling fiber in green-field scenarios is equal to that ofinstalling VDSL. The main cost with FttH deploy-ments is associated with digging costs in order to putthe fiber in the ground. All in all fiber is still a costlyalternative for incumbent operators that need to tapout the value of their existing copper infrastructure.New installation techniques in existing pipes (e.g.blowing fiber cables) make fiber a much more realis-tic solution than it has been earlier. Also fiber canreduce operational costs (OpEx) considerably sinceit can allow passive networks as well as a reductionof the total number of central offices due to its longreach – passive optical networks (PON) with a reach
of 60 km are available (see articles on the access net-work in this issue). When OpEx savings are takeninto account the picture becomes brighter for FttH.
Strategic decisions regarding the technology shift tooptical fiber in the access need to be based on marketand competition dictated conditions. Given that triple-play services are taking off and given the bandwidth-distance product of xDSL, it becomes rather clear thatxDSL is not very far from the end of its lifecycle. Aplan for a gradual introduction of fiber should be atits place soon, also for incumbent operators. Indeed,the higher capacity and symmetric capabilities ofFttH grant it a significant competitive advantage.Upgrades will cost very little in the case of fiberwhile they will become more and more of a challengeand very costly for xDSL. These are illustrated inFigure 17. This means that incumbents ought to con-sider carefully the right timing for starting to intro-duce fiber in the access, to ensure that it does notbecome a disruptive technology in this part of the net-work. Due to the somewhat proprietary solutions inthe actual implementation of FttH solutions, customerchurn between FttH providers is very low. Also exist-ing access fiber investments create an entry barrierfor newcomers since they reduce the potential forhigh take-rates as well as limit margins and pricingoptions. Regulation regarding unbundling of the localloop is a main show-stopper for incumbents inEurope where FttH deployments happen more or lessexclusively by newcomers.
But isn’t the future wireless?Mobility in datacom is like color TV in broadcasting– once wireless mobility is experienced one can nevergo back to wire-line connections to phones and PCs.Fiber is a broadband access wire-line technology, sowhat is the future for fiber in the access? Mobile andwireless technologies suffer more or less inherentbandwidth limitations. Higher bandwidth per sub-scriber can be accomplished when wireless technolo-gies are employed in point-to-point directional con-nections – that do not offer mobility. High frequencyradio solutions will have higher bandwidth, however,wireless technologies provide relatively low band-width that shall be shared by many subscribers andare not the solution for the provision of triple playservices, neither will they be able to provide the highbandwidths required by businesses and the publicsector. The way to obtain both wireless access andhigh bandwidth is to bring the fiber closer to the loca-tion and then use wireless locally. Hence, although insome cases wireless and fiber solutions may be com-peting technologies in the access, especially in theshort term, in general the two technologies are com-
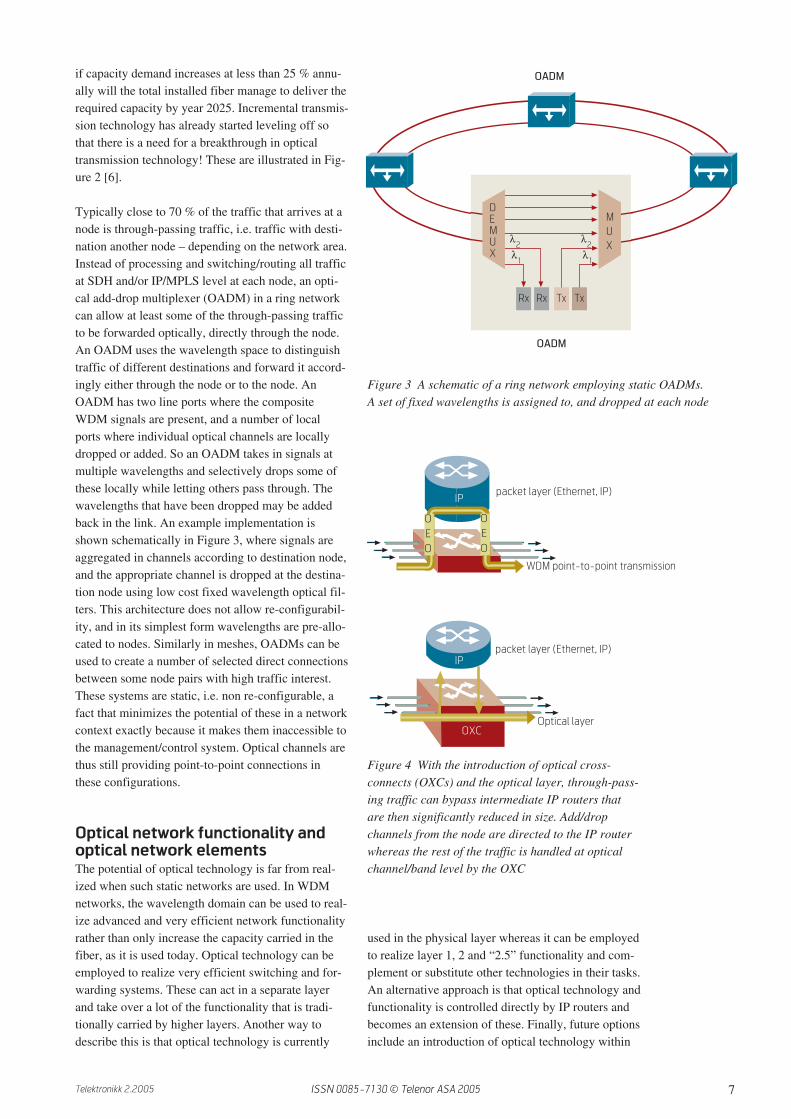
OADM
xDSL
FttH
Wireless
access
fibre to the
business
Hot spot
area
Figure 16 A flexible multi-service broadband optical metro networkthat provides seamless mobility between a number of access technolo-gies and bandwidth on demand
ISSN 0085-7130 © Telenor ASA 2005

17Telektronikk 2.2005
plementary and will in fact promote and facilitate thedeployment of one another.
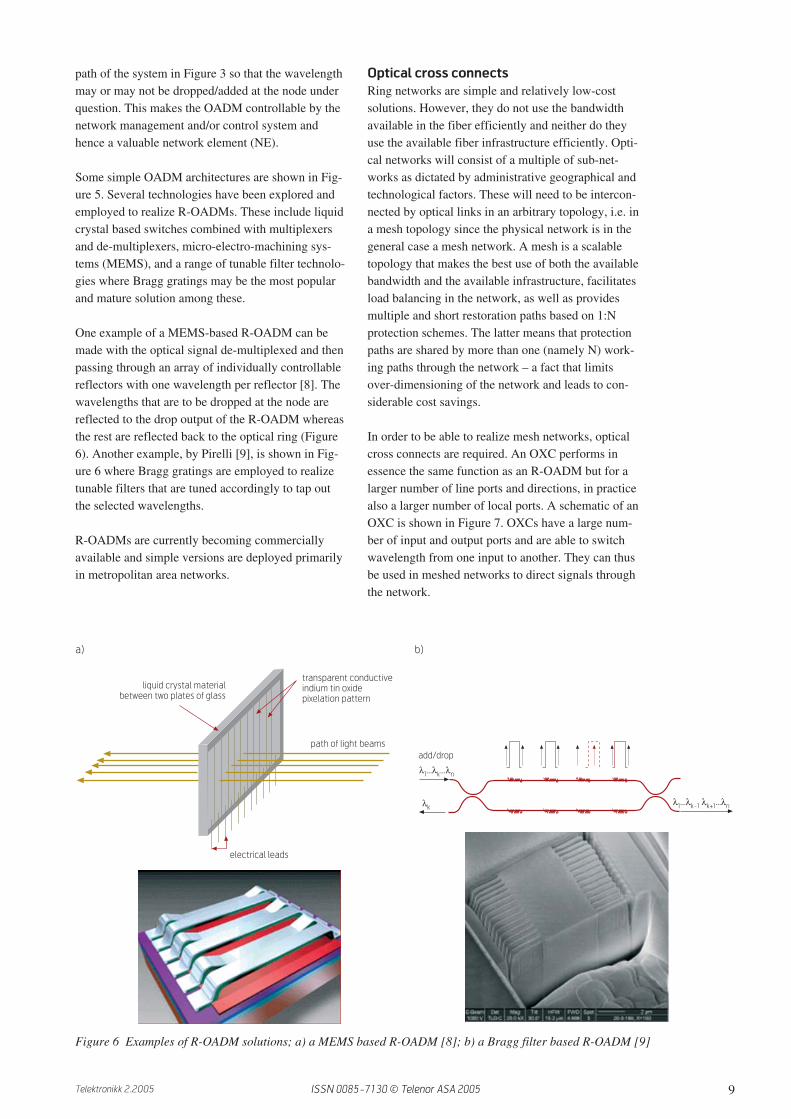
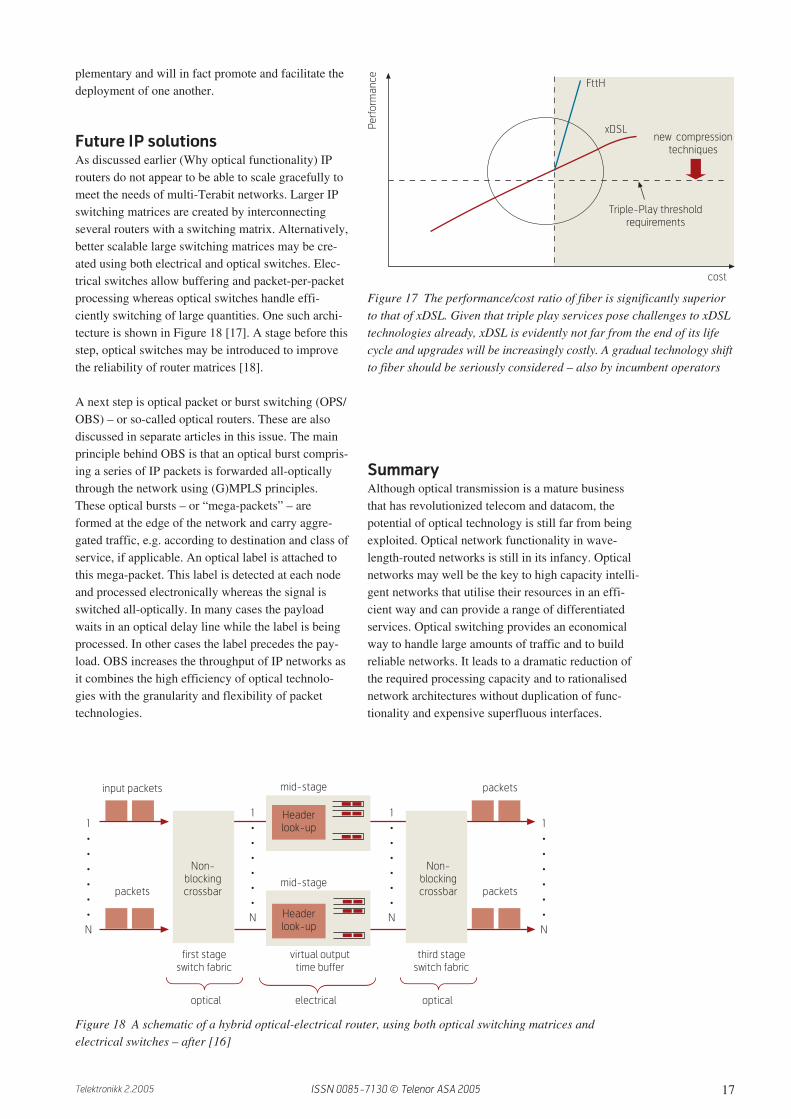
Future IP solutionsAs discussed earlier (Why optical functionality) IProuters do not appear to be able to scale gracefully tomeet the needs of multi-Terabit networks. Larger IPswitching matrices are created by interconnectingseveral routers with a switching matrix. Alternatively,better scalable large switching matrices may be cre-ated using both electrical and optical switches. Elec-trical switches allow buffering and packet-per-packetprocessing whereas optical switches handle effi-ciently switching of large quantities. One such archi-tecture is shown in Figure 18 [17]. A stage before thisstep, optical switches may be introduced to improvethe reliability of router matrices [18].
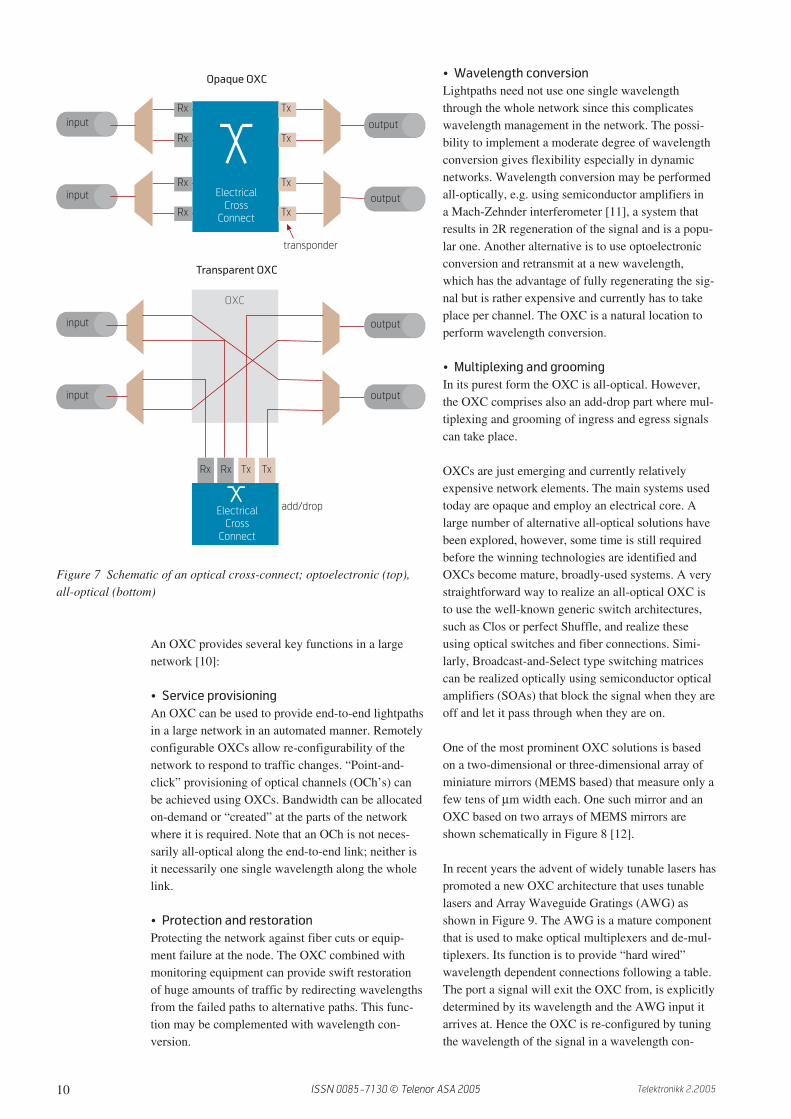
A next step is optical packet or burst switching (OPS/OBS) – or so-called optical routers. These are alsodiscussed in separate articles in this issue. The mainprinciple behind OBS is that an optical burst compris-ing a series of IP packets is forwarded all-opticallythrough the network using (G)MPLS principles.These optical bursts – or “mega-packets” – areformed at the edge of the network and carry aggre-gated traffic, e.g. according to destination and class ofservice, if applicable. An optical label is attached tothis mega-packet. This label is detected at each nodeand processed electronically whereas the signal isswitched all-optically. In many cases the payloadwaits in an optical delay line while the label is beingprocessed. In other cases the label precedes the pay-load. OBS increases the throughput of IP networks asit combines the high efficiency of optical technolo-gies with the granularity and flexibility of packettechnologies.
SummaryAlthough optical transmission is a mature businessthat has revolutionized telecom and datacom, thepotential of optical technology is still far from beingexploited. Optical network functionality in wave-length-routed networks is still in its infancy. Opticalnetworks may well be the key to high capacity intelli-gent networks that utilise their resources in an effi-cient way and can provide a range of differentiatedservices. Optical switching provides an economicalway to handle large amounts of traffic and to buildreliable networks. It leads to a dramatic reduction ofthe required processing capacity and to rationalisednetwork architectures without duplication of func-tionality and expensive superfluous interfaces.
Figure 17 The performance/cost ratio of fiber is significantly superiorto that of xDSL. Given that triple play services pose challenges to xDSLtechnologies already, xDSL is evidently not far from the end of its lifecycle and upgrades will be increasingly costly. A gradual technology shiftto fiber should be seriously considered – also by incumbent operators
Figure 18 A schematic of a hybrid optical-electrical router, using both optical switching matrices andelectrical switches – after [16]
Pe
rfo
rma
nc
e
cost
Triple-Play threshold
requirements
new compression
techniques
FttH
xDSL
input packets
packets
Non-
blocking
crossbar
first stage
switch fabric
mid-stage
Header
look-up
mid-stage
Header
look-up
Non-
blocking
crossbar packets
packets
third stage
switch fabric
optical opticalelectrical
virtual output
time buffer
1
•
•
•
•
•
•
N
1
•
•
•
•
•
•
N
1
•
•
•
•
•
•
N
1
•
•
•
•
•
•
N
ISSN 0085-7130 © Telenor ASA 2005

18 Telektronikk 2.2005
Optical functionality can be introduced at a separatelayer and complement higher network layers, and/orit can be directly integrated and controlled by IProuters. Optical technology can also be employed torealize larger/higher throughput and more robust IProuters. It is not easy to foresee at this point whichway things will evolve. The determining factors liefirstly with what is technologically a feasible andefficient solution but are also dictated by competitionand industry consolidation conditions.
The winning technologies, architectures, protocols,and overall solutions require some work before theyare more clearly identified. However, one reality israther clear: Optical network technologies and net-work functionality are complementary to IP/MPLSand bring unique features to IP networks that no othertechnological alternatives can provide. Optical net-work elements and functionality will be introducedin IP networks in the not so far future.
References1 Hagimoto, K. Terabit network revolution in
Japan. Invited presentation, European Conferenceon Optical Communication, ECOC 2005, Glas-gow, Sept 2005.
2 Heavy Reading. Next Generation Broadband inEurope: the need for Speed, 3 (5), March 2005.
3 Cahners in-Stat, RHK, Corning. Fiber to theHome Forecast. 2004. www.instat.com
4 Desurvire, E. Erbium Doped Fiber Amplifiers,Principles and Application. New York, John Wil-ley, 1994.
5 Bobbs, B, Goldstone, J A, Johnson M M. Phase-matched broadband Raman amplifier. IEEE JQuantum Electonics, 30 (8), 1896–1906, 1994.
6 Desurvire, E. Optical Communications in 2025.European Conference on Optical Communica-tion, ECOC 2005, Glasgow, Sept 2005.
7 Morthier, G, Mingshan, Z, Vanderhaegen, B,Baets, R. Experimental demonstration of an all-optical 2R regenerator with adjustable decisionthreshold and “true” regeneration characteristics.IEEE Photon. Tech. Lett., 12 (11), 1516–1518,2000.
8 Xtellus Dynamic Optics. December 21, 2005[online] – URL: http://www.xtellus.com
9 Tormen, M, Ghidini, S, Crespi, P, Nottola, D CA, Sardo, S, Crippa, D, Di Muri, M, Zuliani, G,Giacometti, F. Randomly Sampled Apodizationin Bragg Gratings. Submitted for publication inIEEE J Lightwave Tech., Oct 2005.
10 Ramaswani, R, Sivarajan, K N. Optical Networks– a practical perspective. Second edition. MorganKaufman publishers, 2002.
11 Durhuus, T et al. All-optical wavelength conver-sion by semiconductor optical amplifiers. IEEE/OSA JLT/SAC, 14 (6), 942–954, 1996. (Specialissue on multi-wavelength optical technology andnetworks)
12 Lucent-Optical. December 21, 2005 [online] –URL: www.lucent-optical.com
13 Broberg, B, Rigole, P J, Nilsson, S, Andersson, L,Renlund, M. Widely tunable semiconductor lasers.Optical Fiber Communication Conference 1999,OFC 99, 21–26 Feb 1999.
14 Vigoureux, M, Berde, B, Andersson, L, Cinkler,T, Levrau, L, Fdez-Palacios, J, Jaeger, M. Multi-layer traffic engineering for GMPLS-enabled net-works. IEEE Communications Magazine, July2005, 44–55.
15 Otani, T. Nationwide field trial of GMPLS opticalnetworking. European Conference on Optical Com-munication, ECOC 2005, Glasgow, Sept 2005.
16 Koonen, T et al. Novel Cost-Efficient Techniquesfor Microwave Signal Delivery in Fibre-WirelessNetworks. Proc. ECOC 2004, Stockholm,September 5–9, 2004.
Figure 19 A schematic of an OBS router where opti-cal packets are forwarded all-optically whereas theoptical label is processed electronically at each node
WDM
OPS/ OBS
electrical label
processing
IP packet
optical burst of packets
label
ISSN 0085-7130 © Telenor ASA 2005

19Telektronikk 2.2005
17 Neilson, D T et al. Fully provisioned 112x112micro-mechanical optical cross-connect with 35.8Tb/s demonstrated capacity. Proceedings OpticalFiber Communication Conference, OFC 2000,post deadline paper, 204–206.
18 McKeown, N. Scaling routers using optics. Euro-pean Conference on Optical Communication,ECOC 2003, Rimini, Italy, Sept 2003.
For a presentation of Evi Zouganeli, please turn to page 2.
ISSN 0085-7130 © Telenor ASA 2005
20 Telektronikk 2.2005
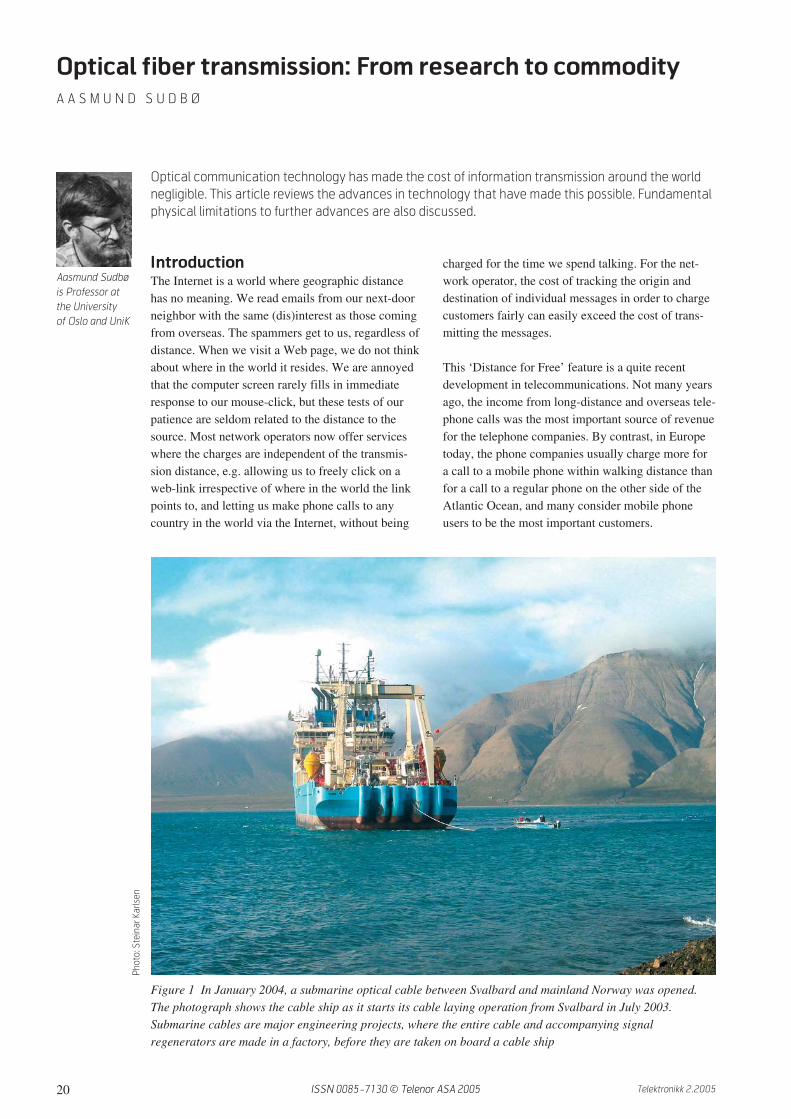
IntroductionThe Internet is a world where geographic distancehas no meaning. We read emails from our next-doorneighbor with the same (dis)interest as those comingfrom overseas. The spammers get to us, regardless ofdistance. When we visit a Web page, we do not thinkabout where in the world it resides. We are annoyedthat the computer screen rarely fills in immediateresponse to our mouse-click, but these tests of ourpatience are seldom related to the distance to thesource. Most network operators now offer serviceswhere the charges are independent of the transmis-sion distance, e.g. allowing us to freely click on aweb-link irrespective of where in the world the linkpoints to, and letting us make phone calls to anycountry in the world via the Internet, without being
charged for the time we spend talking. For the net-work operator, the cost of tracking the origin anddestination of individual messages in order to chargecustomers fairly can easily exceed the cost of trans-mitting the messages.
This ‘Distance for Free’ feature is a quite recentdevelopment in telecommunications. Not many yearsago, the income from long-distance and overseas tele-phone calls was the most important source of revenuefor the telephone companies. By contrast, in Europetoday, the phone companies usually charge more fora call to a mobile phone within walking distance thanfor a call to a regular phone on the other side of theAtlantic Ocean, and many consider mobile phoneusers to be the most important customers.
Optical fiber transmission: From research to commodity
A A S M U N D S U D B Ø
Aasmund Sudbø
is Professor at
the University
of Oslo and UniK
Optical communication technology has made the cost of information transmission around the world
negligible. This article reviews the advances in technology that have made this possible. Fundamental
physical limitations to further advances are also discussed.
Figure 1 In January 2004, a submarine optical cable between Svalbard and mainland Norway was opened.The photograph shows the cable ship as it starts its cable laying operation from Svalbard in July 2003.Submarine cables are major engineering projects, where the entire cable and accompanying signalregenerators are made in a factory, before they are taken on board a cable ship
Ph
oto
: S
tein
ar
Ka
rlse
n
ISSN 0085-7130 © Telenor ASA 2005

21Telektronikk 2.2005
In our everyday life, we depend on numerous flowsof bits, ones and zeros, to enable mobile phone con-versations, to play music on MP3 players, to down-load text and images from the Internet, or to enjoydigital satellite TV. Whenever these bits need to betransmitted more than a few hundred meters alonga cable, optical fibers are now used, unless copperwires happen to be in place. The reason is that a fibercan handle a much higher bit rate, i.e. the number ofbits transmitted per second. Different services needdifferent bit rates, and the bit rate needed for TV ismore than a factor 100 greater than that for speech.
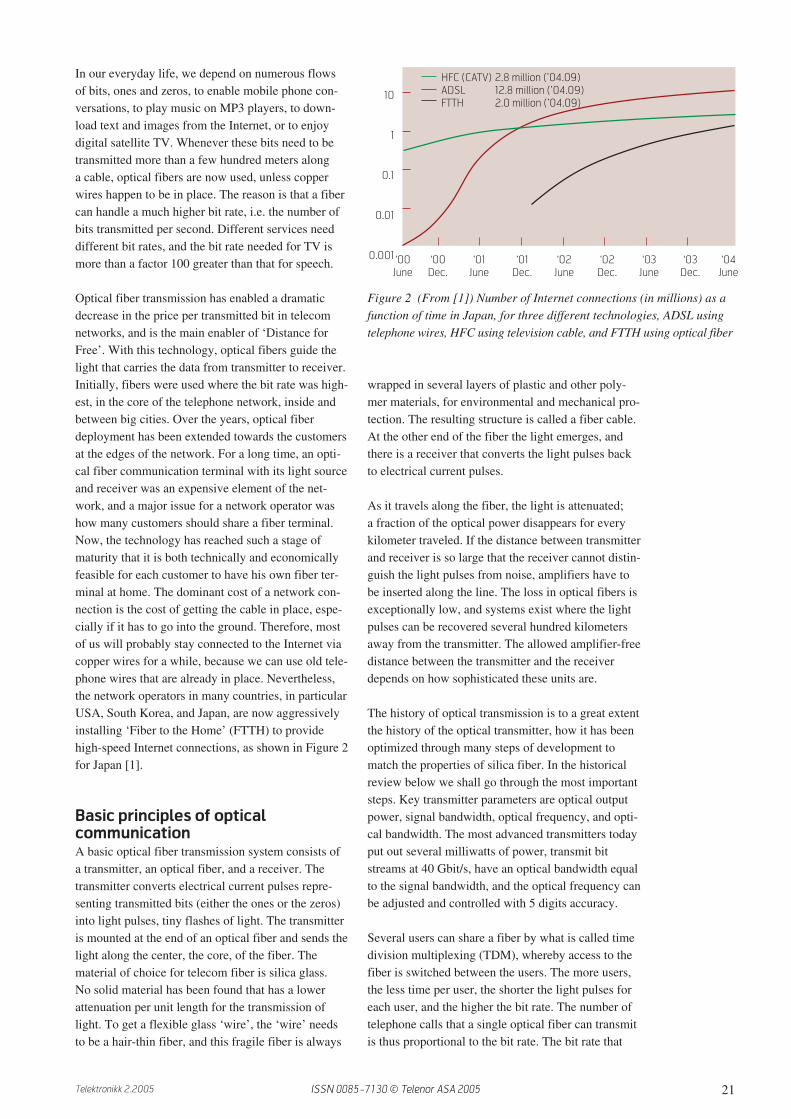
Optical fiber transmission has enabled a dramaticdecrease in the price per transmitted bit in telecomnetworks, and is the main enabler of ‘Distance forFree’. With this technology, optical fibers guide thelight that carries the data from transmitter to receiver.Initially, fibers were used where the bit rate was high-est, in the core of the telephone network, inside andbetween big cities. Over the years, optical fiberdeployment has been extended towards the customersat the edges of the network. For a long time, an opti-cal fiber communication terminal with its light sourceand receiver was an expensive element of the net-work, and a major issue for a network operator washow many customers should share a fiber terminal.Now, the technology has reached such a stage ofmaturity that it is both technically and economicallyfeasible for each customer to have his own fiber ter-minal at home. The dominant cost of a network con-nection is the cost of getting the cable in place, espe-cially if it has to go into the ground. Therefore, mostof us will probably stay connected to the Internet viacopper wires for a while, because we can use old tele-phone wires that are already in place. Nevertheless,the network operators in many countries, in particularUSA, South Korea, and Japan, are now aggressivelyinstalling ‘Fiber to the Home’ (FTTH) to providehigh-speed Internet connections, as shown in Figure 2for Japan [1].
Basic principles of opticalcommunicationA basic optical fiber transmission system consists ofa transmitter, an optical fiber, and a receiver. Thetransmitter converts electrical current pulses repre-senting transmitted bits (either the ones or the zeros)into light pulses, tiny flashes of light. The transmitteris mounted at the end of an optical fiber and sends thelight along the center, the core, of the fiber. Thematerial of choice for telecom fiber is silica glass.No solid material has been found that has a lowerattenuation per unit length for the transmission oflight. To get a flexible glass ‘wire’, the ‘wire’ needsto be a hair-thin fiber, and this fragile fiber is always
wrapped in several layers of plastic and other poly-mer materials, for environmental and mechanical pro-tection. The resulting structure is called a fiber cable.At the other end of the fiber the light emerges, andthere is a receiver that converts the light pulses backto electrical current pulses.
As it travels along the fiber, the light is attenuated;a fraction of the optical power disappears for everykilometer traveled. If the distance between transmitterand receiver is so large that the receiver cannot distin-guish the light pulses from noise, amplifiers have tobe inserted along the line. The loss in optical fibers isexceptionally low, and systems exist where the lightpulses can be recovered several hundred kilometersaway from the transmitter. The allowed amplifier-freedistance between the transmitter and the receiverdepends on how sophisticated these units are.
The history of optical transmission is to a great extentthe history of the optical transmitter, how it has beenoptimized through many steps of development tomatch the properties of silica fiber. In the historicalreview below we shall go through the most importantsteps. Key transmitter parameters are optical outputpower, signal bandwidth, optical frequency, and opti-cal bandwidth. The most advanced transmitters todayput out several milliwatts of power, transmit bitstreams at 40 Gbit/s, have an optical bandwidth equalto the signal bandwidth, and the optical frequency canbe adjusted and controlled with 5 digits accuracy.
Several users can share a fiber by what is called timedivision multiplexing (TDM), whereby access to thefiber is switched between the users. The more users,the less time per user, the shorter the light pulses foreach user, and the higher the bit rate. The number oftelephone calls that a single optical fiber can transmitis thus proportional to the bit rate. The bit rate that
Figure 2 (From [1]) Number of Internet connections (in millions) as afunction of time in Japan, for three different technologies, ADSL usingtelephone wires, HFC using television cable, and FTTH using optical fiber
10
1
0.1
0.01
0.001
HFC (CATV) 2.8 million (’04.09)
ADSL 12.8 million (’04.09)
FTTH 2.0 million (’04.09)
‘00
June
‘00
Dec.
‘01
June
‘01
Dec.
‘02
June
‘02
Dec.
‘03
June
‘03
Dec.
‘04
June
ISSN 0085-7130 © Telenor ASA 2005

22 Telektronikk 2.2005
can be achieved is limited by what electronics canpractically handle, typically 10 Gbit/s today.
One very important contribution of optics to commu-nication technology is a way to have different signalscarried by different optical frequencies on a singlefiber. This way of combining optical signals is calledwavelength division multiplexing (WDM)1). WDMtechnology allows tens of bit streams, each at10 Gbit/s, to be carried by a single fiber. Each signalis assigned its own frequency interval, what is calleda WDM channel. The International Telecommunica-tion Union (ITU-T) has standardized channel centerfrequencies that are integer multiples of 50 GHz(0.4 nm), and systems with 100 GHz (0.8 nm) chan-nel separation are common today. The center or car-rier frequency of a transmitter depends on tempera-ture, and 50 GHz channel separation is so small thattransmitters with temperature control are required.We therefore speak of DWDM, dense WDM, asopposed to CWDM, coarse WDM, where the channelseparation is so large that very inexpensive transmit-ters without temperature control can be used. ForCWDM, a channel separation of about 2.5 THz(20 nm) between channels is standard.
The success of DWDM depends on the existenceof an optical amplifier, where the incoming light isamplified directly and not converted into an electricalcurrent, and where all the DWDM channels in a fibercan be amplified in parallel in a single amplifier.
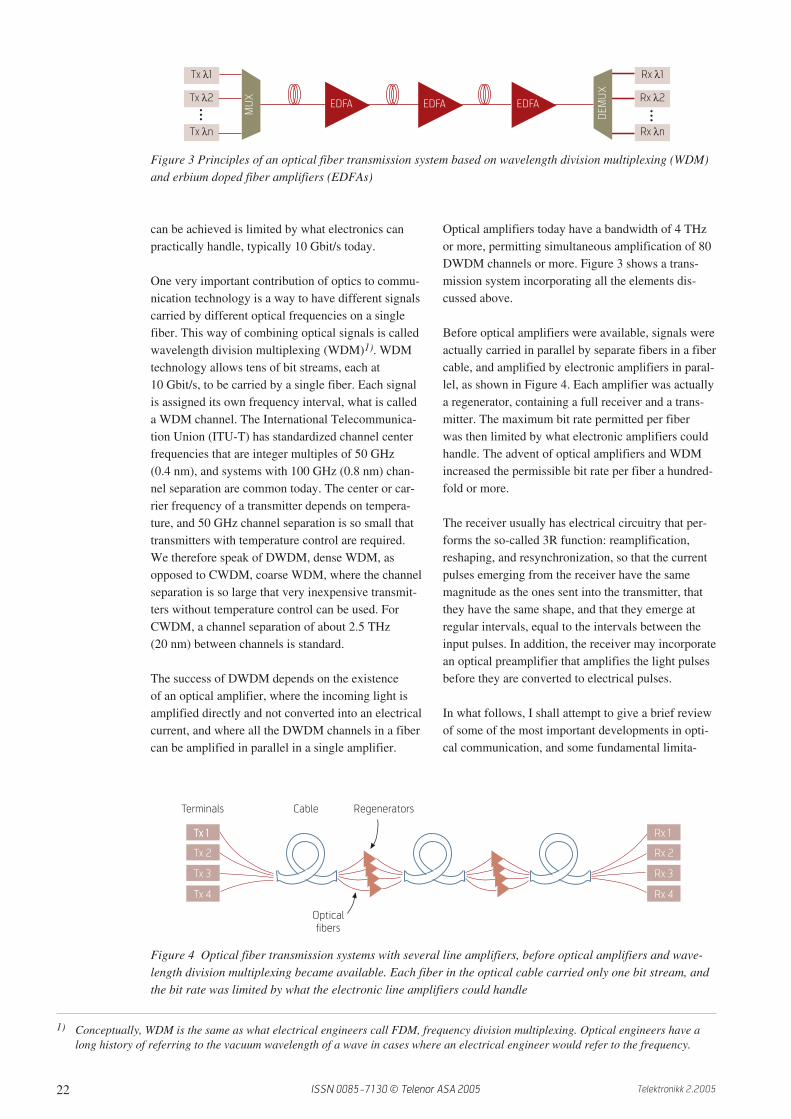
Optical amplifiers today have a bandwidth of 4 THzor more, permitting simultaneous amplification of 80DWDM channels or more. Figure 3 shows a trans-mission system incorporating all the elements dis-cussed above.
Before optical amplifiers were available, signals wereactually carried in parallel by separate fibers in a fibercable, and amplified by electronic amplifiers in paral-lel, as shown in Figure 4. Each amplifier was actuallya regenerator, containing a full receiver and a trans-mitter. The maximum bit rate permitted per fiberwas then limited by what electronic amplifiers couldhandle. The advent of optical amplifiers and WDMincreased the permissible bit rate per fiber a hundred-fold or more.
The receiver usually has electrical circuitry that per-forms the so-called 3R function: reamplification,reshaping, and resynchronization, so that the currentpulses emerging from the receiver have the samemagnitude as the ones sent into the transmitter, thatthey have the same shape, and that they emerge atregular intervals, equal to the intervals between theinput pulses. In addition, the receiver may incorporatean optical preamplifier that amplifies the light pulsesbefore they are converted to electrical pulses.
In what follows, I shall attempt to give a brief reviewof some of the most important developments in opti-cal communication, and some fundamental limita-
Figure 3 Principles of an optical fiber transmission system based on wavelength division multiplexing (WDM)and erbium doped fiber amplifiers (EDFAs)
Figure 4 Optical fiber transmission systems with several line amplifiers, before optical amplifiers and wave-length division multiplexing became available. Each fiber in the optical cable carried only one bit stream, andthe bit rate was limited by what the electronic line amplifiers could handle
1) Conceptually, WDM is the same as what electrical engineers call FDM, frequency division multiplexing. Optical engineers have along history of referring to the vacuum wavelength of a wave in cases where an electrical engineer would refer to the frequency.
Tx λ1
Tx λ2
Tx λn
EFDA EFDA EFDA
Rx λ1
Rx λ2
Rx λn
•••
•••
MU
X
DE
MU
X
EDFA EDFA EDFA
Terminals Cable Regenerators
Optical
fibers
Tx 1Tx 1
Tx 2
Tx 3
Tx 4
Rx 1
Rx 2
Rx 3
Rx 4
ISSN 0085-7130 © Telenor ASA 2005
23Telektronikk 2.2005
tions. This is a tutorial review, not a literature review.The interested reader is referred to the many excellentbooks on the subject, a few of which are listed in thebibliography. A lot of material can also be found inthe proceedings from a variety of scientific confer-ences. For more than 30 years, many of the mostimportant developments in the field have beenreported at the annual European Conference on Opti-cal Communication (ECOC) and the Optical FiberCommunication Conference (OFC) in the USA.
Historical developmentThis historical review emphasizes practical problemsthat telecom engineers struggled with at the time, andhow optical fiber communication (fibercom) technol-ogy helped solve many of these problems. Fibercomtechnology is the result of the concerted effort of alarge international community of scientists and engi-neers, initially working in the research laboratoriesof the large telecom network operators around theworld, and later also in the laboratories of the telecomequipment manufacturers. Funding for the develop-ment of this technology was made possible by largerevenues for the network operators from long-dis-tance phone calls. This source of revenue is rapidlydisappearing for the network operators, ironically,because fibercom technology has made dramaticprice reductions for long-distance calls possible.
The idea of optical fiber communication was con-ceived in 1966, with the suggestion that glass fiberscould be used for signal transmission in the telephonenetwork [2],[3]. At that time, the world already had asingle large telephone network where it was possibleto place a call between any two phones on the globe,and traffic was increasing steadily. Both frequencydomain and time domain multiplexing were in useas means of having many telephone calls sharing asingle line.
Used for signal transmission, electrical lines have theproblem that as frequency increases, the signal lossper length of line increases, and the distance betweenamplifiers along the line has to be reduced. Larger-diameter lines can have lower loss, but bulky linesare no less expensive than many amplifiers. To thetelephone network planners in 1966 it looked likeelectrical lines carrying telephone traffic betweencities would require major investments.
Attenuation in optical fiber
The original idea in 1966 was to combine glass fibersfor signal transmission with light emitting diodes aslight sources, and silicon photodiodes for receivingthe light [2],[3]. Light sources and receivers wereavailable at the time, but the available glass material
was not suitable, having too much loss. Loss is quan-tified by the attenuation coefficient, the relativereduction in optical power per length traveled. High-quality glass at the time had an attenuation coefficientof several thousand dB/km, whereas telecom engi-neers required an attenuation coefficient of less than20 dB/km, before they would be interested in glassfibers for signal transmission.
Glass scientists knew that the problem was in theimpurities, and that a sufficiently pure glass wouldhave the desired properties. After 4 years, scientistsworking for Corning Glass in the USA in 1970reported fabrication of the desired optical fibers withan attenuation coefficient less than 20 dB/km. Thefiber material was synthetic silica (chemical name:silicon dioxide), a chemical compound occurring innatural rock as the mineral quartz.
The fiber designers knew that to achieve such a lowloss, the light in the fiber must be kept away from thefiber surface. Because light tends to stay where therefractive index is the highest, this was achievedthrough control of the refractive index or dielectricconstant in the fiber. At the center of the fiber, inwhat is called the core of the fiber, the refractiveindex is higher than in the surrounding cladding.Most of the light is confined in the core, with thelight intensity in the cladding decreasing exponen-tially with the distance from the center. The refractiveindex depends on the glass composition, and there aremany materials that can be added to silica to changethe refractive index without affecting the attenuationcoefficient significantly.
Figure 5 A telecom fiber is a thread of glass, slightlythicker than a human hair. The beam of invisibleinfrared light guided along the center of the threadhas a diameter of 0.01 mm
ISSN 0085-7130 © Telenor ASA 2005
24 Telektronikk 2.2005
A modern telecom fiber usually has an outer diameterof 125 µm, and a lightguiding core with a diameterof 10 µm (Figure 5). Industrial standards for opticalfibers and cables have been worked out, most of themby The International Telecommunication Union(ITU-T). The standard for the most common telecomfiber type is [4].
Longyearbyen,
Svalbard
Andøya,
Breivika. The 10
Gb/s signal from
Harstad is fed into
the fibre pairs in
the wet plant. DC
power is also fed
from Breivika.
The wet plant. The sub sea cable with 20
repeaters, one approx. every 67 km.
Segment 1: 1375 km
Segment 2: 1339 km
Segment 1A: 61 km
Segment 2A: 74 km
Harstad
STM-1 –10
Gb/s
Figure 7 (From [6]) Outline of the fiber cable installation thatconnects Svalbard to the mainland
Figure 8 (From [6]) Structure of the submarine cable connectingSvalbard to the mainland. In contrast, indoor optical cable typicallycontains one single optical fiber inside a soft plastic tubing with anouter diameter of about 2 mm
Optical fibers
in a soft gel
Polymer tube
8 ultra-high-strength steel wires
1.88 mm diameter
Water-blocking material
in steel interstices
16 ultra-high-strength steel wires
8 wires: 1.76 mm diameter
8 wires: 1.36 mm diameter
Circumferentially alternating
OD - 9.47 mm
Copper sheath
OD - 10.4 mm
Medium density
Polyethylene insulation
OD - 21.0 mmm
OD = Outer diameter
Figure 6 (From [6]) Two separate optical cablesconnect Svalbard to mainland Norway
The attenuation coefficient in pure silica decreasessteadily as the wavelength increases from the visiblerange into the infrared. The first sources for opticalcommunication had a wavelength of about 900 nm,corresponding to a frequency of about 330 THz. Atthis wavelength, the attenuation coefficient is about2 dB/km, whereas it is less than 0.5 dB/km at1300 nm, and has a minimum less than 0.2 dB/kmnear 1550 nm. The effect of impurities on fiber atten-uation is greater for the longer wavelengths, however,and in the first fibers the attenuation increased withincreasing wavelength. Improvements in fiber fabri-cation methods gradually eliminated all contributionsto fiber attenuation from undesired impurities in thesilica glass material, and optical fibers with an attenu-ation coefficient less than 0.2 dB/km at 1550 nm arenow standard. The lowest reported coefficient is0.16 dB/km [5], in a fiber with a pure-silica core.
There is a very important commercial application forlow-loss fibers, namely transoceanic cables. Suchcables typically consist of more than a hundred iden-tical cable sections, each terminated in a signal regen-erator station designed to rest with the cable on theocean floor. The cost of the regenerators represents asignificant contribution to the cable system cost, andthe number of regenerators needed is inversely pro-portional to the attenuation coefficient, because thereis a maximum total attenuation permitted betweenregenerators, determining the maximum permitteddistance between them. Transoceanic cables aremajor engineering projects, where the entire cableand accompanying regenerators are made in a fac-tory, before it is taken on board a cable-laying shiplike the one shown in Figure 1. The first transatlanticoptical cable came in 19882). A state-of-the-art sub-marine optical cable, installed between Norway and
2) The first transatlantic cable was a telegraph cable that went into service already in 1868 [7].
ISSN 0085-7130 © Telenor ASA 2005
25Telektronikk 2.2005
the arctic island of Spitsbergen in the fall of 2003, isdescribed in [6]. The installation consists of twocables running separate routes along the ocean floor,
metal
insulator
per type semiconductor
optically active semiconductor
per type semiconductor
semiconductor substrate
lens
Current
leadDiode laser
Focused
light
beam
Fiber core
Optical fiber
p-type semiconductor
n-type semiconductor
Figure 10 a) Cross sectional structure of a typical semiconductor diode laser, seen from the light-emitting end.b) Mounting of the laser with electrical leads for driving current, and with a lens for coupling light from thelaser into the 10-µm-diameter core of a single-mode fiber. The diode laser itself is a small grain of semi-conductor, less than 1 mm in size, and the light is generated in a microscopic rod inside the grain with typicaldimensions 0.1 µm by 1 µm by 300 µm
a)
b)
Cable to repeater
couplingRepeater end
cover
Repeater
137 cm (54”)
33 cm
(13”)
Figure 9 (From [6]) Submarine optical repeater used for he Svalbard cable, weighing 750 kg. By comparison, an optical transceiver designed for indoor use and the same bit rate (10 Gbit/s) is small and lightweight, much smaller than a matchbox
as shown in Figures 6 and 7. The structure used formost of the cable is outlined in Figure 8, and a sub-marine amplifier housing is shown in Figure 9.
ISSN 0085-7130 © Telenor ASA 2005

26 Telektronikk 2.2005
3) In the year 2000, the Nobel Prize in physics was awarded to Zhores Alferov, Herbert Kroemer, and Jack Kilby. Alferov and Kroemerwere credited for their role in developing diode lasers for optical fiber communications [8][9]. Kilby was credited with giving us theintegrated electronic circuit (IC), a very far-reaching contribution. ICs are everywhere, in every electronic device we use in our dailylife, including the transmitters and receivers for optical fiber transmission.
Figure 11 Dispersion makes the different frequencycomponents of a ‘one’ bit travel with different speeds inthe fiber. Each bicycle rider in the figure represents afrequency component, and different colors representdifferent frequencies, with correspondingly differentspeeds (from [10])
Line input tLine output t
Each channel
spectrum has a
finite width
Different wavelenth
components travel at
different group
velocities
Pulses spread
owing to chromatic
dispersion
(e.g. D>0)
‘1’
Chromatic
dispersion
Sources
The first light sources used for optical fiber commu-nication were light emitting diodes (LEDs) made ofthe material gallium arsenide, similar to the LEDscommonly used today in remote controls for TV setsand the like. The first diode lasers suitable as sourcesfor optical communication were demonstrated in19703) and exhibited a number of very desirableproperties:
a efficient conversion of electrical power to opticalpower;
b being a point-like source, allowing almost all emit-ted power to be coupled into the optical fiber;
c providing an optical wave with a well-definedamplitude, frequency, and phase (in other words,what is called coherent source);
d easy control of the wave amplitude, frequency, andphase via the drive current;
e rapid response of the amplitude, frequency andphase to variations in the drive current.
These are all properties that distinguish diode lasersfrom LEDs (see Figure 10).
The first diode lasers were made of the material gal-lium arsenide. Lasers made of this material cannotemit the wavelengths around 1550 nm needed toexploit the low attenuation of silica fiber. To developsources and detectors with the required wavelengths,an entirely new semiconductor material was needed.The first material that met the requirements consistsof the elements indium, gallium, arsenic, and phos-phorous, and is called InGaAsP. The development ofthis material is one of the major milestones in thedevelopment of optical communication.
Pulse broadening and dispersion
In general, the light pulses that travel along opticalfibers must be considered as having several compo-nents traveling at different speeds in the fiber, so thatthe pulses broaden as they travel. When the bit rate ishigh, the light pulses that represent bits are short, andlittle pulse broadening is allowed before succeedingpulses start to overlap (Figure 11 and Figure 12).
One pulse broadening mechanism is called multimodedistortion, whereby rays traveling in different direc-tions relative to the fiber axis have different speedsalong the fiber. We distinguish between singlemodeand multimode fibers. In singlemode fibers, there isonly a single allowed direction for light rays in thecore, parallel to the fiber axis. A multimode fiber, bycontrast, is a fiber where several ray directions areallowed. Multimode fibers have larger core diametersthan the 10 µm typical of a singlemode fiber. There isa significant cost associated with mechanical assem-bly of parts with the positional accuracy required bysinglemode fiber. Initially, therefore, multimode fiberswith larger cores were developed and standardized foroptical communication. Today, much higher bit rates
1 0 1 1 0
1
0
1
0.5
0
opening
time
threshold
Bit sequence
Ideal
representation
real
representation
Figure 12 Top: Squarewave pulses representing the bit sequence‘10110’. Bottom: Corresponding pulse shapes obtained after somepulse broadening in an optical fiber. The bit sequence is recovered bymeasurements at regular intervals of the pulse height relative to athreshold
wavelength
Real
ISSN 0085-7130 © Telenor ASA 2005
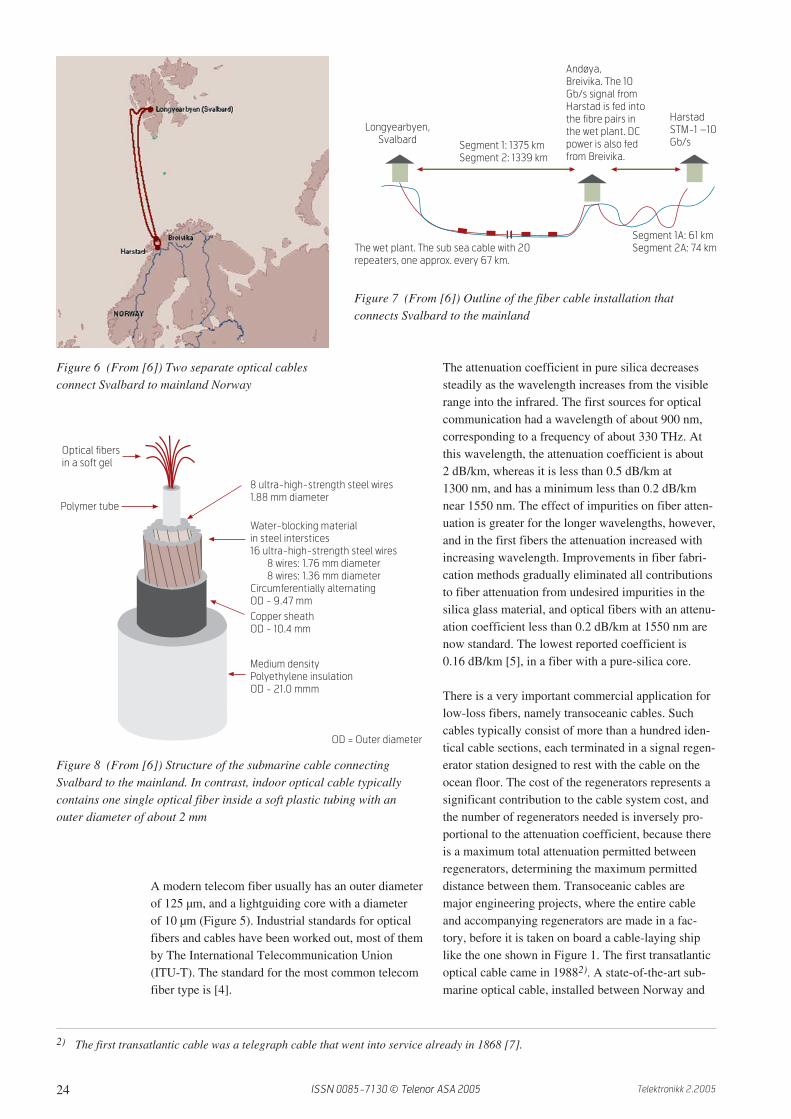
27Telektronikk 2.2005
are common, and the pulse broadening in multimodefiber is so severe that this type of fiber is now onlyused for very short distances, mostly indoor.
The most important pulse broadening mechanism ina singlemode fiber is dispersion, whereby light waveswith different frequencies have different speeds in thefiber (see Figure 10). A diode laser has inherently aspread of frequencies (optical bandwidth) that is pro-portional to the bit rate of the emitted signal4), so thatthe pulse broadening is proportional to the bit rate.
In the silica material that telecom fiber is made of, thedispersion vanishes at a frequency of about 230 THz,corresponding to a vacuum wavelength of 1300 nm.A source with a wavelength near 1300 nm is highlydesirable, to eliminate pulse broadening from disper-sion in singlemode fibers. The gallium arsenide mate-rial that was first used yields sources that emit wave-lengths around 900 nm, and cannot emit near 1300 nm.
Historically, the development of the new materialInGaAsP for the light source was spurred more by adesire to reduce the problems of dispersion than bya desire to have lower fiber attenuation. 1300 nm isnow a commonly used wavelength in optical trans-mission systems over distances of up to a few tens ofkilometers. The step from 900 nm to 1300 nm wave-length was a difficult one to complete, requiringdevelopment of a new material for sources and detec-tors. The step from 1300 to 1550 nm wavelengthcame later, and represented less of a challenge. Thesame standard fiber [4] is used at both wavelengths,and the InGaAsP material can provide sources andreceivers both at 1300 nm and 1550 nm wavelength.
The introduction of 1550 nm as an operating wave-length reintroduced dispersion as a problem. It is pos-sible, however, to move the zero-dispersion wave-length in single-mode silica fiber from 1300 nm to1550 nm, by increasing the difference in index ofrefraction between core and cladding while decreas-ing the fiber core diameter. For a few years, this dis-persion-shifted type of fiber was the most commontype installed in the network, especially in submarinecables. When WDM technology was introduced,however, fibers with vanishing dispersion turnedfrom an asset to a liability for the network operators(see below).
The pulse broadening induced by dispersion in a fibercan be reversed if the pulse is sent through a secondfiber with dispersion of the opposite sign, and a suit-able length. Today, such dispersion compensators are
standard, made from specially designed dispersionshifted fiber.
Polarization
Light has a polarization, meaning that there is a fieldvector direction associated with an optical wave,perpendicular to the direction of propagation. In anoptical fiber in a cable, the polarization changes ran-domly along the fiber. Furthermore, normal cablemovements induced by changing weather conditionsand temperature are sufficient to change the outputpolarization completely, even if the input polarizationis stable. So in general, the polarization of lightemerging from an optical fiber is unpredictable.Therefore, components for optical fiber communica-tion must be polarization-insensitive.
For a given input polarization, the output polarizationfrom an optical fiber will in general depend on opticalfrequency. If the frequency dependence of the outputpolarization is so strong that the output polarizationis significantly different for the different frequencycomponents of the signal, we have to consider a pulsebroadening mechanism called polarization mode dis-persion (PMD). The PMD in installed optical fibershas always been so low that it did not represent aproblem until the bit rate 10 Gbit/s appeared in thenetwork. Cable manufacturers now routinely delivercable where the PMD is so low that operation at40 Gbit/s is guaranteed, but much of the older cablecannot be used with 40 Gbit/s, and some cables alsohave trouble with 10 Gbit/s [11].
Optical amplifiers
In an optical amplifier, the incoming light is ampli-fied directly. 1550 nm, the wavelength of minimumattenuation in optical fibers, happens to be a wave-length for which an excellent optical amplifier canbe built. Of particular importance is the fact that theamplifier may be realized as an optical fiber with asmall concentration of erbium atoms in the core. Theerbium doped fiber amplifier (EDFA), first demon-strated in 1987 [12], [13], was one of the most signif-icant developments in the history of optical fibercommunications. This optical amplifier exhibits anumber of very attractive properties for optical fibercommunication, such as
a. polarization independence;b. linear response;c. an amplifier bandwidth of 4 THz;d. ideal noise performance;e. being a silica fiber, easy to connect to transmission
fibers;
4) The constant of proportionality between bandwidth and bit rate is of the order of one, and it can be reduced with careful engineering.
ISSN 0085-7130 © Telenor ASA 2005

28 Telektronikk 2.2005
f. being driven by a diode laser very similar to thesources used for optical transmission.
Diode lasers similar to the ones used as opticalsources can also serve as optical amplifiers, but theyare not suitable as amplifiers along an optical fibertransmission line, because they are polarization-dependent and nonlinear.
An alternative to the EDFA is the fiber Raman ampli-fier (FRA). Both amplifier types use diode lasers aspump lasers, i.e. input power to the amplifiers5). TheFRA does not need a special fiber like the EDFA, thetransmission fiber can be used for amplification. TheFRA pump laser is typically mounted in front of thereceiver or regenerator, sending pump light along thetransmission fiber towards the source, resulting inamplification of the incoming light before it reachesthe receiver, and permitting the distance betweensource and receiver to be increased, compared to a
system with an EDFA. The FRA is a truly distributedamplifier, having the gain distributed along severalkilometers of transmission fiber. An EDFA, by con-trast, is a few meters of fiber just in front of thereceiver, by comparison a lumped amplifier. Figure13 shows the distribution of optical power betweentransmitter and receiver for the two types of ampli-fiers.
Whereas electronics today can provide an amplifierbandwidth of a few tens of GHz, the EDFA provides4 THz of bandwidth in a single amplifier, allowingmany wavelength division multiplexed (WDM) chan-nels to be amplified with a single amplifier. Opticalfilters are needed in WDM to assemble optical waveswith different frequencies in one fiber and separatethem again at the end of the fiber. An optical filterindustry existed long before optical communication,and was ready to provide filters for WDM as soon asthe EDFA came on stage.
Sources for wavelength division
multiplexing (WDM)
Before WDM was introduced, the key output para-meter of the optical source was optical power. WithWDM, the spectral properties are equally important.The center frequency has to be accurately locked toone of the allowed output frequencies. The center fre-quency of a diode laser depends on temperature, sotemperature stability is needed in WDM sources. Theoutput power has to be kept within a well-definedspectral band around the center frequency, and theoutput in other parts of the spectrum has to be sup-pressed.
The first WDM sources had fixed center frequencies,so that for example a 40-channel WDM system had40 transmitters that were distinct and could not beinterchanged. Some WDM source suppliers havenow started to offer general purpose tunable sources,having an adjustable center frequency. These sourcesincorporate special diode lasers6) with several controlcurrents in addition to the one controlling the outputpower [14]–[16]. An example is shown in Figure 14.The first application of these tunable sources is as all-purpose spares for fixed-frequency sources.
An important application of tunable lasers is forswitching, where several output fibers exist for eachinput signal, and where the output fiber is selected bythe carrier frequency of the signal. The simplest opti-
5) Before the advent of the EDFA, the FRA was considered the most promising optical amplifier for fiber communication applications.An FRA needs at least ten times more pump power than an EDFA, however, and the high pump power required by an FRA is a majordisadvantage.
6) Even though the center frequency does depend on temperature, the temperature sensitivity is not sufficient to permit the frequency tobe controlled by temperature, considering that the entire 4 THz bandwidth of an EDFA must be covered.
Figure 13 Optical power as a function of distancealong an optical fiber transmission line, for adistributed fiber Raman amplifier (FRA) and for anerbium doped fiber amplifier (EDFA). The two casesshown have the same minimum optical power andhence approximately the same signal-to-noise ratio(SNR) after the amplifiers. Evidently, the FRA allowsthe greater spacing between amplifiers. (See thesection about quantum noise for an explanation ofSNR)
Raman pump
EFDA EFDA EFDAa)
b)
a)
b)
Noise floor
Nonlinearities
Lo
g o
f p
ow
er
Raman pumpRaman pump
EDFA EDFA EDFA
ISSN 0085-7130 © Telenor ASA 2005
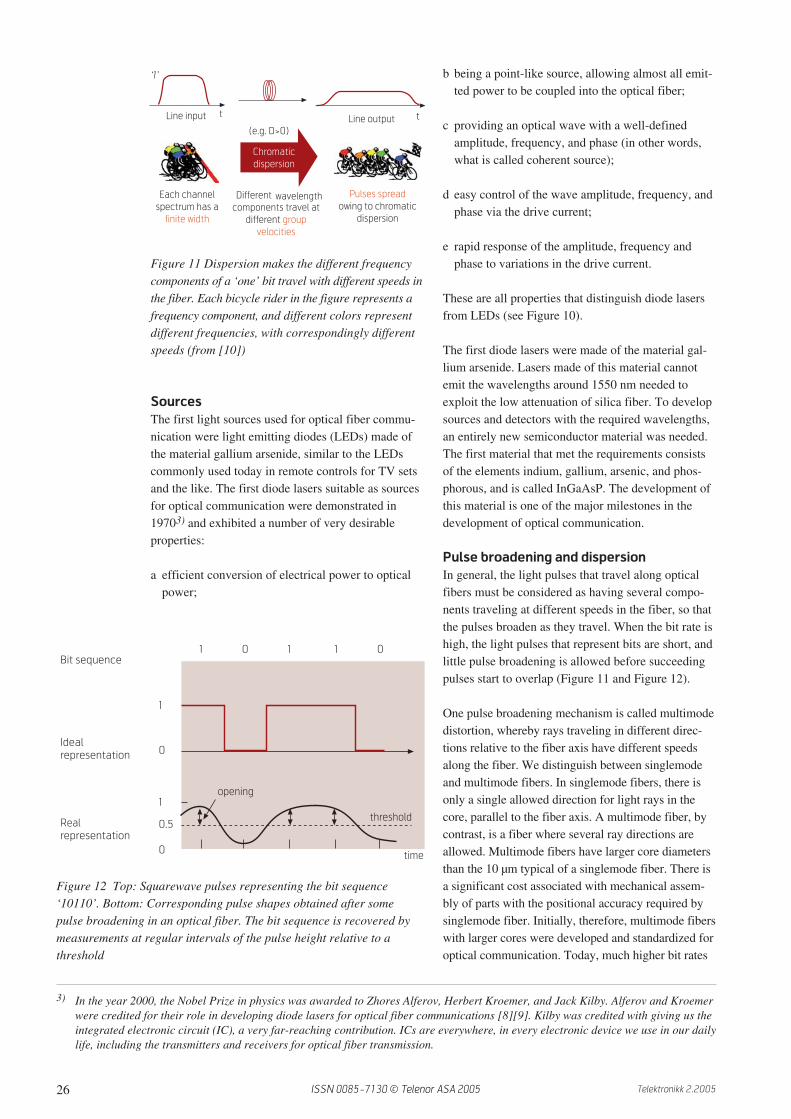
29Telektronikk 2.2005
cal switch of this kind is a single tunable lasertogether with a standard demultiplexer (see Figure 3)for WDM. Tunable lasers offer two important fea-tures: They are fast, and a single laser can switchbetween many outputs. There is at the moment noother optical switching technology that features thiscombination. The application of tunable diode lasersto switching has been an active research area inrecent years, also in Norway [17], [18].
Fiber nonlinearities
With the optical power in the fiber highly concen-trated in a core with 10 µm diameter, a few milliwattsof power is sufficient for optical pulses to be distortedby nonlinear processes in the fiber, i.e. processeswhereby the light emerging from the fiber has fre-quency components different from those that wentinto the fiber. Such processes are in general detrimen-tal to signal transmission in the fiber7). The nonlin-early generated optical power is proportional to thesquare of the transmitted power (as long as the gener-ated power is much smaller than the transmitted one),so the ratio between the generated and the transmittedpowers increases with transmitted power.
The nonlinear process most easily observed in opticalfibers is stimulated Brillouin scattering. It has thestriking effect that almost all of the light sent intothe fiber is reflected back to the sender if the opticalpower exceeds a threshold. The threshold is lowestfor narrowband light, having a bandwidth of less thanabout 100 MHz. The threshold is inversely propor-tional to the optical bandwidth, so stimulated Bril-louin scattering can be suppressed by having a suffi-cient WDM channel bandwidth well above 100 MHz.
Several nonlinear processes lead to cross-talk be-tween WDM channels. Given that the signals in thedifferent WDM channels are uncorrelated, the cross-talk from the other WDM channels appears as ran-dom noise in each channel. This noise grows sorapidly with increasing channel power that it puts alimit on the channel power, where a further increasein the power results in a reduced signal-to-noise ratio(SNR) in the receiver.
The dispersion-shifted fiber that was deployed exten-sively for single-channel systems at 1550 nm, suffersso severely from cross-talk that this type of fiber canin general not transmit more than one WDM channel.Fiber dispersion reduces the nonlinear cross-talkbetween WDM channels, however, and the olderfiber [4] originally designed for use at 1300 nm has
turned out to be quite well suited for upgrades involv-ing a transition from a single channel to severalWDM channels around 1550 nm. In this wavelengthregion the fiber has the dispersion needed to suppressthe nonlinear WDM channel cross-talk. Single modefibers that were installed in the telecom network morethan 15 years ago can still be used with new fiber ter-minals, even though the bit rate, the operating wave-length, and the number of WDM channels all havechanged over the years.
In general, nonlinear signal distortions tend to accu-mulate through optical amplifiers. This statementholds for self-induced signal distortions in eachWDM channel as well as for WDM channel cross-talk. Hence, for an optical transmission line with sev-eral amplifiers, nonlinear optical processes put a limiton the amplifier output power that is inversely pro-portional to the number of optical amplifiers alongthe line.
The accumulation of noise and nonlinear distortionsthrough optical amplifiers limits the distance that asubmarine cable can reach if it incorporates only opti-cal amplifiers and no regenerators. The maximumdistance that systems designers find when they pulltape measures around the globe in search of thelongest submarine cable routes between the cities ofthe world is 10,000 km. Considerable effort has beenmade by the submarine cable industry to designregenerator-free WDM transmission systems capableof such a reach. Present-day conference contributionsreport on how to achieve this target by combining allthe engineering tricks discussed in this article, andmore.
7) Nonlinear optical processes in the fiber can also be exploited together with dispersion to improve signal transmission, in particularin so-called soliton transmission systems.
Front
facet
Gain Phase
MMI
Right reflector
Left reflector
Figure 14 Top view of a rapidly tuneable laser with four independentdrive currents: Output power (Gain), length (Phase) adjustment, leftand right reflectors. MMI: Y coupler based on multimode interference.Each reflector is a modulated Bragg grating, and a change in eitherreflector current results in a change in the output frequency. Adaptedfrom [15]
ISSN 0085-7130 © Telenor ASA 2005

30 Telektronikk 2.2005
Fundamental limitationsIn the development of optical communication, engi-neers have encountered a number of fundamentalphysical limits to technology development. The firstlimit, reached about 20 years ago, was the silicamaterial attenuation coefficient. The attenuation incommercially available optical fiber at 1550 nm isnow as low as the silica material permits. Over theyears, a significant research effort has gone into asearch for a fiber material with a lower attenuationcoefficient than the 0.16 dB/km of silica, without anysuccess. It seems that we will have to settle for silicafiber for optical communication in the telecom net-work for the foreseeable future.
The most promising alternative to solid silica so far ishollow silica, where the light travels in holes runningalong the fiber instead of in the silica glass material.Hollow-core fibers with an attenuation coefficientbelow 1 dB/km have recently been fabricated [19].Further work on this fiber type will certainly decreasethe attenuation, but it is still an open question if theattenuation coefficient can be pushed below the0.16 dB/km of solid silica.
Quantum noise
Optical power does not flow continuously, but asparticle-like photons. The energy of each photon isinversely proportional to the wavelength, and equal to1.28 . 10-19 J = 0.128 aJ for the 1550 nm wavelength.The flow of optical power in an optical fiber is a ran-dom flow of photons. The attenuation in the fiberyields a flow that exhibits shot noise and is veryaccurately modeled by Poisson statistics, and the sig-nal-to-noise ratio (SNR) is then equal to the numberof photons per bit. Several photons are required torepresent the presence of a pulse of light with a rea-sonable certainty, and the standard definition of ‘rea-sonable certainty’ in optical communication is withan error probability of less than 10-12, requiring onaverage 27 photons per light pulse. So the quantumnature of light implies that an optical receiver needsa minimum number of photons per bit to distinguishbetween zeros and ones. In other words, the powerthat the receiver needs (the receiver sensitivity) isproportional to the bit rate.
The signal-to-noise ratio (SNR) from any opticalfiber transmission line can never be greater than thatgiven by the shot noise at the point along the linewhere the transmitted power is at a minimum. Typi-cally, there will be one single minimum, usually justbefore an EDFA, that dominates the noise. If thereis a distributed Raman amplifier along the line, thenoise-determining minimum is a few kilometers fromthe pump laser, as shown in Figure 13. Transoceanicsubmarine transmission lines usually consist of many
identical amplifier units connected by identical cablesections, and then there is more than one power mini-mum that contributes to the noise at the end of the line.
To detect low-power optical signals, an opticalpreamplifier (usually an EDFA) is incorporated intothe receiver. The laws of physics require an EDFA toadd noise, an amount at least equal to the shot noise.Raman amplifiers have the same limitation. This is aserious problem for transoceanic optical transmission,where the signal typically has to go through morethan 100 submarine amplifiers to reach the shore, andwhere each stage adds noise. The signal-to-noise ratioat the end of an optical transmission line is inverselyproportional to the number of optical amplifiers alongthe line, and this limits how far an optical signal canbe sent with the help of EDFAs. Nevertheless, thereare now several transatlantic optical cables in opera-tion with WDM transmission and EDFAs.
It is possible to build an optical amplifier with lessnoise than an EDFA, but only if the amplifier is madesensitive to the phase of the optical wave. Suchamplifiers have been realized, but they are finickylaboratory animals not suitable for ocean floor instal-lations [20].
Information theory
With clever engineering, the number of photons perbit required by the receiver can be reduced from theestimate given above. According to the informationtheory of Shannon [21], [22], [23], the maximum bitrate that a receiver can detect is proportional to thesignal bandwidth, and the constant of proportionalityis given by the signal-to-noise ratio. For a shot-noise-limited optical signal the signal-to-noise ratio is equalto the number of photons per bit. Information theoryallows optical receivers to operate with as little as 1photon per bit, for a receiver bandwidth equal to thebit rate [21], [22]. To approach this limit, one has tocode the bits using phase shifts of the optical wave[22], [24] and use error-correcting coding (ECC)[25], [23].
Figure 15 illustrates how bit errors can occur in adigital receiver when the signal-to-noise ratio is toosmall. Bit errors can be corrected with error-correct-ing coding (ECC), a highly developed engineeringtool with a wide range of applications in computersand communication. The basic idea in error correct-ing coding is that a longer bit sequence is used to rep-resent a shorter bit sequence, so that many differentlonger bit patterns are permitted representations ofthe same shorter bit pattern. Then, the shorter bit pat-tern can be recovered from the longer one, even if itcontains a few corrupted bits. Sensitivities within afraction of a dB from the information-theoretical limit
ISSN 0085-7130 © Telenor ASA 2005

31Telektronikk 2.2005
have been realized experimentally for wireless RFcommunication systems incorporating ECC, and opti-cal communication systems are not far behind [26].
Nonlinear processes
The signal-to-noise ratio can be increased by anincrease in the transmitted optical power. We are notfree to increase this power, however, because of thenonlinear effects in optical fibers. With clever engi-neering we can reduce the nonlinear WDM channelcross-talk, but we are still left with the nonlinear in-channel pulse distortion that puts a limit on the chan-nel power that can be launched into an optical fiber.
Furthermore, there is stimulated Raman scattering inthe fiber, a nonlinear process whereby optical poweris transferred from short-wavelength channels tolong-wavelength channels. As already discussed, thisprocess can be exploited in fiber Raman amplifiers.On the other hand, the process puts a limit on thetotal power in all the WDM channels in the fiber,a limit that is inversely proportional to the opticalbandwidth occupied by the channels. This limit ismore important than the limit on single-channelpower, for systems with tens of WDM channelsspread over the gain bandwidth of the EDFA.
It is the nonlinear properties of silica that matters. Sil-ica is the material of choice for optical telecom fibers,because it has the lowest attenuation coefficient of allknown materials. It is actually a very linear optical
material, and there are very few engineering tricksthat can be used to reduce the nonlinear signal distor-tion in optical fibers. One thing that can be done isto reduce the light intensity, by increasing the area ofthe fiber core where the light propagates. Increasingthe core area without increasing the fiber attenuationcoefficient is not straightforward, however [5]. Avery promising recent development is the low-lossfiber reported in [19], a hollow-silica fiber type hav-ing an optical nonlinearity orders of magnitudesmaller than standard silica fiber.
Concluding remarksAlmost all of the cities of the world are now con-nected by optical fiber cable, and in Norway we alldepend on optical fibers in our everyday life. Opticalfiber transmission has dramatically lowered the costof sending bits around the world, to the extent that thecost of tracking the bit streams and billing individualsenders can easily exceed the cost of actually trans-mitting the bits, regardless of their destination.
Telecom fibers have turned out to have a service lifeand upgrade potentials far beyond the wildest hopesof the original fiber designers, and optical fiber cableshave proven to be a very valuable long-term invest-ment for most network operators. On the one hand,optical communication is a mature field in telecomengineering. On the other hand, the exploitation ofinstalled optical fibers for steadily growing bit rates
Figure 15 Phase coded digital signal with noise. The coding shown is called quadrature phase shift keying(QPSK). Each dot in the two diagrams represents a measurement of the amplitude and phase of the wave at thereceiver, plotted in polar coordinates. Each dot represents two sent bits, with the dot color representing thesent bit values: red = 11, black = 10, green = 00, and blue = 01. The difference between the left and right dia-grams is a factor of ten in signal-to-noise ratio. A measurement result outside the quadrant where it belongsrepresents a bit error in the receiver. Whereas the measurements cluster nicely together and no bit errors canbe seen when the signal-to-noise ratio is large (left), bit errors occur when the signal-to-noise ratio is small(right). (The figure shows results of computer simulations, not actual measurements)
-2 -1 0 1 2
-1.5
-1
-0.5
0
0.5
1
1.5
2
-2
-2 -1 0 1 2
-1.5
-1
-0.5
0
0.5
1
1.5
2
ISSN 0085-7130 © Telenor ASA 2005
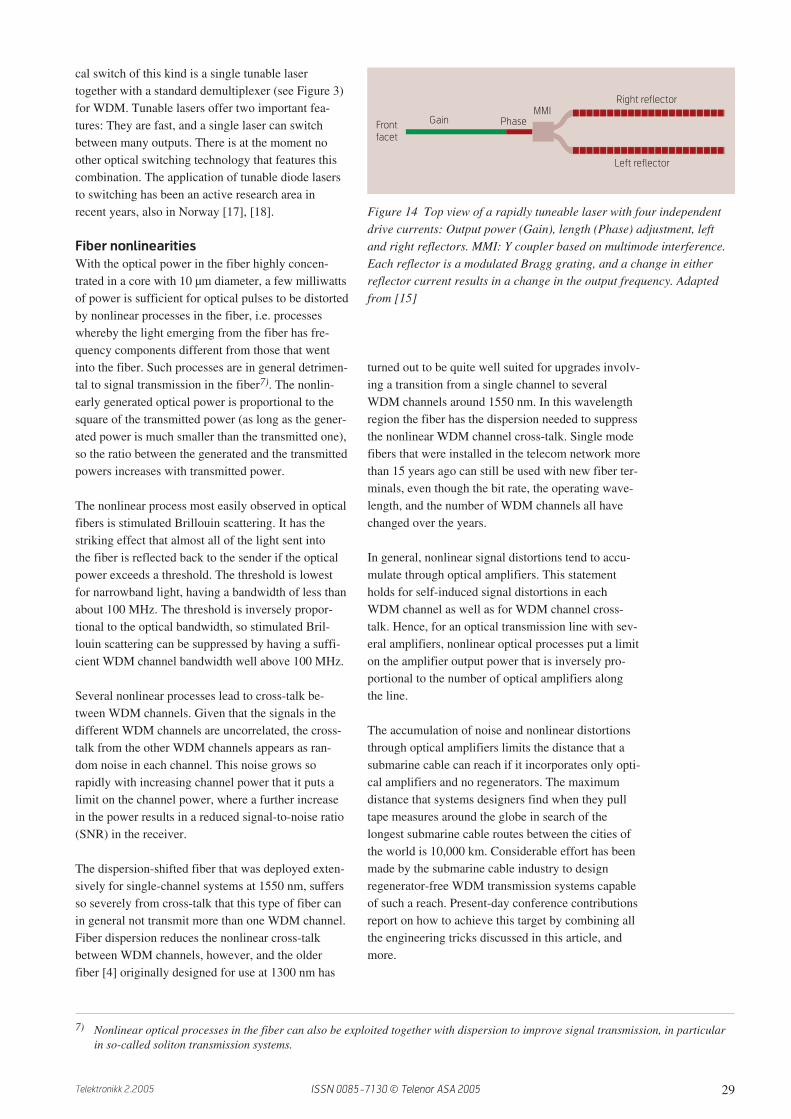
32 Telektronikk 2.2005
and increasing number of WDM channels remainsa serious challenge for telecom engineers and scien-tists. The telecom business boom did give us anabundance of dark (unused) fiber in the network,but demand for bandwidth in the fibers is growingrapidly, and the network operators have to resumetheir tradition of innovative exploitation of the fiberinfrastructure they own.
AcknowledgementsThe author would like to thank Evi Zouganeli andMartin Nord at Telenor for their careful reading andcomments that led to a significant improvement ofthe manuscript.
References1 Shinohara, H. Broadband Expansion in Japan.
Plenary talk at the First Joint Optical Fiber Com-munication Conference and National Fiber OpticEngineers Conference (OFC/NFOEC 2005), Ana-heim, California, USA, March 6-11, 2005. (ISBN1-55752-784-9)
2 Kao, K C, Hockham, G A. Dielectric-fiber sur-face waveguides for optical frequencies. Proc.IEE, 133 (3), 1151–1158, 1966.
3 Werts, A. Propagation de la lumiere coherentedans les fibres optiques. L’Onde Electrique, 46,967–980, 1966.
4 ITU-T. Characteristics of a single-mode opticalfibre and cable. Geneva, International Telecom-munication Union. ITU-T Recommendation No.G.652.
5 Tsukitani, M, Matsui, M, Nagayama, K, Sasaoka,E. Ultra low nonlinearity pure-silica-core fiberwith an effective area of 211 µm2 and transmis-sion loss of 0.159 dB/km. European Conferenceon Optical Communication (ECOC 2002),Copenhagen, Denmark, Sep 8–12, 2002, Paper3.2.2.
6 Gjesteland, E. Technical solutions and implemen-tation of the Svalbard fibre cable. Telektronikk,100 (3), 140–152, 2004.
7 Lehne, P H. The transatlantic telegraph cable of1858 and other aspects of early telegraphy. Telek-tronikk, 100 (3), 203–208, 2004.
8 Alferov, Z I. The History and Future of Semicon-ductor Heterostructures from the Point of View of
a Russian Scientist. Physica Scripta, T68, 32–45,1996.
9 Kroemer, H. Band Offsets and Chemical Bond-ing: The Basis for Heterostructure Applications.Physica Scripta, T68, 10–16, 1996.
10 Bigo, S. Multi-terabit/s optical transmission:where do we stand? The Norwegian ElectroopticsMeeting, Tønsberg, 2–4 May 2004.
11 Tessmann, H J, Breuer, D, Foisel, H M, Reiner,H, Cremer, H. Investigation of the relationbetween PMD coefficient and cable installationyear in Deutsche Telekom fiber plant. Proc. NISTSymp. Optical Fiber Measur., Boulder, Colorado,Sep 24–26, 2002, 187–190.
12 Mears, R J, Reekie, L, Jauncey, I M, Payne, D N.Low-noise erbium-doped fibre amplifier operat-ing at 1.54 µm. Electronics Lett., 23 (19), 1026–8,1987.
13 Desurvire, E, Simpson, J R, Becker, P C. High-gain erbium-doped traveling-wave fiber amplifier.Opt. Lett., 12 (11), 888–90, 1987.
14 Jayaraman, V, Chuang, Z M, Coldren, L A. The-ory, design and performance of extended tuningrange semiconductor lasers with sampled gratings.IEEE J. Quantum Electron., 29, 1824–34, 1993.
15 Öberg, M, Nilsson, S, Streubel, K, Bäckbom, L,Klinga, T. 74 nm tuning range of InGaAs/InP ver-tical grating assisted rear sampled grating reflec-tor. IEEE Photonics Technology Letters, 5,735–8, 1993.
16 Wesström, J O, Sarlet, G, Hammerfeldt, S,Lundqvist, L, Szabo, P, Rigole, P J. State-of-the-art performance of widely tunable modulatedgrating Y-branch lasers. Optical Fiber Communi-cation Conference (OFC 2004), Los Angeles,CA, Feb 2004, paper TuE2.
17 Buus, J, Morthier, G, Sarlet, G, Baets, R,Zouganeli, E, Mlonyeni, A, Sudbø, A, Broberg,B, Rigole, P J, Ishii, H, Yoshikuni, Y, Borley, S,Rawsthorne, J, O’Dowd, R, Mulvihill, G. Appli-cation and control of widely tunable lasers in HDWDM networks. SPIE Annual Meeting 2000,July 30 – August 4, Proceedings of SPIE, 4111.
18 Feng, B, Stol, N, Zouganeli, E, Andreassen, R O,Solem, A, Haugen, R B, Sudbø, A, Helvik, B E.Direct Comparison between Optical Circuit andOptical Packet/Burst Switching Using Simula-
ISSN 0085-7130 © Telenor ASA 2005

33Telektronikk 2.2005
tions. Opto-electronics and CommunicationsConference and International Conference onOptical Internet (OECC/COIN 2004), paper14A2-2, Yokohama, Japan, July 12–16, 2004.
19 Tsujikawa, K, Kurokawa, K, Tajima, K, Naka-jima, K, Matsui, T, Sankawa, I. Penalty-free 10Gb/s Transmission in 1.0 µm Band over 24 kmLow Loss PCF. European Conference on OpticalCommunication (ECOC 2005), Glasgow, UK,Sep 25–29, 2005, Paper Tu4.4.2.
20 Marhic, M E, Wong, K K-Y, Kalogerakis, G,Kazovsky, L G. Toward Practical Fiber OpticalParametric Amplifiers and Oscillators. Optics andPhotonics News, 15 (9), 21–25, 2004.
21 Shannon, C E. A mathematical theory of commu-nication. Bell Syst. Tech. J., 27, July and Oct1948.
22 Kahn, J M, Ho, K-P. Spectral efficiency limitsand modulation/detection techniques for DWDMsystems. IEEE J. Sel. Top. Quantum Electronics,10 (2), 259–272, 2004.
23 Øien, G E (ed.). Information Theory and itsApplications. Telektronikk, 98 (1), 2002.
24 Olsen, T, Tveito, O. High performance 140Mbit/s heterodyne PSK receiver employing a PLLsynchronous demodulator. European OpticalCommunications and Networks Conference,EFOC/LAN 1992, 382–4, IGI Europe, Boston,MA, USA.
25 Sab, O A. Forward error correction techniques.Optical Fiber Communications Conference (OFC2003), Trends in Optics and Photonics Series, 86,IEEE Cat. No. 03CH37403, 391.
Aasmund S. Sudbø received an M.E. in physics from Norges Tekniske Høgskole, Trondheim, Norway, in
1975, and a PhD degree in chemical physics from the University of California, Berkeley, in 1979. For two
years, he continued this work as a Postdoctoral Researcher with IBM Research Laboratories, New York.
From 1981 through 1994, he worked on optical fiber communication at Telenor R&D, Kjeller, Norway, one of
the years at Bell Laboratories, Murray Hill, NJ. He also was Adjunct Professor in the Department of Physics,
University of Oslo. Since 1995 he has been Professor of Optoelectronics at the University of Oslo and at
UniK, University Graduate Center at Kjeller, Norway. From 2002 to 2003 he was a Visiting Scholar at
Stanford University, Stanford, CA, where he worked on optical MEMS. He has been a member of the techni-
cal program committees of many conferences on optical communication, in particular the annual European
Conference on Optical Communication (ECOC), where he was the program chair in 1996.
email: [email protected]
26 Mizuochi, T, Miyata, Y, Kobayashi, T, Ouchi, K,Kuno, K, Kubo, K, Shimizu, K, Tagami, H,Yoshida, H, Fujita, H, Akita, M, Motoshima, K.Forward error correction based on block turbocode with 3-bit soft decision for 10-Gb/s opticalcommunication systems. J. Sel. Top. QuantumElectron., 10 (2), 376–386, 2004.
BibliographyAgrawal, G P. Lightwave Technology: Telecommuni-cation Systems. John Wiley & Sons, 2005. (ISBN0471215724)
Agrawal, G P. Lightwave Technology: Componentsand Devices. John Wiley, 2004. (ISBN 0471215732)
Agrawal, G P. Nonlinear Fiber Optics, 3rd edition.Academic Press, 2001. (ISBN 0120451433)
Buus, J, Amann, M-C, Blumenthal, D J. TunableLaser Diodes and Related Optical Sources, 2nd edi-tion. Wiley, 2005.
Green, P E Jr. Fiber Optic Networks. Prentice Hall,1993. (ISBN 0133194922)
Hecht, J. Understanding Fiber Optics, 5th edition.Prentice Hall, 2005. (ISBN 0131174290)
Kaminow, I P, Li, T (eds.). Optical Fiber Telecom-munications IV B. San Diego, Academic, 2002.
Ramaswami, R, Sivarajan, K. Optical Networks: APractical Perspective, 2nd edition. Morgan Kauf-mann Publishers, 2001. (ISBN 1558606556)
ISSN 0085-7130 © Telenor ASA 2005

34 Telektronikk 2.2005
IntroductionDuring the past few years there has been massivegrowth in the take-up of broadband with little signof any slow-down in demand. There is also a cleartrend towards higher bandwidths with both Japan andKorea adopting fibre-to-the-home (FTTH) strategiesto deliver 100 Mbit/s capability, while in the US somemajor FTTH deployments are planned over the nextfew years. Although Europe has not yet embracedfibre as the access technology of choice, serious con-sideration is now being given to fibre access solutionsfor future deployment with small-scale deploymentsand trials taking place.
The relentless progress in consumer technology hasalso continued unabated with processor speeds contin-uing to increase roughly in line with Moore’s Law. Atthe same time very high capacity low cost storage hasbecome readily available to match this increase in pro-cessing power. Video and imaging services via mobilephones have also seen remarkable growth showingthere is real latent demand for new innovative ser-vices, and some of these really will require higherbandwidth connectivity as expectations rise and frus-trations with delay and low quality limit usage. Imageand video file transfer, richer content on the web,increasing popularity of online gaming (not just inKorea and Japan) and the need to back up largeamounts of personal data will all drive the demandfor increasing access speeds and network capacity.
As operators and service providers move forward try-ing to meet these ever-increasing demands for highcapacity services, a major obstacle to sustainableprofitability arises. The issue is that the cost of in-stalling the additional network capacity to meet thepredicted growth in demand for bandwidth can easilyexceed the subsequent growth in revenues.
BackgroundBandwidth growth exceeding revenue growth is nota new phenomenon but has previously been balancedby the normal price decline of equipment that occursin any industry as product volumes increase. Theproblem for the telecommunications industry with a
broadband future, particularly when moving beyondtoday’s DSL speeds and contention ratios, is thatmany of the projected possible service and growthscenarios produce such large bandwidth growths thattraditional price declines will not be sufficient to keepcost growth in line with growth in revenues.
The basic problem is that today’s networks are builtupon a large base of electronic equipment which onlyprice declines in line with the traditional pricedeclines seen within the electronics industry. Histori-cally, electronic goods and products have typicallydeclined with an 80 % learning curve; that is, forevery doubling of product volume the unit pricedrops to 80 % of the previous price. Over the pastdecade bandwidth has followed the same relationship.As network capacity increases the cost of providingthat capacity falls in line with the price decline of thesupporting electronic technology and there is no evi-dence that the overall situation is changing.
If the cost of building greater capacity in traditionalnetworks cannot be solved by the usual expectedequipment price declines then either future broadbandgrowth is going to be curtailed or new network archi-tectures that are less dependent on the basic electron-ics are going to be required. These new architectureswill need to eliminate significant tranches of equip-ment by removal of nodes and minimisation of net-work port cards and internal interfaces – like BT’s2CN vision – but at the same time enabling therequired network capacity growth.
The interesting question for optical networking andoptical technology is, can it produce faster unit band-width price declines than traditional network devel-opments? There is no reason to suppose that the priceof optical technology itself will decline any fasterthan electronic technology. Many of the manufactur-ing techniques used within the optical technologyindustry have evolved from or are developments ofprocesses used within the electronics industry.
The opportunity offered by optical technology andsystems is the prospect of new radical approaches tonetwork architecture and design, enabled by exploit-
A new architecture for optical networks
D A V I D P A Y N E A N D R U S S E L L D A V E Y
David Payne is
Head of the
Future Networks
team at BT,
Martlesham
Heath, UK
Russell Davey is
Head of BT’s
R&D activities in
optical systems
This paper briefly reviews the history of optical access, in particular the Passive Optical Network (PON)
architecture (still the most promising candidate for the mass-market solution), when and how it might
evolve further into the future and maybe finally become the access network technology of choice for
all service providers by tackling the problem of bandwidth growth costs outstripping revenue growth.
ISSN 0085-7130 © Telenor ASA 2006

35Telektronikk 2.2005
ing the capacity, reach and flexibility of optical net-working to minimise the numbers of tiers, nodes andinterface ports required in large scale networks. Oneapproach to this, discussed in this paper, is the designof a network that combines the access network andouter-core/backhaul/metro network into one commonhigh capacity network that can bypass and eventuallyeliminate the current access nodes. At the same time itreduces the number of customer ports and networkinterfaces required. This combination of node elimina-tion and port elimination can lead to significant capitalexpenditure (CapEx.) savings and because of the over-all simplification of the network and reduction in net-work intervention points, there are also major ongoingoperational expenditure (OpEx) savings.
Optical access and all optical networks have been top-ics in the optical communications world for over twodecades, yet it has still not happened on any signifi-cant scale, compared to the size of legacy networks.For those working in the field it has often seemed thatthe fibre-to-the-home/office revolution was “justaround the corner” albeit the corner being two to fiveyears away and never appearing to come closer.
There have been a number of good reasons for this, dis-cussed briefly later, but primarily FTTH is an almostrevolutionary step for incumbent operators to take.The new competitive operators did not really tacklethe access space as there was thought to be muchricher and easier pickings in the core/backbone andouter-core/metro spaces. Although many of these net-works were dominated by optical technology and sys-tems they were largely simple point-to-point transmis-sion systems with the networking technology still beingmainly in electronic switching and routing nodes withoverall topologies following conventional architectures.The only other operators that built broadband accesswere the cable operators and at the time of their majorbuild the access fibre solutions were very immature andnot readily available. They installed coaxial cable sys-tems followed later by hybrid fibre coax (HFC). Thecoax remained as the customer premises terminatingtechnology, fibre only being used in the longer distancefeeder part of the network. Now like the incumbenttelecom operators who have a valuable legacy of cop-per, the cable operators have a valuable legacy ofcoax. So what is the opportunity for access fibre?
This paper will briefly review the history of opticalaccess, in particular the Passive Optical Network(PON) architecture (still the most promising candi-date for the mass-market solution), when and how itmight evolve further into the future and maybe finallybecome the access network technology of choice forall service providers by tackling the problem of band-width growth costs outstripping revenue growth.
Brief history of fibre in accessFibre-to-the-home and -business was a considerationfrom the earliest days of optical fibre technologydevelopment. In the late 1970s point-to-point replace-ment of copper by fibre was being considered as away of delivering broadband (mainly video) servicesto customers. These early systems were predicated onmultimode fibre technology, the only viable solutionat that time. More sophisticated versions of theseearly systems were also studied including remoteelectronic multiplexers sited at the street cabinet loca-tion with fibre feeders from the exchange and point-to-point optical links from the cabinets to the cus-tomers. This was not so different from today’s fibre-to-the-cabinet proposals using VDSL technologywhich uses advanced modulation and coding tech-niques to exploit the legacy copper from the cabinetto the customer rather than installing new fibre all theway from the remote nodes to the customer site.
The first considerations of a passive optical networkapproach for the access network was around 1982when single mode fibre technology was being seen asa possible new way forward for optical communica-tions. Single mode fibre offered many advantagescompared to multimode fibre, much greater band-width being one of the more obvious. However, prob-ably of equal importance for the future evolution ofoptical networking was the ability to make high per-formance optical components.
One component that became available fairly quicklywith the arrival of single mode technology was thefused fibre directional coupler. These splitters or cou-plers can be cascaded and any size of splitter or starcoupler can be made. These optical splitters were thekey component behind the Passive Optical Networkconcept and can also be manufactured using planartechnologies.
In the first half of the 1980s the passive optical net-work concept was centred on wavelength switchednetworks. These used star couplers to interconnectnetwork terminations and wavelength selection toroute paths [1] across the network. At the same timeideas of using the couplers as simple passive splittersfor broadcasting television signals were also beingconsidered [2].
All this early thinking was technology led, it wasthought that these networks would be used to deliverbroadband services, with video being the obviousapplication. Little thought was given to revenuestreams or the business environment. It was thoughtthat if the bandwidth capability was delivered ser-vices and revenues would follow.
ISSN 0085-7130 © Telenor ASA 2006

36 Telektronikk 2.2005
In the mid 1980s BT became interested in the possi-bilities offered by optical access and this led to arefocusing of the passive optical network approach.The operational units brought a much needed busi-ness focus to the research and challenged the researchteams to develop a system that could be economicalfor telephony. This was a service with a known rev-enue structure as opposed to the unknown revenuesfrom future broadband services. This approachbecame known as a “telephony entry strategy” andled to the invention and development of the “TPON”(Telephony over Passive Optical Network) system[3][4]. Several manufacturers became heavilyinvolved in the development including Fujitsu,Alcatel and Nortel. In the end BT deployed a Fujitsusystem to several tens of thousands of customers.
TPON was TDM based and the early system hada limited bandwidth of 20 Mbit/s, adequate for tele-phony and ISDN but not for broadband. Broadbandwould be added later, as an upgrade, by the additionof extra wavelengths. To facilitate this a blocking fil-ter was added to the TPON ONUs, which only passedthe original TPON wavelength and blocked all others,enabling additional wavelengths to be added to thePON at a later stage without disturbing the originaltelephony only customers. However, because the sys-tem was never rolled out on any significant scale theupgrade system (called BPON at the time) was neverdeveloped into a commercial product. At the end ofthe eighties BT was developing an ATM version ofpassive optical networks called APON. Also aroundthis time optical amplifiers were emerging as a viablenetwork component. At the end of the eighties andin the early nineties several experiments were per-formed at BTLabs that demonstrated the real potentialof the passive optical networking approach and culmi-nated in the publication of initially a 32 million waysplit network delivering 12 wavelengths at 2.5 Gbit/seach [5]. This was further enhanced a few monthslater with the publication of a 44 million way split(~the whole population of the UK) with 16 wave-lengths at 2.5 Gbit/s and 500 km of optical fibre [6].Although no one was suggesting a real implementa-tion of such a network it did illustrate that the TPONand APON architectures and indeed the current FSANspecifications for PON systems were only scratchingthe surface of the potential of this technology.
During the early nineties BT continued with thedesign and development of a more practical amplifiedPON architecture, it became dubbed as SuperPON.This examined the design and implementation optionsof a passive optical network that could service a splitof up to 3000 and have a geographical range up to 100 km. The capacity was 1.2 Gbit/s downstream(from network towards the customer) and 300 Mbit/s
upstream. At the time these bit rates were very ambi-tious for optical access and were considered to be thelimits for low cost consumer equipment.
Interestingly this solution was the lowest cost solu-tion found for fibre-to-the-home/ business and eventoday there are as yet no FTTHome/business solu-tions being offered with lower projected costs.
The European ACTS PLANET project continuedwith the SuperPON concept up until 1999 [7];beyond this point there have been no further develop-ments occurring in the supply industry.
No decisions were made to deploy FTTH systemsto the mass market, and by the mid nineties it wasrealised that without international co-operation andstandards there was not going to be a sufficientlylarge common market to drive down the costs of thebase components necessary to enable such systemsto become economically viable.
In the mid nineties BT, Deutsche Telekom and NTTdecided, with other operators, to set up a consortiumto develop and standardise PON requirements andsystems, this forum became FSAN. For a fulleraccount of FSAN, see [8].
In recent years PON system have continued to bedeveloped, largely along FSAN guidelines and mainlyin the small/start-up company arena. More recentlyJapan, Korea and the US have revitalised interest inthe supply industry and PON access solutions are oncemore becoming the access solution of choice as FTTHdeployment progresses into the 21st century.
Why so little fibre in the accessnetwork?Given the promise and all the development work intofibre-to-the-home systems why hasn’t large-scaledeployment already happened?
Probably the most significant reason is simply thescale of what is being tackled. The studies in the earlynineties showed that it would have required an invest-ment of the order of £15 billion to fibre the UK. Withhindsight this may not have been a bad investmentfor “UK plc” but for commercially focussed operatorshaving to survive in an increasingly competitive envi-ronment the lack of clear returns on investment madesuch a proposition too risky.
It was unclear what the demand for broadband wouldbe. The public Internet and the World Wide Web hadyet to emerge and the only known commercial marketwas broadcast or stagger-cast entertainment video
ISSN 0085-7130 © Telenor ASA 2006
37Telektronikk 2.2005
and video-on-demand (VoD). These services alreadyhad established delivery solutions (although trueVoD would be more problematic) that would providefierce competition to new fixed network providersentering the market.
At the same time compression techniques such asJPEG and MPEG were progressing rapidly and DSLtechnologies were increasing the transmission capac-ity of the embedded copper base. The advances inDSL technologies and the reductions in bandwidthrequired for high quality video transmission werebeing seen as converging and many believed that mostof the envisaged broadband services could be deliv-ered on an enhanced copper network without the needfor significant fibre deployment into the access arena.This effectively led to decisions on installations offibre-to-the-home and small business being deferred.
Emerging drivers for FTTHWhat requirements are there for higher speed broad-band services that could drive the need for fibre muchcloser to the customer, and what has changed in thelast few years that is stimulating a resurgence ofinterest in fibre access?
The Internet
It is generally agreed that the most significant phe-nomenon to impact the broadband debate is the emer-gence and popularity of the Internet and in particularthe World Wide Web. In the early days of servicemodelling long lists of proposed “services” would begenerated with titles like “home banking”, “homeshopping”, “games”, “e-mail”, “VoD” etc. Many ofthese are now just applications and services availableover the Internet.
Clever encoding and website design enable many ofthese services and applications to be available evenwith a 56 kbit/s modem connection while the “broad-band” connection >~256 kbit/s markedly increasesthe responsiveness and attractiveness of the experi-ence. Apart from high quality video, most of theseservices can be provided with an access speed of onlya few hundred kilobits per second. However, as thecontent becomes image and video rich and as thequality of that content increases in terms of resolu-tion, frame rate or reduced latency (important forgaming and conversational services), then the speedof the connection, for a satisfactory customer experi-ence, will need to increase.
Digital imaging and video
Another area to consider is the rapid developments inconsumer equipment, one example of which is digitalvideo. Most digital video cameras use the DV format
and now have a “fire-wire” (IEEE1394) or USB2interface that will deliver a high quality digital videosignal at about 30 Mbit/s. High Definition Video(HDV) is also emerging and has been designed to usesimilar data rates by using real-time MPEG2 encod-ing rather than the cosine transform coding used bythe DV standard. Currently the only place that signalcan be transmitted is to other CPE a few metres away.Multiple USB and IEEE1394 interfaces are now stan-dard features on PCs and are capable of speeds up to400 Mbit/s (although admittedly the internal architec-ture and limitations of the PC and its operating sys-tem will often limit this speed, however file transfersat > 100 Mbit/s are readily achieved).
Digital photography is now rapidly displacing filmphotography and the ability to distribute these imagesvia e-mail and file transfer is one of the major advan-tages of this media format. Modern cameras, even atthe low end of the market, generate multi-mega pixelimages and single image raw file sizes can easily beseveral Mbytes. The mobile phone camera market isalso now taking off and people want to transmit theimages captured to colleagues, friends and family.These camera phones can actually capture high quality,high-resolution images but the transmitted quality isvery poor due to the very heavy compression appliedto the images prior to transmission over current narrowband mobile networks. Linking these mobile phones toother network devices, eg. the PC via Bluetooth, couldenable much higher quality and even the large raw,uncompressed image files to be transmitted over thebroadband fixed network at full resolution.
Developments in digital CPE
The PC processing speed has continued to followMoore’s Law and 3 GHz plus machines are now com-monplace, in the relatively near future this is likely toincrease to ~10 GHz. The increasing power of thesemachines with increasing speed of the interfaces willenable large files to be moved between different itemsof CPE at very high speeds, much higher than the fewhundred kbit/s capability of DSL technology to theexternal network. This mismatch between internaland external networking capability will continue toincrease until high capacity optical fibre communica-tions is brought much closer to the customer.
With increasing PC power, the popularity and rapiddevelopment of very high resolution imaging devices(including still image cameras with Mega-pixelimages), DV cameras becoming commonplace andHDV emerging, users in the consumer marketplace aswell as business will be generating huge amounts ofdata. Storage of these files within the PC is alreadydriving hard drive capacities to the hundreds ofGbytes sizes and will soon be in the Terabytes regime.
ISSN 0085-7130 © Telenor ASA 2006

38 Telektronikk 2.2005
A major problem for owners of such storage is secureback-up of valuable data. Storage area networking isa potentially valuable emerging market for the busi-ness sector, currently focussed on large business. Butwith the huge expansion of low cost mass storage forthe mass market, a future service could be protectedon-line storage for valuable data or data that cus-tomers will want to access wherever they are. Sucha service will only be useful and practical if uploadand download speeds are sufficiently fast for typicaltransactions to occur in minutes rather than hours oreven days.
Examples of transmission over fibre v xDSL
It can be seen from the above that very large datafiles are not just the domain of large businesses, con-sumer equipment can now generate huge data files.
A one hour DV tape can contain over 16 Gbytes ofdata, single layer DVD can hold ~5 Gbytes, even thehumble CD holds ~0.6 Gbytes of data. Transferringsuch large files electronically over current networkstakes an unacceptable length of time, such that theusual method of “large” file transfer is via physicalmovement of media, that is, the Postal Service. Thelimitations of access network technologies to movesuch large data files between distant locations(greater than a few metres) are illustrated in Figure 1which shows the time taken to transfer large files ofvarious sizes using the various access technologyoptions that are available – note the log scales.
For peer to peer transfer the upstream rate is the limi-tation for transmit time with ADSL and VDSL tech-
nologies but even for downstream transmission, onlyfibre-to-the-home provides realistic transfer times forservices such as purchase and network downloads, ofelectronic media such as DVD files or even CD-ROM. The only practical option for say DVD pur-chase over the Internet or transferring a home movieat DV quality to friends and family is to use thepostal service.
In the business community the incidence of tele-working is increasing steadily. Official estimatesfrom a 2001 survey indicate that there were 2.2 mil-lion tele-workers in the UK. Tele-workers weredefined as people who worked at least one day perweek from home [9]. This definition excludes occa-sional tele-workers (people who have an office loca-tion but also work either irregularly or occasionallyfrom home). If these are also included, the numberof “tele-workers” could increase significantly.
In many corporate companies employees have accessto internal Intranets usually with 10 or 100 Mbit/sEthernet connections. In order to operate at the sameservice capability and efficiency as office basedworkers, tele-workers ideally need a network connec-tion speed comparable to that of the internal officeLAN. Current DSL based broadband options go someway towards this but tele-working often needs broad-band connections with much greater symmetry oftransmission as well as higher data rates.
VDSL technologies or fibre to the home would aidthe tele-working environment enormously.
The conclusion from the above brief survey of thedrivers for broadband is that DSL technologies canonly be an interim solution and will not satisfy thedemand generated by emerging consumer technologyor future services. In Korea the government is alreadysuggesting that the future broadband convergencenetwork (BcN) should operate at speeds up to100 Mbit/s to the end customer, ~50 times fasterthan conventional broadband services.
Financial barriers –The greatest barrier to greater penetration of fibre inthe access network is of course the high investmentcosts required. As mentioned above, the studies in theearly nineties indicated a cost of ~£15 billion to pro-vide fibre to all the homes and businesses in the UK.Although some elements of the costs for fibre-to-the-home/office have reduced over the intervening years,overall the costs, using current technology prices,have not changed significantly and the total cost willstill be of the same order.
0.01
0.1
1
10
100
1000
10 100
File size (Gigabytes)
tim
e t
o t
ran
sm
it f
ile
(h
rs)
56k Modem
ADSL
VDSL
FTTH +DBA
1
Figure 1 Time to transmit large files peer to peer
ISSN 0085-7130 © Telenor ASA 2006
39Telektronikk 2.2005
Early fibre systems targeted specific or niche mar-kets. For example, many of the first generation ofcommercially available APON and BPON systemswere aimed at data services for the medium and smallenterprises market and did not support POTS ser-vices. The problem with these solutions for massdeployment is that they cause a fragmentation ofrevenue streams with revenues from different serviceportfolios being required to support different plat-forms. For a mass-market solution this is not viable.All possible revenue streams will be needed to sup-port the deployment and operation of a single plat-form. A fibre-to-the-home/office solution needs todeliver all services: voice (including the regulatedPSTN services), video and data to have any chanceof being financially viable.
The other issue for broadband access is that histori-cally, overall revenues from the customer base growrelatively slowly. Particular revenues can grow quitefast; however, it is usually via revenue substitutionfrom within the telecommunications business.
On a macro-economic scale this is perfectly reason-able, GDPs of countries, and indeed the world, onlygrow at a modest rate (typically ~1–3 %) and to havea revenue growth rate much greater than this over anextended period will mean significant underlyingeconomic change; ie. spend in telecomms will meana down turn in some other sector of the economy.Although such changes do occur they generally occurslowly. In the UK growth in telecomms spend hasindeed exceeded growth in GDP for several yearsimplying underlying changes in spending patterns.However, expecting significantly greater and sustain-able changes in the spend ratios over extended peri-ods of time is unrealistic.
The conclusion from the relative overall slow growthof revenues for telecommunications services, com-
pared to the potentially very rapid increase in band-width demand from future broadband is that the costper unit of bandwidth must decline very rapidly,much more rapidly than traditional price declinesof products in the electronics market.
To illustrate this, consider the three service scenariosoutlined below. These are potential growth scenarios,categorised as: Pragmatic Internet, Optimistic + Mod-erate Video and Very Optimistic & Video Centric.The main service and usage assumptions behind thescenarios are shown in Table 1.
Note these are scenarios not forecasts; the intentis merely to illustrate the impact different servicegrowth and usage demand patterns could have on net-work capacity requirements and what the possiblenetwork architectures and solutions could be to meetthe demands economically. The correspondinggrowth in network traffic for these scenarios is shownin Figure 2.
It can be seen from the results in Figure 2 that therecould be big differences in the bandwidth demandsthat a future network may need to meet. An even big-ger issue is that in the high growth scenarios, revenuegrowth will not match the cost of servicing the band-width growth. This will particularly be the case forthe optimistic scenarios, unless new ways can befound of significantly increasing the price decline ofthe cost of bandwidth.
Ideally the industry would like to maintain the Returnon Capital Expenditure (ROCE) during a sustainedgrowth period otherwise there is a risk of profitabilitysuffering or even companies going out of business.The interesting question to ask of these scenariosdescribed above is: what price decline or learningcurve for bandwidth must be achieved, to enable thegrowths shown, whilst maintaining ROCE?
Pragmatic Internet Optimistic + Moderate Video Video Centric
2009/10 2014/15 2009/10 2014/15 2009/10 2014/15
Total broadband Internet customers (millions) 9.4 12.3 10.7 14.8 10.9 16.2
(Includes cable modem)
Number of VDSL/Fibre customers (millions) 0 0 1.65 2.9 2.1 7.7
Video/VoD customers (millions) 0.14 0.54 1.5 3.5 2.0 8.7
Average Internet session time/day (mins) 75 80 96 107 101 126
Average Internet session bandwidth (kbit/s) 77 114 320 1270 488 4780
Average video session time/day (mins) 24 24 58 70 94 128
Average video session bandwidth (kbit/s) 2000 2000 7000 7500 7280 7400
Table 1 Assumptions for example traffic scenarios
ISSN 0085-7130 © Telenor ASA 2006

40 Telektronikk 2.2005
It can be shown that if all growths can be expressedas a compound annual growth rate (CAGR), thenthere is a simple relationship linking revenue growth,bandwidth growth and the learning curve for the pricedecline per unit of bandwidth to maintain ROCE,given by:
1 + GR ≥ (1 + GB)1+L
Where:GR is the CAGR for RevenuesGB is the CAGR for Bandwidth
and
L = Log(L % / 100) / Log(2)
Where:
Figure 2 Projected traffic growth for the service scenarios listed in Table 1
Pragmatic internet
0
200
400
600
800
1000
1200
Ing
ress t
raff
ic t
o c
ore
- G
bp
s
Broadband internet
Broadband video
Dial IP
Corporate internet/intranet
SMDS
CellStream
FrameStream
KiloStream - incl K/S N
MegaStream
PSTN & ISDN - excl. dial IP1998/99 2000/01 2002/03 2004/05 2006/07 2008/09 2010/11 2012/13 2014/15
This scenario can be considered a pragmatic internet scenario. It only relies on ADSL and Cable Modem technology. Streamed
video services are a minority product and most video entertainment is delivered through conventional systems, eg. terrestrial,
satellite or cable. Internet growth is assumed to be fairly robust but not particularly ambitious. Customers are assumed to be
split between cable modem operators and ADSL operators.
Optimistic + moderate video
0
2000
6000
10000
14000
18000
Ing
ress t
raff
ic t
o c
ore
- G
bp
s
1998/99 2000/01 2002/03 2004/05 2006/07 2008/09 2010/11 2012/13 2014/15
Broadband internet
Broadband video
Dial IP
Corporate internet/intranet
SMDS
CellStream
FrameStream
KiloStream - incl K/S N
MegaStream
PSTN & ISDN - excl. dial IP
This is a more optimistic scenario but without stretching the bounds of plausibility for the types and usage of the services
postulated. The main difference is the use of the network to deliver high quality video entertainment services and fast file
transfers for business and e-commerce. Even in this scenario video usage is only equivalent to about 1 feature film per day
implying most entertainment video would still be delivered by conventional means. However network delivered video is assumed
to be a personalised service rather than broadcast/multicast and is transmitted to individual customers.
This scenario assumes a much greater use of content rich Internet applications, which pushes up average session bit rates. It
implies that ADSL, where capable, will enable customers to operate up to ~2 Mbit/s and that some VDSL and/or fibre solutions
are also rolled out. The other major change from the “pragmatic” scenario is that a large proportion of customers use their
broadband connection for personalised video applications, although it is not the main entertainment video delivery system
used by customers.
Very optimistic + video
0
20000
40000
60000
80000
Ing
ress t
raff
ic t
o c
ore
- G
bp
s Broadband internet
Broadband video
Corporate internet/intranet
1998/99 2000/01 2002/03 2004/05 2006/07 2008/09 2010/11 2012/13 2014/15
ISSN 0085-7130 © Telenor ASA 2006

41Telektronikk 2.2005
L % is the learning curve (expressed traditionallyas a percentage).
A learning curve is defined as the percentagedecline in price of a product as the product volumedoubles, an 80 % learning curve will mean that theprice of a product at a volume V will decline to80 % of that price at volume 2 x V. In this case theproduct volume is taken as bandwidth.
This is the macro-economic condition that needs tobe met for a sustainable business as bandwidth growsin the broadband future.
This relationship is plotted in Figure 3 with contoursof constant revenue growth. Typically it is reasonableto expect time averaged revenue growths in the range4 % to 7 % CAGR. Electronic systems have learningcurves of ~80 % (historically transmission systemshave been following such a learning curve for thepast decade at least) and from Figure 3 this pricedecline and revenue growth would suggest that over-all network bandwidth growths of ~10 % can besustained. Before the advent of broadband, growthsof this order or less were typical and the whole eco-nomic system was internally consistent between pricedeclines, revenue growth and bandwidth growth.Note this is a macro-economic argument applied tothe total system size; it does not apply to individualproducts and services or sub-networks within themain network. These could grow at much faster ratesby substitution of other products or markets, or theycould be small niches and simply cause too small aperturbation to be noticeable in the bigger picture.In the scenarios illustrated above we are looking atlarge-scale changes to the capacity of the networkand though very simple, this model gives a usefulguide to the bounds on growths that can be expectedto be viable, given a set of revenue constraints.
The envelopes of bandwidth growth for the scenariosillustrated in Figure 2 do not exhibit constant CAGRsdue to the many individual parameters and growthand service usage functions that influence the growthcurves. However, if an approximation is fitted to theregions, which start where bandwidth from broad-band begins to become significant, then approximateCAGRs can be obtained. Using these fitted band-width growth rates, assuming a nominal 5 % perannum revenue growth and the relationships shown inFigure 3, then the following estimates of the requiredlearning curves for bandwidth price decline can beestimated:
The “Pragmatic Internet” scenario is on the boundsof economic viability with electronic centric systemsand network architectures not very different from
today’s. So the current strategies followed by opera-tors deploying ADSL or Cable Modem for predomi-nantly internet surfing, e-mail etc. with little videoservices, should be viable and will probably maintainROCE, particularly if some additional revenuegrowth can be obtained from the richer service setsthat can be offered. In addition operators can controlbandwidth growth to some extent by use of con-tention for backhaul and core bandwidth. From a userperspective this will appear as increased delay for up-load and download as the network gets congested inbusy periods, effectively reducing the average sessionbandwidth per user.
However, the case is very different as we go beyondthis scenario to the higher bandwidth scenarios thatassume greater than a few hundred kilobits per sec-ond session rates and greater use of personalisedvideo services. It can be seen that the price declinesrequired to meet the bandwidth growths in these sce-narios are much faster than the traditional 80 % learn-ing curves typically arising in the electronics indus-try. In the case of the Optimistic and Video Centricscenarios the required price declines are so fast that itcan be safely claimed they will not be met. From thisperspective, future network architectures that con-tinue to use traditional electronic solutions will not beable to price decline sufficiently fast to be able tomaintain operating margins and profitability.
Lower cost architecturesThe implications of this simple economic relationshipare quite profound for the telecommunications indus-try. It implies that either growth of future bandwidthwill have to slow to match that dictated by the pricedecline achievable in conventional electronic centric
0
20
40
60
80
100
51 56 61 66 71 76 81 86
Bandwidth learning curve%
Ba
nd
wid
th C
AG
R %
Contours of revenue growth 1%
2%
3%
4%
5%
6%
7%
8%
9%
10%
Figure 3 Relationship between revenue and bandwidth growths and theprice learning curve for unit bandwidth
ISSN 0085-7130 © Telenor ASA 2006

42 Telektronikk 2.2005
networks, or we need to develop and implement newalternative architectures that can enable much fasterdecline in the price of bandwidth. The interestingquestion addressed in this paper is, can architecturesthat exploit a much greater use of optical networkingtechnologies produce significantly faster price declinesthan conventional electronic centric networks?
It is not very likely that optical technology will price-decline any faster than electronic technologies. Manyof the manufacturing methodologies are similar andindeed are developed from the electronics world andare therefore likely to follow similar price declinetrends. The potential strength of optical technologycomes not from lower cost components but its abilityto displace electronic sub systems and nodes withinthe networks, offering much higher capacities with amuch smaller equipment inventory, i.e. reducing boxand port count while enabling very much higher net-work bandwidth.
All optical networking in the core, including trueoptical or photonic switching, has had a long gesta-tion period but practical systems are now emerging.The main outstanding issue to be resolved is the gain-ing of confidence by operators in the ability to beable to manage and operate systems employing such“transparent” optical core networks. Transparent opti-cal networks that are photonic end-to-end accumulateanalogue impairments along the routes. In a dynami-cally reconfigurable, optically transparent networkthis is a real problem for an operational network. Net-work operators require optical networks to be capableof being managed with similar capability and featuresas today’s networks based on conventional OEO(optical-electronic-optical) architectures.
The promise offered by all optical switching is lowercost transport across the network core, achieved byremoving the large number of transponders requiredto terminate each end of every wavelength channelof the conventional OEO architecture. However thisadvantage can only be realised if the operational costsdo not increase as a result of the added complexity ofmanaging the “analogue” nature of the transmissionpaths of the all-optical proposition.
By-passing the outer-core/metro networkThe approach being evaluated in the following is toextend the “transparent” all optical architecture con-cept to the access and metro networks with the sameaim of removing electronic nodes and port cards. Itshould be pointed out that this is a radical proposaland is not the mainstream view on how the accessnetwork architecture ought to evolve. Traditionallyaccess and outer-core/metro networks are two separateworlds and the usual approach is to design accesssolutions and metro solutions that are largely indepen-dent of each other. This is not too unreasonablebecause usually there is an electronic access node (thelocal exchange or remote concentrator unit) placedbetween the access network and its technologies andthe outer-core/metro network. Also historically this“access” node has been placed where it is because ofthe physical limits of the copper network, indeed thisnode position has been called the “copper anchor”.
Once optical access is considered this limitation of thefirst node position is no longer necessary and oneinteresting architectural option is to use optical accessto reach deep into the network and terminate on a coreedge node (a Metro Node in the BT 21CN architec-ture) which becomes the place where traffic groom-ing, marshalling and concentration etc. are performed.An option proposed for a long reach access network isbased on the passive optical network (PON) principlesbut with optical amplification to boost the power bud-get. This enables large increases in bandwidth, geo-graphical range and optical split compared to a con-ventional PON. It can be pedantically argued that thisis no longer a passive optical network because of theuse of an “active” optical amplifier within the PON.However the optical amplifier is replacing the elec-tronic access node and the original access proportionof the network remains passive and the term PON willcontinue to be used in this paper (for the purist the Pin PON could become Photonic).
Potentially the long reach enabled by the amplifierswould enable bypass of the usual backhaul networkwhich would conventionally be SDH, possibly com-bined with Metro WDM systems for enhanced capac-ity. The long reach would also allow the possible by-pass and ultimate removal of the local exchange orremote concentrator site and the increased capacity ofthe system coupled with the increased power budgetenables a much greater optical split to be deployed.This allows more customers to be able to share thecapacity and costs of the PON and the OLT, locatedin the 21CN Metro Node.
This combined access and backhaul network termi-nates on the 21CN Metro Node, which now provide
Scenario Bandwidth Bandwidth
CAGR fit learning curve
Pragmatic Internet 10 % ~72 %
Optimistic & Moderate Video 50 % ~54 %
Very Optimistic & Video Centric 80 % ~52 %
Table 2 Learning curves to meet given network bandwidth growths
ISSN 0085-7130 © Telenor ASA 2006
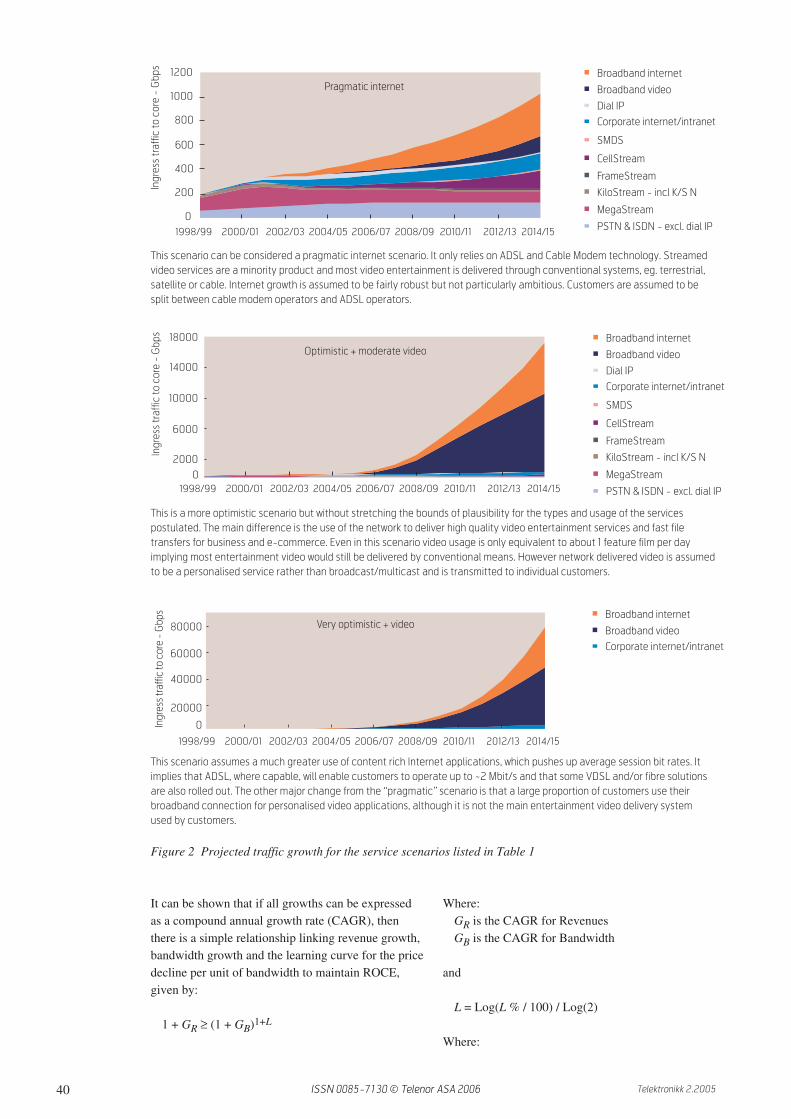
43Telektronikk 2.2005
the management and intelligence functions and mar-shal and groom traffic onto a photonic inner core net-work. This photonic inner core interconnects thesecore edge nodes via simple wavelength channels. Forthe UK it is envisaged that there would need to beabout 100 of these 21CN Metro Nodes.
This architecture leads to a highly simplified networkthat has the potential for significantly reducing unitcosts and enables scenarios with very high bandwidthgrowth. Such a future long reach access network isillustrated in Figure 4, it operates at 2.5 or 10 Gbit/sand could serve ~500 (possibly 1000) customer siteson each amplified PON [10]. The traffic from thelong reach PONs would terminate onto the ~100Metro Nodes which are interconnected by an opticalcore network.
Although this network can now bypass the localexchange or concentrator, it would be many yearsbefore these node locations could be eliminated fromthe network. Legacy systems, particularly those stillutilising the copper network would still need to termi-nate on them. While these nodes exist they can pro-vide a convenient place for locating and poweringthe optical amplifiers, however the amplifiers andassociated optical splitters have sufficiently lowpower consumption and are small enough so thatstreet cabinets or even underground manholes/foot-way boxes could be used to house them. This couldlead to the eventual elimination of those buildings.
This architecture would require a PON to be devel-oped with higher split, longer reach and much highercapacity than the current generation of passive opticalnetworks, but if developed it could offer many advan-tages and options for simplifying and cost reducingthe end-to-end network.
Why PON networks?There is a general assumption that point-to-point fibresolutions are a more “future proof” and therefore pre-ferred access network option, if the capital and OpExcosts compared to PON are not excessive. At firstsight this seems intuitively reasonable as there is a“fibre bandwidth” path dedicated to every customerconnected.
Historically (and particularly when considering non-optical transmission media) this argument has somevalidity, however when fibre technology is consid-ered it can be reasoned that the argument for tradi-tional point-to-point access architectures may be logi-cally flawed. This is because for any other transmis-sion technology there has always been a highercapacity, albeit more expensive, transmission tech-nology that the capacity of the access bearer technol-ogy can be multiplexed into. When point-to-pointfibre access technology is considered and each cus-tomer has in principle access to the full fibre band-width there is no “higher capacity” technology intowhich the fibre capacity can be multiplexed. With
Figure 4 By-passing the outer-core/metro with Deep Reach Access PON
Tetherless edge
Splitter
Splitter
Optical amplifiers
& splitters
10Gb/s
100 km reach
1000 customers
To core
network
Metro core
node
Radio nodes
eg. 2G, 2.5G, 3G, WLAN
Cabinet (PCP)
DP
Fibre to the cabinet (VDSL)
VDSL ONU
Cabinet (PCP)
Fibre to the home/office
protection routes
ONU
Exchanges
bypassed
ISSN 0085-7130 © Telenor ASA 2006

44 Telektronikk 2.2005
the present state of knowledge, fibre is the last of thetransmission technologies, there is nothing of highercapacity available and nothing at present envisagedto supersede it.
However if fibre is the “ultimate” transmission sys-tem it implies that the “fibre bandwidth” (or even theexploitable bandwidth) capability of point-to-pointsystems can only be delivered if the network is amesh, with every node (eg. customer) having a directfibre connection to every other node (customer) in thenetwork. This requires N(N-1)/2 links, which is ofcourse practically and economically impossible.
In practice the fibre bandwidth has to be shared if thisN2 mesh problem is to be avoided and all networksmust have concentration, multiplexing and switching/routing nodes contained within them. For traditionalpoint-to-point systems this function is performed byelectronics in the exchange nodes, the first of whichis the local exchange or Remote Concentrator Unit(RCU). In 21CN this will be the Multi-ServiceAccess Node (MSAN) site and the optical network isonly point-to-point up to this location. After this loca-tion customer traffic is multiplexed onto shared fibresso even though customers have a dedicated fibre theycannot get a “fibre’s worth” of bandwidth.
For PON systems the customers are connected bypoint-to-point fibre to the first split point, which isusually closer to the customer than the local exchangesite. This reduces the cost of fibre in the access net-work as well as sharing opto-electronic ports in theexchange. The first multiplexing function is thereforeat this first passive optical splitter node. Further split-ters introduce more passive multiplexing at the PCP(cabinet) location followed by more conventionalelectronic multiplexing in the local exchange build-ing. In the long reach access proposal the localexchange multiplexer is also a passive splitter (withsome optical gain to overcome system loss limits)and the first electronic multiplexing function isplaced at the metro or core edge node.
The question is, given that multiplexing nodes mustexist in a practical network and that fibre bandwidthgets shared over multiple customers (arising from thismultiplexing and concentration function), where arethe best geographical locations for the multiplexingfunction? Existing RCU sites are located where theyare because of the physical and economic constraintsof 100-year-old copper pair technology. Those con-straints are very different for fibre technology and itwould be very surprising if the same node locationswere optimum for fibre access networks. Point-to-point fibre systems only terminate on the RCU sitelocations because of history, not because this is the
optimum location for technical performance andeconomic reasons.
A further consideration is how efficiently infrastruc-ture capacity is used. Multiplexing increases effi-ciency by allowing customers to share infrastructure,thereby increasing the average utilisation by statisti-cal multiplexing gains. Point-to-point systems havededicated capacity to a single customer terminationwithout any ability to share that capacity when it isnot required. However PON systems can reallocateunused capacity from one customer termination toanother where there is greater demand for bandwidth,thus increasing overall utilisation and efficiency ofthe network infrastructure. This greater utilisationbegins to occur after the first split point and thereforeonly the infrastructure below that point operates atpoint-to-point efficiency. All plant above the splitpoint is more efficiently used and each subsequentsplitter stage increases utilisation further. This simplyqualitative argument suggests that placing the largesplit points as close to customers as possible willincrease overall network utilisation and efficiency.The criteria for the positioning and size of the splitpoint will depend on the customer or access nodedensity being served and the relative costs of fibrecable and splitter infrastructure. However, the advan-tages of PON over classical point-to-point systemsbecomes self-evident once it is realised that point-to-point fibre bandwidths cannot be delivered (let alonebeing required) and multiplexing must be used toshare fibre bandwidth between a number of cus-tomers in order to implement practical and economi-cally viable networks.
Some of the advantages of a PON architecture overclassic point-to-point architectures are:
• Multiplexing is performed as close to customers aspossible using low-cost passive splitters.
• Unused bandwidth resources can be dynamicallyredistributed to match customer requirements asthey arise, rather than a uniform distribution ofcapacity to all the customers regardless of demand.
• The PON architecture has intrinsic multi-cast capa-bility requiring only one copy of multi-destinationdata to be transmitted (eg. broadcast video, pushservices etc.)
• Customer line/port cards are shared minimisingnetwork termination costs.
• Long reach and lean fibre usage in the feeder/back-haul network enable node by-pass.
ISSN 0085-7130 © Telenor ASA 2006

45Telektronikk 2.2005
• The network is fibre lean, this minimises opera-tional costs associated with installation and mainte-nance of large fibre count cables, which arerequired for point-to-point fibre solutions.
The disadvantages of PONs are:
• They require a more complex protocol to operatethe network in order to keep customer traffic fromcolliding within the PON.
• The performance requirements of the optical com-ponents are more demanding and therefore initiallymore expensive.
However these are technical problems that areresolved with the normal march of technologicalprogress. Significantly more complex protocols arenow operating in millions of home PCs, and Gbit/soptical systems that a decade ago could only be con-sidered for the inner core of national networks arenow used in the low cost LAN environment. In a fewyears’ time 10 Gbit/s electronics will be used in con-sumer equipment and given volume production.10 Gbit/s optical systems can also be a low cost,mass-market technology.
Long reach accessAnalysis of the UK network suggests that an opticalaccess network with 2.5 Gbit/s to 10 Gbit/s capacity,with up to 512-way (or even 1024-way) split and100 km reach could be a very attractive option. The100 km reach would be required because such a net-work requires protection paths and mechanisms toprovide the outer core/metro network connectivity.Protection paths can be up to twice as long as the pri-mary paths. The increased split would be required tominimise the cost per customer of the long reach,protected, portion of the network and the increasedcapacity would be required to maintain the averagebandwidth per customer while serving many morecustomers. The high bandwidth would enable mas-sively increased burst capability, exploiting the statis-tical multiplexing gain by providing a “bandwidthreservoir” within the network. This would enhancethe customer experience by providing a very respon-sive and high-speed network.
The deep reach access network would effectivelybypass the metro or outer-core collector network andcould significantly reduce the cost of backhaul fromthe access node to the Metro Node. It can also pro-vide a very flexible and highly functional traffic engi-neering capability. With the right functionality builtinto the transport protocol, bandwidth could be allo-cated to customers on demand, broadcast and multi-
cast services could be offered with minimum band-width and switching functionality required in thecore. It could also act as a distributed concentratorand service switch and simplify the switch and rout-ing functions required in the Metro Node.
It would also be possible to incorporate sophisticatedmonitoring and diagnostic tools that could give earlywarnings of problems before they become trafficaffecting and also provide terminal performance,identification and location information.
Security is always an issue with shared access mediaand needs to be addressed carefully to ensure ade-quate security from eavesdropping and maliciousdamage to the network integrity. There are manyapproaches that have been considered during thedevelopment of passive optical networks.
Other advantages that the long reach access architec-ture can offer are:
• All customer types and services supported:This includes residential customers, multi-dwellingunits, SMEs and even large business sites. Existinglarger business sites already served with point-to-point fibre systems would continue to use existingaccess fibre but could also be integrated into thelong reach architecture by exploiting the wave-length domain. Individual wavelength channelscould be delivered to the largest customers and forthe large customers not needing the capacity ofdedicated wavelengths, sharing a wavelength overa number of business sites could be exploited
• Symmetrical capacity:Although asymmetrical capability could just as eas-ily be offered, large capacity PONs that serve allcustomer types will probably need to be symmetri-cal, the proportion of capacity allocated for broad-cast services can be a relatively modest fraction ofthe total capacity and the bulk of the capacity maywell need to be symmetrical for future servicerequirements.
• Guaranteed QoS:The combined access and outer-core network thatlong reach access architectures span, could provideguaranteed QoS parameters by suitable choice oftransport protocol and control system. Real timestreamed services and PSTN quality voice (withall the associated delay constraints) together withcommon packet protocols such as Ethernet and IPcould be supported.
Assuming high bandwidth demand and growth thehigh capacity of the system coupled with traffic
ISSN 0085-7130 © Telenor ASA 2006

46 Telektronikk 2.2005
management and dynamic bandwidth assignmentproduces the lowest cost per unit of bandwidth percustomer.
• Reduced capital expenditure:The major saving associated with this architecture isthe large reduction in backhaul costs that becomepossible; the costs for the access portion remain thesame if not slightly higher than conventional PONsbecause of the higher capacity of the optical networkunits. The saving in backhaul costs arise because theMetro WDM or SDH/SONET equipment is bypassed with a simple node consisting of opticalpower splitters and a few optical amplifiers. This alsomeans that these systems will also be viable in manymore of the rural and low density serving areas.
• Reduced operational costs:The potential operational savings are also signifi-cant. The UK network could be reduced to approxi-mately 100 nodes that will require staffing. In the-ory the long reach access network could by-passthe ~5500 local exchange nodes, replacing themwith simple amplifier and splitter points that couldbe located in street cabinets or manholes/footwayboxes. This could eliminate the cost of maintainingthese local exchange nodes. If fibre was installed tothe customer premises all service enhancements/changes could be implemented remotely withoutthe need for visits. This could be the ultimate in“hands off access networks” and could mean thatplant fault rates should be determined predomi-nantly by third party dig-ups, producing significantreduction in plant maintenance costs.
• Enhanced customer experience:The customer experience could also be dramati-cally enhanced by the very high burst speeds thatcould be offered. Essentially burst rates will belimited by the home/office network interfacespeeds. If these could be Gbit Ethernet speeds inthe future then customers would experience verylow delays for most applications (click and it’sthere). Even for very large file transfers such asDVD downloads the transfer times could be tensof seconds rather than hours.
An end-to-end visionCombining long reach access with photonic core net-works would lead to highly simplified networks thathave potential for significantly reducing unit costsand enabling the very high bandwidth growths pre-dicted by the more optimistic and even video centricbroadband scenarios.
Such a future network is illustrated in Figure 5. Thedeep reach access network serves a customer catch-ment area of up to 500 or 1000 sites. The traffic isterminated onto a multi-function node with function-ality for IP, ATM and TDM traffic and services ifrequired. Note this does not imply that this function-ality would be all in one box – although this would beone option – but that the functionality would be co-located at the same geographical node. Traffic fromthe long reach access networks terminating on theMetro Node would be marshalled into transport con-tainers (eg. this could be concatenated VC4-n con-tainers over SDH or any other adequate transport pro-tocol) and placed onto a wavelength channel destinedfor another Metro Node. The only circuit manipula-tion and routing that would take place in the corewould be at wavelength granularity. This wouldavoid optical to electronic conversions followed byelectronic processing and then electronic to opticalconversion for onward transmission. This functionwould only be performed in the Metro Nodes. Notethat in practice many of the optical nodes in the corewould be geographically co-located with a MetroNode containing electronic switching and routingequipment, the optical switches providing throughpath routing but logically the architecture would beas shown in Figure 5.
This end-to-end architectural proposition couldreduce a network the size of the UK to the order of100 switching/routing nodes with ~30,000 long reachaccess PONs to serve the customer base. The longreach PONs would have optical amplifying nodesrather than electronic equipment and these could beplaced in manholes or street cabinets and it is pre-dicted they would consume only 0.5 % of the electri-cal power of the equipment and buildings they wouldreplace making this also a very energy efficient andenvironmentally friendly solution.
Summary – conclusionsThe broadband era in telecommunications is going tobring new challenges to the industry. This paper hasshown that even fairly conservative scenarios forbroadband service growth can generate huge growthin demand for network capacity.
The problem for the industry is that the growth in net-work capacity and the cost of servicing that growthwill not be matched by corresponding growth in newrevenues even though the price of network capacitywill continue to decline as more capacity is provided.The paper describes a relationship between the band-width growth, the corresponding revenue growth andthe price decline of bandwidth (defined as a learningcurve). This model is then used to derive the “learn-
ISSN 0085-7130 © Telenor ASA 2006
47Telektronikk 2.2005
ing curve” required to sustain business margins for arange of future service scenarios.
The results from this analysis show that for manyfuture scenarios the learning curve required for pricedecline of bandwidth (network capacity) is not goingto be achievable if network operators rely only onhistorical equipment price declines. This leads to theconclusion that if equipment price declines cannotreduce the cost of bandwidth sufficiently to economi-cally meet the future bandwidth demand then the onlyoption will be to significantly reduce the number ofnetwork nodes, port cards and switching/routingequipment required for future network architectures.At the same time the new architectures must enablemassive increases in network capacity.
To meet the challenge of these two opposing sides ofthe business environment – slow revenue growth buthuge latent bandwidth demand – it is necessary tofind network architectures that can radically reduceunit bandwidth costs. Optical networking may offera solution, certainly it is clear from the analysisdescribed in this paper that the price decline of net-work architectures based on today’s electronic inten-sive solutions show no historical trend to be able toreduce bandwidth costs fast enough.
In the core network, all-optical networking may bethe way forward although there are still technical andmanagement issues to be resolved. In the access net-work, migrating legacy copper networks to DSLarchitectures is only a step along the road to truebroadband and as service bandwidths continue toincrease, the push to drive fibre closer to the cus-
tomer will also increase. One way of impacting thecost of providing this greater bandwidth offered by afibre rich access environment is to integrate the outer-core or metro network with the access network andcombining it with an all optical core. The long reachaccess network using high capacity amplified PassiveOptical Networks (PON) may be a solution. It canoffer higher capacities, symmetrical access at muchlower end-to-end unit bandwidth costs, than any elec-tronic intensive solution.
This network architecture addresses the problem ofthe cost of bandwidth outstripping revenue growth bymassively reducing the unit cost of bandwidth, at thesame time by radically simplifying the network it alsooffers the prospect of significantly reducing networkoperational costs. Without some such architecture toproduce much faster declines in the cost of bandwidththan conventional network solutions can produce,future bandwidth growth will necessarily be con-strained if networks are to be operated with reason-able returns on investment.
Restraining bandwidth growth however is unlikelyto be an acceptable option; the pace of developmentof low cost, high bandwidth generating equipmentshows no sign of abating. Fast transfer of large files islikely to become a necessity in the broadband future.The paper reviews some of these drivers for increas-ing broadband service demand and suggests that fibrecloser to the customer and eventually all the way isinevitable, the only question is the timescales andmechanisms by which it happens. It also argues thatthe PON architecture is an effective way of pushingfibre closer to the customer by minimising cost of
~100 grooming nodes
(ELECTRONIC)
Optical control plane
Long reach
optical access 100 km
Intelligent
photonic
inner core
network
Figure 5 An end-to-end network vision using long reach access with photonic core networks
ISSN 0085-7130 © Telenor ASA 2006

48 Telektronikk 2.2005
fibre access and making the best utilisation of net-work infrastructure. The long reach access proposaloutlined in this paper is a radical extension of thePON architecture that enables bypass of localexchanges and replacement of metro transmissionsystems. This architecture can radically reduce thecost structure of future broadband network and isbeing actively pursued as one of the options in thenext generation access working group in FSAN. Itnow remains to be seen if it can be turned into apractical reality.
References1 Payne, D B, Stern, J R. Wavelength Switched
Passively Coupled, Single Mode Optical Net-works. ECOC, Venice, October 1985.
2 Stern, J R. Optical wideband subscriber loops andlocal area networks in the UK. ICC, Amsterdam,May 1984.
3 Stern, J R et al. Passive optical networks for tele-phony applications and beyond. TPON ElectronicLetters, 23 (24), 1987.
4 Stern, J R, Hoppitt, C E, Payne, D B, Reeve, MH, Oakley, K. TPON – A Passive Optical Net-
work For Telephony. Proceedings ECOC 88,Brighton, UK, September 1988, 203.
5 Hill, A M et al. 39.5 million-way WDM broadcastnetwork employing two stages of erbium-dopedfibre amplifiers. Electronic Letts, 26 (22), 1990.
6 Forrester, D W et al. 39.81 Gb/s, 43.8 million-way WDM broadcast network with 527 km range.Electronic Letts, 27 (22), 1991.
7 ACTS PLANET project final report.ftp://ftp.cordis.lu/pub/infowin/docs/fr-050.pdf
8 Faulkner, D W et al. The Full Service AccessNetwork Initiative. IEEE Comms Magazine,April 1997.
9 Teleworking in the UK.http://www.statistics.gov.uk/articles/labour_market_trends/Teleworking_jun2002.pdf
10 Nesset, D et al. Demonstration of 100km reachamplified PONs with upstream bitrates of 2.5Gbit/s and 10 Gbit/s. ECOC 2004, Stockholm,September 2004, paper We 2.6.3.
David Payne has worked in optical technology and networks since 1978. He started at BT Labs, UK, on
single-mode fibre splicing and connectors and was instrumental in moving single-mode fibre transmission
systems to practical reality in the early 1980s. He then moved on to optical networking, with particular focus
on access networks, exploiting single-mode fibre technologies. In the mid 80s he was involved in the early
design and experiments with wavelength switching and routing networks, leading him and his colleagues to
invent the TPON (Telephony over Passive Optical Networks) concept and then further develop the PON
architecture during the late 80s and early 90s. This work resulted in an experiment in 1991 involving a 50
million way split, amplified optical network with a reach of over 500 km carrying 16 wavelengths at 2.5 Gb/s
each. The use of amplifiers led to the Super-PON idea (Passive Optical Networks employing amplifiers) to
further reduce costs for FTTH systems. In the latter part of the 1990s David became much more involved in
business and traffic modelling looking at the drivers of bandwidth that could lead to the economic justifica-
tion for large-scale deployment of optical networks. This included core networks and complete end-to-end
solutions. David Payne now runs the “Future Networks” team at BT Adastral Park, Martlesham Heath, UK.
email: [email protected]
Russell Davey graduated from Balliol College, Oxford in 1989 with a first class honours degree in Physics.
He also obtained a PhD from Strathclyde University in 1992 for his research into mode-locked erbium fibre
lasers. After an eighteen month spell working as a software engineer with Logica, he joined BT in 1994. He
was heavily involved in the first introduction and applications of WDM to the BT network. In 2001 he
obtained an MSc in Telecommunications Engineering from University College, London. Since 2001 he has
managed BT’s R&D activities in optical systems where his primary interests are in future optical access
systems. He is a regular speaker on these topics at major international conferences. He is active in the Full
Service Access Network (FSAN) initiative where he is co-chair of the next generation access task group.
ISSN 0085-7130 © Telenor ASA 2006
1 IntroductionResidential users have growing needs for all kinds oftelecommunication services, such as traditional voiceservices, but also (increasingly personalized) videoservices, fast internet, fast peer-to-peer file exchange,high-quality audio, etc. The capacities needed per ser-vice vary widely: from 64 kbit/s for traditional voicetelephony to beyond 100 Mbit/s for high-speed inter-net and data. The last link to connect to the end cus-tomer, the so-called first mile (or last mile, dependingon the point of view), may be bridged with varioustypes of transport media exploited by various network
operators. Coaxial copper cable transports broadcasttelevision and radio services, and increasingly alsodata services via cable modems. Twisted copper paircables carry voice telephony, and data services viavoice modems or high-speed ADSL and VDSLmodems. Wireless systems bring mobile voice tele-phony via the GSM standard, and also data servicesvia GPRS, UMTS, and Fixed Wireless Access (FWA).Optical fibre to the home/building is entering themarket, but still has to surpass some cost barriers. Itcan offer the full set of integrated broadband services,from broadcast high bandwidth video services to
Fibre-optic techniques for broadband access networks
T O N K O O N E N
Ton Koonen is
Professor at the
COBRA Institute,
Eindhoven
University of
Technology,
The Netherlands
The fast growth in capacity demand in access networks, driven by the increasing thirst for service
bandwidths, service variety and number of service providers, asks for ever further penetration of fibre
towards the end user residences. A number of key technologies are discussed for broadband service
delivery through fibre access nework infrastructures, encompassing multiple access techniques
exploiting the time, the frequency, and the wavelength domain. Particular attention is given to the
currently most popular time division multiple access techniques in passive optical networks (APON,
EPON, GPON), and to subcarrier multiplexing in hybrid fibre coaxial networks. Also some trends in access
network research are highlighted, in partular dynamic network reconfiguration by means of optical
routing, and fibre-wireless network techniques for meeting the booming needs of wireless services.
Medium Bearer service Bitrate (down/up) Reach (km)
Twisted pair analogue line rates up to 56 k / 56 kbit/s
Twisted pair ISDN 144 k / 144 k data incl. 64 k / 64 k bit/s
voice or data circuits <6
Twisted pair SDSL 768k / 768 kbit/s <4
Twisted pair ADSL 1.5 M to 6 M / 64 k to 640 kbit/s <4 to 6
Twisted pair VDSL 26 M to 52 M / 13 M to 26 Mbit/s <0.3 to 1
Coaxial cable CDMA/OFDM <14 M / 14 M (net 8.2 M) bit/s in 6 MHz slot
+ QAM/QPSK
Fibre (single mode) ATM 150 M to 622 M / 150 M bit/s shared up to 1:32 <20
(FSAN ATM-PON); up 1.24 G / 620 Mbit/s
(FSAN/ITU B-PON)
Fibre (single mode) Gbit Ethernet 1 Gbit/s (1.25 Gbit/s 8 B/10 B coded) <5
Fibre (multi mode) Gbit Ethernet 1 Gbit/s (1.25 Gbit/s 8 B/10 B coded) <0.55
Wireless (mobile) GSM 13 kbit/s (at carrier freq. 900 and 1800 MHz, <16
freq. duplex)
Wireless (mobile) GPRS 115 kbit/s
Wireless (mobile) UMTS 144 k to 2 Mbit/s (at carrier freq. 2110–2200 /
1885–2025 MHz, freq. duplex)
Wireless (fixed) MMDS 6 Mbit/s (at carrier freq. >17 GHz)
Wireless (fixed) LMDS 45 Mbit/s (at carrier freq. >17 GHz)
Table 1 First-mile network technologies
49Telektronikk 2.2005 ISSN 0085-7130 © Telenor ASA 2005

50 Telektronikk 2.2005
Gigabit Ethernet data services. A list of first-milemedia with the bearer services, bitrates and reach isgiven in Table 1. The need for more bandwidth in theaccess network is growing continuously, due to theincreasing amount of bandwidth required by eachcustomer, mainly fueled by video-based services andhigh-speed internet, the tailoring of services to indi-vidual customer needs, and the emergence of morecompeting operators due to liberalisation. This spursthe introduction of optical fibre (mainly single modefibre, being a future-proof solution with its virtuallyinfinite bandwidth) into the access network. As thenetwork installation and equipment costs of fibre-to-the-home (FTTH) are still quite high in comparisonto the traditional copper wired access lines, hybridfibre access networks are the first step to introducefibre. Fibre is used in the upper feeder part of theaccess network. There it runs from a local exchange(headend station) to a cabinet along the street (fibre-to-the-cabinet, FTTCab) or to the basement of abuilding (such as an apartment building with manyliving units; fibre-to-the-building, FTTB). At thatpoint, the optical signals are converted back into elec-trical ones which are then brought via copper-basedfirst mile links or wirelessly to the end customers.
In the next sections, after discussing some basic fibre-optic access network topologies and basic multipleaccess mechanisms, time- and frequency-slottedaccess techniques will be discussed in more depthwhich have been developed and are currentlydeployed for point-to-multipoint networks. Sub-sequently, some techniques which are still in theresearch labs for next-generation fibre access net-works will be discussed: wavelength routing fordynamic capacity allocation, and radio over fibre foroffering broadband wireless services. Finally, someconcluding remarks are made and speculativeprospects for the more distant future are given.
2 Fibre access networkarchitectures
Basically, three architectures may be deployed for thefibre access network:
1 Point-to-point topology, where individual fibresrun from the local exchange to each cabinet, homeor building. Many fibres are needed, which entailshigh first installation costs, but also provides theultimate capacity.
2 Active star topology, where a single fibre carries alltraffic to an active node close to the end users, fromwhere individual fibres run to each cabinet/home/building. Only a single feeder fibre is needed, anda number of short branching fibres to the end users,
which reduces costs; but the active node needspowering and maintenance.
3 Passive star topology, in which the active node ofthe active star topology is replaced by a passiveoptical power splitter/combiner that feeds the indi-vidual short branching fibres to the end users. Inaddition to the reduced installation costs of a singlefibre feeder link, the completely passive outsideplant avoids the costs of powering and maintainingactive equipment in the field. This topology hastherefore become quite popular for introduction ofoptical fibre into access networks, and is widelyknown as the Passive Optical Network (PON).
In the point-to-point topology and the active startopology, each fibre link is carrying a data streambetween two electro-optic converters only and thetraffic streams of the users are multiplexed at theseterminals, so there is no risk of collision of opticaldata streams. In the point-to-multipoint passive starPON topology, however, the traffic multiplexing isdone optically by merging the data streams at thepower combiner. Collision of the individual datastreams needs to be avoided by well-designed multi-ple access techniques.
3 Multiple access techniques inPONs
The common fibre feeder part of the PON is sharedby all the optical network units (ONUs) terminatingthe branching fibres. The traffic sent downstreamfrom the optical line terminal (OLT) at the localexchange is simply broadcast by means of the opticalpower splitter to every ONU. Sending traffic from theONUs upstream to the local exchange, however,requires accurate multiple access techniques in orderto multiplex collision-free the traffic streams gener-ated by the ONUs onto the common feeder fibre.Four major categories of multiple access techniquesfor fibre access networks have been developed:
• Time Division Multiple Access (TDMA)• SubCarrier Multiple Access (SCMA)• Wavelength Division Multiple Access (WDMA)• Optical Code Division Multiple Access (OCDMA)
3.1 TDMA
In a TDMA system, as shown in Figure 1, theupstream packets from the ONUs are time-inter-leaved at the power splitting point, which requirescareful synchronisation of the packet transmissioninstants at the ONUs. This synchronisation isachieved by means of grants sent from the localexchange, which instruct the ONU when to send apacket. At the local exchange in the OLT, a burst
ISSN 0085-7130 © Telenor ASA 2005

51Telektronikk 2.2005
mode receiver is needed which can synchronise quick-ly to packets coming from different ONUs, and whichcan also handle the different amplitude levels of thepackets due to differences in the path loss experi-enced.
TDMA techniques are deployed in ATM-PON,Ethernet PON and Gigabit PON architectures.
3.2 SCMA
In an SCMA system, illustrated in Figure 2, eachONU modulates its packet stream on a different elec-trical carrier frequency, which subsequently modulatesthe light intensity of the ONU’s laser diode. Thepacket streams are thus put into different frequencybands, which are demultiplexed again at the localexchange. Each frequency band constitutes an inde-pendent communication channel from an ONU to theOLT in the local exchange and may thus carry a sig-nal in a format different from that in another channel(e.g. one channel may carry a high-speed digital datasignal, and another one an analogue video signal). Notime synchronisation among the channels is needed.The laser diodes at the ONUs may have nominallythe same wavelength. When the wavelengths of the
lasers are very close to each other, the frequency dif-ference between them may result in beat noise prod-ucts due to optical beating at the photodetector in thereceiver. These noise products may interfere with thepacket data spectrum. The wavelengths of the laserdiodes have to be adjusted slightly differently (e.g.by thermal tuning) in order to avoid this optical beatnoise interference.
Subcarrier multiplexing techniques are beingdeployed in hybrid fibre-coax CATV networks.
home
building
cabinet
t
Rx
data 1
data 2
data 3
time
demux
Figure 1 TDMA passive optical network
home
building
cabinet
t
ff1
f f.
data 1
data 2
data 3
data 1
data 2
data 3t
P
P
P
data 1
λ0
2 3
λ0
λ0
t
t
f3
f2
f1
Rx
Electr
Rx
Electr
Rx
Electr
Rx
freq.
demux
Figure 2 SCMA passive optical network
home
building
cabinet
t
λ1
data 1
data 2
data 3
data 1
data 2
data 3
t
P
P
P
data 1
λ2
2 3
λ1
λ3
t
t
f3
f2
f1
Rx
WDM
demuxRx
Rx
λλ
WDM
demux
λ
Figure 3 WDMA passive optical network
ISSN 0085-7130 © Telenor ASA 2005
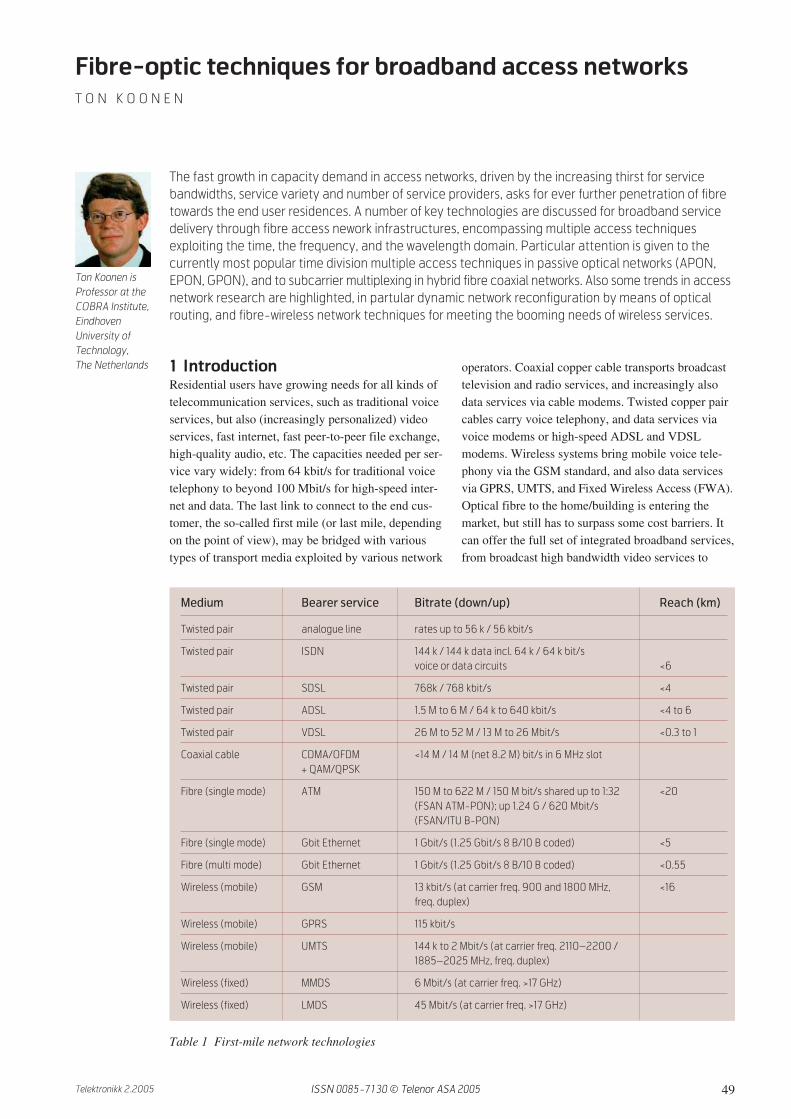
52 Telektronikk 2.2005
3.3 WDMA
In a WDMA system (see Figure 3), each ONU usesa different wavelength channel to send its packets tothe OLT in the local exchange. These wavelengthchannels constitute independent communicationchannels and may thus carry different signal formats;also no time synchronisation is needed. The samewavelength channel may be used for upstream com-munication as for downstream. The isolation require-ments of the wavelength demultiplexer should behigh to sufficiently suppress crosstalk, e.g. whenhigh-speed digital data and analogue video are carriedon two different wavelength channels. The channelrouting by the wavelength multiplexer at the networksplitting point prohibits broadcasting of channels toall ONUs, as needed for instance for CATV signaldistribution; a router bypass needs to be implementedfor that. Every ONU needs a wavelength-specificlaser diode, which increases costs and complicatesmaintenance and stock inventory issues. An alterna-tive is to use a light source with a broad spectrum atthe ONU (e.g. a superluminescent LED), of which thein-field multiplexer cuts out the appropriate part ofthe spectrum. This “spectral slicing” approachreduces the inventory problems, but also yields areduction of the effective optical power availablefrom the ONU and increased intensity noise due tospectral instabilities of the source, and thus limits thereach of the system. Another alternative is to use areflective modulator at the ONU, which modulatesthe upstream data on a continuous light channel emit-ted at the appropriate wavelength by the OLT andreturns it to the OLT [1]. Thus no light source isneeded at the ONU, which eases maintenance; butagain the power budget is limited.
3.4 OCDMA
In an OCDMA system, each ONU uses a different sig-nature sequence of optical pulses, and this sequenceis on-off modulated with the data to be transmitted.The duration of the sequence needs to be equal to thatof a data bit, and thus a very high-speed signaturesequence is needed to transmit moderate-speed data.This limits the reach of the system due to theincreased impact of dispersion and the decreasingpower budget at high line rates. In the OLT at thelocal exchange, the received signals are correlatedwith the known signature sequences, in order to de-multiplex the data coming from the different ONUs.As the signature codes may not be perfectly orthogo-nal, some crosstalk may occur.
3.5 Comparison of multiple access
techniques
TDMA systems have received the most attention forbroadband access networks, as they are most suitedfor high-speed data transmission at relatively moder-
ate complexity, and the required digital signal pro-cessing can be readily accommodated in electronicintegrated circuits. Three types of TDMA passiveoptical networks have been addressed extensively instandardisation bodies: the ATM PON (APON) car-rying native ATM cells following the G.983 standardseries of ITU-T SG15, the Ethernet PON (EPON)carrying Gigabit Ethernet packets in IEEE 802.3, andrecently the Gigabit PON (GPON) able to carry ATMas well as Ethernet packets with high line rates andhigh efficiency (up to 2.4 Gbit/s up- and downstream)in the G.984 standard series.
Subcarrier multiplexing is particularly attractivefor downstream broadband broadcasting, such asin hybrid fibre-coax CATV networks. In upstreamdirection, broadband communication in individualseparate frequency bands requires a quite extendedfrequency range and high linearity of the user equip-ment, plus additional precautions need to be taken toavoid beat noise interference. Hence, SCMA is notcommonly deployed in interactive fibre access net-works.
WDMA offers the most powerful solution for multi-ple access, as it creates a virtual point-to-point topol-ogy. It is, however, also the most costly due to theadditionally required wavelength selective functions.Some cost reductions may be achieved by using‘colourless’ ONU techniques, such as a reflectivemodulator (e.g. reflective semiconductor amplifier)cooperating with a remote source, or spectral slicingof a broadband source. Using wavelength-baseddynamic optical routing, very flexible future-proofaccess networks can be implemented, which canreadily accommodate service upgrades, reallocationof traffic capacity, etc. Dynamic WDMA is an attrac-tive solution for next-generation access networks,being addressed in research (see section 6).
OCDMA puts high speed requirements to the electro-optical terminals, due to the line rate being a multipleof the data rate. This leads to costly terminal equip-ment, and hence has not become popular for fibre-optic access networks.
4 TDMA PON systems
4.1 ATM PON
The Full Service Access Network (FSAN) group, acommittee of presently 21 major telecommunicationoperators around the world, has since 1995 been pro-moting the ATM PON (also termed APON or BPON)for broadband access networks.
ISSN 0085-7130 © Telenor ASA 2005

53Telektronikk 2.2005
4.1.1 ATM PON system architecture
As laid down in the G.983.1 Recommendation ofITU-T [2], an ATM PON may have a downstreambitrate of 155 or 622 Mbit/s and an upstream one of155 Mbit/s. The maximum optical splitting ratio is32 (may grow to 64), and the maximum fibre lengthbetween the OLT in the local exchange and an ONUis 20 km. The range in which this length is allowed tovary is from 0 to 20 km. Standard single mode fibre(G.652) is foreseen. Coarse wavelength multiplexingis used for separating the bi-directional traffic: thedownstream traffic is positioned in the 1.5 µm wave-length band, and the upstream traffic in the 1.3 µmband (using cheap Fabry Perot laser diodes in theONUs).
In the downstream direction of a 155 Mbit/s down /155 Mbit/s up system, 54 ATM cells of 53 bytes eachare fitted together with 2 PLOAM cells (PhysicalLayer Operation, Administration, and Maintenance)of 53 bytes in a frame [2]. The PLOAM cells contain53 upstream grants each. A grant permits an ONU tosend an ATM cell. By sending these grants, the OLTcontrols at each ONU the transmission of the up-stream packets, and can therefore assign dynamicallya portion of the upstream bandwidth to each ONU. Ina 622 Mbit/s down / 155 Mbit/s up system, a framecontains four times as many cells (i.e. 216 ATM cellsand 8 PLOAM cells). The downstream frame is broad-cast to all ONUs. An ONU only extracts those cellsthat are addressed to it.
In the upstream frame, both for the 155 Mbit/s down /155 Mbit/s up system and for the 622 Mbit/s down /155 Mbit/s up system, 53 ATM cells are fitted of 53bytes each plus an overhead of 3 bytes per cell. Thisoverhead is used as guard time, as a delimiter and aspreamble for supporting the burst mode receiver pro-cess in the local exchange.
The power budgets needed to bridge the fibre lossesand the splitter losses are denoted by three classes ofoptical path losses: class A 5-20 dB, class B 10-25dB, and class C 15-30 dB. At the ONU, a launchedoptical power of -4 to +2 dBm is specified for classB, and -2 to +4 dBm for class C [3]. The ONUreceiver sensitivity at 155 Mbit/s should be betterthan -30 dBm for class B, and -33 dBm for class C.
The ONUs are usually positioned at different dis-tances from the local exchange. Therefore theupstream transmission of the packets from each ONUshould be carefully timed, in such a way that thepackets do not collide at the network splitter [2] [5].The OLT has to measure the distance to each ONUfor this, and then instructs the ONU to insert anequalising transmission delay such that all distances
from the ONUs to the OLT are virtually equal to thelongest allowable distance (i.e. 20 km); see Figure 4.To measure the distance to each ONU, the OLT emitsa ranging grant to each ONU, and on receipt the ONUreturns a ranging cell to the OLT. In this distanceranging process, the OLT can deduce the distance toeach ONU from the round trip delay.
Each ONU sends an upstream cell upon receipt of agrant. Because the path losses from each ONU to theOLT may be different, the power of the cells receivedby the OLT may vary considerably from cell to cell.The burst mode receiver at the OLT should thereforehave a wide dynamic range, and should be able to setits decision threshold quickly to the appropriate levelto discriminate the logical ones from the zeros. Alsothe power of the ONU transmitter can be varied overa certain range to limit the requirements on thereceiver’s dynamic range. In this amplitude rangingprocess, the overhead to each ATM cell is used forsupporting the fast decision threshold setting at theOLT burst mode receiver and the power adaptationat the ONU burst mode transmitter.
4.1.2 Network protection
Four types of network protection have been describedin Recommendation G.983.1 [5], as shown in Figure5. Type A protection involves protection of the feederfibre only by a spare fibre over which the traffic canbe rerouted by means of optical switches. After detec-tion of a failure in the primary fibre and switch-overto the spare fibre, also re-ranging has to be done bythe PON transmission convergence (TC) layer. Thusonly limited protection of the system is realised.Mechanical optical switches are used up till now;when optical switching becomes cheaper, this protec-tion scheme may become more attractive. Type B pro-tection features duplication of both the feeder fibreand the OLT. The secondary OLT is on cold standby,and is activated when the primary one fails. Due to thehigh sharing factor of the duplicated resources by the
time
distance
grant
OLTOLT
responses
without
equalisation longest
distance
equalisation
delay
inserted
ONU1
ONU2
ONU3
responses
with
equalisation
Figure 4 Time ranging in a TDMA PON
ISSN 0085-7130 © Telenor ASA 2005

54 Telektronikk 2.2005
ONUs, this approach offers an economical yet limitedprotection. Type C protection implies full duplicationof the PON, and all equipment is normally working,which allows fast switch-over (within 50 ms) from theprimary equipment to the secondary one. The branchfibres as well as the ONUs are protected; also a mix ofprotected and unprotected ONUs can be handled.Type D protection features independent duplication ofthe feeder fibres and the branch fibres. It cannot offerfast restoration. It is less attractive than C, as itrequires more components but not a better functional-ity. In summary, types B and C are the most attractiveschemes in G983.5.
4.1.3 Extensions of ATM PON
To further increase the speeds laid down in Recom-mendation G.983.1, research has been done into 622,1244 and 2488 Mbit/s line rates, both for upstreamand downstream. A key technical issue is the devel-opment of faster burst-mode circuitry to adequatelyretrieve the timing and set the decision thresholdlevel, which becomes increasingly more difficult athigher line rates. Operation of 622 Mbit/s burst-modecircuitry has been achieved recently [3]. In January2003, ITU set standards for Gigabit-capable PONs(G-PONs). Further details are given in section 4.3.
The G.983.1 ATM PON was initially mainly de-signed for high-speed data communication. However,in the residential access networks there is also a cleardemand for economical delivery of CATV services,for which subcarrier multiplexing techniques arequite appropriate. In the enhanced RecommendationG.983.3 [3], room has been allocated in the opticalspectrum to host video services or additional digitalservices next to the ATM PON services. As shown inFigure 6, the APON upstream services remain in the1260 to 1360 nm band (as in G.983.1), but the bandfor downstream services is narrowed to 1480–1500nm (1480–1580 nm in G.983.1). Next to those, anenhancement band for densely wavelength multi-plexed bi-directional digital services (such as privatewavelength services) is foreseen, or an enhancementband for an overlay of video delivery services. Thelatter is used in downstream direction only, and co-incides with the C-band as economical erbium-doped
OLT
ONU 1
LT
ONU N
.
.
spare
fibre
optical
switch
LT
LT
ONU 1
LT
ONU N
.LT
LT
LT
OLT
ONU 1
LT
ONU N
.
.
LT
LT
LT
OLT
LT
LT
ONU 1
LT
ONU N
.LT
LT
LT
OLT
LT
LT
.
.
.
.
Figure 5 PON protection schemesType A: Feeder fibre protection; Type B: OLT and feeder fibre protection; Type C: Full PON duplicationType D: Independent duplication of feeder and branch fibres
Figure 6 WDM enhancement G.983.3
Customer premises
1:32
L -band
1260 1360 1480 1500 1539 1550 15601565
Wavelength (nm)
APON
OLT
EOLT
APON
ONULocal exchange
L -band
APON
upstream
for future
use
for future
use
Enhanced band
(option 1):
additional digital
service
Enhanced band
(option 2):
video distribution
APON
downstream
WDM
WDM
EONU
ISSN 0085-7130 © Telenor ASA 2005
55Telektronikk 2.2005
fibre amplifiers can thus be deployed for the powerboosting required. When positioning an overlay ofCATV distributive services in the C-band, stringentcrosstalk requirements have to be put on the wave-length multiplexers and demultiplexers, to preventnoticeable interference of the CATV signals into thedigital ATM signals, and vice versa [4].
In order to further improve the economics of ATMPON systems, an extended PON system with anincrease of the network splitting factor to 128 andeven 256 has been developed, while still maintaininga passive outside plant and compatibility withG.983.1 compliant ONUs [5]. This extended splitis achieved by creating a larger optical power budget.In the downstream direction, at the OLT a high powerlaser diode or an erbium-doped fibre amplifier(EDFA) is used to boost the power. In the upstreamdirection, the sensitivity of the burst-mode receiver isimproved by applying an avalanche photo diode(APD). Also eight single-mode feeder fibres (eachfeeding a 1:16 or 1:32 power splitter in the field) areat the OLT coupled to a multimode fibre yielding alow-loss coupling to the receiver.
Even further extensions of the split factor and of thereach of an ATM PON have been realised in the Super-PON system [6]. An extension to a splitting factor of1:2048 has been achieved; this however needs activeequipment in the field. In the downstream directionexploiting the 1530–1560 nm wavelength window,EDFAs are used for overcoming the large path losses.In the upstream direction, gated semiconductor opticalamplifiers (SOAs) are deployed. Each SOA gate isopened when upstream packets arrive, and is shut other-wise in order to avoid funneling of the amplified sponta-neous emission noise towards the OLT. This SuperPONapproach is not compliant with present standards, andmay be economically feasible only in the long term [5].
OLT User 2
User 1
User 3
2
payload headerFCS
IEEE 802.3 packet
2
Optical
splitter
22
3
1
ONU3
ONU2
ONU1
1
1 1
3
Figure 7 Downstream traffic in an EPON
OLT ONU2
ONU3
payload headerFCS
IEEE 802.3 packet
ONU1
User 2
User 1
time slot
1 3
Optical splitter
User 3
time slot
1 2 2 2 2 2 2 2 2
1 1
33
1
1
Figure 8 Upstream traffic in an EPON
4.2 Ethernet PON
With the rapid penetration of Ethernet-based services,Ethernet PON (EPON) techniques are receivingincreasing attention and are promoted by the IEEE802.3 Ethernet in the First Mile (EFM) group. Themajor difference from ATM PONs is that an EPONcarries variable-length packets up to 1518 bytes inlength, whereas an ATM PON carries fixed-length 53bytes cells. This ability yields a higher efficiency forhandling IP traffic. The packets are transported at theGigabit Ethernet 1.25 Gbit/s speed using the IEEE802.3 Ethernet protocol.
The EPON features full-duplex transmission similarlyto the ATM PON, with downstream traffic between1490 and 1510 nm and upstream traffic at around1310 nm. As shown in Figure 7, standard IEEE 802.3Ethernet packets are broadcast downstream by theOLT to all the ONUs. Each ONU inspects the head-ers, and extracts the packets that are addressed to it.Several variable-length packets are put into a fixed-length frame of 2 ms duration, and each frame beginswith a one-byte synchronisation marker. In theupstream direction, also 2 ms frames are used. Aframe contains time slots that each are assigned to
ISSN 0085-7130 © Telenor ASA 2005
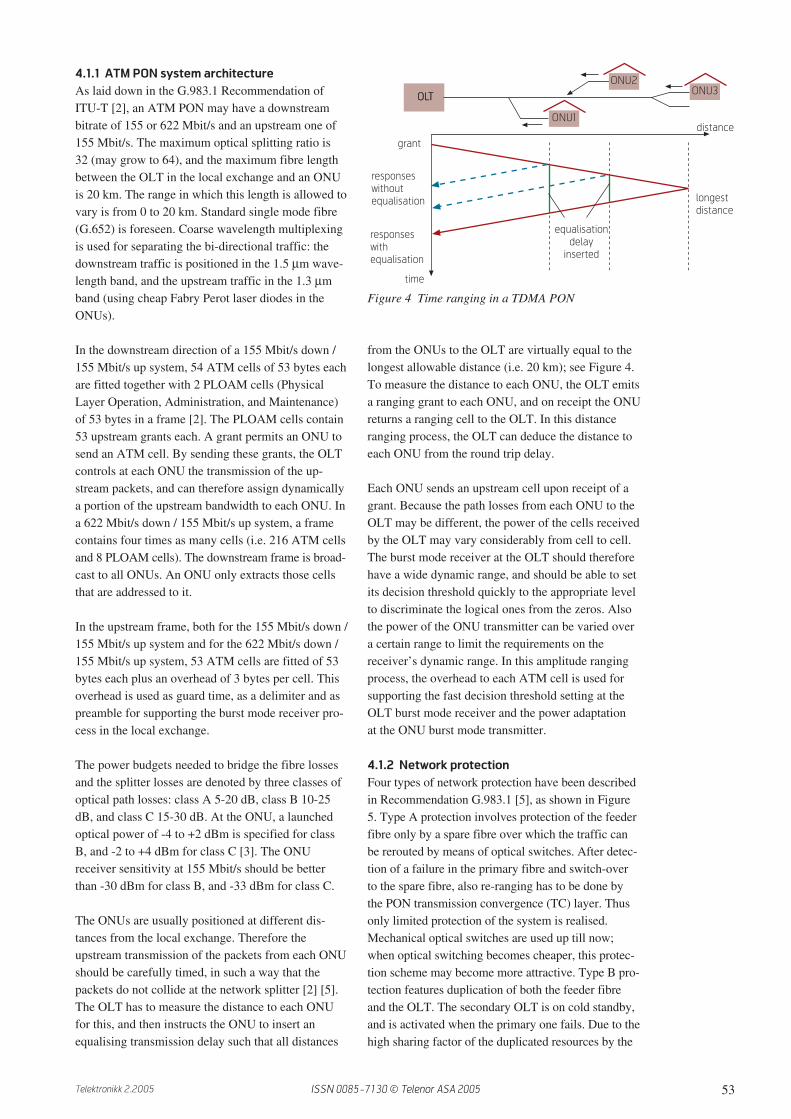
56 Telektronikk 2.2005
one of the ONUs (see Figure 8). Each ONU puts oneor more of its upstream variable-length IEEE 802.3packets into a time slot; if it has no packets to send,the time slot may be filled with an idle signal. Nopacket fragmentation takes place. The time slot over-head consists of a guard band and indicators for tim-ing and signal power. The OLT thus allows only oneONU to send at a time, and no collisions occur. Thetime slot size is 125 or 250 µs.
4.3 Gigabit PON
In order to extend the capacity of PONs into theGbit/s arena, the ITU has set standards for the GigabitPON (GPON) in the G.984.x series. The GPON archi-tecture, set in Recommendation G.984.1, is muchalike the ATM PON one: the maximum optical split-ting ratio is 128, and the maximum fibre reach fromOLT to ONU is 20 km whereas its minimum is 0.Protection schemes have also been foreseen, similarto those shown in Figure 5.
The GPON Physical Media Dependent layer has beenset in G.984.2; it includes downstream line rates of1244.16 or 2488.32 Mbit/s, in the wavelength range
1480–1500 nm. In upstream direction, line rates fore-seen are 155.52, 622.08, 1244.16, or 2488.32 Mbit/s,in the wavelength range 1260–1360 nm.
In GPON Transmission Convergence Recommenda-tion G.984.3, a framing format of 125 µs length isused which can host a lot of different packetisedtraffic formats. This GPON Encapsulation Method(GEM) may host Ethernet packets, and/or nativeATM packets, and/or native TDM, as illustrated inFigure 9 [7]. Thus, a GPON system may operate inan Ethernet-packet-only mode, or in an ATM-onlymode, or in a mixed mode. Ethernet frames may befragmented among a number of GEM cells, which isnot possible in the native IEEE 802.3 technology.Hence, GPON using GEM can obtain a high effi-ciency for transport of IP data payload by utilizingup to 95 % of the available bandwidth in the trans-mission channel.
GPON also supports Quality of Service, as it enablesService Level Agreement (SLA) negotiations be-tween the OLT and the ONU through the ONU Man-agement and Configuration Interface set out in G.984.4.
fibres
coax
0 50 500 ~ 900
fibres
O/E
Fibre
nodeRF
node
ca. 2000
customers
ca. 500
customersca. 100 k
customers
max. 3 ampl.
5-15 km
CATV
signals
telephony
/data
down
CATV
up
tel.
down
tel., VoD
f (MHz)
signal
spectrum
CATV
head end
or HUB
cable modem
TV
down
CATV
Figure 10 Hybrid fibre coax network
TDM
FCS
GEM header
GEM fragment payloadPLI
12 bits
Payload length
indicator
Port-ID
12 bits
HEC
13 bits
PTI
3 bits
Ethernet payloadMAC SAType/
lengthFCS
Payload type
indicator
MAC DA
Figure 9 GPON encapsulation method according to ITU-T Rec. G.984.3
ISSN 0085-7130 © Telenor ASA 2005
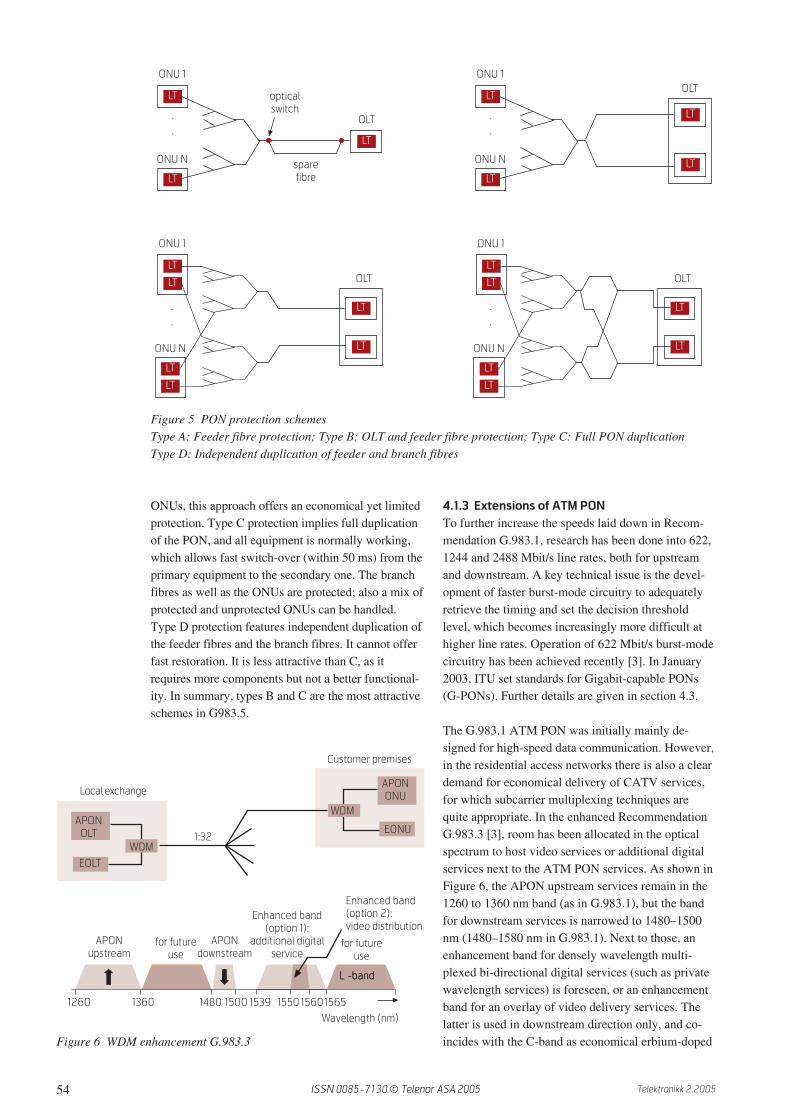
57Telektronikk 2.2005
4.4 Comparison of TDMA systems
By using ATM techniques, ATM PON offers built-inQuality of Service for all traffic classes, whereasEPON through using native Ethernet does not. EPONthus cannot support voice services with quality of ser-vice as provided in the traditional public switchedtelephone network (PSTN), and also the support ofreal-time services still has issues due to latency andpacket jitter. On the other hand, ATM suffers fromthe cell tax (5 bytes header per 53 bytes cell), andthus EPON is more efficient and simple for transport-ing variable length IP packets. The recently intro-duced GPON can carry ATM as well as Ethernet traf-fic in any mixed mode, with high efficiency, andhence may nicely combine the QoS advantages ofATM with the efficiency of Ethernet.
5 Hybrid fibre coax networksCATV networks are usually laid out over large geo-graphical areas and are mainly designed for down-stream broadcasting of analogue TV channels (or dig-ital TV channels, multiples of which fit into one ana-logue TV channel frequency slot) that are frequency-division multiplexed in a carrier frequency gridextending up to 1 GHz. As shown in Figure 10, ina hybrid fibre coax (HFC) system a CATV headendstation collects the CATV signals, remodulates theminto a specific frequency grid, and sends them via sin-gle-mode fibres to fibre nodes. Each fibre node con-verts the composite optical signal into an electricalone, which is carried via a coaxial cable networkincluding several RF amplifiers to the residentialhomes. A single headend may thus serve hundreds
laser
Σ
LO 1
(VCO)
f
f
LO i
LO j
LO N
f
f
photodiode
LO
amplifier
selected channel
amplifier
+ filter
fibre
f
f f
Transmitter
Receiver
x
x
x
amplifier
+ filter
x
x
baseband
analogue
passband
analogue
baseband
digital
passband
digital
of thousands of customers, and a fibre node somethousands of customers. In particular during transmis-sion in the coaxial cable network, the signal qualitydeteriorates due to the addition of noise from theelectrical amplifiers and intermodulation productsfrom non-linearities in the system. On the fibre partof the network, the signals are carried with subcarriermultiplexing; see Figure 11. Each TV channel isamplitude-modulated on a separate frequency, andafter summing all these modulated signals, a highlylinear high power laser diode (or laser diode followedby a linearised external modulator) generates an opti-cal signal which is intensity-modulated with the com-posite CATV signal. At the receiver site, the opticalsignal is converted into the electrical CATV signal bymeans of a highly linear PIN photodiode, and subse-quently the signal can be passed to the coaxial cablenetwork or to a selective receiver. When using a laserdiode with low relative intensity noise and high lin-earity (or followed by a carefully linearised externalmodulator), the CATV signal can be transported withvery little loss of quality. If a 1.5 µm wavelengthlaser diode is used, erbium-doped fibre amplifiers canbe used to boost the power at the headend and tocompensate for the splitting losses; thus very exten-sive networks feeding thousands of ONUs can berealised. In this wavelength region, however, withdirect laser modulation second order intermodulationproducts may arise due to laser chirp in combinationwith fibre chromatic dispersion; with an externalmodulator, however, the chirp is small enough toavoid these intermodulation products.
The CATV signal quality that can be maintained inHFC networks is very high due to the fibre’s lowlosses and high bandwidth in comparison with coax-ial cable. Therefore in HFC networks fibre is gradu-ally brought deeper into the network, and fibre nodeshave to serve fewer customers through a coaxialcable network of limited size (i.e. mini fibre nodes,each serving in the order of around 40 customers).
Figure 11 Subcarrier multiplexing
ISSN 0085-7130 © Telenor ASA 2005
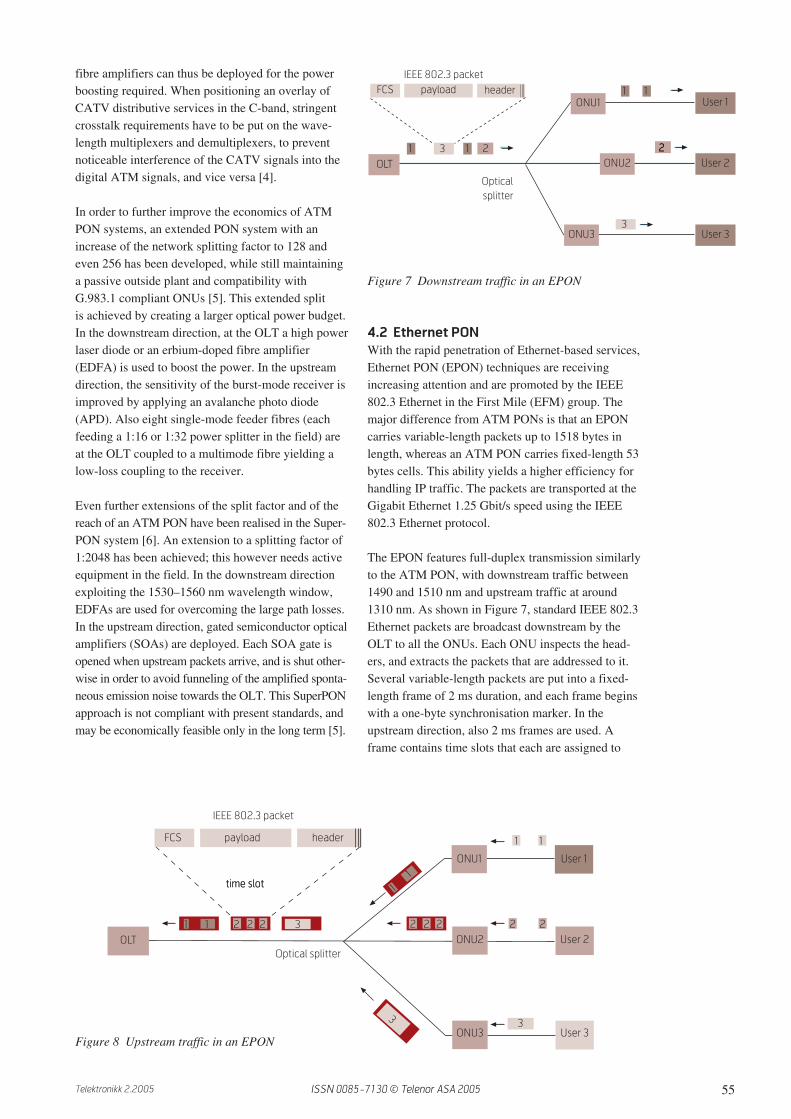
58 Telektronikk 2.2005
HFC networks are nowadays not only carryingCATV and FM radio broadcast services, but cableoperators are also exploiting them for voice telephonyand data transport by using cable modems. For theupstream traffic which is involved with these interac-tive services and which is carried upstream in SCMAmode, parts of the spectrum unused for CATV andFM radio broadcast can be used. In Europe, typicallythe 5 to 65 MHz band is used for this; in the US, the5–42 MHz range. For downstream data, e.g. the 300to 450 MHz range is used, taking into account thatInternet traffic is usually highly asymmetric (muchmore downloading traffic than uploading). Down-stream per 8 MHz CATV channel, 30 to 50 Mbit/sdata can be accommodated deploying 64 or even 256Quadrature Amplitude Modulation (QAM). Upstreamdue to ingress noise less complicated modulationschemes are to be used; DQPSK offers about 3 Mbit/sper channel.
6 Dense wavelength multiplexing inaccess networks
In general, access networks have to meet a fastgrowth in capacity demand for several reasons. Cus-tomers are asking for second and more telephone
lines; internet data traffic is booming with higher datarates, more users and longer sessions on-line (evenalways on); intense peer-to-peer file transfer traffic;multiplayer on-line gaming; an increasing amount ofvideo-based services; fast growth in number ofmobile phone users and session frequency; new oper-ators entering asking to rent capacity on existingaccess networks; etc. This hunger for more capacityand the strive for convergence of services on a singlenetwork can most adequately be met by bringingfibre ever closer to the end users, from where only ashort copper cable based (or wireless) link has to bebridged to reach the customer. Ultimately, wheninstallation and equipment costs have come downsufficiently, the most powerful network is achievedwhen fibre is running all the way to the customer’shome (fibre to the home, FTTH).
Upgrading installed fibre plant to higher capacitieswhile protecting the investments already made canefficiently be done by introducing wavelength multi-plexing techniques [8]. Wavelength channels may beallocated to specific sets of services (for service un-bundling), and/or to separately host (new) serviceoperators (leasing of network capacity).
6.1 Dynamic capacity allocation by flexible
wavelength assignment
To cope with variation in service demand by the usersand the sometimes quickly changing operator condi-tions, it is efficient to flexibly allocate the augmentedavailable network capacity across the access network.Dynamic wavelength routing techniques can be usedfor this, thus making more efficient use of the net-work’s resources and generating more revenues. Fig-ure 12 illustrates the principle: from the OLT in theheadend station of the network, multiple wavelengthchannels are fed to the ONUs via a tree-and-branchPON. By wavelength-selective routing in the PON, orwavelength selection at the ONU, wavelength chan-nels can be assigned to a number of specific ONUs.Thus capacity can be specifically shared betweenthese ONUs. Each ONU subsequently transfers itscapacity share to its first-mile electrical network con-
Network
optical
λ-layer
Network
electrical
first-mile layer
fibre
headend
HE
ONU
ONU
ONU
λ1- λ
N
λx
λy
tunable
λ-routerHE
ONU
λ-tunable
ONU
ONU
OA
λ1- λ
N
λ1- λ
N
λ1- λ
N
Figure 13 Dynamically allocating wavelength channels to ONUs
Figure 12 Dynamic wavelength routing in hybridaccess networks
a) flexible wavelength routing b) broadcast-and-select
ISSN 0085-7130 © Telenor ASA 2005
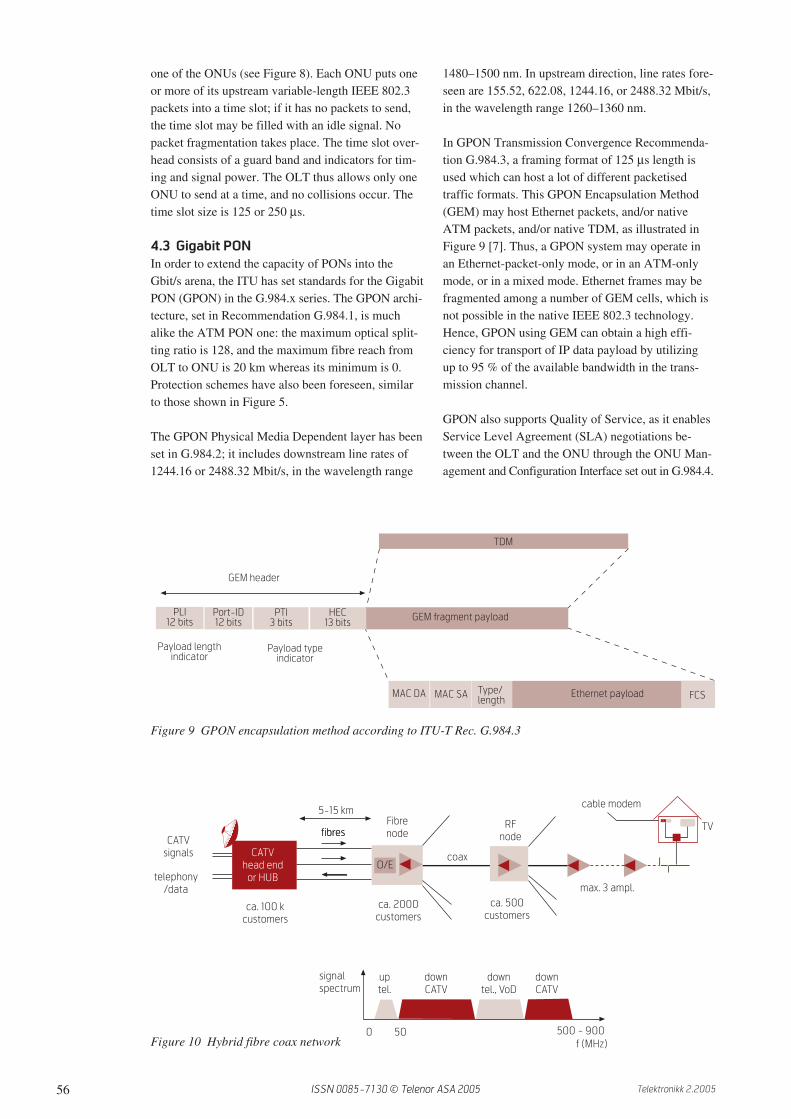
59Telektronikk 2.2005
necting the end users. The mapping of the networkcapacity resources to the first-mile networks can thusbe changed by changing the wavelength channelassignment among the ONUs. Basically twoapproaches can be followed for this, as illustrated inFigure 13: a wavelength router in the field, or wave-length selection at the ONUs. As shown in Figure13.a, a tunable wavelength router directs the wave-length channels to specific output ports, and this rout-ing can be dynamically adjusted by external controlsignals from the headend. In order to also support thedelivery of broadcast services to all ONUs, extra pro-visions have to be made for enabling broadcast wave-length channel(s) to bypass the router. As the wave-length channels are routed to only those ONUs whosecustomers require the associated services, no opticalpower is wasted. As shown in Figure 13.b, anotherapproach is to broadcast all wavelength channels toevery ONU, and subsequently tune each ONU to thewavelength channel wanted. Clearly the power of thenon-wanted wavelength channels is wasted by theONU, and losses at the broadcasting power splitterare significant. An optical amplifier is usually needed
to make up for these losses; the amplifier needs tooperate bi-directionally to handle downstream as wellas upstream traffic. This approach inherently supportsbroadcast services.
6.2 Wavelength broadcast-and-select
access network
Figure 14 presents a multi-wavelength overlay of anumber of ATM PON networks on a HFC network,following the wavelength channel selection approach[9]. Figure 14.a shows a fibre-coax network for distri-bution of CATV services, operating at a wavelengthλ0 in the 1550–1560 nm window where erbium-doped fibre amplifiers (EDFAs) offer their best out-put power performance. Thus, using several EDFAsin cascade, an extensive optical network splitting fac-tor can be realised and a large number of customerscan be served. For example, with two optical ampli-fier stages and typical splitting factors of N = 4 andP = 16, and a mini-fibre node serving 40 users via itscoaxial network, a total of 2560 users is served froma single headend fibre. For interactive services, theupstream frequency band in a standard HFC network
Headend Local splitting
centre
Optical network
unit
λ 0CATV
DSOA
1
N
1
P
CATV
HEcoax
Coax user
access network
analog
Tx
analog
Rx
λ 0
TV
IS
exchange
WDM
Network mgt.
& control
APON OLT
λ1, λ
2
BB
IS
λ1 ...... λ
8
@ 622Mbit/s ATM
odd λ down, even λ up
Network mgt.
& control
Headend Local splitting
centre
Optical network
unit
λ 0CATV
DS
bidir.
OA
1
N
1
PCATV
HE
coax
Coax user
access network
analog
Txanalog
Rx
λ 0
HD
WD
M
WDM
λ1 ...... λ
8
λ-switched
TRX
cable
control
λ-control
cable modem
TV
bi-directional
electrical amplifier
Figure 14 Flexible capacity assignment in a multi-wavelength fibre-coax network by wavelength selection atthe ONUs
b) upgrading of the fibre-coax network with multi-wavelength APON system for delivery of broadband interactive services
a) fibre-coax network for distribution of CATV services
ISSN 0085-7130 © Telenor ASA 2005
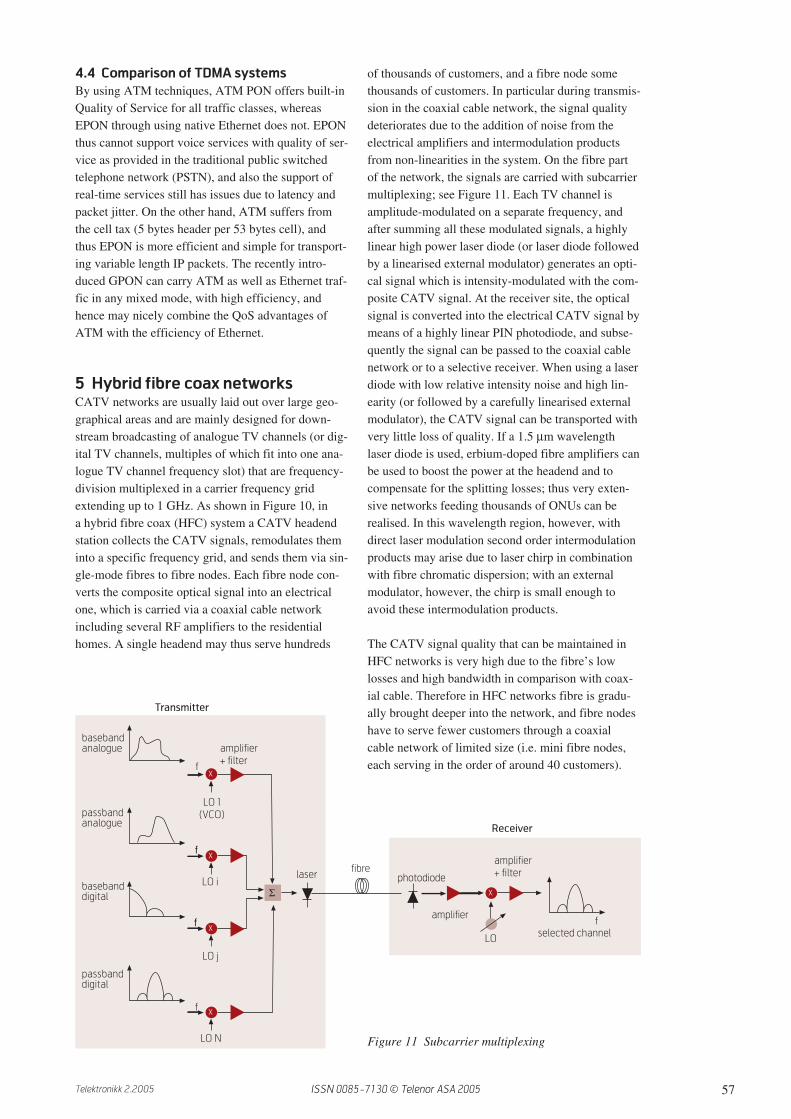
60 Telektronikk 2.2005
(with a width of some 40 to 60 MHz) has to be sharedamong these users, thus allowing only limited bitratesper user for narrowband services such as voice tele-phony.
An upgrade of the system in order to provide broad-band interactive services can be realised by overlay-ing the HFC network with a number of wavelength-multiplexed APON systems, such as have been devel-oped in the ACTS TOBASCO project [9] and areshown in Figure 14.b. Four APON OLTs at the head-end site are providing each bi-directional 622 Mbit/sATM signals on a specific downstream and upstreamwavelength pair. These eight wavelengths are posi-tioned in the 1535– 1541 nm window, where the up-and downstream wavelength channels are interleavedwith 100 GHz spacing. The APON wavelengths arecombined by a high-density wavelength division mul-tiplexer (HDWDM), and subsequently multiplexedwith the CATV signal by means of a simple coarsewavelength multiplexer (thanks to the wide spacingbetween the band of APON wavelengths and theCATV wavelength band). The system upgradeimplies also replacement of the uni-directional opticalerbium-doped fibre amplifiers by bidirectional oneswhich feature low noise high-power operation for thedownstream CATV signal, and for the bidirectionalATM signals a wavelength-flattened gain curve plusa nonsaturated behaviour (to suppress crosstalk inburst-mode). At the ONU site, the CATV signal isfirst separated from the APON signals by means of acoarse wavelength multiplexer and subsequently con-verted to an electrical CATV signal by a highly linearreceiver and distributed to the users via the coaxialnetwork. The APON signals are fed to a wavelength-switched transceiver, of which the receiver can beswitched to any of the four downstream wavelengthchannels and the transmitter to any of the fourupstream ones. The wavelength-switched transceivermay be implemented by an array of wavelength-spe-cific transmitters and receivers, which can be individ-
ually switched on and off; this configuration allowsto set up a new wavelength channel before breakingdown the old one (“make-before-break”). Alterna-tively, it may use wavelength-tunable transmittersand receivers, which in principle can address anywavelength in a certain range; this eases furtherupgrading of the system by introducing more wave-length channels, but also implies a “break-before-make” channel switching. The network managementand control system commands to which downstreamand upstream wavelength channel each ONU trans-ceiver is switched. By issuing these commands fromthe headend station, the network operator actuallycontrols the virtual topology of the network, and isthus able to allocate the network’s capacity resourcesin response to the traffic demands at the various ONUsites. The network management command signals aretransported via an out-of-band wavelength channel inthe 1.3 µm wavelength window. The APON signalschannel selected by the ONU is converted by thetransceiver into a bidirectional electrical broadbanddata signal, which is by a cable modem controller putin an appropriate frequency band for multiplexingwith the electrical CATV signal. The upstream datasignal is usually put below the lowest frequencyCATV signal (so below 40 to 50 MHz), and thedownstream signal in empty frequency bandsbetween the CATV broadcast channels. The signalsare carried by the coaxial network (in which only theelectrical amplifiers need to be adapted to handle thebroadband data signals) to the customer homes,where the CATV signal is separated from the bi-directional data signals. The latter signals are pro-cessed by a cable modem that interacts with the cablemodem controller at the ONU site.
By remotely changing the wavelength selection at theONUs, the network operator can adjust the system’scapacity allocation in order to meet the local trafficdemands at the ONU sites. As illustrated in Figure15, the ONUs are allocated to the four upstream (anddownstream) wavelength channels, each having amaximum capacity of 622 Mbit/s for ATM data. Assoon as the traffic to be sent upstream by an ONUgrows and does not fit anymore within its wavelengthchannel, the network management system can com-mand the ONU to be allocated to another wavelengthchannel, in which sufficient free capacity is stillavailable. Obviously, this dynamic wavelength re-allocation process reduces the system’s blockingprobability, i.e. it allows the system to handle moretraffic without blocking and thus can increase therevenues of the operator.
6.3 Wavelength routing access network
Figure 16 presents the dynamic wavelength channelrouting approach in a fibre-wireless network to allo-Figure 15 Re-allocating ONUs to wavelength channels
Bmax
B
0
λ1
λ λ3
λ λ5
λ λ7
λ
λ
ONU 1
ONU 2
etc.
ONU x
ISSN 0085-7130 © Telenor ASA 2005

61Telektronikk 2.2005
cate flexibly the capacity of a number of ATM PONsystems among ONUs in a single fibre split networkinfrastructure [10]. Each ONU feeds a radio accesspoint (RAP) of e.g. a wireless LAN, which wirelesslyconnects to a variable number of users with mobileterminals. These users move across the geographicalarea served by the network (e.g. a business park), andthey may want to set up a broadband wireless connec-tion to their laptop at any time anywhere in this area.When many users are within a wireless cell served bya certain RAP, this cell may have to handle muchmore traffic than the other cells; it has become a “hotspot” which has to be equipped with additionalcapacity. The corresponding RAP may switch onmore microwave carriers to provide this additionalcapacity over the air, and also has to claim morecapacity from the ONU. This local extra capacity canbe provided by re-allocation of the wavelength chan-nels over the ONUs, which is done by a flexiblewavelength router positioned in the field. Similar tothe architecture of the wavelength-reconfigurablefibre-coax network in Figure 14.b, the architecture inFigure 16 (which was developed in the ACTSPRISMA project) has four 622 Mbit/s bi-directionalAPON OLTs with a specific downstream wavelengthand an upstream one each. The four downstreamwavelengths are located in the 1538–1541 nm range,with 100 GHz spacing, and the four upstream ones inthe 1547–1550 nm range with the same spacing. Theflexible wavelength router directs each downstreamwavelength channel to one or more of its outputports, and thus via a split network to a subset ofONUs. The RAPs could operate with up to 5 micro-
wave carriers in the 5 GHz region, each carrying upto 20 Mbit/s ATM wireless LAN data in OFDM for-mat. At the flexible router (or at the local exchange) anumber of continuous-wave emitting laser diodes arelocated, providing unmodulated light power at theupstream wavelengths. The flexible router can selectone of these upstream wavelengths and direct it to theONUs that can modulate the signal with the upstreamdata and return it by means of a reflective modulatorvia the router to the local exchange. Thus no wave-length-specific source is needed at the ONU, thedownstream light sources are shared by a number ofONUs, and all ONUs are identical, which reduces thesystem costs and the inventory issues. The flexiblewavelength router can be implemented with a wave-length demultiplexer separating the wavelength chan-nels, followed by power splitters, optical switchesand power couplers in order to guide the channels tothe selected output port(s). Depending on the granu-larity of the wavelength allocation process, the flexi-ble router may be positioned at various splitting lev-els in the network.
Using a similar strategy as depicted in Figure 15 toassign wavelength channels to the ONUs, a statisticalperformance analysis has been performed of theblocking probability of the system. It was assumedthat the total network served 343 cells, of which 49were “hot spots”, i.e. generated a traffic load twotimes as large as a regular cell. It was also assumedthat the system deployed seven wavelength channels,and that the calls arrived according to a Poisson pro-cess where the call duration and length were uni-
Fibre-wireless
base transceiver
station
Local splitting
centre 2
LSC 3LSC 1 Wireless mobile
terminals
Local Exchange
Network mgt.
& control
BB
IS
HD
WD
M
1
N
λ1... λ
M
bidir.
OA
λ5
λ6
λ7
λ8
fle
x r
ou
ter
CW LDs
1
N
λa
λb
WDM
λa
ONU
ATM-NT
refl. modλb, CW
λb, mod
PD
Radio
access
point
Portable
PC
f1 (+f
2)
Network mgt.
& control
Network mgt.
& control
λ- control t- control
APON OLT
λ1, λ
2
Figure 16 Flexible capacity assignment in a multi-wavelength fibre-wireless network by wavelength routing in the field
ISSN 0085-7130 © Telenor ASA 2005

62 Telektronikk 2.2005
formly distributed. Figure 17 shows how the systemblocking probability depends on the offered load(normalised on the total available capacity, which is 7times 622 Mbit/s), using various system architectureoptions. When wavelength re-allocation would notbe possible (i.e. static WDM) and all the 49 hot spotswere positioned at cells served by ONUs assigned tothe same wavelength channel, the blocking probabil-ity is obviously the worst. On the other hand, in thestatic WDM case when the 49 hot spots were evenlyspread over the seven wavelength channels, theblocking probability is much lower (i.e. best case).Unfortunately, a network operator cannot knowbeforehand where the hot spots will be positioned,so in this static WDM situation the system blockingprobability will be anywhere between the best caseand the worst case, and no guarantee for a certainblocking performance can be given. When dynamicre-allocation of the wavelength channels is possible,however, the system can adapt to the actual hot spotdistribution. Figure 17 shows that when the flexiblewavelength router is positioned at the second splittingpoint in the network, the blocking performance is bet-ter than the best-case static WDM performance; butmore importantly, it is also stable against variationsin the hot spot distribution, and thus would allow anoperator to guarantee a certain system blocking per-formance while still optimising the efficiency of hissystem’s capacity resources. The blocking perfor-mance may be even better and more stable whenpositioning the flexible router at the third splittingpoint; however, this implies that the costs of therouter are shared by less ONUs. Locating the routerat the second splitting point is a good compromisebetween adequate improvement of the system block-ing performance and system costs per ONU.
7 Microwave signals over fibreWireless communication services are steadilyincreasing their share of the telecommunication mar-ket. Next to their prime feature, mobility, they needto offer growing bandwidths to the end users. Thisentails also an increase of the radio carrier frequen-cies, which leads to smaller radio cell coverage (dueto the increased propagation losses and line-of-sightneeds). Wireless LANs in the 2.4 GHz range accord-ing to the IEEE 802.11b standard carry up to 11 Mbit/s,evolving up to 54 Mbit/s in the IEEE 802.11g stan-dard. The IEEE 802.11a and the HIPERLAN/2 stan-dard provide up to 54 Mbit/s in the 5.4 GHz range.Research is ongoing in systems that may deliver morethan 100 Mbit/s in the radio frequency range wellabove 10 GHz (e.g. LMDS at 28 GHz, HyperAccessat 17 GHz and 42 GHz, MVDS at 40 GHz, MBS at60 GHz, Fixed Wireless Access up to 60 GHz, etc.).Due to the shrinkage of radio cells at higher radio fre-quencies, ever more antenna sites are needed to covera certain area such as the rooms in an office building,in a hospital, the departure lounges of an airport, etc.Thus more Radio Access Points (RAPs) are needed toserve e.g. all these rooms in an office building, andhence also a more extensive wired network to feedthe RAPs. Instead of generating the microwave sig-nals at each RAP individually, feeding the microwavesignals from a central headend site to the RAPsenables to simplify the RAPs considerably. The sig-nal processing functions can thus be consolidated atthe headend site. Thanks to its superb broadbandcharacteristics, optical fibre is an excellent mediumto bring the microwave signals to the RAPs.
7.1 Heterodyning systems
Carrying multi-GHz analogue signals over fibrerequires very high frequency optical analogue trans-mitters and receivers, including careful fibre disper-sion compensation techniques. An attractive alterna-tive avoiding the transport of multi-GHz intensity-modulated signals through the fibre is to apply het-erodyning of two optical signals of which the differ-ence in optical frequency (wavelength) correspondsto the microwave frequency. When one of these sig-nals is intensity-modulated with the baseband data tobe transported, and the other one is unmodulated, byoptical heterodyning at the photodiode in the receiverthe electrical microwave difference frequency signalis generated, amplitude-modulated with the data sig-nal. This modulated microwave signal can via a sim-ple amplifier be radiated by an antenna; thus a verysimple low-cost radio access point can be realised,while the complicated signal processing is consoli-dated at the headend station.
This approach, however, requires two light sourceswith narrow spectral linewidth and carefully sta-
Blo
cki
ng
pro
ba
bili
ty
0.0001
number of HS = 49
static WDM,
7 HS per l
dynamic WDM,
router @ LSC2
dynamic WDM,
router @ LSC3
0.001
0.01
0.1
1
0.4 0.6 0.8 1
Normalized offered load
static WDM,
all HS on 1 λ
Figure 17 Improving the system performance bydynamic wavelength allocation
ISSN 0085-7130 © Telenor ASA 2005

63Telektronikk 2.2005
bilised difference between the optical emission fre-quencies. An alternative approach requiring only asingle optical source is shown in Figure 18 [11]. Theoptical intensity-modulated signal from a laser diodeis subsequently intensity-modulated by an externalMach Zehnder modulator (MZM) which is biased atthe inflexion point of its modulation characteristicand driven by a sinusoidal signal at half themicrowave frequency. At the MZM’s output port atwo-tone optical signal emerges, with a tone spacingequal to the microwave frequency. After heterodyn-ing in a photodiode, the desired amplitude-modulatedmicrowave signal is generated. The transmitter mayalso use multiple laser diodes, and thus a multi-wave-length radio-over-fibre system can be realised with a(tunable) WDM filter to select the desired wavelengthradio channel at the antenna site. The system is toler-ant to fibre dispersion, and also the laser linewidth isnot critical as laser phase noise is largely eliminatedin the two-tone detection process.
7.2 Optical frequency multiplying systems
An alternative approach to generate microwave sig-nals by means of a different kind of remote opticalprocessing, named optical frequency multiplying, isshown in Figure 19 [12]. At the headend station thewavelength λ0 of a tunable laser diode is swept peri-odically over a certain range ∆λsw , with a sweep fre-quency fsw . Alternatively, the wavelength-swept sig-nal can be generated with a continuous-wave operat-ing laser diode followed by an external phase modu-lator that is driven with the integral of the electricalsweep waveform. The intensity of the wavelength-swept signal is on/off modulated with low frequencychirp by the downstream data in a symmetrically
driven Mach Zehnder modulator. After travellingthrough the fibre network, at the receiver the signaltransverses an optical filter with a periodic bandpasscharacteristic. When the wavelength of the signal isswept back and forth over N filter transmission peaks,the light intensity impinging on the photodiode fluc-tuates at a frequency 2N . fsw . Thus the sweep fre-quency is multiplied, and a microwave signal withcarrier frequency fmm = 2N . fsw plus higher harmon-ics is obtained. The intensity-modulated data is notaffected by this multiplication process, and is main-tained as the envelope of the microwave signal. Themicrowave signal is subsequently transversing anelectrical bandpass filter (BPF) which rejects theunwanted harmonics. Theoretical analysis and simu-lations have shown that the microwave signal is verypure; the inherent cancellation of the laser’s opticalphase noise causes the spectral linewidth of themicrowave signal to be much smaller than that of thelaser diode. Experiments have shown e.g. the genera-tion of a microwave linewidth less than 50 Hz,
PD
Vπ
fmm
/2data on
IF subcarriers
single mode
fibre link
DFB λ1
MZM
MU
X
Two-tone
optical signal
λ
fmm
λ1 λ2
BPF
fmm
DFB λ2
DFB λn
Figure 18 Generating microwave signals by heterodyning
fsw
i
tun. LD
- data down
λ0
Headend station
λ1
PD
periodic
filter
fl1
antenna
circulator
λ1
λλ
filter
0
1 2 N0 .
sw
-ϕ
PD
LPF
data up
+ data down
Radio access point
fmm
LPF
LD
mixer
0
1
WDM
λλ
∆λFSR
tra
nsm
issio
n
+ϕ
fibre
link
λ0
WDM
fl2
BPF
X
fmm = 2 N.f
sw
Figure 19 Generating microwave signals by optical frequency multiplying
ISSN 0085-7130 © Telenor ASA 2005
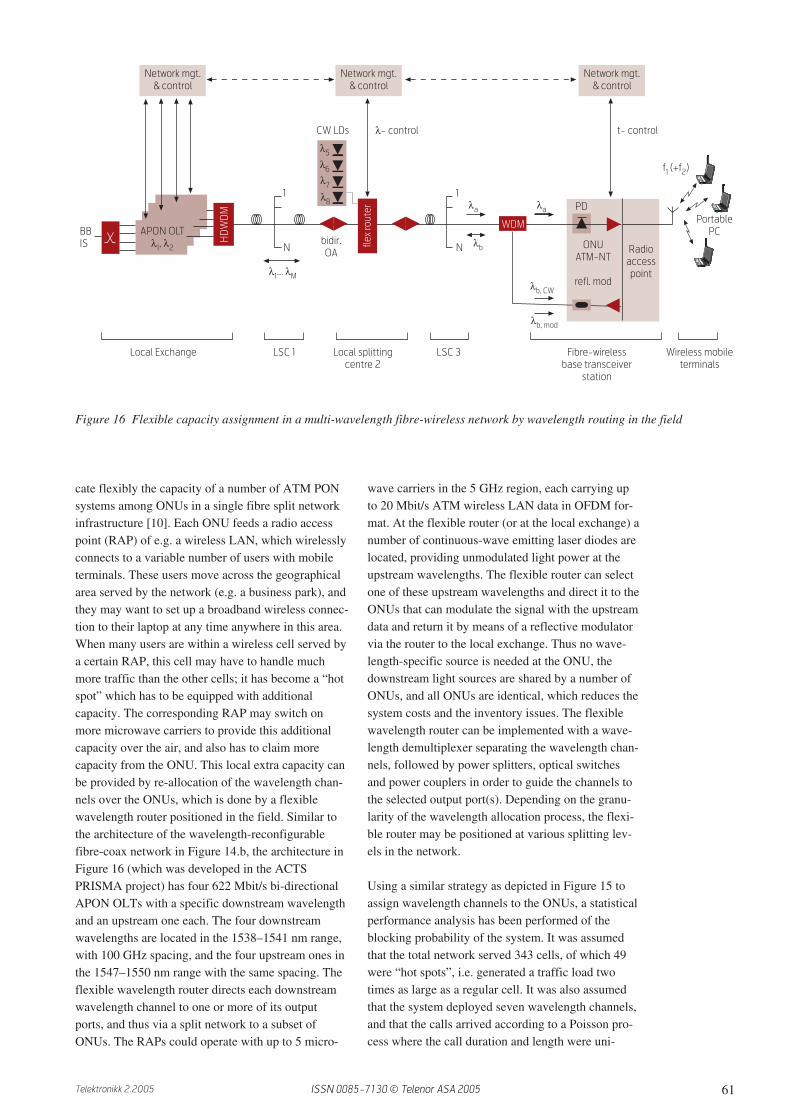
64 Telektronikk 2.2005
whereas the laser linewidth exceeded 1 MHz [13].The periodic optical bandpass filter can be advanta-geously implemented by a Fabry Perot filter with afree spectral range ∆λFSR which is N times as smallas the wavelength sweep range ∆λsw . The microwavesignal can also carry advanced data modulationschemes, due to its spectral purity; e.g. 16-levelQuadrature Amplitude Modulated (16-QAM) signalsmay be modulated on a subcarrier first, and thendrive the Mach Zehnder Modulator. The main advan-tage of this optical frequency multiplying method isthat only relatively moderate sweep frequency signalsare needed at the headend site (e.g. an fsw up to 1GHz), which can easily be generated with low phasenoise, while at the antenna site low phase noisemicrowave signals with carrier frequencies in the tensof GHz region are generated. The system does notrely on heterodyning, and thus may also operate onmultimode fibre networks (such as polymer opticalfibre, which is easy to install inside buildings).
Assuming a linear behaviour of the fibre, it can beshown that the periodic optical filter may also be posi-tioned at the headend site, yielding the same opticalfrequency multiplication at the receiving end. Thus,the complexity of the antenna site is reduced further,and the characteristics of the filter can be readilytuned to the frequency sweep of the laser diode [14].
The system can also transport upstream data fromthe antenna station to the headend. By using a simpletunable local oscillator and a mixer, the microwave car-rier generated at the antenna station by the optical fre-quency multiplying process can be down-shifted, andbe used for down-converting the upstream microwavesignal from the mobile terminal to a tunable intermedi-ate frequency. This downconverted signal can subse-quently be transmitted upstream on a separate wave-length by an IF-frequency optical transmitter [14].Tuning to a different IF per antenna station enablesthe use of an SCMA upstream transmission protocol.
8 Concluding remarksOptical fibre is now generally recognised to be themost powerful medium for transporting information,due to its very low losses and extremely wide band-width. Next to space and time multiplexing, thewavelength dimension offers unprecedented oppor-tunities to extend not only the data traffic transportcapacity, but also the traffic routing possibilities innetworks.
In access networks, fibre is penetrating steadilytowards the end user. Infrastructure costs are themajor nut to crack here. Shared-feeder concepts suchas the passive optical network tree-and-branch one
greatly reduce the installation costs of the fibre net-work, and can support various multiple access tech-niques (ATM and Ethernet for time multiplexedaccess, among others). In the past, operators haveinvested a lot in various last-mile networks (e.g.twisted pair, coaxial cable) to reach their residentialcustomers. In upgrading these networks to highercapacity and larger service variety, fibre can support awide range of last-mile technologies by hybrid combi-nations such as fibre-twisted pair, fibre-coax, andfibre-wireless. By means of wavelength multiplexingtechniques, the fibre feeder part of such hybrid net-works can very flexibly host different operators andservice categories. Augmented with wavelength rout-ing, capacity-on-demand can be realised for e.g. han-dling hot spots, while respecting Quality of Servicerequirements. By deploying advanced techniques fortransporting microwaves over fibre, the antenna sitesof broadband wireless systems can be significantlysimplified and thus system costs be reduced, whereasalso more sophisticated signal processing (for e.g.antenna diversity systems) is facilitated.
9 Future prospectsWith the ongoing improvements in fibre character-istics and development of novel optical amplifierstructures, the wavelength range available for com-munication will stretch from below 0.8 µm to beyond1.6 µm, covering a bandwidth of some 200 THz. Fur-ther improvements in signal coding yielding a higherspectral efficiency, in ultra-dense wavelength divi-sion multiplexing and in ultra-high speed optical timedivision multiplexing will enable us to exploit thishuge bandwidth, and will push the transport capacityof a single fibre beyond 100 Tbit/s.
The end user is to benefit from all these ultra-broad-band communication possibilities. Therefore the opti-cal fibre will not only reach up to his house, but itwill penetrate into it as well. It will reach close to hispersonal area network, which thanks to the ongoingminiatuarisation may consist of a myriad of smallwireless power-lean terminals, sensors and actuators.These wireless devices will be incorporated not onlyin his residential living environment, but also in hisclothes, his car, etc. Next to the traditional wired ter-minals such as the TV, these wireless devices will beconnected to the fixed in-home and access networkby a myriad of small intelligent antennas. Radio-over-fibre techniques, augmented with optical routingto accommodate dynamically the hot spots, will pro-vide the best match of the ultimate capacity of fibrewith the user freedom of wireless. Even in the wire-less domain, optics may penetrate by means of intelli-gently-steered free-space light beams providing theultimate in wireless transport capacity.
ISSN 0085-7130 © Telenor ASA 2005

65Telektronikk 2.2005
Which in the far foreseeable future will make thecommunication world an end-to-end globally trans-parent one, with nearly unlimited communicationcapacity for anybody, anytime, anywhere, for anykind of service ... the ultimate global crystal ball!
References1 Frigo, N J et al. Demonstration of performance-
tiered modulators in a WDM PON with a singleshared source. Proc. ECOC’95, Brussels, Sep.17–21, 1995, 441–444.
2 Ueda, H et al. Deployment Status and CommonTechnical Specifications for a B-PON System.IEEE Communications Magazine, 39 (12),134–141, 2001.
3 Effenberger, F J, Ichibangase, H, Yamashita, H.Advances in Broadband Passive Optical Network-ing Technologies. IEEE Communications Maga-zine, 39 (12), 118–124, 2001.
4 Schoop, R, Fredericx, F, Koonen, T, Hardalov, C.WDM isolation requirements for CATV inBPON. Proc. ECOC’2002, Copenhagen, Sep.8–12, 2002.
5 Vetter, P et al. Study and demonstration of exten-sions to the standard FSAN BPON. Proc. ISSLS2002 (XIVth International Symposium on Servicesand Local Access), Seoul, April 14–18, 2002,paper 4-2, 119–128.
6 van de Voorde, I et al. The Super PON demon-strator: a versatile platform to evaluate possibleupgrades of the G.983 APON. Proc. ISSLS 2000(XIIIth International Symposium on Services andLocal Access), Stockholm, June 18–23, 2000,paper 14-3, 10.
7 Van Caenegem, T et al. Prototyping ITU-TGPON, the new efficient and flexible FTTP solu-tion. Proc. ISSLS 2004, Edinburgh, March 21–24,2004.
8 Koonen, A M J. Flexible wavelength multiplex-ing techniques for broadband fibre access net-works. Telektronikk, 95 (2/3), 119–128, 1999.
9 Koonen, T et al. TOBASCO: An InnovativeApproach for Upgrading CATV Fibre-Coax Net-works for Broadband Interactive Services. IEEECommunications Magazine, 35 (4), 76–81, 1997.
10 Koonen, T, Steenbergen, K, Janssen, F, Wellen, J.Flexible reconfigurable fiber-wireless networkusing wavelength routing techniques: the ACTSproject AC349 PRISMA. Photonic Network Com-munications, 3 (3), 297–306, 2001.
11 Griffin, R A, Lane, P M, O’Reilly, J J. Radio-over-fibre distribution using an optical millime-ter-wave/DWDM overlay. Proc. OFC’99, SanDiego, February 22–25, 1999, paper WD6.
12 Koonen, T et al. In-house networks using Poly-mer Optical Fibre for broadband wireless applica-tions. Proc. ISSLS 2002 (XIVth InternationalSymposium on Services and Local Access), Seoul,April 14–18, 2002, paper 9-3, 285–294
and
Koonen, T et al. In-house networks using multi-mode polymer optical fiber for broadband wire-less services. Photonic Network Communications,5 (2), 177–187, 2003.
13 Ng’oma, A et al. High-frequency carrier deliveryto graded index polymer optical fibre fed nextgeneration wireless LAN radio access points.Proc. ECOC 2003, Rimini, September 21–25,2003.
14 Koonen, T et al. Novel Cost-Efficient Techniquesfor Microwave Signal Delivery in Fibre-WirelessNetworks. Proc. ECOC 2004, Stockholm,September 5–9, 2004.
Ton Koonen is since 2001 a full professor at the COBRA Institute at Eindhoven University of Technology in
the Netherlands. Prior to that, he spent more than 20 years at Bell Labs in Lucent Technologies as a techni-
cal manager of applied research. He also is a Bell Labs Fellow. Next to his industrial position, he was a part-
time professor at Twente University from 1991 to 2000. His main interests are currently in broadband fibre
access networks and optical packet-switched networks. He has initiated and led a number of European and
national R&D projects in this area, among others in dynamically reconfigurable hybrid fibre access networks
for fibre-to-the-curb and fibre-to-the-building. Presently, he is involved in several projects in the European
FP6 IST programme on access networks.
email: [email protected]
ISSN 0085-7130 © Telenor ASA 2005

66 Telektronikk 2.2005
IntroductionThe field of Information and Communication Tech-nologies is showing a development speed which isunprecedented in history. Over a period of more thanthirty years key features like processor speed andmemory size are roughly doubling each 18 months,and experts believe that this development will con-tinue in the coming decade. It is known as Moore’slaw and enabled by the development of micro-elec-tronic integration technology. Due to this develop-ment a steadily increasing performance of componentsand systems can be offered at an essentially constantprice, a development that we recognise in the fact thatthe price of our new PC does not differ much fromwhat we paid three years earlier for the previous one,which had only a fourth of the speed. This dynamicshas become a major driver for the ICT market, whichwould collapse without this steady innovation.
Moore’s law in micro-photonicsFor Photonics to play a substantial role in the ICTmarket it will have to follow the same dynamics. Theincrease in functionality prescribed by Moore’s lawcan only be sustained by applying an integration tech-nology that supports a steady reduction of circuit sizeand fabrication costs. As such Indium-Phosphide(InP) based integration technology is the most power-ful technology because it supports the integration ofalmost all functions required in ICT applications: lightgeneration and detection in the wavelength windowfrom 1300–1600 nm in which the attenuation and dis-persion properties of optical fibres are optimal. Andoptical amplification, modulation, switching, signalregeneration and wavelength conversion, to mentionjust a few examples. And, not to forget, high speedelectronic functions. Indium Phosphide is a compoundsemiconductor material with a structure very similarto silicon, but a number of advantages: it has muchbetter properties than silicon for generation and ampli-
fication of light, and it has also better properties forrealising high-frequency electronics. The question iswhether InP-technology has the same potential asmicro-electronic integration technology for reductionof device dimensions and fabrication costs over alonger period. To study that question we have put thedevelopment of Photonic ICs in our own lab in agraph with the potential integration density in devicesper square centimetre on the vertical axis (Figure 1).The open circles mark the first publication of a deviceor a circuit. It starts with the invention of the ArrayedWaveguide Grating (AWG) wavelength demultiplexerin 1988 [1]. The next circle is the first InP-based Opti-cal Add-drop Multiplexer (OADM) by Vreeburg in1997 [2], a device that is capable of adding or drop-ping one wavelength out of a wavelength multiplex.This device integrated a single AWG with four opticalswitches on an area of 0.2 cm2; i.e. 25 components persquare centimetre. As a next step we developed atechnology for reducing the size of our AWGs usingdeep etching technology. This brought us the world’smost compact Optical Cross-Connect (OXC) [3], adevice that is capable of switching four wavelengthsin a wavelength multiplex applied to the input portsindividually to one of the two output ports. The deviceintegrated four AWGs and four Mach-Zehnderswitches on an area of 5 mm2, i.e. an integration den-sity of more than 150 components per square centime-tre. Since then we succeeded in a further reduction ofAWG-size close to the limits of conventional deepetched waveguide technology in InP: 250 x 350 µm2
[4]. As can be seen the devices fit to a straight linewith a slope slightly higher than Moore’s law. A simi-lar trend is observed in the development of the maxi-mum demonstrated and installed transmission capac-ity on optical links. The last circle in the graph is aphotonic flip-flop, consisting of two deep-etchedmicro-ring lasers, that was recently published by Hillet al. [5]. This flip-flop can be switched between twodifferent output states (1 or 0) and without external
Photonic integration
M E I N T S M I T
Meint Smit is
leader of the
Opto-Electronic
Devices group at
the COBRA Re-
search Institute
Since 2000 global network traffic is dominated by internet (IP) data, with growth rates in the order of
100 % per year. This explosive growth would have been impossible without the introduction of optical
technology in the network. With the rapidly increasing bit rates required in the access network optical
technology penetrates rapidly to the users and an increasing number of FTTH (Fibre-to-the-Home)
pilot projects can be observed, with Japan and Korea taking the lead in large scale deployment. Close
to the end users of the network cost is a major issue and we will have to provide a steadily increasing
amount of bandwidth against an essentially constant price. This is only possible through a steady
process of technical innovation. Photonic integration is the key technology for providing this steady
innovation over a long term period and it is, therefore, a key enabler for a broadband access network.
ISSN 0085-7130 © Telenor ASA 2005
67Telektronikk 2.2005
signals applied it keeps its state. It has a high potentialfor ultra fast photonic logic circuits operating at verylow power levels. The flip-flop, with dimensions of 20x 40 µm2, allows for integration of more than 100,000components per square centimetre, in principle. It willbe explained in more detail later.
To complete the picture we have also put some(sparse) commercial products in the graph. The firstone is the single AWG brought to the market by NELin 1994. The second and third point are a WavelengthDivision Multiplexing receiver (an AWG and fourdetectors) and a WDM Channel monitor (nine AWGsand 40 detectors) brought to the market by ASIP/ThreeFivePhotonics in 2003 and 2004, respectively.Again the points fit more or less to a straight linewhich is delayed by around six years relative to thefirst demonstration in the lab. Although the sample issmall, these examples suggest that Moore’s law is alsovalid in micro-photonic integration technology, withthe exception of the flip-flop, which is considerablyahead of the development predicted by Moore’s law. Itmakes clear that the development of Photonics, whichhas a much larger diversity in devices and technologiesthan electronics, shows a more complex behaviour
than electronics. The difference in speed is in the posi-tive direction, however: Photonics develops faster thanMoore’s law. This holds a great promise for the future.
Photonic integration philosophyThe power of micro-electronic integration technologyis that a broad class of electronic functionalities canbe synthesised from a small set of elementary compo-nents, such as transistors, resistors and capacitors. Atechnology that supports integration of these elemen-tary components can, therefore, be used for a broadclass of applications, and investments made in itsdevelopment are paid back by a large market.Although photonic integration has much in commonwith micro-electronic integration, a major differenceis the variety of devices and device-principles in pho-tonics. In photonics we have couplers, filters, multi-plexers, lasers, detectors, switches, modulators, tomentions just a few devices, and for each of thesedevices a broad variety of different operation princi-ples and materials has been reported. It is impossibleto develop a monolithic technology which is capableof realising even a modest subset of all these devices.The key to the success of integration in photonics is,
Figure 1 Moore’s law in micro-photonics illustrated with devices developed by COBRA – TU Eindhoven. Thedevelopment started with the realization of the first AWG in 1988, followed by a number of devices in which theAWG was integrated with optical switches in an Optical Add-Drop Multiplexer (1997) and a very compactOptical Cross Connect (2000). Commercial products based on this technology show a time lag around sixyears with respect to the first lab demonstrators. The most recent COBRA achievement, a fast and low-lossphotonic flip-flop (2004), based on micro-ring lasers instead of AWGs and optical switches, does not fit intothis scheme, but is ahead of the development by two orders of magnitude, which holds a great promise for thedevelopment of ultra fast and low power digital photonics
1990 1995 2000 2005 2010 2015 20201985
1
10
100
1000
SSI
MSI
LSI
Inte
gra
tio
n d
en
sit
y (
cm
10000
VLSI
AWG
Smit
First lab demo
Commercial product
4 ch WDM-receiver
ThreeFivePhotonics
WDM
monitor
Flip flop
Hill
OXC
Herben
OADM
Vreeburg
AWG/NEL
100000
Focal plane
ISSN 0085-7130 © Telenor ASA 2005

68 Telektronikk 2.2005
therefore, reduction of the broad variety of opticalfunctionalities to a few elementary components. Wemade a choice for 3 elementary devices: 1) A passivewaveguide structure that allows for low-loss intercon-nection of devices and for realization of miniaturizedcomponents like couplers, filters, multiplexers, polar-isation and mode converters. 2) An element formanipulating the phase of optical signals. A choicehas been made for a fast electro-refractive modulator(ERM) that can be easily integrated in our passivewaveguide structure. Main applications so far arefast optical switches and modulators (for both phaseand amplitude). 3) An element for manipulating theamplitude of optical signals: the Semiconductor Opti-cal Amplifier (SOA), a powerful but complicateddevice (it also modulates the phase) that allows forboth linear and non-linear signal processing, e.g. inWDM light sources, femtosecond pulse lasers, wave-length converters, signal regenerators and ultra fastoptical switches.
A generic technology for integrating these three ele-mentary components can be used for realising pho-tonic chips for a broad class of functionalities. A
major issue for Photonic Integration is the way inwhich active (laser and amplifier) sections are inte-grated with transparent (waveguide or modulator)sections. In principle three different schemes can bedistinguished, each with a number of variants. Theyare illustrated in Figure 2. In the first one active andtransparent waveguides are in the same plane and arecoupled via a so-called butt-joint. The structure isrealized by first growing the active layer stack, selec-tively removing it while covering the active regionswith a mask, selectively regrowing the transparentregions, while covering the active regions with amask, and covering the whole structure with acladding layer in a third epitaxial growth step. Thewhole process requires good equipment and skills,because all layers should get an almost perfect crys-talline structure with well controlled composition,morphology and dopant level. In the second and thirdscheme the whole structure is grown in a single epi-taxy step and the active layers are removed after-wards, while covering the active regions with a mask.In the second scheme a thin active layer is applied ontop of the transparent waveguide in such a way thatthe optical fields at both sides of the junctions arenot too much different so that the transmission lossthrough the junction is small. Special provisions arenecessary to avoid reflections. In the third scheme thelight is coupled from the lower transparent layer tothe upper active layer. This scheme needs special pro-visions for efficient coupling from the lower to theupper layer. The single-step epitaxial growth schemeshave the advantage of being simpler from a fabrica-tion point of view. Both schemes have been success-fully applied for development of commercial prod-ucts. A disadvantage is the restricted flexibility:because the whole structure is grown in one step it isnot possible to use different compositions and dopinglevels in different regions. This reduces the designfreedom and the number of different components thatcan be integrated. We have chosen for a three-stepepitaxial regrowth process as shown at the left forintegration of active (SOA-based) and passivedevices because of the flexibility that it offers forthe design of the regrown wafer stack in combinationwith the low loss and the low reflection level at thebutt-joints [6]. Electro-refractive modulators are fullycompatible with the passive waveguide structures andneed no additional regrowth step [7].
Reducing dimensionsA major issue in the development of photonic inte-gration technology is reduction of device dimensions.The key to reduction of device dimensions is theapplication of high lateral index contrast (i.e. theindex contrast in the plane of the waveguide layer)realised by deep etching of the waveguides. Because
Figure 2 Three different schemes for integration ofactive (laser and amplifier) and passive waveguides.In the first one (left) active and transparent wave-guides are in the same plane and are coupled viaa so-called butt-joint. The structure requires threeepitaxial growth steps, of which one is selective(i.e. the wafer is masked, so that the layers are onlygrown where they are needed). In the second (middle)and the third (right) scheme the whole structure isgrown in a single epitaxy step and the active layersare removed afterwards, while covering the activeregions with a mask. The single-step epitaxial growthschemes have the advantage of being simpler from afabrication point of view. Both schemes have beensuccessfully applied for development of commercialproducts. A disadvantage is the restricted flexibility:because the whole structure is grown in one step it isnot possible to use different compositions and dopinglevels in different regions. This reduces the designfreedom and the number of different components thatcan be integrated
Legend:
Active waveguide
Transparant waveguide
Cladding
ISSN 0085-7130 © Telenor ASA 2005
69Telektronikk 2.2005
of the high index contrast between the semiconductorwaveguide (typical refractive index values around3.3) and air, deep etched waveguides provide stronglight confinement. This allows for application ofsmall waveguide widths, small bending radii, com-pact waveguide couplers and compact AWGs. Theprice that is paid for the high contrast are increasedpropagation losses due to scattering at rough wave-guide edges, and increased insertion losses at junc-tions between slabs and waveguide arrays as used inan AWG where the finite resolution of the lithogra-phy causes abrupt closure of the tapered interwaveg-uide gaps. With a low index contrast the optical dis-continuities caused by this closure are small; withdeep etched waveguides they can introduce a few dBloss per junction. A solution is the use of a technol-ogy that supports combination of low loss shallowetched waveguides for interconnect purposes and atwaveguide junctions, with locally deep etchedregions, where short bends or other high-contrastfunctions are required. Losses smaller than 0.1 dB perjunction have been shown at transitions between deepand shallow etched regions, so that several transitionscan be included in a circuit. Using such a technologyAWG dimensions have been reduced below 0.1 mm2
[4], see Figure 3. This is close to the limits for InP-based ridge-type waveguide technology.
A further reduction of device dimensions may beachieved by moving to photonic wire and photoniccrystal technology. These technologies allow us tocome close to the fundamental size limits for photonconfinement: around half a wavelength (200 nm) fora single defect micro-cavity; i.e. a cavity in which thelight is confined in a volume with half wavelengthdimensions. For full 3D confinement we should alsoconfine the light in the third dimension, which isextremely difficult from a fabrication point of view.2.5D solutions, i.e. application of membranes with ahigh vertical index contrast, may bring us close to thefundamental limits and have the advantage that theyrelax the requirements on the aspect ratio of the etch-ing technology.
Resonant enhancement of electro-optic and opto-optic interactionsOnce we have succeeded in reducing the dimensionsof our circuits to the scale of the wavelength the nexthurdle is the magnitude of our electro-optic or opto-optic interactions, e.g. in optical amplifiers or electro-refractive modulators. These are such that hundredsto thousands of wavelengths are required for achiev-ing the π phase shift required for optical switchingoperations. Here a solution can be found in resonantenhancement in cavity-like structures. These arestructures in which the light is reflected a few times
before it leaves the cavity. In this way it crosses theinteraction region a number of times, which increasesthe efficiency, albeit at the price of reduced band-width.
Resonant enhancement is a key feature in the opera-tion of the micro-ring laser flip-flop [5] shown in Fig-ure 4. A flip flop is a device that can be switchedbetween two states and that keeps its state without anexternally applied signal. A micro-ring laser is a laserconsisting of an active waveguide ring with a smallradius (< 100 µm). By injecting sufficient carriersover the whole length of the waveguide ring thewaveguide material will amplify the light travellingthrough the ring so that it becomes stronger after eachround trip until it saturates at a high power level. Inthe flip-flop both rings can lase in the clockwise(CW) or counter-clockwise (CCW) direction. They
Figure 3 Deep etched InP-based AWG wavelengthdemultiplexer with record small dimensions. Thedevice consists of two so-called diffraction regions(at both sides of the letters 35) and an array ofwaveguides which behaves as a lens with stronglydispersive properties, like a prism. The devicedimensions have been reduced by etching the wave-guides very deep, so that the light cannot escape fromthe waveguide. In this way very short bends can berealized. Without special precautions large reflec-tions and transmission losses occur at the interfacebetween the diffraction regions and the deep etchedwaveguide array. In the COBRA-device this problemhas been avoided by inserting a short shallow edgedregion between the diffraction regions and the deepetched array
ISSN 0085-7130 © Telenor ASA 2005
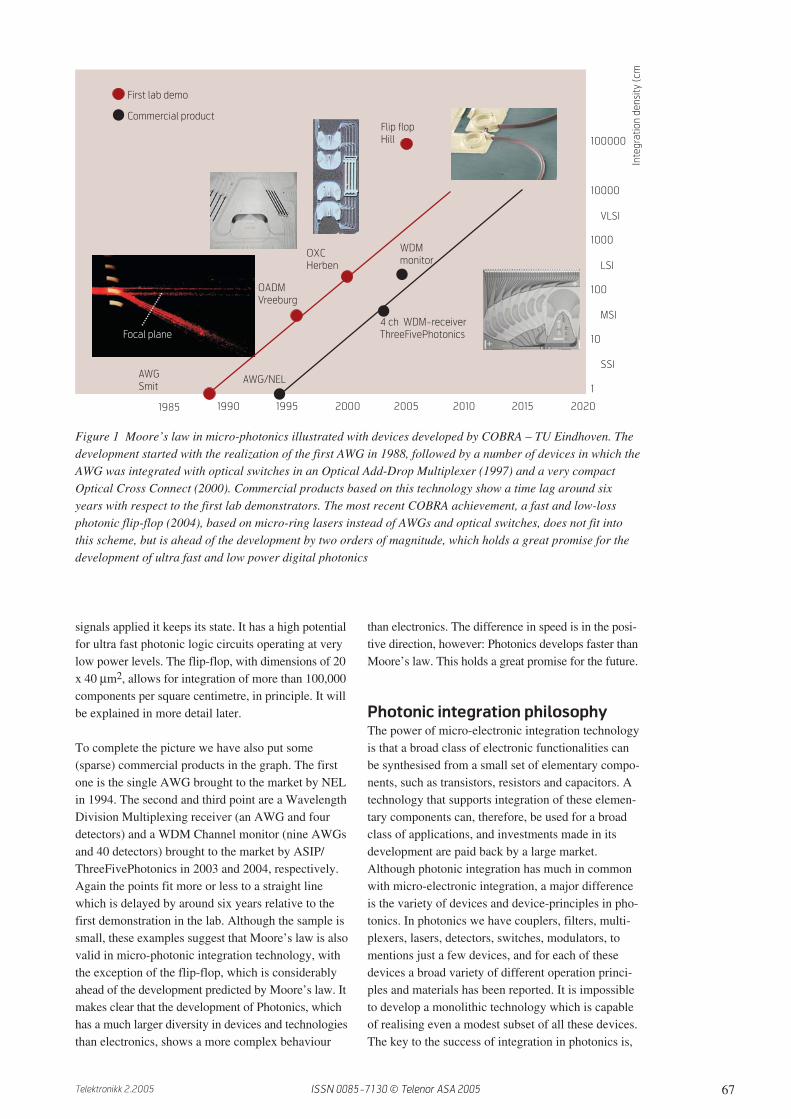
70 Telektronikk 2.2005
push each other in one direction by injection throughthe coupling waveguide section between them. Usinga set pulse they can be changed from CW to CCWand vice versa. This switching can be achieved with asignal that is much smaller than the output signals ofthe ring because of resonant enhancement of the inputsignal in the amplifying rings. Without this resonantenhancement the input signal should be larger thanthe output signal which is prohibitive for cascadingdevices. The device shown in Figure 4 needs only5 femtoJoule light energy to switch to the other state.The price that is paid for this enhanced sensitivity is alonger response time. The device shown in the figurehas a switching time of 15 ps. If the cavity size issufficiently small (a few microns) response timessmaller than 1 ps are feasible. By etching deepthrough the active waveguide layer cavity radiationlosses can be kept sufficiently small even for verysmall ring (or disk) diameters.
Active or passiveAn alternative to the active flip flop shown in Figure4 is a passive micro-resonator; this is a small res-onator in which the light is strongly confined so thatthe intensity of the light in the resonator can be much
larger than the intensity of the input light. Bistableoperation in passive resonators needs high opticalfields to build up in the resonator, especially if weaknon-linearity like the Kerr effect is used. Input powerlevels required exceed those in the active flip-flop bymore than two orders. The high optical powers alsocause a signal induced heating of the cavity. So far,only thermal bistable action has been shown, which isvery slow. When using lasers with injection locking,only a small amount of optical power need beinjected to switch from one mode to the other. Sowarming due to changes in input signal will not be soimportant. Also the CW pumping of the cavity raisesthe cavity temperature, making cooling more effi-cient, and so any input light has a harder time raisingthe cavity temp. Lasers also have the advantage thatthe gain medium counteracts cavity losses, so that theinput light can be used very efficiently. All this pro-vides active devices with an important, if not deci-sive, advantage over passive resonators for applica-tion in large scale integration.
From analog to digitalAn important feature of micro-lasers is that they caninteract with each other to form low-power digitaloptical functions. And using the resonant enhance-ment of the input light (injection locking), they candrive each other. Therefore, coupled micro-cavitylasers are ideal candidates for development of digitalphotonic circuits. If successful, this will open the wayfor realizing an increasing class of functions in a digi-tal way, in the same way as it has happened in micro-electronics. This will relax the requirements on theintegration technology: the number of elementarycomponents may be reduced to flip-flops and inter-connecting waveguides. Such a development willstimulate the penetration of photonic integration tech-nology: it reduces the complexity of the integrationtechnology and it enlarges its application range.
To the limitsThe flip-flop as shown in Figure 4 has been designedconservatively in order to enhance the chance for suc-cessful fabrication. A next step will be the reductionof its size to a few micron diameter (micro disk). Thiswill increase the switching speed into the ps regionand reduce the switching energy below a femtoJoule.Ultimate dimensions may be reached by realization ofthe flip-flop in photonic crystal technology. This willbring us close to the ultimate limits achievable for thephotons: confinement of the photons on a scale ofhalf wavelength. Another important issue that has tobe solved is the electrical properties of the activematerial in the micro-cavity, which should be supe-rior in order to keep threshold currents sufficiently
Figure 4 A photonic flip-flop based on coupled micro-ring lasersrealised at COBRA. Both ring waveguides are covered with a goldcontact layer, which is used to inject carriers into the rings in order toachieve amplification of the light. In the flip-flop both rings can lase inthe clockwise (CW) or counter-clockwise (CCW) direction. They pusheach other in one direction by injection through the coupling waveguidesection between them. Using a set pulse they can be changed from CWto CCW and vice versa. If the cavity size is sufficiently small (a fewmicrons) response times smaller than 1 ps are feasible. By etching deepthrough the active waveguide layer cavity radiation losses can be keptsufficiently small even for very small ring diameter
ISSN 0085-7130 © Telenor ASA 2005

71Telektronikk 2.2005
low for allowing dense integration. Here the combi-nation of ultimate confinement of the photons in pho-tonic crystal micro-cavities and the ultimate confine-ment of the carriers in Quantum Wells and QuantumDots will bring us close to the fundamental limits andmay open new opportunities for photonic signal inter-actions.
ConclusionsDeep etching technology is the key to reduction ofdevice dimensions. By improving the performance oflithography and etching technology circuit complexi-ties into the VLSI range are feasible and, in the limitof photonic crystal technology, even larger. Deepetching technology is also the key for increasingelectro-optic and opto-optic interactions, by resonantenhancement of these fundamentally small effects. Ina broader sense control of dimensions on a nanometrescale, both via etching and via selective epitaxialgrowth, will bring us to the fundamental limits ofphotonic technology. Moore’s law will provide thedynamics for achieving that goal.
References1 Smit, M K. New focusing and dispersive planar
component based on an optical phased array.Electronics Letters, 24, 385–386, 1988.
2 Vreeburg, C G M, Uitterdijk, T, Oei, Y S, Smit,M K, Groen, F H, Metaal, E G, Demeester, P,Frankena, H J. First InP-based reconfigurableintegrated add-drop multiplexer. Photonics Tech-nol. Lett., 9 (2), 188–190, 1997.
3 Herben, C G P, Leijtens, X J M, Leys, M R,Groen, F H, Smit, M K. Extremely compact
WDM cross connection InP. Proc. 5th Ann. Symp.of the IEEE/LEOS Benelux Chapter, Delft, TheNetherlands, Oct. 30, 2000, 17–20. (ISBN 90-9014260-6)
4 Barbarin, Y, Leijtens, X J M, Bente, E A J M,Louzao, C M, Kooiman, J R, Smit, M K.Extremely small AWG demultiplexer fabricatedon InP by using a double-etch Process. IEEEPhot.Techn. Lett., 16, Nov. 2004, 2478–2480.
5 Hill, M T, Dorren, H J S, de Vries, T J, Leijtens,X J M, den Besten, J H, Smalbrugge, E, Oei, Y S,Khoe, G D, Smit, M K. A fast low-power opticalmemory based on coupled micro-ring lasers.Nature, 432, 11 November 2004, 206–209.
6 Binsma, J J M, van Geemert, M, Broeke, R G,Bente, E A J M, Smit, M K. MOVPE waveguideregrowth in InGaAsP/InP with extremely lowbutt-joint loss. Proc. 2001 Annual SymposiumIEEE/LEOS Benelux Chapter, Brussels, 3 Decem-ber, 2001, 245–248.
7 den Besten, J H, Caprioli, D, van Dijk, R, vanVliet, F E, Pascher, W, Binsma, J J M, Smal-brugge, E, de Vries, T J, Broeke, R G, Oei, Y S,Bente, E A J M, Leijtens, X J M, Smit, M K. Inte-gration of MZI-modulators and AWG -basedmultiwavelength lasers in InP. Proc. 2004 AnnualSymposium IEEE/LEOS Benelux Chapter, Gent,Belgium, 2–3 December 2004, 95–98.
8 Gong, Q, Nötzel, R, van Veldhoven, P J, Eijke-mans, T J, Wolter, J H. Wavelength tuning ofInAs quantum dots grown on InP (100) by chemi-cal-beam epitaxy. Appl. Phys. Lett., 84, 275–277,2004.
Meint K. Smit was born in Vlissingen, the Netherlands, in 1951. He graduated in Electrical Engineering from
the Delft University of Technology in 1974, and received his PhD in 1991, both with honours. In 1974 he
started work on radar and radar remote sensing. Joined the Delft University of Technology in 1976. Switched
to optical communications in 1981, research field: Integrated Optics. Became leader of the Photonic Inte-
grated Circuits group of the Delft University in 1994. He is the inventor of the Arrayed Waveguide Grating
for which he received a LEOS Technical Achievement award in 1997. Appointed professor in 1998. In that
year his group, together with the groups of profs. Wolter and Khoe (COBRA, TU Eindhoven) received a
research grant of 40 M¤ for establishing a National Research Center on Photonics. In 2002 he moved
with his group to the Technical University of Eindhoven, where he is presently leader of the Opto-Electronic
Devices group at the COBRA Research Institute. In 2002 he was appointed LEOS Fellow for contributions
in the field of Opto-Electronic Integration.
email: [email protected]
ISSN 0085-7130 © Telenor ASA 2005
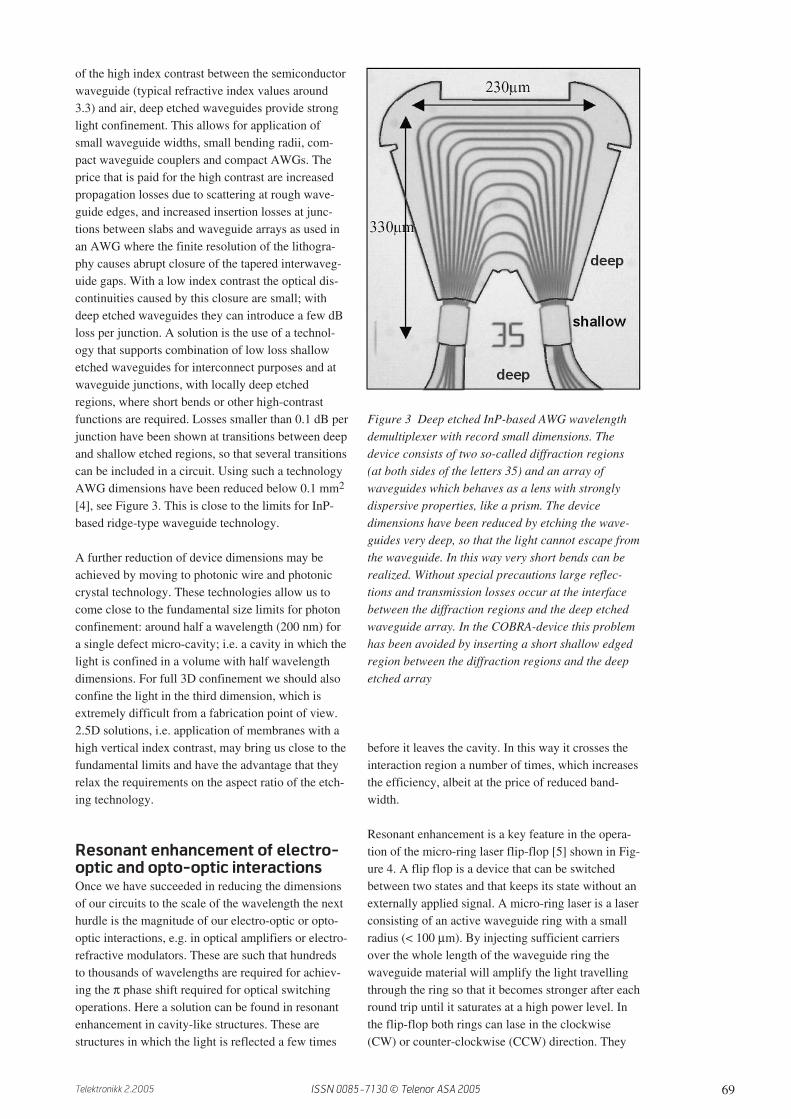
72 Telektronikk 2.2005
1 IntroductionService providers are being challenged by the in-creasingly higher cost of building and maintainingnetworks that serve a plethora of new applicationswith diverse quality of service requirements. More-over, overall traffic continues to grow exponentially[1], but service provider revenue do not increaseaccordingly, as bandwidth for most of the new(broadband) services has a significantly lower price($/b) [2]. Therefore, the main priority for networkoperators has been to rationalize their cost structure,reducing capital (CapEx) and operational (OpEx)expenditure.
Network CapEx and OpEx increased as most opera-tors initially developed separate networks for therapidly growing (packet-based) data services, and thetraditional (circuit-switched) leased line, and voiceservices (Figure 1). Most applications have beenincreasingly converging to a common IP layer, allow-ing a unified network architecture based on anIP/MPLS core, with a packet-aware SONET/SDH
and native Ethernet access over a common opticaltransport infrastructure (Figure 2), to significantlyimprove the network cost.
Metropolitan area networks (MANs) have been themost appropriate initial convergence point for multi-service architectures (Figure 3). The significantgrowth of applications with extensive metropolitannetworking requirements has further placed increasedemphasis on the scalability of mutli-service MANs[3]. MAN architectures have thus evolved; internet-working multiple “access” traffic-collector fiber ringsin “logical” star or mesh through a larger “regional”network (Figure 3) [4]. A regional metro ring oftenextends to hundreds of km, interconnecting many(typically 5–10) access-ring hub nodes [5]. A suc-cessful generation of systems addressed the initialmetro needs for efficient bandwidth provisioning,leveraging the advancements of “next-generation”SONET/SDH transport [6, 7]. Recently, wavelength-division-multiplexing (WDM) has been additionallyutilized in MANs [8]. We presently make the case fora converged metro network architecture comprisingof Ethernet/IP and traditional TDM services operat-ing over a common intelligent WDM layer, that canhelp reduce CapEx, and even more importantly OpEx,by enabling easier deployment and manageability ofservices [9, 10]. In the following sections, we reviewthe applications and services that motivated the MANevolution. We then evaluate the innovation in net-work architectures and optical transport that enablesmetropolitan networks to meet the diverse serviceneeds of enterprise and residential applications, andcost-effectively scale to hundreds of Gb/s of capacity,and hundreds of km of reach.
Advancements in metro optical network architecturesand technology
L O U K A S P A R A S C H I S , E R R O L R O B E R T S A N D O R I G E R S T E L
Errol Roberts is
Distinguished
Systems Engineer
at Cisco
Ori Gerstel is
leading the
Advanced Opti-
cal Technology
Groups at Cisco
Systems
This paper summarizes the innovation in network architectures, and optical transport that has
enabled metropolitan networks to meet the diverse service needs of enterprise and residential
applications, and cost-effectively scale to hundreds of Gb/s of capacity, and hundreds of km of reach.
A converged metro network, where IP/Ethernet services and traditional TDM traffic operate over a
common intelligent WDM transport layer, has become the most appropriate architecture for signifi-
cantly reduced network operational cost. At the same time, advanced technology and system-level
intelligence have improved the deployment and manageability of WDM transport. The most important
application drivers, system advancements, and associated technology innovations in metropolitan
optical networks are being reviewed.
Figure 1 Traditional architecture with multiple service-specificnetworks, leads to high operational cost (OpEx)
Narrowband access
network
Broadband access
network
Radio access
network
SONET/SDH
Access Network
High speed (ethernet)
access network
Voice network
TDM Network
FR/ATM Network
Optical Network
Public IP network
Private IP/MPLS Network
Loukas Paraschis
is in the Optical
Technology CTO
group at Cisco
Systems
ISSN 0085-7130 © Telenor ASA 2005
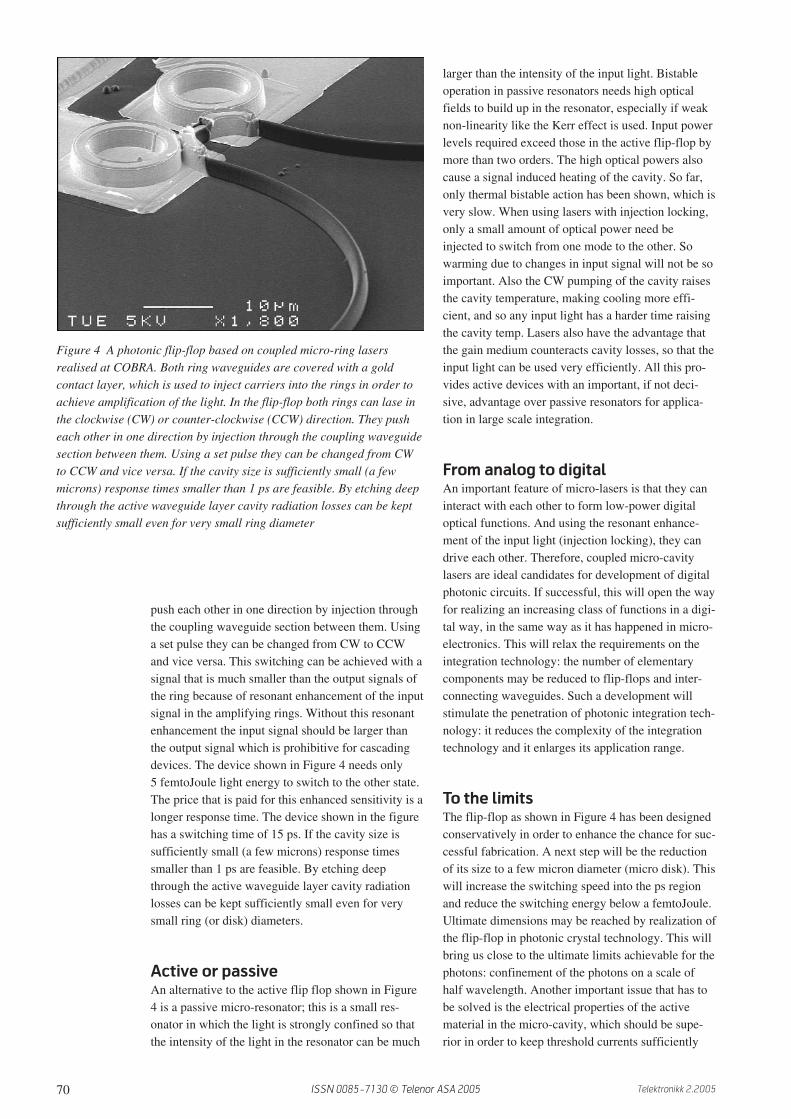
73Telektronikk 2.2005
2 Metro network applications andservices
Service providers have traditionally relied on differentnetworks (and multiple layers) to address consumerand enterprise market needs. POTS, TDM/PSTN,and to some extent ISDN, have typically served thevoice dominated consumer applications, while FrameRelay, ATM and TDM leased-line networks haveserved the more data intensive enterprise applications.At the same time, video has been mostly distributedon separate, extensively analog, networks. Over thelast few years, however, most of these applicationshave migrated to internet protocol (IP) based services.Voice over IP (VoIP), Ethernet based VPN data ser-vices, along with the fast emerging digital video overEthernet have increasingly been using MPLS/IPL2/L3 backbones and metro Ethernet transport.
Moreover, the explosive growth in e-commerce, datawarehousing, and supply chain management applica-tions has fueled significant growth in the enterprisenetwork connectivity and storage needs. The businesscritical nature of most of these applications alsocalled for uninterrupted and unconstrained connectiv-ity of employees and customers. To best support busi-ness continuance and high bandwidth applications,server consolidation in data center facilities, andapplication hosting by every location (often extend-ing to metropolitan reach), most enterprises haveupgraded their networks, replacing ATM, FrameRelay, and TDM private line with more efficientEthernet (GE and 10GE) transport. In addition, regu-latory mandates in the financial and insurance indus-tries significantly increased the bandwidth needed tosupport data back up and disaster recovery. The largefinancial firms became the early adopters of enter-prise WDM metro networks, driven by the need to
support very high bandwidth storage applications fordisaster recovery and synchronous data replicationover metro (often long) distances.
WDM offers the most scalable and transparent trans-port for the different storage protocols (ESCON,Fibre Channel, Ethernet and FICON), without theadditional latency introduced in storage extensionover SONET/SDH (with intermediate GFP encapsu-lation). The introduction of enterprise WDM net-works coincided also with the emergence of “dark”fiber providers in the late 1990s, which offeredenterprise customers the ability to own or lease fiberassets or purchase managed wavelength services.Enterprises have mostly chosen to outsource opticaltransport (not being part of their core competence) tomanaged WDM service providers, introducing addi-tional competition to traditional carriers and theirTDM leased-line revenue.
Broadband access
network
Radio access
network
2.5G/3G/4G/WLAN
SONET/SDH
High speed (ethernet)
access network
TDM Network
(circuit)
Optical Network
Access Network
IP/MPLS
network
Figure 2 Emerging converged optical multi-service networkarchitecture, significantly improving operations (OpEx)
To/from national backbone
Metro access Metro core
National backbone
Central Office
DWDM
rings
DWDM
DWDM
bus
Data center
Enterprise
Home
DWDM
Figure 3 Metropolitan networks, oftenwith extended geographical reach, havebecome increasingly important
ISSN 0085-7130 © Telenor ASA 2005

74 Telektronikk 2.2005
The explosive growth of all these applications hascalled for the re-engineering of the traditional metronetworks which had initially been designed primarilyto efficiently transport 64 kb/s voice channels andsupport a rather slow and predictable traffic growth.The new network aggregates traffic from different“access” points; today typically from IP/GE DSLAMsover twisted pair copper lines in the case of tradi-tional local exchange carriers (ILECs), or from cablemodem termination systems (CMTS) over hybridfiber coax (HFC) lines in the case of cable operators,and in the future from passive optical network (PON)links. Such residential traffic, along with traffic fromthe enterprise networks, forms the multi-service, pre-dominantly packet-based, metro optical backboneswhich eventually leverage WDM transport. MetroWDM allows different services including the tradi-tional (slower growth) TDM traffic, to be carried onseparate wavelengths as part of the same packet-optimized transport network.
3 Metro optical transportconvergence
WDM was early acknowledged as the most promis-ing technology for scalable metro networks [11]. Itsinitial deployment, however, remained rather limited,addressing mostly fiber exhaustive applications.Metro optical transport initially leveraged technologyprimarily developed for long-haul (LH). In LH WDMtransport, however, the main objective has been tomaximize fully deployed network performance, typi-cally measured in “cost per bit/s/km” or even “costper bit/s per km per Hz”. Also, LH networks typicallyhave well-defined, rather simple point-to-pointtopologies, allowing system performance to be maxi-mized in advance, and often optimized on a case-by-
case analysis. On the other hand, in metro networks,service flexibility and operational simplicity arevery important. Moreover, metro WDM cost has toaccount not only for a fully deployed network, butalso for its ability to scale with the amount ofdeployed bandwidth; as most metro networks do notemploy all (or most) WDM channels at the initialdeployment phase, but rather “lit” unused channelswhen needed to serve future (often unpredictable)network growth.
The first generation of metro WDM systems, mostlybased on LH technologies, had high fixed initial capi-tal cost, inflexible (stranded) bandwidth provisioning,and complex operations. Subsequent “point-product”solutions attempted to lower the fixed-capital cost(i.e. CapEx) at the expense of bandwidth scalability,but suffered from even higher operational complexity– hence higher OpEx). More generally, initial metroWDM was limited by lack of “plug-and-play” opera-tional simplicity, requiring service interruption forunplanned network growth and high CapEx due tounnecessary optical-electrical-optical (OEO) conver-sions and the associated high inventory cost of “fixed”WDM. As a result, network operators delayed WDMdeployment in their metro networks until these prob-lems were solved with mature technologies from astable supply base.
At the same time, the evolution of the SONET/SDHtransport standards [6] enabled a successful genera-tion of systems that enabled efficient bandwidth pro-visioning, addressing most of the initial MAN needs,leveraging the advancements in electronics, and 2.5Gb/s (STM-16) and 10 Gb/s transport (STM-64) [6,7]. These “next generation” SONET/SDH systemsfurther allowed significantly improved packet-based
Figure 4 Integration of TDM and Data service in Metro networks
Access rings Office Interoffice rings PoP
TDM
Access ringsOffice
PoP
Option A: Overbuild for New Services
Option B: Integrate New Services onto NG SONET
Interoffice rings
TDM
ISSN 0085-7130 © Telenor ASA 2005

75Telektronikk 2.2005
transport over the existing time-division-multiplexed(TDM) infrastructure (Figure 4B), based on the newdata encapsulation protocols (GFP, VCAT, LCAS)[11]. Packet-aware service provisioning enabled Eth-ernet “virtual” private network (VPN) over a com-mon service provider MAN. The initial rate-limitedbest-effort Ethernet service architectures evolved tooffer quality of service guarantees for Ethernet, aswell as IP services (like voice-over-IP) and packet-aware ring architectures, like the Resilient PacketRing (RPR) IEEE 802.17 standard, provided band-width spatial reuse. Such layer 2, and eventually layer3, intelligent multi-service provisioning has enabledsignificant statistical multiplexing gains, enhancingnetwork scalability. The table in Figure 4 illustratesan example [2] for a network with VC-4 granularitythat serves a VPN with four Gigabit Ethernet (GE)sites, six additional point-to-point GE connections,and a storage area network with two GE and twofiber-channel (FC) services. A “purely” optical solu-
tion would require at least six STM-64 rings that,even after leveraging VCAT, would be at least 75 %full. An advanced multi-layer implementation(ML+VCAT) could be based on just 4 STM-64 rings,each with less than 40 % of capacity utilization, sav-ing more than 50 % in network capacity. This newgeneration of multi-service platforms allowed for thefirst time different services to be deployed over acommon network infrastructure, instead of separatenetworks (Figure 4 A), also significantly improvingnetwork operations – and reducing OpEx.
As traffic needs grew beyond 10 Gb/s per fiber, how-ever, WDM transport became the best alternative fornetwork scalability. To this end, multi-service systemsevolved to “incorporate” WDM interfaces that connectthem directly on the metro fibers, thus eliminating anyunnecessary optoelectronic (OEO) conversions and theassociated OEO cost. The integration of WDM inter-faces in the service platforms also changed the tradi-tional “service demarcation point” in the network archi-tecture. This seemingly straightforward convergence ofthe transport and service layers has introduced addi-tional requirements for improved manageability in theWDM transport. The introduction of many different“wavelength services” amplified the value for “open”WDM architectures that provide robust and flexibletransport. In this sense, a converged, flexible WDMmetro transport architecture that supports all the differ-ent services with the lowest possible OpEx, leveragingelaborate planning and operational tools, and enablingstandards-based interoperability, has become in-creasingly important (Figure 5).
Required VC4:
VCAT only ML + VCAT
91 Ring 1 30
84 Ring 2 30
49 Ring 3 26
21 Ring 4 8
245 Total VC4 94
(6) 75 % full STM64 Rings (4) 40 % full
Regional
hubMetro
access
Customer
location(s)
Increase Revenues (New Services)Increase Revenues (New Services)
• Flexible transport
• Automation
• Reconfigurability
10/10
0 P
L
Lin
e r
ate
GE
Vid
eo
Mu
lti-
po
int
SA
N
Wa
ve
len
gth
T
D
M
Mu
lti-
po
int
VP
N
Lo
we
r c
ost/
bit
Metro Regional WDM networking
Figure 5 Converged Multi-service Metro Optical Networks
ISSN 0085-7130 © Telenor ASA 2005
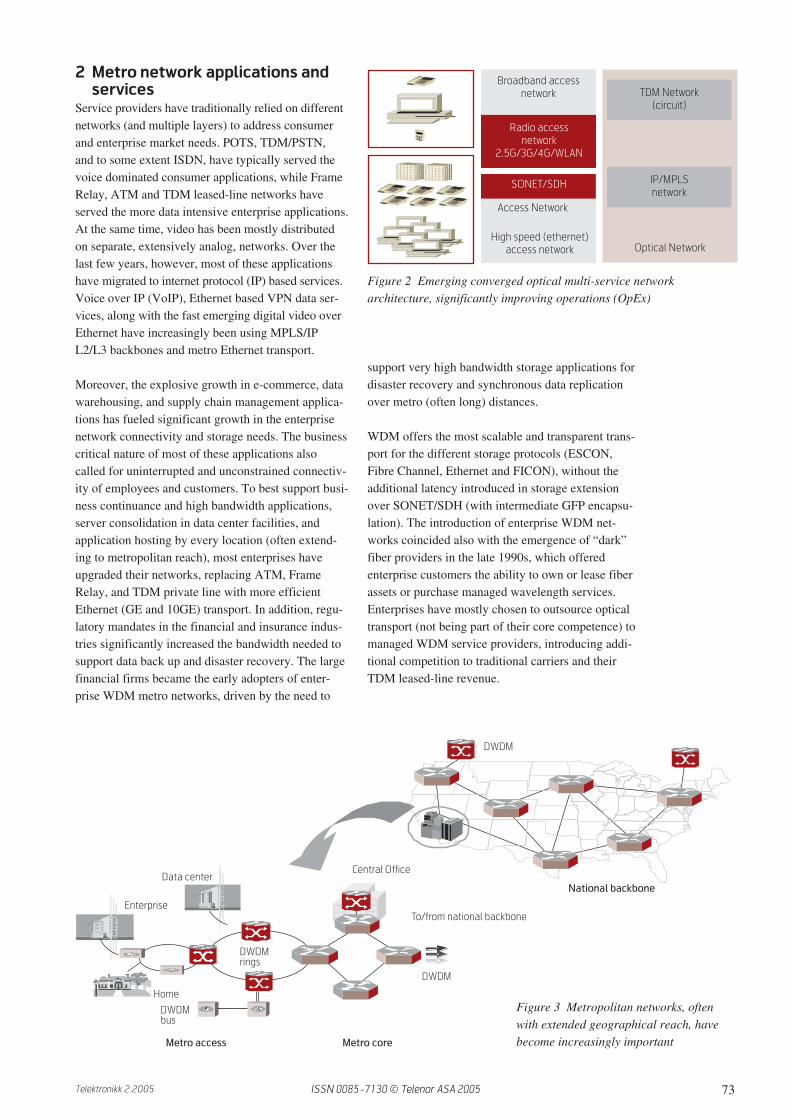
76 Telektronikk 2.2005
4 Flexible WDM transportA new generation of metro-optimized WDM trans-port (often referred to as Multi-Service TransportPlatforms or MSTPs) has contributed significantlyto the recent progress in MAN WDM deployments.WDM transport enables elaborate optical add-dropmultiplexing (OADM) architectures that transpar-ently interconnect the different MAN nodes (Figure6 – left) [11, 4]. MSTP WDM systems have furtherscaled cost-effectively to hundreds of Gb/s, and tohundreds of km [9]. Even more so, these metro-opti-mized systems have significantly enhanced ease ofdeployment and operation, by automated control andintegrated management of the optical transport layer.
Although the present analysis is not intended to elab-orate the full technical details of MSTP innovation(which are available in [9, 12, 14, 17]), it is importantto identify that the evolving nature of metro net-works, from simple access to regional reach, placesan additional significant challenge on the design of aWDM system that offers span flexibility, operationalsimplicity, and low cost even at a large number ofnodes. The key to a robust and cost-effective imple-mentation of a system carrying hundreds of Gb/s overhundreds of km, is to leverage mature WDM tech-nologies, most notably erbium-doped-fiber ampli-fiers. In this sense, optical amplification noise (ASE)and chromatic dispersion, at 10 Gb/s or higher linerates, are the primary physical impairments that limitthe system performance. More complex transportdesigns, with multiple OADM nodes, could also belimited by amplifier gain ripple or transients, filterconcatenation and loss variation, span loss variationdue to ageing or repairing, and in the case of meshnetworks, ASE lasing [9]. Therefore, metro-opti-mized solutions need to address the trade-off betweenservice flexibility and optical signal-to-noise-ratio(OSNR), guaranteeing the bit-error-rate (BER) per-formance requirements (typically BER < 10–15),
while minimizing inflexible channel banding andcost.
Most notably, the LH practice of having tight controlof the channel power along the link using per channelgain equalizer would lead to a significant costpenalty. Building on the fact that most physicalimpairments of interest impact the total opticalpower, we have designed a cost-effective WDM sys-tem that meets the metro regional performancerequirements by monitoring and regulating the multi-plex power, unless the power of individual channelsis already available, at selected critical points alongthe optical paths [9, 14]. Simple optical tap couplersand photodiodes are used to monitor the opticalpower, and automatic control software has beendeveloped to regulate optical power within each nodeby adjusting appropriately the settings of in-line vari-able optical attenuators (VOA) and the optical ampli-fier gain. This metro-optimized WDM design andcontrol, along with currently available EDFA sub-systems with variable gain and variable-loss mid-stage access, have enabled 32 x 10 Gb/s WDM trans-port to cost-effectively scale to > 1000 km [14]. Fur-thermore, the control layer is able to self adjust eachnode, enabling automatic “plug and play” node setupduring the installation phase. The same system designinnovation enables automatic adjustment for ageingeffects and/or traffic changes.
In [9] we reported in detail results from this innova-tive and practical WDM system that leverages suchan automatic optical power control layer. We furtheranalyzed the performance of a 32 x 10 Gb/s system inan actual 400 km ring (no recirculation loops) witheight optical nodes. We also demonstrated “stressed”system performance for a 10 Gb/s 480 km link inanother network with 16 OADMs and highly non-uniform spans (Figure 7). Both results use commer-cially available optical components, and standard sin-
1
10
100
1000
Ca
pa
cit
y (
Gb
/s)
A - Z distance (km)
1 10 100 1000
Metro
Metro
regional
long
Extended/ultra
Intra-metro/regional
transport fabric
Access/collector
transport fabricMSTP
Figure 6 Metro Regional Network benefit from flexible multi-service optical transport that could extend tohundreds of km and Gb/s
ISSN 0085-7130 © Telenor ASA 2005

77Telektronikk 2.2005
gle mode (G.652) fiber, and well exceed all previ-ously published related demonstrations. This WDMsystem offers optical add/drop flexibility, span non-uniformity, and installation/maintenance simplicity,with 32 x 10 Gb/s transport performance that scalesto 15 x 20 dB, for a total reach that could exceed1000 km [14]. We also demonstrated such extendedsystem reach with reconfigurable OADMs (ROADMs)and analyzed the performance improvements arisingfrom the corresponding better channel optical powercontrol with ROADMs [14].
In addition to automated and scalable link engineer-ing, ROADM flexible network design is also verycritical to the success of metro WDM architectures.More specifically, wavelength-level add/drop andpass-through, with automated reconfigurability(ROADM) at each service node, is the only opera-tionally robust solution for WDM deployments thatsupport the uncertain (often unpredictable) futuretraffic patterns in MANs that scale to hundreds of
Gb/s. ROADM network flexibility also provides theability to set up a wavelength connection without vis-iting any intermediate sites, thus also minimizing therisk of erroneous service disruptions during networkupgrades. A few different optical switching devicetechnologies have been proposed, including liquidcrystals, MEM structures, tunable thin films, oretalons. Each technology offers different performanceand functionality characteristics [14, 15]. In the con-text of the present analysis, it is more important toidentify and distinguish between their two main func-tional characteristics at the network level: 1)ROADM solutions allow for switching of each indi-vidual wavelength between the WDM ingress andegress, potentially among more than one fiber facil-ity. 2) More elaborate solutions could also allowextraction or insertion of any client interfaces to anywavelength of any fiber [14]. This latter solution hasoften been proposed in combination with predeployedtunable transmitters and/or receivers, to realizeadvanced network automation, via a GMPLS control
Figure 7 Spectra for two 10G channels in the worse-case path (120 dB loss) in the 16 node MRAN (top)
90.1 km
22.5 dB
32.3 km
8 dB
27.3 km
6.5 dB
72 km
18 dB
28.5 km
7 dB
4 dB
10.7 km
2.8 dB
10 dB
5 dB
5 dB
10 dB
3 dB
5 dB
5 dB
10 dB
O LA
BOADM BOADM
FOADM
BOADM
BOADM
BOADM
BOADM
BOADM
BOADM
FOADM
BOADMBOADMBOADMBOADMBOADMBOADMBOADM
BOADM
BOADM
FOADM
10 dB
BOADM
FOADM
1528 1545.5
-23.4
dB
-35.4
-47.4
-59.4
-71.4
3
4
1
L1: 1550.120 nm
L3: -35.49 dBm
L4: -59.91 dBm
L4-L3: -24.42 dB
-23.4
dB
-35.4
-47.4
-59.4
-71.4
3
4
1
L1: 1550.120 nm
L3: -35.49 dBm
L4: -59.91 dBm
L4-L3: -24.42 dB
1528 1545.5 1563
nm
ISSN 0085-7130 © Telenor ASA 2005
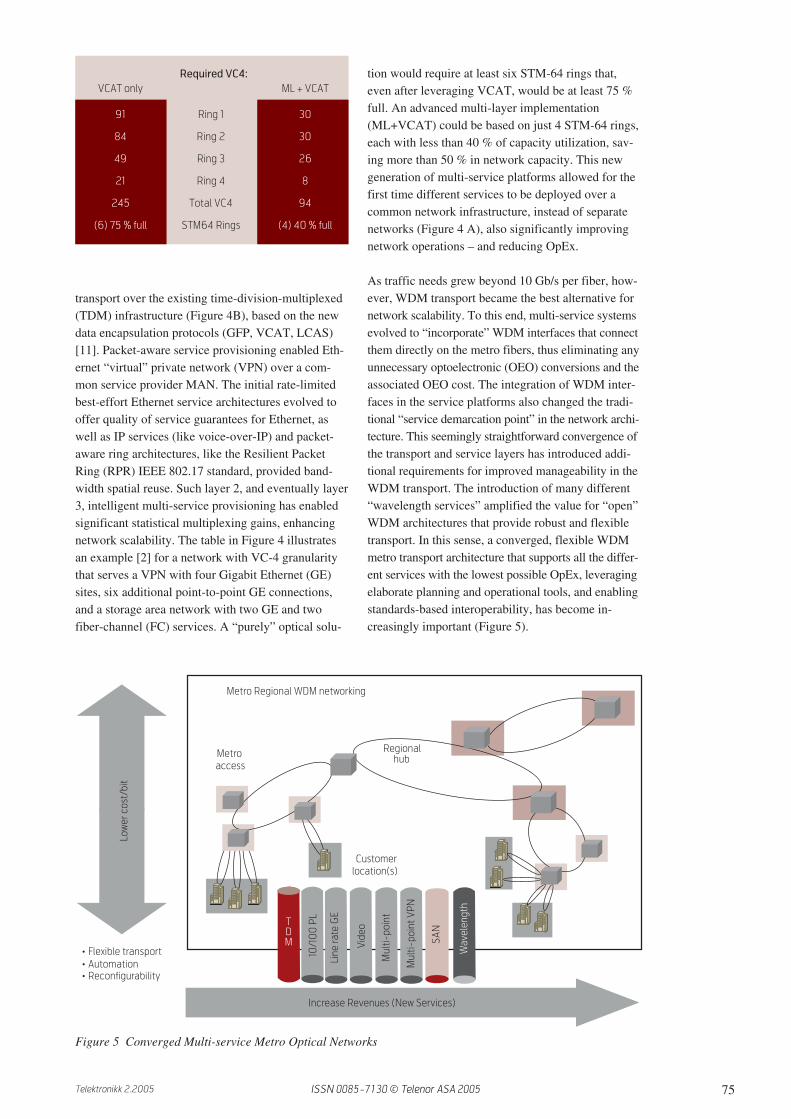
78 Telektronikk 2.2005
Figure 8 The network convergence at the IP and theWDM layers best minimizes CapEx and OpEx
plane, enabling dynamic bandwidth provisioning andfast shared optical layer mesh protection. Current net-work deployments, however, are primarily interestedin the ROADM functionality and the most cost-effec-tive related technologies (rather than in the mostadvanced solution that would meet any conceivablefuture need, irrespective of price). In this sense, PLC-based wavelength-selective switches, with someswitching capability among few fibers, have suffi-cient functionality to meet most customer needs whilebeing the most mature and thus cost-effective tech-nology [15].
Tunable laser technologies are also being increas-ingly employed in Metro WDM systems to reduceinventory cost and improve operations [16]. Thechoice of the appropriate transmitter technology isparticularly important, as its cost usually dominatesthe total cost of a fully-deployed transport system[17]. Pluggable transceiver technology has also beenincreasingly maturing, offering significant advantagesand promising to soon address the needs of evendense (100 GHz) WDM 10 Gb/s MANs [18]. At suchhigh data rates, however, optical performance, pre-dominantly dispersion tolerant (chirp minimized)modulation, becomes increasingly important. Furtheradvancements in transmitter technology and electron-ics, most notably EFEC and EDE, promise to enablelower cost multi-service transceiver [17]. Such nextgeneration transmitters that would be more easilyintegrated into the different service platforms are veryimportant, not only for their enhanced performance orlower cost, but also for further simplifying the net-work architecture and thus reducing the overall net-work cost.
5 Further integration of IP overWDM
As IP traffic outpaces any other traffic type in net-works worldwide, a tighter “integration” of WDMwith the routers and switches (Figure 8) allows themost significant network simplification. UnlikeTDM, which has unified management with opticaltransport, and also included WDM interfaces onSDH/SONET multiplexers and cross-connects, the IPlayer has yet been mostly designed separately fromthe transport layer. Traffic between core IP routers,however, has increasingly started to exceed 2.5 oreven 10 Gb/s in most metro and regional networks.Therefore, such IP trunks can be economically trans-ported through multiple intermediate sites withoutrequiring any (layer 1-3) electrical processing andadditional cost due to electrical grooming betweenthe routers and the WDM layer. Hence, a much lowercost solution is achieved by originating the WDMwavelengths directly from the router and transport
them through the MSTP network, thus minimizingOEO (costly) conversions between the optical andelectronic domains.
Pluggable WDM modules in routers and switcheshave recently enabled the first such “converged”deployment in the emerging IP-video MAN architec-tures [19]. The advents in optical switching and trans-mission technologies discussed in section 4 furtherallow a flexible optical infrastructure that efficientlytransmits and manages the “optical” bandwidth,enabling advanced network architectures to leveragethe IP-WDM convergence, and to realize the associ-ated CapEx and OpEx savings. These architectureswould ideally be based on open “WDM” solutions(like the ones described presently), so that the sameWDM infrastructure can also continue to support tra-ditional TDM traffic, as well as wavelength servicesor other emerging applications that may not convergeover the IP network, e.g. high speed (4 or 10 Gb/s)fiber channels. Such open WDM architectures (Fig-ure 8) further need to offer performance guaranteesfor the different types of wavelength services, includ-ing “alien” wavelengths, support mesh network con-figurations, and also benefit from coordinated man-agement, and network control. These objectives cur-rently constitute the most important advancements inthe next generation of WDM transport [19].
6 SummaryIn this paper, we discuss the innovation in networkarchitectures and optical transport that enablesmetropolitan networks to cost-effectively scale tohundreds of Gb/s of capacity, and to hundreds of kmof reach, meeting the diverse service needs of enter-prise and residential applications. A converged metronetwork, where Ethernet/IP services, along with thetraditional TDM traffic, operate over an intelligentWDM transport layer is increasingly becoming themost attractive architecture addressing the primaryneed of network operators for significantly improvedcapital and operational network cost. At the sametime, the optical layer of this converged network has
SAN
FR ATM VOIP CEM
CC IP/MPLS
TDM λ services
DWDM
SAN IP
Ethernet
ISSN 0085-7130 © Telenor ASA 2005
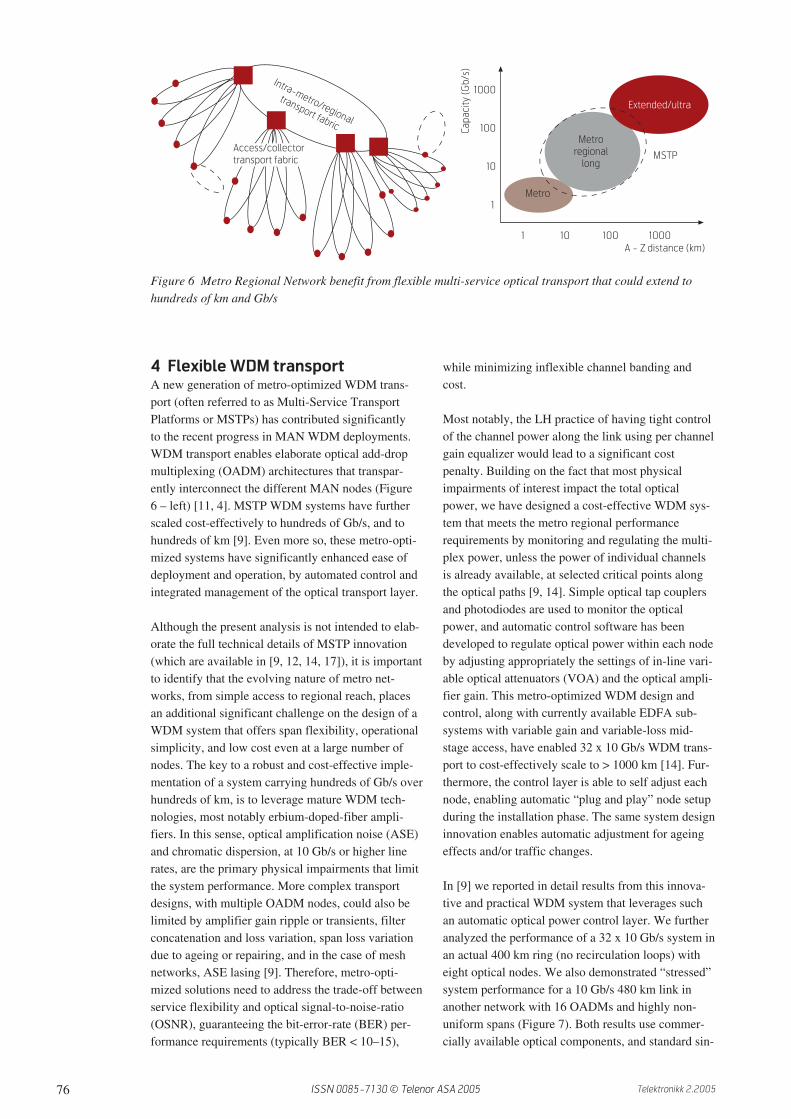
79Telektronikk 2.2005
to introduce intelligence and leverage advanced tech-nology in order to significantly improve the deploy-ment and manageability of WDM transport. We havereviewed the most important operational advance-ments and the technologies that cost-effectivelyenhance the network flexibility, and advance the pro-liferation of WDM transport in multi-service metronetworks.
References1 Coffman, K G, Odlyzko, A M. Growth of the
Internet. In: Kaminow, I P and Li, T (eds.). Opti-cal Fiber Telecommunications IV B. AcademicPress, 2002, pp. 17–56. URL:http://www.jpix.ad.jp/jp/techncal/traffic.html
2 Ramaswami, R. Market watch. In: Optical FiberCommunication Technical Digest Series, Confer-ence Edition, Optical Society of America, 2004.
3 Special Issue on “Metro & Access Networks”.J. Lightwave Technol., 22 (11), Nov. 2004.
4 Ghani, N et al. Metropolitan Optical Networks.In: Kaminow, I P and Li T (eds.). Optical FiberTelecommunications IV B: Systems and Impair-ments. Academic Press, 2002, p. 329–403 (Chap-ter 14).
5 Madamopoulos et al. Design, transport perfor-mance study... In: OFC Technical Digest Series,Optical Society of America, 2002, Paper ThH6.
6 Cavendish, D. Evolution of Optical TransportTechnologies … IEEE Comm. Magazine, 38 (6),164–172, 2002.
7 Paraschis, L et al. Challenges in … In: Proc. ofContemp. Phot. Techn., Japan, 2001, WA1
8 Plote, S. Metropolitan service provider businessmodel for profitability. In: Optical Fiber Commu-nication Technical Digest Series, Conference Edi-tion, Optical Society of America, 2004. Paper WG3.
9 Macchi, M, Piccacia, S, Paraschis, L, Gerstel, O.Design and Demonstration of a ReconfigurableMetro-Regional WDM 32 x 10 Gb/s System Scal-ing beyond 500 km of G.652 Fiber. In: OpticalFiber Communication Technical Digest Series,Conference Edition, Optical Society of America,2004. Paper OTuP2.
10 The authors would like to acknowledge the con-tributions of many people at Cisco Systems, aswell as at service providers and partner compa-nies.
11 Saleh, A et al. Architectural Principles of …J. Lightwave Technol., 17 (10), 2431–2448, 1999.
12 ITU-T. Generic Framing Procedure. Geneva,2001. (ITU-T Draft Rec. G.7041)
13 Paraschis, L. Optical Technology Innovation inMetropolitan Networks. SPIE, 2003, 5282-01.
14 Ferrari, C, Pastorelli, R, Piciaccia, S, Paraschis, L,Gerstel, O. Flexible and Reconfigurable Metro-Regional WDM Scaling beyond 32x10 Gb/s and1000 km of G.652 fiber. In: LEOS 2005 – The18th Annual Meeting of the IEEE Lasers andElectro-Optics Society, November 2005, TuG5.
15 Viscardi, V et al. Asymmetric reconfigurableOADMs for Metro-DWDM networks. In: OpticalFiber Communication Technical Digest Series,Conference Edition, Optical Society of America,2004. Paper TuH 3.
16 Paraschis, L. Advancements in Metro Optical Net-work Architectures. SPIE, 2004. 5626-45.
17 Paraschis, L, Gerstel, O, Ramaswami, R. TunableLasers Applications in Metropolitan Networks.In: Optical Fiber Communication TechnicalDigest Series, Conference Edition, Optical Soci-ety of America, 2004. Paper MF 105.
18 Paraschis, L. Innovations for Cost-effective10 Gb/S Optical Transport in Metro Networks.Invited Presentation in LEOS 2004: The 17thAnnual Meeting of the IEEE Lasers and Electro-Optics Society, Puerto Rico, 7–11 November2004, p 633–634, vol 2. Paper WU1.
19 Theodoras, J et al. Emerging Optical Technolo-gies in Multi-service Metro Networks. InvitedPresentation in LEOS 2003: The 16th AnnualMeeting of the IEEE Lasers and Electro-OpticsSociety, Tucson, Arizona, USA, 29–30 October2003. Paper WP1.
20 Ramaswami, R. IP + Optical in the Next Genera-tion Network. Intl. Conf. on IP + Optical Net-work (iPOP2005), Tokyo, Japan, Feb 21, 2005.
ISSN 0085-7130 © Telenor ASA 2005
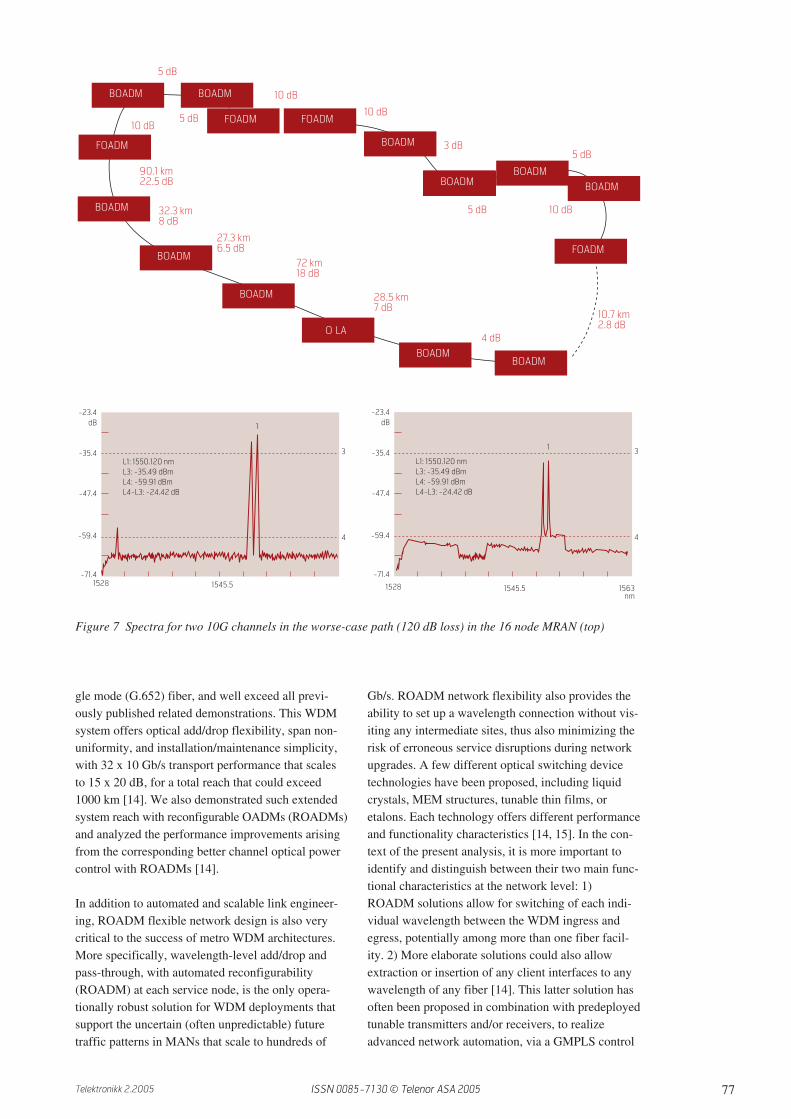
80 Telektronikk 2.2005
Errol Roberts is a Distinguished Systems Engineer. Errol has been with Cisco for over eight years with
technology focus in IP, Optical Transmission and Data Center Technologies.
email: [email protected]
Ori Gerstel (SM’01) is leading the Advanced Planning and Technology Team, which is part of Cisco’s Optical
Networking Group. In this role he is responsible for looking at how new technologies influence optical net-
working, including SONET/SDH, SAN transport and DWDM. Until 2002 he was a Senior Systems Architect
for Nortel Networks’ MEMS based photonic crossconnect product. Before joining Xros/Nortel, Ori was the
Systems and Software Architect for the Optical Networking Group at Tellabs, where he architected the first
commercial mesh DWDM system. Prior to that, he performed early optical networking research at IBM
Research. Ori has authored over 50 papers and patents on optical networks and served on the program
committee of OFC, INFOCOM and other conferences and journals. He also teaches the Optical Protection
short course at OFC. Ori holds a PhD degree from the Technion, Israel.
email: [email protected]
Loukas (Lucas) Paraschis is in the Optical Technology CTO group at Cisco Systems, responsible for the
evaluation of next generation optical multiservice transport technologies, network architectures, and
R&D projects. At Cisco, he has primarily worked on metropolitan WDM networks, IP-optical and broadband
architectures and techno-economical analysis of converged transport evolution, and multi-service network
reliability evaluation. Prior to Cisco, Loukas completed his graduate studies at Stanford University (PhD
1999, MS 1998), and worked as an R&D engineer. He has (co)authored more than 30 peer-reviewed
technical publications, multiple invited, keynote, and tutorial presentations, many technical reports, and
three patent disclosures. He is the editor for optical networks in JCN, was guest co-editor for JLT (Nov.
2004), panelist in National Science Foundation (NSF), and has been in technical conference organizing
committees, and a member of IEEE and SPIE. Loukas was born and raised in Athens, Greece, where he
completed his undergraduate studies.
email: [email protected]
ISSN 0085-7130 © Telenor ASA 2005

Switches, crossconnects, routers,exchanges …Switches, crossconnects, routers, exchanges – from afunctional point of view they all serve one main pur-pose: To connect incoming traffic on a given inputport to a given output port.
Deploying switches (or crossconnects/routers/ex-changes) in a network leads to more automated han-dling of the connections. More automated handlingmeans less manual interaction, which in turn leads totime and personnel savings. On top of that a propermanagement system will offer a better overview ofthe network and its resources. And all this is eventu-ally translated into a reduction of the operationalexpenses, OpEx. History has shown that all telecom/datacom network technologies will eventuallybecome fully automated, from telephone exchangesthrough IP routers to the emerging wavelengthswitches.
The switch is the key element of any network tech-nology. While the generic functionality is equivalent,the internal switching differs a lot for the differenttechnologies. In IP-routers packets are switched, andin telephone exchanges and wavelength switcheswhole circuits are switched. Even within wavelengthswitches – which are the topic of this article – thereare different switching technologies and philosophies.A non-exhaustive classification of different switchesis shown in Figure 1.
Observe that the terminology around wavelengthswitches is not clear. Frequently they are referred toas optical crossconnects or optical switches, but evenSDH digital crossconnects are occasionally calledoptical switches.
Wavelength switching in a historicalperspectiveFibre optic switching has been the focus for researchgroups across the world ever since the advent of fibreoptic transmission. Nevertheless, wavelengthswitches have not yet faced their great breakthroughregarding commercial deployment. Tellium, a NorthAmerican start-up company which no longer exists,was the wavelength switch pioneer with the firstcommercial offerings in the late 90s. Their equipmentwas based on electrical switch cores. This was fol-lowed by a few years of dramatically rising attentionto optical switching, and the optical industry wasexperiencing an unprecedented optimism.
At one stage CNN reported almost daily about the lat-est rumours, mergers and acquisitions, at NASDAQoptical switching companies were red-hot, and mostof the larger system houses acquired optical switchstart-ups for huge amounts of money. This develop-ment culminated in the spring 2000 where Nortelpaid $3.25 billion in stock for Xros, a 90 staff start-up. Xros had designed an all-optical wavelength
Wavelength switches and the automated optical network– Status and outlook
C L A U S P O P P L A R S E N
Claus Popp
Larsen is Project
Manager at
Acreo, Stock-
holm, Sweden
Wavelength switches have faced an extraordinary rise and a grand crash during the last 5–10 years.
They never got a commercial breakthrough, but now the circumstances have changed and wave-
length switches hold a great promise for the emerging convergence of datacom and telecom because
of their ability to carry all common signal formats. Wavelength switches with electrical switch cores
can be readily deployed in existing networks (opposed to switches with optical switch cores), and with
the ASON/GMPLS control plane they are ideal as the key elements in the automated optical network.
Such a network will not appear overnight, but wavelength switches offer a gradual upgrade path
towards the vision that is slowly but steadily coming true.
Figure 1 A non-exhaustive classification of different types of switches.The telephone exchange does not really fit in as it is not used in a tele-com network, but it is nonetheless included for comparison
��������
����
Ethernet
switch
IP
router
Analogue
Digital
SDH Cross-
connect
��������
Payload switchOverhead not switched
ATM
switch
Telephone
exchange
��������
Pa
ck
et
sw
itc
h
Sw
itc
h, ro
ute
r, c
rossc
on
ne
ct,
exh
an
ge
Cir
cu
it s
wit
ch
Wavelength switchEverything is switched
81Telektronikk 2.2005 ISSN 0085-7130 © Telenor ASA 2005

82 Telektronikk 2.2005
switch with allegedly more than 1000 ports. Thepreferred technology for these monster switcheswas (with the exception of Corvis) 2D or 3D MEMS(micro electro-mechanical system) switches consist-ing of tiny (typically a couple of µm2) movable mir-rors deflecting the light in the required direction.
In retrospect we can now clearly see that neither thetechnology nor the market were ready for such largeswitches. The combination of inadequate yield, lowlong-term reliability and high cost issues caused thevast majority of switch fabric vendors as well as sys-tem vendors based on these MEMS switches to dis-appear from the market. Also, there was no need forsuch port numbers, and the management systems andcontrol planes were not mature enough to supportautomated operation of the network – and thus theOpEx savings otherwise making the business case forswitches were in fact absent.
The situation is different today. The amount of trafficis getting sufficiently high, the management systemsand control planes are becoming mature, and reliableand low-cost wavelength switches are commerciallyavailable. Operators and network owners today areextremely cost sensitive and they still remember thesituation only a few years ago – wavelength switcheslive with a slightly shaded reputation. This is a shamebecause a new generation of switch companies hasappeared that focus more on the business case thanon the technology itself. The commercial applicationsare considerably less ambitious than what was envi-sioned during the heydays. Rather than deliveringhuge core network nodes, wavelength switches todayare used for applications such as equipment testing(typically routers or optical instruments), protectionof optical connections, high-capacity Internet ex-changes and smaller networks handling differenttypes of traffic. More sophisticated applications arefound in research networks and test-beds at academicinstitutions and major operators worldwide.
Switch fabric technologiesThere are two main types of wavelength switches.One type contains an electrical switch fabric and iscalled an OEO switch (meaning optical input, electri-cal switching, optical output), while the other type isbased on an optical switch fabric and is correspond-ingly called an OOO switch (the middle “O” denotingoptical switching). OOO wavelength switches arealso referred to as “photonic switches” or “all-opticalcrossconnects” or something similar.
The great attraction of OOO wavelength switches isthat they do not need to terminate the optical signal;everything passes right through. By saving optical/
electrical conversion (lasers and receivers) and elec-tronics within the switch, the node price can poten-tially be considerably lower than other types ofswitches.
Assume that the optical switch fabric itself will oncebecome comparable with the electrical switch fabricconcerning yield, reliability and cost – this is not thecase today but could well be so in a not too distantfuture. In that case the OOO wavelength switch willhave some significant advantages over the OEOswitch with regard to port count and bit rate upgrade.The cost of an OEO wavelength switch scales almostlinearly with port count. This is because the opticsand electronics associated with the ports scale withport size, whereas this is not the case for the switchfabric, the backplane, assembly etc. For an OOOwavelength switch there are no active components atthe ports (perhaps apart from monitoring equipment)and the cost will scale with a factor considerably lessthan the port number. Moreover, when the bit rateincreases by a factor of four, the OEO switch cost ismultiplied by about a factor of four (also herebecause of the port costs) while the OOO switch costremains virtually unchanged.
However, there is a price for the transparency – orrather for not terminating the optical signal: With noaccess to the electrical copy of the signal, monitoringbecomes much more complicated, and regenerationbecomes a huge challenge. Indeed, there is currentlyno commercial all-optical 3R regenerator although alot of research is taking place in that area. An OEOwavelength switch, on the other hand, offers the pos-sibility for 3R regeneration – amplification, signalreshaping and retiming – just like all other types ofswitches. The fact that monitoring becomes compli-cated and that the signal cannot be easily regeneratedputs instead more severe requirements on the trans-mission system and subsequently the network designfor OOO switches.
An OEO switch can be relatively easily integrated inan existing network because it can interface with thealready existing transmission system, e.g. a DWDMlink. This cannot be done with an OOO switch, as thewhole idea is to avoid the termination of the opticalsignal. Instead, the transmission system has to reachmuch further so it can bypass at least one switch orpreferably more in a larger network. And if this net-work deploys any kind of dynamic switching (whichis a main driving force behind wavelength switches)there are all kinds of issues with power budget, powerbalance between channels, non-linear effects, etc., andleast but not last: A long-haul transmission link couldeasily offset the savings obtained by the switches.
ISSN 0085-7130 © Telenor ASA 2005

83Telektronikk 2.2005
All the above mentioned issues can be solved techni-cally, but not at a price that today justifies commer-cial deployment in large, dynamic networks. Thisdoes not mean that OOO switches lack practicalapplications; it rather means that they do not cur-rently compete in the same segments as OEOswitches. It should be mentioned that hybridsbetween OEO and OOO switches exist, for instancewith electrical termination of the optical signal at oneof the sides only. Switch designs combining opticaland electrical switch fabrics have been devised, butneither of these are used commercially.
OOO wavelength switches are indeed used commer-cially in applications such as simple 1+1 protectionswitching, high capacity Internet exchanges and theemerging light exchanges, and for automated testingof optical instruments and IP-routers. But again, forlarge, dynamic networks, OOO switches are todayinadequate. OEO switches as key elements in suchnetworks are discussed later in this article.
Wavelength switches andcompeting technologiesWavelength switches can in principle be deployedanywhere whole wavelengths are handled. The com-peting technologies in commercial networks todayare the Layer 3, 2 and 1 switches. These are typicallyIP-routers, Ethernet switches and SDH crossconnects,respectively. Also manual patching can be seen as acompeting “technology” for some applications butwill not be further pursued here.
The greatest advantages with wavelength switches(both the OEO an OOO versions) are most likely thefollowing:
• They provide the simplest and most economicalway to bypass a node with a whole wavelength;
• They are protocol agnostic – can be used to con-verge all types of traffic.
Simple & economical. In Layer 3, 2, and 1 switchesthe wavelength is divided into smaller units that areindividually processed and switched. In Layer 3 and2 switches the units are packets, and in Layer 1switches (SDH) the units are virtual containers, VCs.Switching a multitude of units rather than the wholewavelength adds to the complexity of the switch andthe amount of electronics involved. This in turnmakes the wavelength switch potentially more costeffective than the higher layer counterparts – at leastwhen whole wavelengths are bypassed or otherwisehandled with no required access to the individualunits.
Protocol agnostic. Operators across the world are inthe process of converging their network layers intopreferably only one backbone layer that should beable to carry all types of telecom and datacom ser-vices. Opposed to all other types of switches a wave-length switch is protocol agnostic in the sense that itcan readily carry all common digital formats. WhileEthernet cannot carry SDH traffic in a meaningfulway, SDH can carry Ethernet traffic. Using genericframing procedure, GFP, an SDH signal can alsoaggregate lower rate Ethernet signals, which is veryuseful at the edge of the network, and the equipmentis called next generation SDH or multi-service
Figure 2 Comparison between OEO and OOO wavelength switches
Figure 3 Each network layer has its own switch
EO
EO
EO
EO
OE
OE
OE
O
OE
OE
An OEO switch terminates the
optical signal which:
• Enables monitoring and 3R
regeneration
• Makes it compatible with
existing systems
OE
OE
OE
OE
Elect.
switch
fabric
OE
OE
OE
Opt.
switch
fabric
An OOO switch does not terminate
the optical signal which:
• Makes it bit rate transparent
• Reduces the port cost, but
• Puts higher requirements on
transmission system, management
system and netwrk design
• Prevents it from upgrading an
existing network
Wavelength
switch
Ethernet
switch
Manual
patching
3
2
1
”0”
IP router
SDH digital
crossconnect
Network
layer
Type of
switch
ISSN 0085-7130 © Telenor ASA 2005

84 Telektronikk 2.2005
switching platform. However, no matter what thisextended SDH is called, it is still not nearly as trans-parent as a wavelength, and above all, it is inherentlyinefficient and costly when it comes to switchingwhole wavelengths rather than fractions of wave-lengths.
In practice, wavelength switches would be used tocomplement existing equipment rather than replacingit. In the long term by letting the wavelength switchhandle the core traffic including protection & restora-tion and wavelength routing – and leaving the ser-vices (in the shape of Layer 2 and 3 traffic) to Ether-net switches and IP routers at the edges of the net-work. In the short to medium term such an infrastruc-ture can be built up step-wise, gradually deployingmore and more wavelength switches in the core net-work as the network owners feel economically, tech-nologically and strategically confident. This is thetopic of the next section.
The vision: An automated opticalnetworkIt is commonly accepted that an automated infrastruc-ture based on optical transmission is necessary tosupport the abundance of bandwidth consuming ser-vices. However, there is little consensus on how toachieve this automation – or rather at which networklayer to do the switching of the optical signals. Thechoice stands between Layer 2/3 switching (typicallyusing Ethernet switches and/or IP routers), SDHswitching, and wavelength switching. In large back-bone networks SDH switching is by far the mostpopular today whereas the closer to the end-user onegets, the more popular Layer 2/3 switching becomes.New access network installations are completelydominated by Ethernet switches and IP routers.
Optical control plane
An automated infrastructure requires an optical con-trol plane. There are all preferences from no controlplane (manual operation) through proprietary controlplanes to standardised solutions. Despite increasingcollaboration between the standardisation bodies noclear consensus has yet materialised, but there arestrong preferences for the IETF’s GMPLS (gener-alised MPLS) in combination with ITU-T’s ASON(automatically switched optical network).
The different views concerning switching and controlplane do not in themselves threaten the vision of theautomated optical network, but the “religious” discus-sions may delay the process and make the transitionunnecessarily costly. We believe that the quickest,most sustainable and least expensive path to an auto-mated optical backbone is to combine the differentnetwork technologies in a framework of switches thatuse the principle of the lowest common denominatorfor these different technologies with respect to thefollowing:
• The flexibility of handling the network• The quality of the signals• The granularity of the switches
Network and equipment requirements
An automated optical network has to be convergedor unified in the sense that it should carry datacom aswell as telecom traffic. Further it should support thequickly growing segments of dark/lit fibre and stor-age.
Datacom possesses historically very high require-ments to flexibility, and it is widely accepted that aunified network should also strive towards this degreeof flexibility. So concerning flexibility the lowestcommon denominator is determined by datacom.
Figure 4 The figure shows a number of autonomous subnetworks form-ing the global, automated optical backbone network. Each operatoruses a different control plane. Containing different technologies, thesubnetworks are interconnected by standardised interfaces (NNI) andwavelength switches (the “global” operator). Only the wavelengthswitch can carry all traffic types in a future-proof and economical way
The automated optical network should possess
• The flexibility of datacom
• The signal quality and reliability of telecom
• The granularity of a wavelength
NNI
NNI
NNI
Operator AProprietary
Operator D
Pre-ASON
Operator BManual handling
”Global” operator
Pre-GMPLS
Operator CProprietary control plane
UNI
NNI
NNIEthernet domain
Wavelengthdomain
SDH domain
IP domain
Ethernet domain
Wavelengthdomain
UNI
ISSN 0085-7130 © Telenor ASA 2005
85Telektronikk 2.2005
Telecom has traditionally had very high requirementsto signal quality and should therefore contribute with“carrier class” as its requirement to the automatedoptical network. This point of view is not shared byall Layer 2/3 equipment vendors (partly because suchequipment seldom holds “carrier class quality”) andnot even by some operators coming from the datacomside. However, the continuous growth in IP-basedservices and society’s increasing dependence onsecure connections will doubtlessly lead to very highquality requirements to the backbone networks.
What is left to discuss is the switching granularity.The lowest common denominator is the wavelengththat is the only format that can carry all other digitalformats (SDH, GbE, Fibre Channel, raw wavelengthetc). This – combined with the fact that the size ofservices and aggregated transmission bandwidthscontinues to grow – also makes the wavelengthswitch the only really future-proof solution. Bear inmind that a state-of-the-art SDH switch divides a 2.5Gbit/s signal to 16 units, which are switched and pro-cessed individually. A wavelength switch, in compar-ison, switches and processes only one unit. Therefore– despite its popularity today – SDH is neither a sus-tainable solution from a cost perspective, nor froma switching granularity perspective regarding theemerging automated optical network.
Subnetwork interoperability with
standardised interfaces
We envision the automated optical backbone networkcombined by a large number of subnetworks. Thesesubnetworks could be between operators, betweendifferent vendor equipment or domains within thesame operator, and between different network layers.Each sub-network can use its own solution dependingon technical requirements, historical preferences,political and strategic choices, etc. A subnetwork cancontain Ethernet switches, it can be an SDH ring, itcan be a wavelength switched network, etc.
The important requirement is interoperability be-tween the subnetworks, and interoperability is bestassured through standardised interfaces such as theuser-network interface, UNI, and the network-net-work interface, NNI, at wavelength level. ITU-T,OIF and IETF all work with these.
Proprietary vs standardised solutions
The choice of the optical control plane brings us tothe dilemma of standardisation: Interoperability andthe automated optical network require standardisa-tion, but sometimes only by relieving the complianceto standards is a rapid development possible.Whereas standardised interfaces are crucial in theautomated backbone, a common, distributed optical
control plane like for instance GMPLS is just useful –at least in the short to medium term. Exactly how theautomation within a subnetwork is done is less impor-tant.
ASON/GMPLS as well as probably the majority ofproprietary control planes are based on what hasalready been developed for Layer 2 and 3 switchingand routing – in particular MPLS. Existing protocolsneed to be extended and new protocols are needed,but the basic idea is the same, just applied on anotherlayer. In a global, automated, interoperable networkthere should ideally be only one standardised, dis-tributed control plane. Until it becomes clearer whichflavour of ASON/GMPLS or a third control planebecomes the winner, the important issue is that what-ever switch is used it will need to be software-upgradable in control plane functionality with mini-mum traffic interruption.
Proprietary control planes will continue to exist evenafter a single (or maybe more) control planes havebeen standardised, but this is not a problem. Opticalnetworks are far from automated and interoperabletoday, and operators will have widely differentrequirements for the speed and the degree of automa-tion – and there should be room for these differences.The principle with multiple autonomous subnetworksinterconnected by standardised interfaces is by farsufficient for many years to come.
An automated optical layer will have only littleimpact on existing Layer 2/3 network equipment. Inits mildest form, automation of the wavelength willjust replace manual patching, and in its fullest formwavelength switches can be used to offload trafficfrom the Layer 2/3 switches and routers and take overfunctionality as, for instance, switching and protec-tion of wavelengths. Ethernet switches and IP-routerswill of course still be needed at the edges of the net-works, but the IP and Ethernet based services will becompletely indifferent to how the core wavelengthsare switched. Wavelength switches will form a servernetwork, eventually serving all other signal formats –including the remaining SDH traffic.
Important global requirements:
• Autonomous subnetworks with
standardised interfaces
• SW upgradeable λ-switches
ISSN 0085-7130 © Telenor ASA 2005

86 Telektronikk 2.2005
SummaryWavelength switches never got a commercial break-through during the IT-bubble a few years ago, buttoday the traffic has increased, and the switches andthe management systems have become more mature.Meanwhile, competing technologies have got a strongfoothold – IP-routers, Ethernet switches and SDHdigital crossconnects. However, they all have short-comings when it comes to supporting the future con-verged network – technically, practically or economi-cally. Instead the wavelength switch stands out as the
key element gluing together the emerging automatedoptical network. It offers a pragmatic path towardsthe automated optical backbone infrastructure andcan relatively easily interface with existing networktechnologies. The idea is that using standardisedinterfaces the wavelength switches should “globally”interconnect autonomous subnetworks based on, e.g.,IP, Ethernet or SDH equipment. The network ownercan then in turn gradually upgrade his network towardsmore sophisticated functionality in his own pace.
Claus Popp Larsen is Project Manager at the Swedish contract research institute Acreo. He works with
activities related to the next generation broadband networks. Claus received the MSc degree from studies
at the Technical University of Denmark (DTU) and the University of Strathclyde. He holds a PhD in optical
switching from DTU in a collaboration with Ericsson.
Claus has worked at different Ericsson sites in Denmark and Sweden; first doing research in components
and networks for WDM applications, and later studying reconfigurable optical networks. In 2001 he joined
Wavium, a Swedish start-up making wavelength switches, where he had a number of responsibilities ranging
from transmission design to sales & marketing. Claus has been with Acreo since 2005.
Claus has furthermore been involved in various European research projects including being a project
coordinator, and he has actively participated in standardization work – primarily at the ITU in the area
of optical networking.
email: [email protected]
ISSN 0085-7130 © Telenor ASA 2005
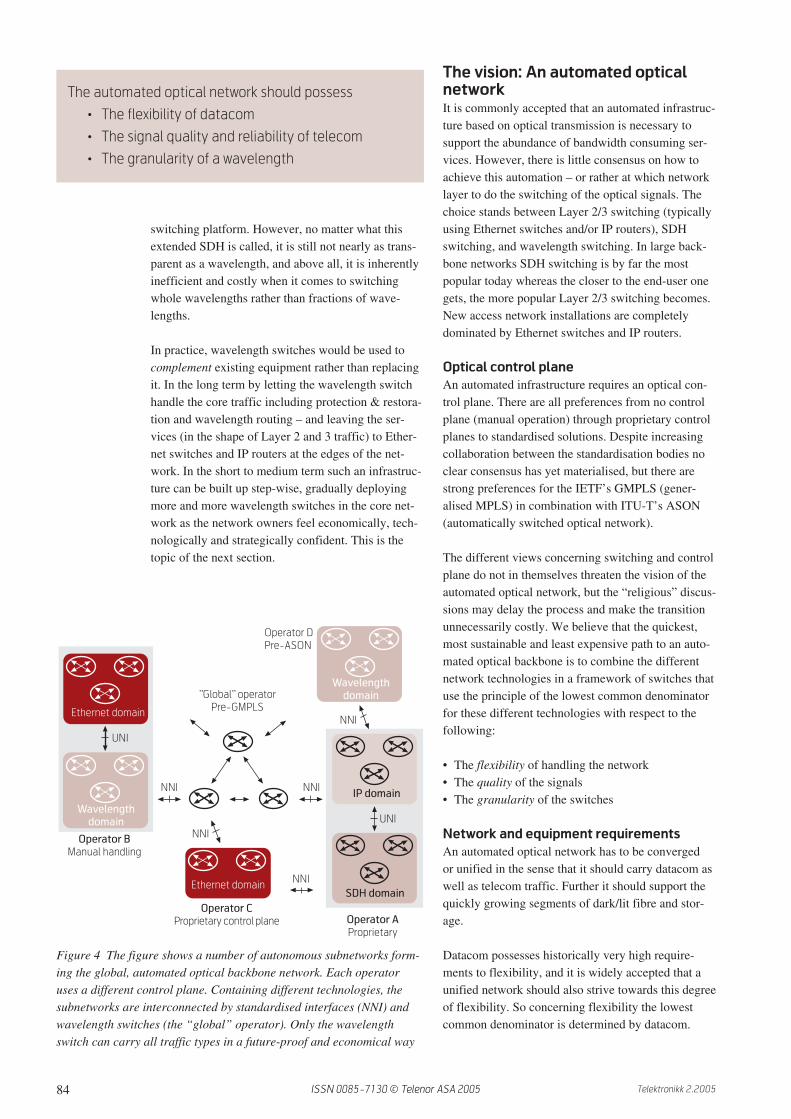
1 IntroductionSince the telecommunication market has becomehighly competitive, carriers are under continuouspressure to increase their network efficiency and tocreate new branded services. On the one hand, trafficvolumes are still growing, due to the increasingnumber of broadband Internet accesses, such as DSLusers. A variety of new high bandwidth services con-tinuously generates the need for more capacity in themetro and backbone areas of the transport network.On the other hand, the profit that can be realised forcertain transmitted traffic volumes is decreasingdramatically. Thus, the limited profit margins forceincumbent network operators to implement network-ing functions and solutions which increase the net-work efficiency, and which allow exploiting newmarket shares by offering new services. As data andoptical network convergence issues were arising, car-riers began to evaluate and introduce intelligent Con-trol Plane (CP) mechanisms that promised opera-tional benefits in a multi-vendor environment. Anumber of standardisation bodies and forums [1–3],among them ITU-T (Automatic Switched OpticalNetworks/ASON), IETF (Generalized Multi-ProtocolLabel Switching/ GMPLS) and the Optical Internet-working Forum/OIF (CP interfaces: User-Network-Interface/UNI and External Network-Network-Inter-face/E-NNI), are aiming at making this interoperabil-ity happen in a standard compliant way. Moreover,new framing and mapping procedures have beendeveloped to enable flexible data mappings into theSDH/SONET infrastructure. Beside specification, theOIF performs interoperability tests of new networkfunctions which are an important step towards imple-menting new functions.
In 2002, Deutsche Telekom Innovation started thesetup of comprehensive ASON/GMPLS networkdemonstrators and has been pursuing practical evalu-ations ever since. They are focused on experimentswith prototype implementations related to new stan-
dards and specifications from ITU-T, IETF and OIF.In a joint effort with system vendors, the so-calledGlobal Seamless Network (GSN) phase one Demon-strator was built, comprising applications in a CPenabled network. Additionally, a Management Sys-tem with an integrated view on the ASON/GMPLSand Ethernet-MAN configuration, and end-to-endmonitoring capability has been developed. The focusof the GSN was the UNI and the ASON/GMPLSfunctionalities within one operator domain. In 2004,Deutsche Telekom Innovation evolved towards thecurrent GSN+ phase two Demonstrator configuration,which mainly focuses on NNI functionalities betweendomains and new services. Besides several ASON/GMPLS backbone network domains, this field test-bed comprises the mainly envisaged client networksIP, Ethernet (metro and access networks), StorageArea Networks (SAN), and broadband video applica-tions for visualising the manifold network functions.The GSN+ demonstrator activities have been addi-tionally embedded in the OIF World InteroperabilityTests and Demonstration in 2004.
GSN+ includes promising building blocks of futurenetwork architectures, such as the widely appliedEthernet technology, GFP for flexibly mappingdifferent signal formats, optical transmission andswitching for low delay and high bandwidth trans-mission, and ASON/GMPLS functions for IP centricnetwork control. The GSN and GSN+ are importantsteps towards the implementation of GMPLS/ASONnetworks.
2 GSN network configuration andcomponents
The phase one GSN Demonstrator included all com-ponents of a modern telecommunications network;i.e. core and metropolitan networks, IP and Ethernetclients, and several kinds of applications. It had beenrealized on deployed fibre-infrastructure between the
Deutsche Telekom GSN+ – A comprehensive ASON/GMPLS demonstrator
H A N S - M A R T I N F O I S E L , A N D R E A S G L A D I S C H , M O N I K A J Ä G E R ,
S A B I N E S Z U P P A A N D A R M I N E H R H A R D T
Hans-Martin
Foisel is working
with T-Systems,
Berlin
Andreas Gladisch
is head of a
department in
T-Nova
Monika Jäger is
senior scientist
at T-Systems,
Berlin
Sabine Szuppa
is an R&D
Engineer at T-
Systems, Berlin
Armin Ehrhardt
is a senior expert
working for T-
Systems, Berlin
This paper reports on the continuous efforts of Deutsche Telekom Innovation to set up ASON/ GMPLS
network demonstrators to foster control plane enabled network deployment. In 2002, Deutsche
Telekom Innovation started building comprehensive ASON/GMPLS network demonstrators and has
been pursuing practical evaluations ever since. In a joint effort with system vendors, the so-called
Global Seamless Network (GSN) Demonstrator is being set up and continuously extended. The GSN
Demonstrator includes promising building blocks of future network architectures and comprises inno-
vative applications in a control plane enabled network. The tests are focused on experiments with pro-
totype implementations related to new standards and specifications from ITU-T, IETF and OIF.
87Telektronikk 2.2005 ISSN 0085-7130 © Telenor ASA 2005

88 Telektronikk 2.2005
German cities of Berlin and Darmstadt. The total con-figuration is depicted in Figure 1.
The backbone consisted of four optical nodes, threeof them located in Berlin, one in Darmstadt. On the750 km distance between Berlin and Darmstadt, anUltra-Long-Haul (ULH) WDM-transmission systemwhere 3x10 Gbit/s in each direction was installed.Each OCh was treated as a virtual fibre. Ethernet-based metropolitan optical networks (MAN) were setup in the showrooms of Deutsche Telekom in Berlinand Darmstadt, respectively. For visualizing the net-work functionalities, broadband applications (e.g.video, HDTV) using Ethernet formats demonstratedthe end-to-end connectivity over the entire GSNdemonstrator. Additionally, E4 applications wereconnected directly to the ASON/GMPLS backbonenetwork. In this way the impact of network functionssuch as restoration, could be evaluated and real end-to-end networking functionality could be demon-strated. Finally, a Network Management System(NMS) generated an integrated view on the ASON/GMPLS backbone and the MAN client networks.To set up this comprehensive ASON/GMPLS demon-strator, strong vendor partners had joined the GSNDemonstrator project and had provided equipmentto the project, such as the ULH-WDM system, back-bone cross connects, backbone IP routers, and MetroEthernet Switches, supplied with ASON/GMPLScontrol plane and UNI functionality.
3 ULH transmission systemThe efficiency of ULH system deployments dependson several factors, such as the increase of traffic vol-umes, the network topology and the network architec-ture; i.e. which technologies and switching granulari-ties are present in the network infrastructure, andwhich grooming strategies are applied. With theongoing traffic growth in access, metro and backbonenetworks, ULH systems are getting more and moreefficient in backbone networks, since high bandwidthtraffic streams are transmitted in the backbone incoarse wavelength granularity, and cost intensiveelectrical regenerators can be saved by bypassing theelectrical switching nodes. The Deutsche Telekombackbone optical network has a highly meshed topol-ogy, due to the high population density in Germany.Therefore, in the Deutsche Telekom transport net-work data transmissions with transparency lengthsof up to 1600 km seem reasonable. In the denselymeshed network topology, flexible switching of traf-fic seems suitable at wavelength granularity in theoptical layer.
For testing ULH systems in the GSN Demonstrator,Marconi’s ULH WDM-system UPLx160 [4] has beeninstalled on the link between Darmstadt and Berlin.In general, RZ data formats and optimised dispersionmanagement along the link enable a maximum regen-erator-free transmission distance of 3000 km at 10Gbit/s channel data rate. Such kinds of systems are
BerlinFile Server
File Server
File Server
File Client
File Server
2 x Video SDI Video
UNI
File Client
MAN NMS
Ethernet
MANASTN
Backbone
Berlin
UNI
UNI
Darmstadt
Control plane
File Server
File Client
File Server
File Client
File Server
File Client
SLA-16
2 x Video
SDI Video
UNI
UNI
UNI
ULH
WDM
File Client
UMS
upper monitoring
system
BB NMS
Ethernet
MAN
Ethernet
MAN
Ethernet
MAN
IP
Network
SLA-16
IP
Network
Control plane
Backbone
Client Networks
Applications
Figure 1 Configuration of the GSN Demonstrator
ISSN 0085-7130 © Telenor ASA 2005

89Telektronikk 2.2005
already in operation in Australia between Adelaideand Perth, covering there 2850 km of un-regeneratedtransmission distance. Between Berlin and Darmstadt3x10 Gbit/s for each direction have been realised.The WDM-link setup is depicted in Figure 2.
The system is purely Erbium Doped Fibre Amplifier(EDFA) based. Both Dual-Stage Amplifiers (DSA)embedding dispersion compensating fibre modules,as well as Single-Stage Amplifiers (SSA) have beenused. In the middle of the link, levelling nodes wereimplemented to equalise the powers of the propagat-ing optical wavelengths. By transparent loop-back-switching as depicted in Figure 2, transmission ex-periments over 1500 km have been performed, witha transmission quality of all WDM channels at BERvalues of 10-10 up to 10-12 before Forward Error Cor-rection (FEC) could be verified. The total DifferentialGroup Delay (DGD) due to Polarisation Mode Dis-persion (PMD) of the fibres of the Berlin-Darmstadt-Berlin loop amounted to 4.3 ps, which was shown notto be critical for a 10 Gbit/s transmission. To evaluatethe PMD sensitivity of the system a PMD emulatorwas installed in Berlin, both before and after the loop.
4 GSN backbone networkAs described in the previous section, the backbone ofthe first phase GSN Demonstrator was composed ofthe WDM transmission systems and four opticalswitching nodes. The nodes were SDH VC4-basedmulti-layer switches. They were supplied with STM-64 network interfaces and STM-16 tributary inter-faces. The switching was performed at VC-4 granu-
larity. Every node was equipped with an ASON/GMPLS-like controller, thus realizing a decentralizedcontrol plane in the backbone network (see Figure 3),featuring signalling and routing protocols for decen-tralized routing of connections across the network,automatic discovery functions and restoration switch-ing in meshed networks, taking into consideration theactual traffic load of the links.
Between client and core nodes a carrier grade UserNetwork Interface, compliant to OIF UNI 1.0 [3] wasimplemented, including all mandatory and optionalfunctions like in-band signalling and automaticneighbour and service discovery. This interface isbased on STM-16 signals. Upon client requests forconnections via the UNI interface, the switched con-nection setup and tear down was performed
Figure 3 ASON Control Plane and UNI interfaces of the optical backbone
Figure 2 WDM system installed between Berlin and Darmstadt. A transparent loopback switching in Darmstadt is performed fortransmission experiments
Nuremberg
Bremen
Hamburg
Berlin
Darmstadt
Frankfurt
Hannover
Stuttgart
Munich
DCM-70
Berlin
Darmstadt
71.1km 77.6km
78.7km64.3km
94km
81km95.6km
63.2km
62.4km
24.5dB 20dB 26dB19.1dB
20.5dB16.2dB 25.3dB18.5dB 21.1dB
23.7dB 22dB 25.1dB17.5dB
20.5dB16.8dB 26dB22.9dB 26.6dB
SSA17 SSA21 Leveling
nodeTerminal
DDCM-90
DCM-70
DCM-90
No
DC
M
DC
M 8
0
DC
M 8
0
DC
M 8
0
No
DC
M
DC
M 8
0
DC
M 8
0
DC
M 8
0
No
DC
M
DC
M 8
0
DC
M 8
0
DC
M 8
0
No
DC
M
DC
M 8
0
DC
M 8
0
24
dB
81.
8k
m
24
.5d
B
DC
M 8
0
OCC: Optical Connection Controller
CCI: Connection Control Interface
NMS: Network Management System
NNI: Network Network Interface
UNI: User Network Interface
NMI-A/T: Network Management Interfaces
CCI
NMS
NMI-A
XC
ASON control plane
ASON transport plane
I-NNIUNI
OCC
Client
network
domain
Optical
transport
network
domain #2
NMI-T
I-NNI
OCCOCC
CCI CCI
XC XC
I-NNI
ISSN 0085-7130 © Telenor ASA 2005

90 Telektronikk 2.2005
autonomously by the backbone CP. Also soft perma-nent connections (triggered by the NMS) were real-ized by the CP. The actual information about the net-work topology was delivered to the NMS, so that theoperator always had an updated view of the network.
The VC-4 switching capability of the backbone nodesenabled multiplexing/grooming of the ASON/GMPLSclient signals at VC-4 granularity and Virtual Con-catenation (VCAT) (Figure 4). As the client inter-faces likewise delivered data in VC-4 granularity, theaccumulated ingress data rate of a customer could beadjusted in VC-4 steps via the UNI interface. There-fore the increase of the transport network capacityutilization is considerable, compared to today’s usedcontiguous concatenation formats for data transport(Figure 4).
Generic Framing Procedure (GFP) (Figure 5) is anew advanced encapsulation mechanism with a fixedamount of encapsulation overhead, independentlyfrom the binary content of the client. GFP is a robustand scalable frame based encapsulation for PDUs,which provides transparent mapping for the mostcommon 8B/10B encoded signals of data interfaces.
5 OIF interoperability testsBased on the results and experiences made with thephase one GSN demonstrator, Deutsche Telekom hasinitiated and actively participated in the OIF WorldInteroperability Tests and Demonstrations in the firsthalf of 2004 [5]. First, local CP and Data Plane (DP)tests of UNI, E-NNI and Ethernet over SDH/SONETadaptation were performed at Deutsche Telekom labs.Then, global interoperability tests were carried out ina multi-domain network scenario, covering two mainareas:
• CP interfaces: UNI (Client network – transport net-work domain) and E-NNI (between transport net-work domains), based on OIF specifications;
• Efficient Ethernet over SDH/SONET adaptation,based on ITU-T Recommendations (GFP-F,VCAT, LCAS).
The goals of these tests were to globally connect andinterwork on CP level between network domains.Some of network domains were partly interworkingon DP level as well, based on VC-4/STS-3c, connect-ing local testbeds built as one or more separate ven-dor domains.
The interoperability tests of the CP interface func-tions were based on OIF specifications (Implementa-tion Agreements (IA)), IA UNI 1.0 Signalling Speci-fication, Release 2, IA E-NNI-01.0 Signalling, andthe draft specification or E-NNI-01.0 Routing [3].
The CP interfaces allowed the configuration of con-nections from the client side, initiated via the UNI asswitched connections or by the EMS/NMS as softpermanent connections, over multiple ASON/GMPLSdomains by using the CP functionality (Figure 3). Assuch, multi-domain connections could be set up with-out involvement of the EMS/NMS of the intermedi-ate domains. These new functions will significantlyease network operation in future networks, especiallyconnection provisioning in multi-domain environ-ments. Table 1 lists the performed interoperabilitytests, which were carried out first locally at DeutscheTelekom’s labs, second per continent, and finally ona global scale.
Ethernet over SDH/SONET adaptation interoperabil-ity tests were based on the ITU-T RecommendationsG.7041/GFP-F, G.707/VCAT, and G.7042/LCAS,and were carried out locally at the labs of DeutscheTelekom. The results of these tests show clearly thatcurrent standard compliant implementations of effi-cient Ethernet over SDH/SONET adaptation areinteroperable. The local test network at DeutscheTelekom labs was composed of three ASON/GMPLS
Figure 4 First improvement of SDH: VCAT of VC-12, VC-3 & VC-4
Figure 5 Second improvement of SDH: GFP; Frame based (GFP-F)and transparent (GFP-T)
–VC-12-Xv (n * 2,5 Mbit/s
–VC-3-Xv (50 Mbit/s, 100 Mbit/s
–VC-4-Xv (n * 150 Mbit/s
20
48
kb
it/s
VC
12
(2
24
0 k
bit
/s)
5 M
bit
/s
10 M
bit
/s
20
Mb
it/s
34
36
8 k
bit
/s
VC
3 (
48
96
0 k
bit
/s)
50
Mb
it/s
100
Mb
it/s
VC
4 (
150
33
6 M
bit
/s)
>15
0 M
bit
/s
VC-12-Xv
GFP-F
Ethernet IP FC GbEESCON/
FICON DVB/ASI
GFP-T
VC-3-Xv VC-4-Xv
ISSN 0085-7130 © Telenor ASA 2005

91Telektronikk 2.2005
network domains from different vendors, intercon-nected by E-NNIs. An IP client network was attachedto these “backbone” networks via UNIs 1.0R2, withVC-4 channelized interfaces. The network elementsinvolved Ethernet adaptation over SDH from differ-ent vendors.
6 GSN+ demonstratorBased on the OIF activity results, the enhancementsof the GSN Demonstrator towards the phase twoGSN+ Demonstrator was started [6]. The enhance-ments are focused on most efficient data signal trans-port from client networks, e.g. IP, Ethernet MAN andStorage Area Networks (SAN) over multiple ASON/GMPLS transport network domains and related cus-tomer management solutions (Figure 6).
The GSN+ Demonstrator backbone is composed ofthree ASON/GMPLS network domains from differentvendors, interconnected by an E-NNI, which allowsautomatic connection configuration and provisioningover multiple network domains. The client networksare interconnected to the backbone domains via OIFUNI 1.0 Release 2 interfaces. The IP client networkis equipped with UNI-C 1.0R2 CP and Packet overSDH (POS), channelized at VC-4 granularity dataplane interfaces. The most efficient data transportover ASON/GMPLS networks is accomplished byusing GFP-F, VCAT and LCAS functions, which hadbeen successfully tested at the OIF interoperabilityevent 2004, and which enable fast provisioning ofEthernet and SAN services. Customer Network Man-agement (CNM) solutions will be implemented forthose client networks which have no UNI functional-ity implemented, such as the SAN clients. In thisway, SAN services are enhanced by the ASON/GMPLS function and integrated into the dynamicallyconfigurable ASON/GMPLS GSN+ backbone.Hence, new services based on temporary, reconfig-urable SAN interconnections are shown. The Demon-strator has been extended to Ethernet based accessnetworks. The interworking of these access solutionswith the Ethernet MAN will be practically evaluated.Furthermore, future access network applications willbe implemented for visualising the MAN and accessnetwork functions.
Different from the phase one GSN Demonstrator,the interconnection between the nodes in Berlin undDarmstadt of the phase two GSN+ demonstrator isbased on a transparent DWDM-link with normalizednetwork sections [9]. This configuration allows for anabsolutely flexible transmission of data rates rangingfrom 10 Mbit/s up to 10 Gbit/s on each WDM-chan-nel. The signals on the line side will be transmittedwithout Digital Wrapper (DW) and Forward Error
Correction (FEC). Thus, the signals between thenodes in Berlin and Darmstadt can exhibit any dataformat and do not necessarily have to be fixed SDH-based data rates.
Further main extensions of the GSN+ Demonstratorwill be the interconnections to other project test beds,e.g. the German national project “Vertically Inte-grated Optical Test Bed for Large Applications inDFN” (VIOLA) [7] and the European IST project“Multi-Partner European Test Beds for ResearchNetworking” (MUPBED) [8].
Finally, the introduction of automatic intelligence ofthe network nodes by the implemented decentralizedcontrol plane enables the realization of various pro-tection and restoration mechanisms. Today’s dedi-cated protection schemes are fast and robust but veryresource intensive. Shared protection mechanismsare able to reduce the backup resources significantly.Depending on the network topology, the trafficdemand and the applied network planning and opti-
Figure 6 GSN+ demonstrator topologyUNI: User-network-interfaceE-NNI: External network-network-interfaceFC: Fibre channelGE: Gigabit ethernet
Test Test case UNI-C UNI-N E-NNI
1 Basic routing functionality - - X
2 Routing functionality for virtual links - - X
3 Connection initiated by UNI X X -
4 Dual-domain connection initiated by EMS - - X
5 Dual-domain connection initiated by UNI X X X
6 Multi-domain connection initiated by UNI X X X
Table 1 OIF CP interoperability tests
Atrica
(FC)
(FC)
Atrica
Cisco
EMC2
Lucent
Marconi
GE GE
GE
Access:
Cisco
Siemens
Hatteras
GE
UNI
STM-16
GE
MUPBED
TILAB
VIOLA
GE
UNI
STM-16
(E-NNI)
STM-16(E-NNI)
STM-16
E-NNI
E-NNI
Ciena
Cisco
Access
(E-NNI)
STM-16
EMC2
ISSN 0085-7130 © Telenor ASA 2005

92 Telektronikk 2.2005
mization strategy, resource reductions of more than30 % are possible. Restoration mechanisms usedynamic routing and signalling functions availablein CP-based networks. Hence, they allow efficientlyfinding and setting up alternate paths in real-timeafter failure occurrences, without pre-occupyingresources and based on the current network topologyand resource status. That is, restoration is veryresource efficient and due to its high flexibility pro-vides increased service availability. Up to now, fourresilience classes were implemented in the Demon-strator:
• Unprotected• 1+1 protection• Pre-planned shared path restoration• On the fly path restoration
It was shown that in case of system failure or a cablebreak the backbone autonomously switches to a (herepre-planned) restoration path. The shared restorationwhich was implemented in the Demonstrator basedon pre-planned backup paths, recommends the in-verse operation as soon as the working path is acces-sible again, so the system automatically switchedback after an adjustable time.
Figure 7 Ethernet Metro Network
Application Class of service Protocol/bitrate ASON/GMPLS solution
Video conference Real time E4 140 Mbit/s VC-4 fixed
Restored
DVD Video server Streaming TCP/IP 2-10 Mbit/s
E-Cinema HDTV Streaming TCP/IP 2-10 Mbit/s
File transfer TCP/IP – 200 Mbit/s N * VC-4 virtual concatenation
“Print templates” Restored
Video on demand File transfer TCP/IP – 200 Mbit/s N * VC-4 virtual concatenation
Restored
Video conference Real time SDI 270 Mbit/s N * VC-4 virtual concatenation
(over Ethernet) over TCP 300 Mbit/s Restored
Standard video streaming Streaming UDP … 10 Mbit/s
Storage access File transfer Fibre channel N * VC-4 virtual concatenation
N * 200 Mbit/s Restored
1000 Mbit/s
Table 2 Implemented applications
BerlinDarmstadt
UNIUNI
At-2-1 At-2-2 At-2-3
At-2-5
At-2-8
At-2-6
At-8-3At-8-2At-8-1
ASON/GMPLS Backbone
ISSN 0085-7130 © Telenor ASA 2005
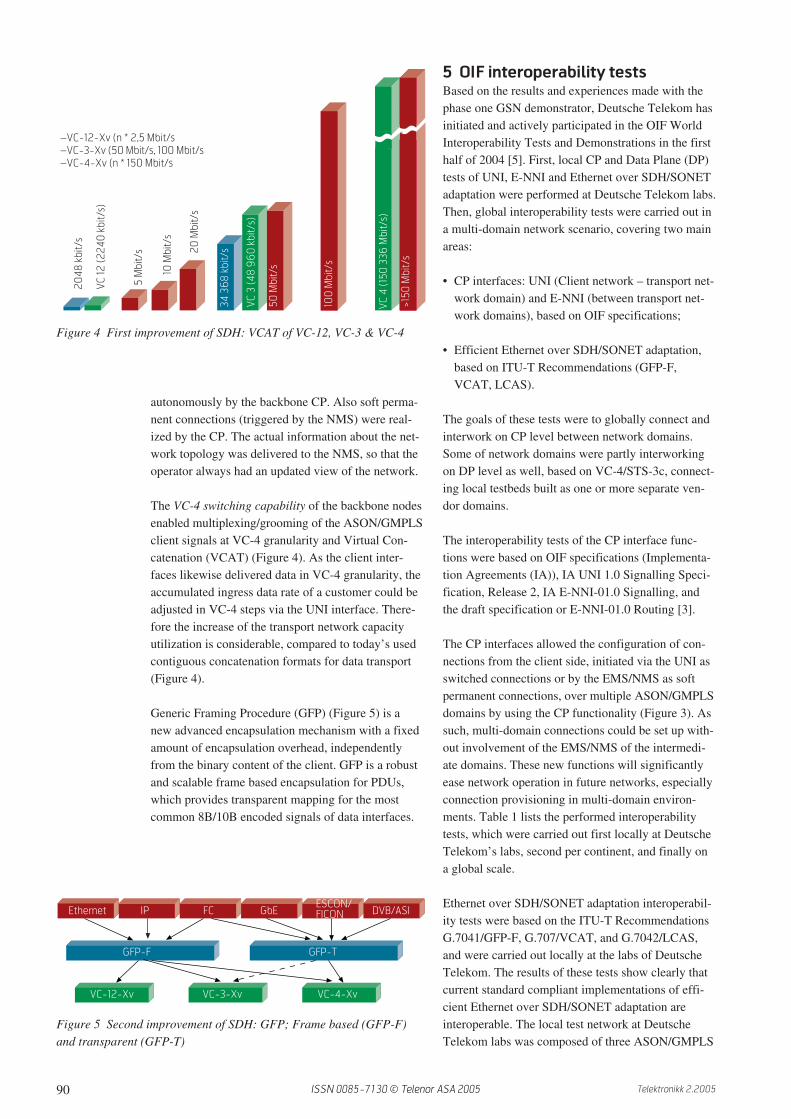
93Telektronikk 2.2005
7 Networks connected to the UNISeveral client networks are attached to the ASON/GMPLS backbone via the UNI (see Figures 1 and 6).They represent the envisaged main future ASON/GMPLS clients, IP and Ethernet. The IP network isbased on backbone routers, providing IP functionalityin the GSN and GSN+ Demonstrator. At the UNI sidethe routers use POS, VC-4 channelized interfaces,enabling most effective data transport, as the ASON/GMPLS backbone capacity follows the IP payload inVC-4 steps. This is not feasible in case of contiguousconcatenation of the SDH payload.
The largest client networks are based on a novelEthernet Metro Network concept (Figures 1 and 7).The Ethernet switching system supports interfacedata rates from 10 Mbit/s client interfaces up to 10GE LAN interfaces. At the UNI side the Ethernet net-works have POS interfaces supporting the mapping ofa GE stream into various kinds of virtual and contigu-ous concatenation formats. In the Demonstrator, e.g.GE signals are (GFP compliantly) mapped intoVC-4-7v. The interconnection of Ethernet MAN andbackbone via UNI allows a seamless bandwidth andconnection adaptation of the whole network based onthe bandwidth requirements at the customer side.
A CNM enables a residential customer to configurehis access network (bandwidth and connectivity) inan Ethernet based metro network (MAN) in a pre-defined range given by the Service Level Agreement(SLA). The Ethernet MAN is carrier grade; i.e. con-nection oriented services with end-to-end SLA canbe established. High availability is guaranteed due tosub-50 ms protection switching.
8 ApplicationsTo complete the demonstrator network and to visual-ize the network functionalities, broadband applica-tions (e.g. video, HDTV) using Ethernet formatsdemonstrate the end-to-end connectivity via the entireGSN demonstrator. Additionally, E4 applications areconnected directly to the ASON/GMPLS backbonenetwork. The whole bundle of applications attachedto the GSN Demonstrator are summarized in Table 2.
In this way the impact of network functions, e.g.restoration, has been evaluated and real end-to-endfunctionality has been demonstrated.
9 ConclusionsThe GSN+ Demonstrator represents a further steptowards a comprehensive implementation of carriergrade ASON/GMPLS functions in a telecom fieldenvironment. It includes not only multiple ASON/
GMPLS backbone domains, but also the mainlyenvisaged client networks – IP, Ethernet MAN andSAN as well as Ethernet based access networks.
GSN+ comprises many innovative ASON/GMPLSfunctions. For example, automatic service and neigh-bour discovery are implemented in the Demonstrator,which simplifies network setup and operation. Fur-thermore, the Demonstrator tests increased ASON/GMPLS network flexibility on multiple network lev-els such as SDH and Ethernet, targeting at increasednetwork resource utilization. Reduced provisioningand customer management complexity is demon-strated taking advantage of the enhanced automiza-tion in ASON/GMPLS networks. The usability ofinnovative resilience mechanisms is investigated.Finally, new high broadband flexible services aresupported in the Demonstrator. New Ethernet andUNI/control plane based dynamic services aredemonstrated.
The GSN+ demonstrator activities have successfullyshown the feasibility of introducing CP functionsbased on ITU-T/OIF specifications into the transportnetwork. However, when introducing the functionsinto the transport networks, influences on networkoperator internal processes have to be carefully con-sidered. For example, traditional management sys-tems are based on ITU-T recommendations, whichhave to be harmonized with management conceptscoming from the IETF based GMPLS protocols.
As today many networking functions are only usablewithin one vendor domain, the implementation ofstandard compliant inter-domain NNI interface func-tions will be required. To continuously ensure a highinteroperability level of innovative networking solu-tions, especially in multi-domain environments, theGSN+ Demonstrator is based on OIF World Inter-operability Tests results and will be interconnected tonationwide German and European-wide test beds. Inthis way a further step has been taken towards ASON/GMPLS and Ethernet network evaluations, andextensive experiences are gained in a realistic multi-domain network environment, covering all networkhierarchies from the access to the backbone. On thisbasis, the evaluation and demonstration of new appli-cations and services can be performed.
The GSN Demonstrator purely uses the overlayapproach, in which the IP/MPLS and Ethernet clientnetworks are strictly separated from the ASON/GMPLS domain, and interconnected via UNI. Theoverlay network architecture seems straightforwardfor short and medium term network evolution ofincumbent operators’ networks, such as DeutscheTelekom, as profitable network services today are
ISSN 0085-7130 © Telenor ASA 2005
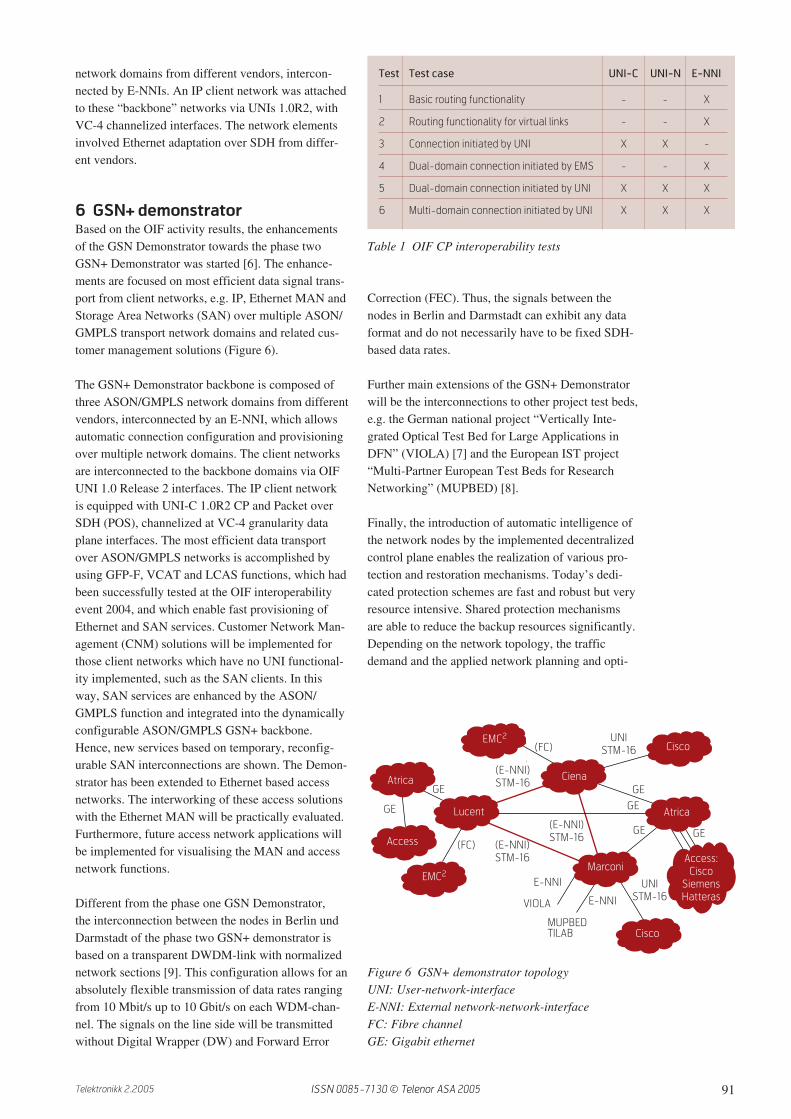
94 Telektronikk 2.2005
still widely based on traditional SDH networks. How-ever, the basic underlying network architecture withits two extremes overlay and peer concepts is of pro-found importance in future transport networks. Itspros and cons are highly dependable for every opera-tor on their main market segment. The more the net-work and the services converge towards IP centricNext Generation Networks (NGN) and IP based ser-vices, the more the peer approach with integrated net-work layer control seems advantageous. The migra-tion from an overlay network concept with segregatedand independently managed network levels, towardsa peer network concept with an integrated CP, how-ever, has to be seamless. The evolution from today’stransport network towards future ASON/GMPLSbased transport networks and the convergence ofOIF/ITU-T and IETF approaches, as well as the inter-working of the IP/MPLS and ASON/GMPLS net-work domains need further studies and will be con-ceptually investigated and practically evaluated infuture project phases of the GSN+ Demonstrator.
References1 ITU. Architecture for the Automatically Switched
Optical Network (ASON). ITU-T G.8080/Y.1304.Geneva, Nov 2001. (www.itu.int/ITU-T)
2 IETF. Generalized Multi-Protocol Label Switch-ing (GMPLS) Signaling Functional Description.RFC 3471. Jan 2003.
3 OIF. User Network Interface (UNI) 1.0 SignalingSpecification, Release 2: Common Part. OIF-UNI-01.0-R2-Common. The Optical Internet-working Forum, Fremont, CA, Feb 2004. andOIF. RSVP Extensions for User Network Interface(UNI) 1.0 Signaling, Release 2. OIF-UNI-01.0-R2-RSVP. The Optical Internetworking Forum,Fremont, CA, Feb 2004. and
OIF. Intra-Carrier E-NNI Signaling Specifica-tion. OIF-E-NNI-Sig-01.0. The Optical Internet-working Forum, Fremont, CA, Feb 2004.(www.oiforum.com)
4 Gladisch, A et al. Global Seamless NetworkDemonstrator – A Proof of Concept. ECOC2003,Rimini, Italy, Sep 2003.
5 Foisel, H-M. Optical Internetworking Forum:World Interoperability Tests and Demonstrations.Post deadline paper, ECOC2004, Stockholm,Sweden, Sep 2004.
6 Foisel, H-M. Global Seamless Network Demon-strator. Broadband Europe 2004, Brugge, Bel-gium, Dec 2004.
7 VIOLA – Vertically Integrated Optical Testbedfor Large Application in DFN. April 26, 2005.[online] – URL: www.viola-testbed.de
8 MUPBED – Multi-Partner European Testbeds forResearch Networking. April 26, 2005. [online] –URL: www.ist-mupbed.org
9 Hanik, N et al. Extension of All-Optical Network-Transparent Domains based on NormalizedTransmission Sections. Journal of LightwaveTechnology, 22 (6), 1439–1452, 2004.
ISSN 0085-7130 © Telenor ASA 2005

95Telektronikk 2.2005
Andreas Gladisch received his Dipl.Ing. Degree in Theoretical Electrotechnics from the Technical University
of Ilmenau in 1986. From 1986 to 1990 he was engaged in research on coherent optical communication and
optical frequency control at Humboldt University Berlin, where he received his PhD in Optical Communica-
tion. He joined the Research Institute of Deutsche Telekom in 1991 where he was involved in projects on
coherent optics, wavelength division multiplexing systems, wavelength control and frequency stabilisation.
From 1996 to 1998 he was head of a research group working in the field of design and management of opti-
cal networks, and in 1999 he became head of the department “network architecture and system concepts”
of T-Nova, the research and development subsidiary of Deutsche Telekom. The development of migration
concepts to introduce additional optical functionality into the networks is the main responsibility of the
department and moreover, the department represents Deutsche Telekom in OIF and IEEE and other fora,
dealing with transmission networks and IP-WDM integration.
Dr. Gladisch is member of ITG and IEEE and has authored or co-authored more than 80 national and inter-
national technical conference or journal papers, and holds several patents.
email: [email protected]
Hans-Martin Foisel received his Dipl.Ing. degree in electrical engineering from the University of Kassel and
Technical University Berlin, Germany. He worked as student research staff member and later as member of
the scientific staff at the Heinrich-Hertz-Institute in Berlin for 19 years in the area of optical transmission
systems. Since 1998 he has been member of the Photonic Networks and Network Architecture Department
of T-Systems/Technology Centre (division of Deutsche Telekom) in Berlin. He is currently involved in
several projects in the area of IP transport networks and in related standardisation activities, e.g. he is
the T-Systems/Deutsche Telekom representative at the Optical Internetworking Forum (OIF), where he is
actually chairing the Carrier Working Group.
email: [email protected]
Monika Jäger has been working as senior scientist in the department of Photonic Networks and Network
Architecture at T-Systems, Technologiezentrum in Berlin since 1998. She previously held positions with the
Fraunhofer Institute for Open Communication Systems and DeTeWe. Monika Jäger graduated in Electrical
Engineering from Munich University of Technology, Germany in 1992. Her current research interests are in
the area of optical transport network design. She is involved in the Deutsche Telekom project GSN+ and in
the European IST project NOBEL.
email: [email protected]
Sabine Szuppa has been working a professional Research and Development Engineer in the department of
Photonic Networks and Network Architecture at T-Systems, Berlin since 1989. Sabine Szuppa graduated in
Teaching for Mathematics and Physics from Humboldt University of Berlin, Germany in 1985. Her current
research interests are in the area of optical Metro Ethernet Network. She is involved in the Deutsche
Telekom project GSN+.
email: [email protected]
Armin Ehrhardt received his Dipl.Phys. degree from the Kharkov State University, Ukraine, in 1987 and his
PhD degree in physics from the Humboldt University Berlin in 1991 for research on WDM-systems with
heterodyne receiver schemes. From 1991 to 1996 he worked on photonic components, generation of short
optical pulses and high speed optical transmission systems at the Heinrich-Hertz-Institute Berlin. In 1996
he joined the Technology Center of Deutsche Telekom. Currently he is with the Photonic Networks and
Network Architecture Department of T-Systems where he is involved as a senior expert in investigations on
high capacity WDM transmission and development of extended SAN solutions based on optical networks.
email: [email protected]
ISSN 0085-7130 © Telenor ASA 2005
96 Telektronikk 2.2005
IntroductionThe intention of this article is to present an overviewof the development of optical transmission systemsthat are being used in the Telenor network. Startingwith the first system in 1983, in the following I willattempt to report in chronological order all the majorevolutionary steps that have taken place, as well as toreview important decisions that needed to be madealong the way.
A slow start during the multimode eraThe first optical transmission system in Norway wasestablished in 1983, on a 9 km cable route betweenAurland and Flåm in Sogn, Western Norway. Thecable was partly submarine, containing ITU-T G.651multimode fibres. Ericsson supplied the opticalequipment, a laser-based 34 Mbit/s system operatingat 850 nm wavelength – also referred to as the firstwindow. Following a three months test period, thesystem was carrying regular traffic before the end ofthe year.
More multimode systems followed in the years from1983 to 1988. These included:
• Different capacities: 2, 8, 34 and 140 Mbit/s;
• Different manufacturers: Ericsson, NEC, Philips,SEL, Siemens and Telettra (although the numberwas soon reduced to three);
• Two transmission windows: 850 and 1300 nm;
• Two types of light sources: Laser and LED.
Likewise, the quality of fibre was not unique. G.651allows for a wide variety of quality classes. Aftersome considerations, we standardized on a specifictype with the following main characteristics:
1300 nm (specified): Bandwidth > 1000 MHz . km,attenuation < 1 dB/km
850 nm (not specified): Bandwidth > 200 MHz . km,attenuation < 4 dB/km
850 nm equipment was approximately 30 % cheaperthan equivalent 1300 nm equipment – partly depend-ing on system bit rate. But because of much shorterspan lengths for 850 nm, we soon decided to restrictourselves to 1300 nm systems.
Table 1 presents an overview of the total numberof multimode systems to be acquired by Telenor1983–88. Span lengths for the different sub-cate-gories are indicated. These are based on the charac-teristics of our “standard” multimode fibre, and alsointerface characteristics of optical line terminals fromthe most relevant suppliers. As one will notice, a fewof the systems – mostly the 850 nm systems – arebandwidth-limited, while the remaining are attenua-tion-limited.
The total number of multimode systems is not verysubstantial, and a significant number are short, ruralconnections and not main routes.
An important switch to single-modefibresA highly important decision was made in the middleof 1985: As quickly as practically possible, we wouldswitch from multimode to single-mode fibres on allnew installations. The goal was that from the firsthalf of 1987 all new cables should contain single-mode fibres. The arguments for this decision werethe following:
• Single-mode fibres were superior with respect totransmission characteristics (signal capacity andreach).
• Single-mode fibres had recently been introduced tothe market, and in the USA sales figures increasedrapidly, while price levels showed a correspondingdecrease. In Europe the market would still experi-
Optical transmission systems in the Telenor network– In retrospect
S T E I N A R M . S V E N D S E N
Steinar M.
Svendsen is
Chief Engineer
at Telenor Nordic
– Fixed
For more than two decades we have been witnessing the establishment and expansion of an optical
transmission network in Norway. Initially international research and development was mainly focusing
on high-capacity and long-haul systems. New “world records” were frequently reported, e.g. with
respect to bit rates and reach. The most remarkable milestones were achieved when introducing
optical amplifiers and wavelength division multiplexing (WDM). In recent years we have seen a notable
slow-down in business, while focus has shifted to metropolitan networks and cost reduction.
ISSN 0085-7130 © Telenor ASA 2005

97Telektronikk 2.2005
ence a significant price level difference betweenmulti- and single-mode fibres in many countries.However, in Norway the price of single-mode fibreswas just negligibly higher, and seemed to continueto decrease below the price of multimode fibres.
• With respect to optical equipment, 140 Mbit/s lineterminals for single-mode fibres were alreadyavailable. A 1310 nm laser terminal would costabout 15 % more than a corresponding 140 Mbit/smultimode terminal, and lower order systems werenot yet available. However, it was expected thatthis situation would change rather quickly.
• The rather limited amount of fibre-optic cablesalready installed in Norway made it easier toquickly switch to the new fibre type.
Single-mode transport systems aresettling inThe first single-mode system in the Telenor transportnetwork was ready for service on 18 June 1986. Itwas a 140 Mbit/s system, installed on the importantroute between Oslo and Drammen. Total cable lengthwas 53 km, therefore one intermediate regeneratorwas needed (Asker). The system made use of lasersoperating in the 1310 nm window. The manufacturerwas AT&T Philips (Nederland).
From 1986 onwards, things were moving faster. In1987 the first 565 Mbit/s system was established. Atthis time the full range of hierarchical bit rates from 2to 565 Mbit/s were present in the network, all of thembased on 1310 nm operation. The high capacity sys-tems, 140 and 565 Mbit/s dominated the market.Table 2 contains an overview of systems orderedbetween 1985 and 1987. All laser systems were atten-uation-limited, although the 565 Mbit/s was disper-sion-limited to approximately the same reach. Duringthese years NEC was our main supplier of 2, 8 and34 Mbit/s systems, Siemens and Philips suppliedthe 140 Mbit/s systems, and Siemens most of the565 Mbit/s systems.
Although optical systems were installed in most partsof the country at this time, the optical network withinthe capital of Oslo dominated the domestic market, asmore than 60 % of the 140 Mbit/s line terminals andmore than 70 % of the 565 line terminals were to beinstalled here.
Table 2 indicates an interest for using LEDs in lowbit rate systems. Conventional surface-emitting LEDshad too wide a bandwidth to be used for high bit ratesystems. With the introduction of edge-emittingdiodes – ELEDs – this problem could be overcome,thereby providing more economic and reliable 140and 565 Mbit/s systems. However, another new com-ponent was to arise in 1987, the low-power laser (LP-LD). The LP-LD was able to compete with the ELEDwith respect to price and reliability – and at the sametime offering longer span lengths.
The growing interest for more economic short-haulsystems proved to be an attractive niche that couldinitiate local development and production in Norway.Telenor (at that time government-owned Televerket)wanted to support domestic activity in this field, anddevelopment contracts were signed with two compa-
Bit rate Total no. Wavelength Light No. of Span length
(Mbit/s) of systems (nm) source systems (km)
2 4 850 Laser 1 12
1300 Laser 3 31
8 3 850 Laser 1 10
1300 Laser 2 27
34 16 850 Laser 3 4
1300 LED 10 13
1300 Laser 3 27
140 45 850 Laser 7 2
1300 LED 10 4
1300 Laser 28 22
Table 1 Overview of multimode systems established
Bit rate Total no. Systems needing Light Wavelength Span length for LED /
(Mbit/s) of systems regenerator(s) source (nm) laser systems (km)
2 3 0 1 laser. 2 LED 1310 30 / 63-80
8 16 0 5 laser, 11 LED 1310 23 / 60
34 30 0 14 laser, 16 LED 1310 15 / 46-58
140 179 6 All laser 1310 46
565 92 6 All laser 1310 33
Table 2 Overview of first generation of single-mode transport systems, 1985–87
ISSN 0085-7130 © Telenor ASA 2005

98 Telektronikk 2.2005
nies: the Norwegian branches of Siemens for 2 and34 Mbit/s LED systems and with Telettra for 140Mbit/s LED systems. Before any delivery could takeplace, LED was changed to LP-LD for both contracts.Actual deliveries started in 1988.
As the laser was a cost-dominant component withinthe line terminal equipment, the price differencebetween conventional laser and low-power laserwould constitute a 15–20 % reduction of equipmentprice for one complete line terminal. Within Oslo, itwas calculated that optical systems of 20 km reachcould cover 90 % of the routes to be established.
Opening the third windowThe single-mode fibre cable we had adopted in Nor-way, was according to the ITU-T RecommendationG.652 standard single-mode fibre and cable. Thisfibre was originally intended to be used in the 1310nm window, and a complete set of specified charac-teristics referred only to this window.
As the G.652 fibre has its minimum attenuation atabout 1550 nm – referred to as the third window –trying to make use of this advantage was anotherchallenge, both with respect to fibre, cable andequipment.
The cable specifications were now extended toinclude transmission parameters in the third window.From the middle of 1988 all cables to be installed inNorway contained double-window G.652 fibres. Itmay be noted that G.652 fibre produced from 1985to 1988 may be used at 1550 nm at medium tempera-tures. However, at low temperatures bending loss willbecome an obstacle.
Equipment-wise, there were also problems to over-come. Not in the optical receivers, as the detectorswould accept 1550 as well as 1310 nm. But becauseof the high value of dispersion at 1550 nm, it wasnecessary to develop a new type of laser with a verynarrow spectral width to avoid the optical systems tobe dispersion-limited. These lasers were named DFB(Distributed Feed-Back) lasers. Having a spectralwidth of about 0.3 nm, while the correspondingfigure for conventional Fabry-Perot lasers normallywould be ten times higher, they would constitute thereal single-mode lasers. However, the price level for1550 nm lasers was high. From an initial cost ofabout 100,000 NOK, during 1987 it was reduced to30,000 – 60,000 NOK for a volume of 100 units.
In October 1987 we received the first quotations for140 and 565 Mbit/s systems for the 1550 nm window.The first installations could start the following year.
However, although prices for 1550 nm lasers contin-ued to decrease, they would still be more expensivethan 1310 nm lasers. For this reason 1310 nm sys-tems continued to dominate the market for the yearsto follow, 1550 nm was mainly chosen for long-haulsystems where regenerators could be saved.
To illustrate the difference in span lengths, thefollowing figures were typical for systems withstandard lasers:
• 140 Mbit/s: 1310 nm: 52 km 1550 nm: 64 km• 565 Mbit/s: 1310 nm: 45 km 1550 nm: 68 km
Birth of WDMThe idea of wavelength division multiplexing(WDM) originated in the early days of optical fibretransmission. WDM-systems were developed inlaboratories. One manufacturer reported that three565 Mbit/s systems in each of the two transmissionwindows could be realizable, the channels having aspacing of 20 nm. However, this concept did notprove economically advantageous.
A very simple alternative of WDM appeared in 1988in Oslo. On a few short-haul routes one 565 Mbit/schannel was transmitted in each of the two windows1310 and 1550 nm. Simple and cheap optical couplerswere used to combine and separate the two signals attransmit and receive end respectively. Conventionalline terminals could be used. Awaiting the 2.5 Gbit/ssystems, this solution proved a good alternative whenthe number of fibre pairs was scarce.
A new single-mode fibre typeBefore 1990 an alternative single-mode fibre typewas introduced to the market. It was referred to asa “dispersion-shifted” fibre. ITU-T issued the firstversion of a recommendation for such in 1988 andnamed it G.653. The purpose was to shift the zero-dispersion wavelength from the 1310 to the 1550 nmwindow. As both dispersion and attenuation wouldhave a minimum value around 1550 nm, this fibretype was therefore optimized for use in this region.However, fibre cost was high.
Several network operators saw this fibre type as a mustfor future high-capacity long-haul systems, and soonstarted deploying it on main routes. In Telenor wewere more reluctant. We engaged our research depart-ment to carry out a thorough evaluation of G.653. Theconclusion was reached in 1992. For different reasons,mainly because of high fibre price and the advantageof co-ordination of backbone and local systems, thedispersion-shifted fibre should not be introduced in
ISSN 0085-7130 © Telenor ASA 2005
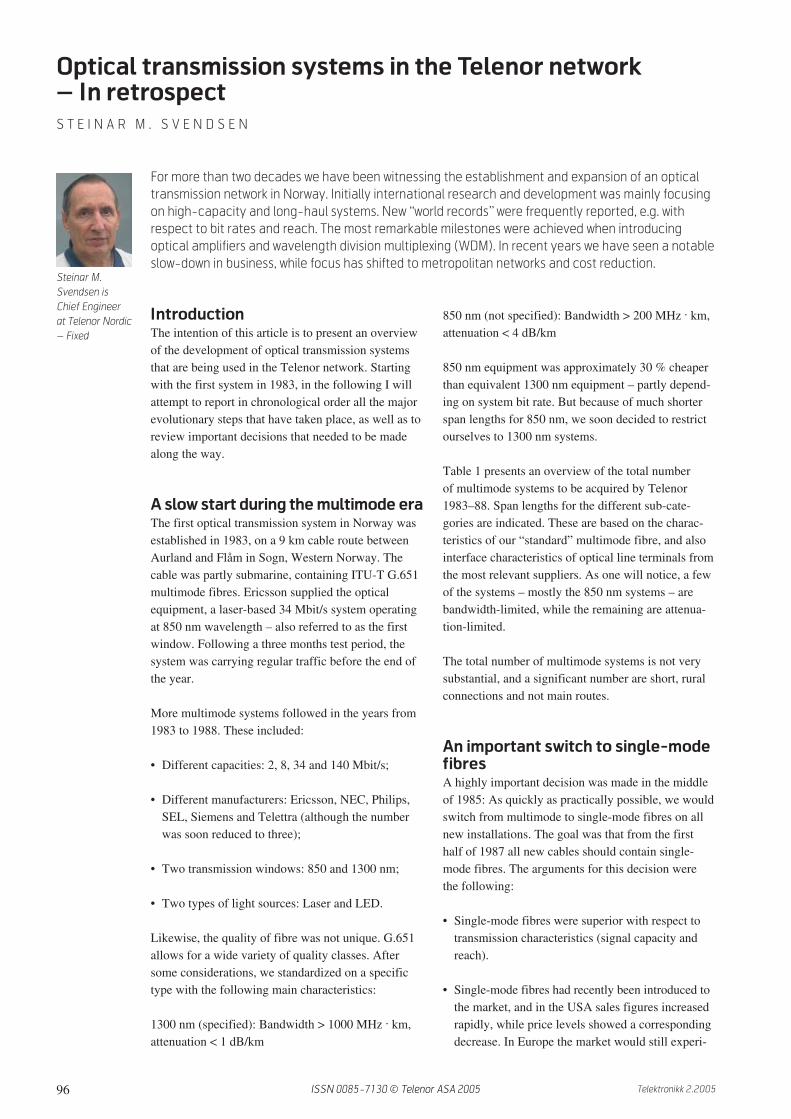
99Telektronikk 2.2005
the network for the time being. It was realized that thestandard fibre, G.652, had great potential. Time alsoshowed that technical difficulties that seemed severeat the time, like high dispersion, could be overcome.
The decision not to switch to G.653 in the domesticnetwork was a lucky one, as this fibre type wouldhave caused severe problems (four-wave-mixing – anon-linear effect) when multi-channel WDM-systemswere introduced some years later. It should be men-tioned, though, that for two submarine cable systemsbetween Norway and Denmark, G.653 was chosen.
From PDH to SDHStarting from the late 1980s, a considerable amountof 140 and 565 Mbit/s systems were installed in Nor-way, most of them supplied by Siemens. From 1989our main supplier of 565 Mbit/s equipment came tobe the Danish company NKT (in 1994 to becomeDSC Communications, then Alcatel Denmark andtoday Tellabs Denmark). In particular, before the1994 Winter Olympics in Lillehammer, there wassome intensive activity establishing an extensivehigh-bit-rate network in Southern Norway. At thistime, from 1992 onwards, the first pre-SDH 622Mbit/s and 2.5 Gbit/s systems were available. During1992 and 1993 NKT and PKI (German Philips) de-livered a large number of these systems, as shown indetail in Table 3. The total value of this equipmentwas more than 73 million NOK.
The following nominal span lengths were recom-mended:
• 622 Mbit/s1310 nm: 54–57 km 1550 nm: 90–96 km
• 2.5 Gbit/s1310 nm: 46–48 km 1550 nm: 71–74 km
These figures assume an attenuation coefficient of0.45 dB/km at 1310 nm and 0.31 dB/km at 1550 nmfor planning purposes, including cable margins andinstallation splices, and are also inclusive of loss inthe cable termination in the stations. A few years laterthe figure for 1550 nm was changed to 0.275 dB/km.
These values refer to buried cables and submarinecables. For aerial borne cables attenuation valueswere 0.05 dB/km higher, because of exposure to lowtemperatures.
In December 1994 a contract was signed withNKT/DSC, making the company our main supplierof SDH equipment, including optical transmissionequipment. Following this contract, and continuedinternational standardization activities, the first “real”SDH 622 Mbit/s and 2.5 Gbit/s systems followedthereafter.
WDM is backIn the mid 1990s a new fibre-optic componentquickly rose to fame: the optical amplifier. It pavedthe way for the breakthrough of WDM. Where beforeit was necessary to equip one regenerator per opticalchannel in each repeater point, now one opticalamplifier could amplify all channels within the sameunit. In addition, the saving of optical fibres was alsoan important factor for total cost reduction. The num-ber of fibre pairs in the cables was often quite scarceduring the first years.
The first multi-channel WDM system in Norway wasinstalled in 1997, equipment delivered by DSC. Thesystem was Oslo–Bergen, with a total route length of520 km, comprising six intermediate line repeaters;i.e. seven repeater sections. The system comprisedfour 2.5 Gbit/s channels, spaced 400 GHz apart(1549.32 nm, 1552.52 nm, 1555.75 nm, 1558.98 nm).No regeneration of signals was needed between ter-minals, also no extra optical equalization and nodispersion compensation were needed.
8-channel WDM systems followed in 1998, 16-chan-nel systems in 1999 and 32-channel systems in 2000.The 32-channel system used 100 GHz channel spac-ing, practically filling the ITU-T defined C-band(1530–1565 nm). Later also 64-channel systemsbecame available, making use also of the L-band(1565–1625 nm) with the same channel spacing;however, so far we have seen no need for that manychannels.
System capacity NKT PKI
Line terminals Line regenerators Line terminals Line regenerators
622 Mbit/s 33 16 14 4
2.5 Gbit/s 46 36 50 15
Table 3 Pre-SDH 622 Mbit/s and 6.2 Gbit/s systems delivered in 1992/93
ISSN 0085-7130 © Telenor ASA 2005

100 Telektronikk 2.2005
The success of WDM managed to slow down theurgent need for optical channels of higher capacity.For a time this delay was fortunate, as technical chal-lenges had to be overcome, like dispersion equaliza-tion accuracy, non-linear effects, PMD. However, astechnical development progressed, 10 Gbit/s channelsbecame available – although not needed in our net-work until recently. Today also 40 Gbit/s channelsare available from a limited number of suppliers.
Another challenge to the standardsingle-mode fibreIn 1996 ITU-T standardized a new fibre type, G.655“Characteristics of a non-zero dispersion-shiftedsingle-mode optical fibre and cable”. For WDM-transmission the G.653 fibre had proven unsuitable,because too low dispersion would cause non-linearphenomena. Low dispersion was an important advan-tage for high-capacity channels, but dispersion shouldnot fall below a certain minimum value. This was theidea of G.655. The fibre manufacturers were promot-ing the new fibre type quite extensively, and onecould easily get the impression that G.655 fibres werea must when high-capacity systems of some lengthwere to be established. The problem of G.655, how-ever, was that the fibre price seemed to be two orthree times the price of standard G.652 fibres.
At Telenor we carried out a study of the two fibretypes G.652 and G.655 in 2000. At this time onlytechnical data and price information on 10 Gbit/ssystems were available to us. The conclusion wasreached in October that year: At that point we sawno advantage, neither of technical nor economicalnature, to switch to the new fibre type.
A more extensive evaluation took place in 2001/2002, now including also 40 Gbit/s transmission.Three manufacturers were invited to submit technicaldata and price information on 40 Gbit/s equipment,and our research department was engaged to performan analysis of dispersion and non-linear effects basedon simulations. The conclusion of our evaluation wasthat, based on technological investigations and eco-nomical analysis, the standard single-mode fibreG.652 was the preferred fibre type to be used in theTelenor transport network for the following years.
The new fibre type was favoured by many newcom-ers in the business, particularly in the USA. On theother hand, it seems that most of the traditional net-work operators reached the same conclusion asTelenor did.
10 Gbit/s WDM goes far northIn 2003 Telenor participated in the world’s northern-most submarine cable project, two cables (of1436 km and 1413 km respectively) between Harstadon the Norwegian mainland and Longyearbyen onSpitsbergen (Svalbard) at about 78˚ north. Cables andequipment were delivered by Tyco Telecommunica-tions. Channel capacity is 10 Gbit/s. The owner of thecable system is the Norwegian Space Centre; how-ever, Telenor was responsible for the technical imple-mentation of the project, and has also undertakenresponsibility for operation and maintenance.
CWDM attracts interestAll WDM systems that have so far been installed inthe Telenor network are of the conventional DWDMtype (Dense WDM – with narrow channel spacing).As the WDM technique proved to be advantageousalso in the metropolitan network, thereby savingfibres, cheaper technical solutions were sought. InDecember 2003 ITU-T standardized a CWDMwavelength grid (Coarse WDM), RecommendationG.694.2, followed by a recommendation on CWDMoptical interfaces in 2004 (G.695). Channel spacing is20 nm, about 25 times the spacing of a conventional32-channel DWDM system. G.694.2 allows for 16(18) CWDM-channels in a wide wavelength rangefrom 1271 to 1611 nm. Optical amplifiers are inmany cases not foreseen in the metro network, andbecause of the wide channel spacing the laser stabil-ity is not critical and coolers thereby not needed.
In 2004 Telenor started a project on CWDM, result-ing in an RFQ and subsequent contract negotiations.A final decision has not yet been reached.
Towards a future all-opticaltransport networkDuring recent years ITU-T has developed a familyof optical transport network (OTN) standards. Theseinclude recommendations for the physical/opticallayers, Layer 1 standards and layers implemented insoftware. An optical transport hierarchy (OTH) hasbeen defined.
At the start of the century hopes were high for asteady development into an all-optical network,which would offer transparent transport of client sig-nals. Optical cross-connects were introduced to themarket, in particular the MEMS technology (micro-electro-mechanical-system) seemed promising. 32x32MEMS-based all-optical switch modules were com-mercially available in 2001. Lucent in particular waspromoting the new technology. However, because ofmarket conditions, Lucent had to bring an end to the
ISSN 0085-7130 © Telenor ASA 2005
101Telektronikk 2.2005
development of their MEMS cross-connect, theLambdaRouter, in July 2002. Nortel did a similarthing, and Cisco Systems before that. Attention wasinstead steered towards OEO switches. A less prag-matic view will allow signal processing in the electri-cal domain, inside the optical interfaces of a func-tional module. The all-optical network may be somefuture goal instead.
Telenor has not yet seen any need for DWDM-chan-nels in the L-band, although they have been availablefor a few years. Likewise, 40 Gbit/s channels havenot had any success so far. However, reports indicatethat the situation is slowly improving. It is also inter-esting to note that optical interfaces today are con-quering new grounds outside the traditional transportnetworks domain. To demonstrate this expansion, wewill now see optical interfaces implemented in accessnetworks, in IP- and DSL equipment.
Steinar M. Svendsen is Chief Engineer at Telenor Nordic – Fixed, Fornebu, Norway. Since 1983 he has been
working with fibre-optic transmission systems for the transport network. During recent years he has been
engaged in different projects mainly focusing on WDM transmission in transport and metropolitan networks.
email: [email protected]
ISSN 0085-7130 © Telenor ASA 2005

102 Telektronikk 2.2005
1 Start- and trial phaseThe organized start of fibre optic activities in Tele-verket started in 1980, when Televerket “saw thelight”. Activities had till then been limited to researchand some co-operation with domestic cable producerson fibres (also domestic production), cable types andinstallation methods.
1.1 Organization
The organized activities started with the establish-ment of the FOTgroup in the Line section of Tele-direktoratet (Norwegian Telecommunications Admin-istration – NTA). This group was placed under theLine section’s Network planning office, and had par-ticipants from cable and transmission offices, as wellas from the research department.
The group’s mandate was to guide the introductionof fibre-optics in the network through trials and plan-ning. The trials were conducted with the aim to testinteresting technologies in practical projects, cover-ing fibre, cables and transmission.
1.2 Trials
In the first activities there was a close connectionbetween transmission testing and fibre technology.Both fields were new, and soon proved to be develop-ing at a very fast pace. This led to the situation that assoon as a new trial project was initiated the tecnologythat was chosen in the planning was outdated and nolonger relevant in further planning. Transmissioncapacity had increased, developments in fibre tech-nology had made better fibres available, and new andbetter components were available (at acceptableprices).
This can be illustrated in the (incomplete) list of trialprojects in the box below left.
1.3 Choices
1.3.1 Technology
The rapid changes in both fibre- and transmissiontechnology made planning difficult. On this back-ground it was an advantage for Televerket to be a bitof a late starter in this field. Televerket did not havetime to invest large amounts of money in technolo-gies that would become obsolete in a very short time.
• Multimode (MM) fibre soon showed the limitationsin length-bandwidth product, and in practical uselimited to 140 Mbit/s. MM fibres with gradedindex gave better performance, but could notdeliver the needed capacities and distances.
• The 850 nm window was very soon closed as the1300 nm window was opened (light sourcesbecame readily available).
• Availability of single mode fibre, single mode lightsources and practical techniques for the use ofthese components made SM fibre the only choicefor all levels of the network. First for 1300 nm,since this window had near zero chromatic disper-
Building a fibre-optic network in Norway
H A R A L D J A N S E N
Harald Jansen
works at Telenor
Telecom
Solutions
Televerket/Telenor has been using optical fibres in the transmission network for nearly 25 years. From
a careful start, with strong elements of experimentation in both fibres and transmission, the network
has grown to a rather finely meshed network (with some exceptions). The focus of this article is on
planning and building of the core network. The article will describe the start of the use of optical fibres,
how the work was organized, and briefly describe the trials and the technological choices that were
made. Further, a chronological description is given of how the network expanded, with some comments
on competition.
Time- Projectsframe
1980 Oslo – Økern. Planned 140 Mbit/s on 6 km dual window MM fibre.
Oslo – Røverkollen. Planned 140 Mbit/s on 16 km 1300 nm MM fibre.
Bryne – Nærbø. Planned 34 Mbit/s on 9 km 850 nm MM fibre.
1982 More trial projects were selected, among them Aurland – Flåm
(34 Mbit/s at 850 nm on 9 km sea cable with MM fibre).
Testing of aerial cable in difficult weather conditions.
1983 Installation and testing on all the mentioned trial projects.
Decision to stop planning with 850 nm equipment.
Discussions with NSB on use of their masts for the electrical wires
on electrified rail lines for aerial fibre-optic cables (non-metallic).
1984 MM fibre was standardized for 1300 nm.
Trial projects for single mode (SM) fibre were selected.
Further planning of cable projects was only for SM fibre.
ISSN 0085-7130 © Telenor ASA 2005
103Telektronikk 2.2005
sion, and long reach of transmission systems couldbe dispersion limited.
• Availability of light sources and other componentsin the 1550 nm window gave longer reach due tolower attenuation, but higher dispersion.
1.3.2 Installation methods
Installation of underground cables is expensive.The low-weight, relatively small dimensions of fibrecables make them easy to handle, and several meth-ods of installation were investigated.
A natural method was to suspend the cable on poles,both Televerkets own and others. NSB has been men-tioned, and some trials were made in co-operationwith power companies. In these environments a non-metallic cable was necessary. One method was to“spin” the cable around the power line. This demand-ed both a special cable and installation equipment.The conclusion was that this method was not practi-cal for Televerket. The power companies would ofcourse not let us do this for free, and the practicalproblems were many, for example repairs. Shootingbirds with a shotgun when they were sitting on thecable/power line was never good for the cable, andrepairs demanded that there were no voltage on theline. As will be seen later the power companies cameto a different conclusion.
Underwater cables should be a natural choice in Nor-way. Several trials were conducted, and a project wasstarted to evaluate the possibilities of using fibre-optic underwater cables. This was called FOS (FibreOptic Sea cables).
An important factor was the co-operation with NSBto lay the cables along railway lines, mostly in theground, but also on poles. Right of way was in mostinstances paid for by some of the fibres in the cable.
2 PlansAlready when the FOTgroup was started it was clearthat using optics would be the way to go for thefuture transport network. It was only a question ofwhen components for practical use would be avail-able at acceptable prices. The inherent bandwidthcapacity in the fibre was there from the beginning; itwas just a question of getting the components to uti-lize this bandwidth. The traffic demand was increas-ing rapidly and optical systems seemed to have thecapability of meeting this demand in a cost-effectiveway.
In 1982 it was decided to stop planning with coaxialcables in the core network.
2.1 FOTplan
At the same time as the trial projects started, workalso started on a plan to use fibre-optics in the corenetwork. It was clear at an early stage that fibre-optics would be capable of delivering the necessarycapacities, could be used over the necessary dis-tances, and that the developments in this field madefibre optics the economical choice as well as the tech-nical one.
The FOTplan focused on the core network, whichthen was the network between the main telephoneexchanges (FSIIs). This excluded all parts north ofTromsø, which was a “white” area on the maps. Inother areas of Norway the regional and local net-works could benefit from the work in the core net-work, as cables also passed other stations and localexchanges. The plan provided a framework, and wascontinually adjusted on a more detailed level forchanges in technology, local needs, etc.
3 Building a network with fibre-optic cables
3.1 The first projects
As mentioned earlier the very first cables had multmode fibres. These proved to have a very limited use-ful life due to developments in technology, and hadvery little impact on the optical network.
The real network started with the trial projects forsinglemode (SM) fibres in 1984, on the routes Dram-men – Oslo and Gjøvik – Hamar. These projects alsoincluded testing of transmission equipment. In 1985it was decided to plan with SM fibre cables only. It isimportant to note that these fibres at that time hada full temperature specification only in the 1300 nmwindow. The specification did not include the1550 nm window until 1988.
3.2 Building the core network
Further building started very tentatively in 1986 witha few scattered short routes. The activity increased in1987, when some of the first projects were extended,and new and longer projects started. The FOTplanwas introduced, which was to establish the mainroutes from Oslo to Trondheim, Bergen, Stavangerand Kristiansand by the end of 1991. In addition astrategic plan in Televerket stated that all FSIIexchanges should be connected together by fibre-optic cables by year 2000. The building of this net-work started in 1988.
Evaluation of the fibres continued parallel to thebuilding of the network. It became clear that the1550 nm window would be very interesting in the
ISSN 0085-7130 © Telenor ASA 2005

104 Telektronikk 2.2005
Figure 2 Status by end of 1990
Figure 1 Status by end of 1988
Ch
Sb
Gk
Sg
Br
Ål
Td
Bo
Tb
Oslo
Tø
Mom
Bdu
Nk
Fk
Mo
Ms
Ssn
Bn
NsGrg
Srn
GlsBek
Cs
Md
Dm
Gl
Vs
Ne
Fø
Kb
Oe
ØnEld
ELyd
Hd
Em
Gva
Hok
Hfs
Lm
Lsm
Ski
Sk
A
Ntd
D
Hm
Ksr
M
Se
Sgs
Oph
Hm
Lø
Anl
M
Ch
Sb
Gk
Sg
Br
Ål
Td
Bo
Tb
Oslo
Tø
Mom
Bdu
Nk
Fk
Mo
Ms
Ssn
Bn
NsGrg
Srn
GlsBek
Cs
Md
Dm
GlVs
Ne
Fø
Kb
Oe
ØnEld
ELyd
Hd
Em
Gva
Hok
Hfs
Lm
Lsm
Ski
Sk
A
Ntd
D
Hm
Ksr
M
Se
Sgs
Oph
Hm
Anl
M
ISSN 0085-7130 © Telenor ASA 2005
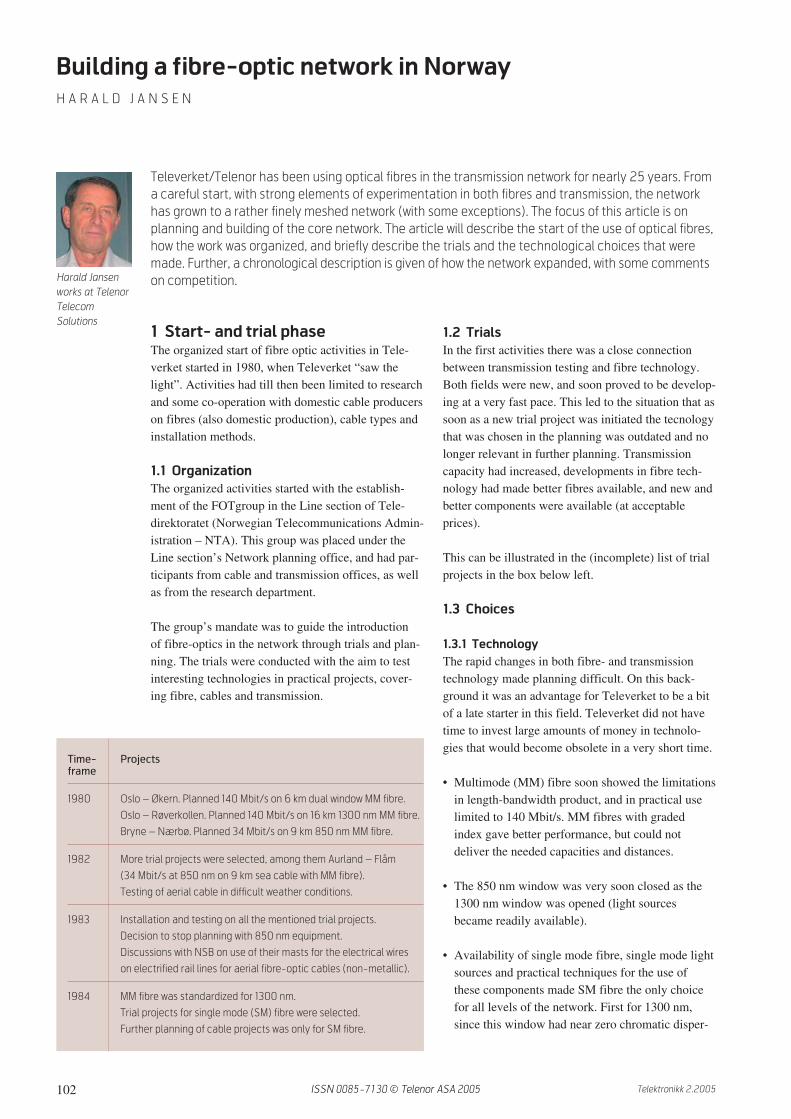
105Telektronikk 2.2005
core network due to lower attenuation and the possi-bility for longer system reach.
Components for this window began to appear, in par-ticular lasers with the necessary characteristics in out-put power and line bandwidth. It was thereforeimportant that the network would be able to handle1550 nm signals. The standardized SM fibre wasoptimized for 1310 nm, and tests showed that cableswith these fibres could not be used at very low tem-peratures due to bending of the fibres. This situationwould be expected on several main routes, and espe-cially where aerial cables were used. The routesthrough the Østerdalen and Gudbrandsdalen valleysare good examples of routes that would be exposedto low temperatures. This led to new specificationsin 1988, which included the temperature range in the1550 nm window.
In 1988 work was ongoing on several routes. In Øster-dalen work was stopped at Rena to wait for the newcables. This marked the end of the old type SM fibres,no more cables were installed with that type of fibre.
By the end of 1988 the network was as shown on themap in Figure 1. Very scattered projects, but the startof some of the main routes can be seen.
The building activities between 1988 and 1990resulted in a marked extension of the network. Thestatus by end 1990 is shown in Figure 2. One routebetween Oslo and Trondheim was established, andthe route from Bergen through Stavanger round thecoast to Oslo was well under way.
The graph in Figure 3 shows the dramatic increase incable kilometres per year from 1986 to 1989. Com-paring it to the graph for fibre kilometres per year inFigure 4 there is no such dramatic increase. Thisillustrates that even if many cables were installed thenumber of fibres per cable was low. In fact, the typi-cal cable size was with six fibres (three pairs) in thebeginning, increasing to eight and 12 fibres over aperiod. Fibres were expensive, so the number offibres in the cables was kept low to reduce costs.Even so, the cost of a new cable project between Osloand Trondheim could not compete with a radio linksolution when compared only for end-to-end trans-mission. An important advantage for cables was thatthey would also cover the needs for many nodesbetween the end-points.
This low number of fibres in the cables meant thattransmission technology had to develop fast enoughto meet the demands for capacity. This meant in prac-tice that the next hierarchical system level had to beavailable before capacity demands were higher than
what could be delivered with parallel systems at pre-sent level. With six fibres available, this meant that565 Mbit/s systems had to be available before thedemand was higher than what three parallel140 Mbit/s systems could deliver, 2.5 Gbit/s systemsbefore three parallel 565 Mbit/s were filled with traf-fic, and so on. This expectation was fulfilled up to2.5 Gbit/s systems.
Several new types of fibres were developed, all withthe aim of reducing the chromatic dispersion problemin the 1550 nm window. First was the dispersionshifted (G.653) fibres, with zero dispersion at 1550nm. With these fibres the system reach could beextended, fewer regenerators would be needed, andconsequently costs would be lower. However, theregenerator distance was in many cases dispersionlimited.
These fibres were evaluated, but in 1992 the decisionwas made to continue with the “standard” SM fibre.The advantages of having only one type of fibre in
Figure 3 Cable kilometres per year
Figure 4 Fibre kilometres per year
Fiber cabel km pr. year
0
500
1.000
1.500
2.000
2.500
3.000
3.500
1986 1988 1990 1992 1994 1996 1998 2000 2002 2004
Fib
er
ca
be
l k
m
Fibre km pr. year
0
20.000
40.000
60.000
80.000
100.000
120.000
140.000
160.000
180.000
1986 1988 1990 1992 1994 1996 1998 2000 2002 2004
Fib
re k
m
ISSN 0085-7130 © Telenor ASA 2005
106 Telektronikk 2.2005
Figure 5 Status by end of 1994
Ch
Sb
Gk
Sg
Br
Ål
Td
Bo
Tb
Oslo
Tø
Mom
Bdu
Nk
Fk
Mo
Ms
Ssn
Bn
Ns Grg
Srn
GlsBek
Cs
Md
Dm
Gl
Vs
Ne
Fø
Kb
Oe
ØnEld
E Lyd
Hd
Em
Gva
Hok
Hfs
Lm
Lsm
Ski
Sk
A
Ntd
D
Hm
Ksr
Se
Sgs
Oph
Hm
Lø
Anl
Åmotfors
Tanum
HjørringThisted
the network were great. Components were developedwhich would counter the problems of standard SMfibres; the most important being dispersion compen-sating elements.
The Winter Olympics in Lillehammer in 1994 led toa lot of network building, especially in the local area,but also other parts of the network needed strengthen-ing. This included connections abroad, and to the twodomestic satellite stations.
Two submarine cables between Norway and Den-mark were installed in 1992. Two cables were chosenfor redundancy, and this redundancy thinking isnoticeable in the core network. Redundant routesbetween the main nodes were the target.
1994 also marked the introduction of a new transmis-sion hierarchy SDH, through the use of 2.5 Gbit/ssystem. This was first used in the Olympic network,but was quickly spread out in the core network. Thefibre-optic core network at the end of 1994 is shownin Figure 5.
The strategic plan for connecting the FSII exchangeswas finished well ahead of plan in 1994, whenTromsø was connected as the last FSII. All the otherFSIIs were connected in 1993.
The target for redundant routes was nearly achievedin 1996, when only Tromsø was left with one fibre-optic route. The two direct connections betweenBergen and Oslo were finished that year, as well asdual routes from Bergen around the coast throughStavanger, Kristiansand and Tønsberg, to Oslo.
4 CompetitionEven while Televerket had a monopoly on publictelecommunications, companies and organizationscould build their own private networks. NSB is agood example. They had a railway network that cov-ered large parts of the country, and soon they alsohad an internal network with fibres, partly throughthe co-operation with Televerket.
The power companies also had a need for communi-cations and found the method of spinning cables onthe power lines more practical for their own use.Over some time quite a network has been built by thismethod. Mergers and takeovers of the different com-panies have led to a countrywide network that cancompete with Telenor in delivering telecommunica-tions solutions, even if we feel that they do not havequite the same diversity in their network.
ISSN 0085-7130 © Telenor ASA 2005

107Telektronikk 2.2005
Figure 6 Status by end of 2001
Lysekil
Blaabjerg
FK
Td
Se
Ch
Sb
Gk
Sg/B
Br
Ål
Tb
Oslo
Tø
Mom
Bdu
Nk
Mo
Ms
Ssn
Bn
Ns Grg
Srn
GlsBek
Cs
Md
Dm
Gl
Vs
Ne
Fø
Kb
OeEld
E
Fl
Hd
Em
Gva
Hok
Hfs
Lm
Lsm
Ski
Sk
A
Ntd
D
Hm
Ksr
M
Sgs
Oph
Lø
Anl
Åmotfors
Tanum
HjørringThisted
Ønk
Kornsjø
5 Further refinements in the fibre-optic network
When the foundation network with dual routes was inplace in 1998, the work continued to build flexibilityinto the network. Diversity and redundancy are keywords in this respect. Even if most of the diversity inthe transmission network was taken care of in thetransmission equipment, it was necessary to havediversity also in the fibre network. The networkchanged into a meshed network. In the south of Nor-way several east-west routes were established. This ispictured in Figure 6, which shows the network in 2001.
From 1994 the transmission technology was SDH,and in the core network the systems were constructedas rings with self-healing mechanisms (protection).Meshes in the fibre network made it possible tospread the systems on different routes.
In the mid 1990s the Optical Fibre Amplifierappeared, resulting in the multi-channel wavelengthdivision multiplexing (WDM) systems. This made itpossible to extend the transmission capacity of a sin-gle fibre pair. At first this was done with the samefactor (4) as was common between hierarchical PDHand SDH system levels, later many times that, cur-rently 32 times (wavelengths). This happened at avery critical time, as we were running out of fibres onmost routes, and 10 Gbit/s systems per fibre pair werenot available.
This new technique also “uncovered” problems withthe G653 fibres with zero dispersion at 1550 nm. Theproblem was intermodulation, with intermodulationproducts coinciding with the wavelengths when theywere regularly spaced. Dispersion eliminated theseintermodulation products It seemed that the rightchoice was made in 1992.
Different attempts were made to make fibres withnearly zero dispersion, but with enough dispersion totake care of the intermodulation (G.655 fibres). Thesefibres were expensive, and the decision to stay with thestandard G.652 fibre was renewed as late as in 2002.
Protecting the fibre cables also became important, assome incidents uncovered weaknesses in the network.Even if most of these incidents were a result of sev-eral simultaneous faults, they resulted in heavy activ-ity in the years 2000–2001. This is clearly seen in thegraphs in Figures 3 and 4. Parallel routes were estab-lished, several independent cable intakes to the sta-tions were made, and so on. The aim was to makethe network more robust. The network is normallydimensioned to handle one fault, but since work inthe network can have the same effect as a fault (theprotection route is used during work), a “real” faultcan have a dramatic effect.
ISSN 0085-7130 © Telenor ASA 2005

108 Telektronikk 2.2005
In the core network the focus is now on diversity,with parallel routes, more meshes, and careful “plac-ing” of the transmission systems in relation to eachother. New transmission methods (ATM, IP, Ether-net) have taken the protection up a level from thetransmission equipment. This places more focus onthe fibre network (and the WDM systems) and thediversity there.
An extension of the fibre network north of Tromsø isgoing on, but slowly. The traffic demand is stillwithin what can be delivered with radio links, butdemand is increasing. Activities in the oil sector isone driving factor in this.
Fibre cables are spreading out in all parts of the net-work, even if the “fibre to the home” is not yet a real-ity. However, activities are going on, but that isanother story with other challenges.
Harald Jansen was educated at the Norwegian Institute of Technology and started work in 1972 in the Line
Section of the Norwegian Telecommunications Administration. His initial work was in the planning of line
systems on metallic pairs, and moved on to systems on fibre-optic pairs, a field he is still working in.
email: [email protected]
ISSN 0085-7130 © Telenor ASA 2005

I IntroductionThe Optical Transport Network (OTN) has todaybecome the key to high-capacity network infrastruc-tures. The use of optical-fibre technology, Wave-length Division Multiplexing (WDM) and the nowample set of well-established control and manage-ment protocols, allow for high-capacity connectionson-demand. By employing advanced photonic tech-nology, optical networks can provide switching androuting of optical circuits in the space and wave-length switching domains. On the switching side,Optical Cross Connect (OXC) systems have recentlybecome available in addition to the more matureOptical Add-Drop Multiplexers. This opens the possi-bility of deploying complex WDM networks basedon mesh topology, while in the past single ring oroverlaid multi-ring have been the most used archi-tectures for WDM networking. Mesh topologies arepreferred to rings because they attain a considerablybetter use of the available bandwidth as well as pro-vide better traffic engineering and efficient M : Nrestoration schemes (that is where M working pathsshare the same N protection paths).
These past years have also seen a continuous growthof system aggregated bitrate. Today WDM transmis-sion systems allow the multiplexing of 160 distinctoptical channels on a single fibre, while recent ex-
perimental systems support up to 256 channels [1].Given the high bitrate carried by a single WDM chan-nel, e.g. 2.5 to 40 Gbit/s [2], the outage of a high-speed connection operating at such bitrates, even forfew seconds, means huge loss of data. The increase inWDM complexity associated with the evolution fromring to mesh architectures, together with the tremen-dous bandwidth carried by each fibre, brought theneed for suitable protection strategies into the fore-ground.
Survivability, i.e. the capability of keeping servicesactive even in the presence of failures, is obviouslya general property that applies not only to optical net-works but to networks in general. Resilience strate-gies have been developed in the past for a range ofnetwork architectures and at many protocol layers.For example, in the case of the IP protocol, surviv-ability is achieved essentially by routing the packets(datagrams) through the network dynamically, keep-ing the network-element state into account. In IP,routing is distributed, i.e. any IP router takes the rout-ing decisions applying the same algorithm on its own“image” of the network. Each router has a directknowledge of only a small part of the network: itsneighborhood. In order to create its network “image”it has to receive and gather information from its peerrouters. Information-exchange between routers occursaccording to a dynamic routing protocol, the best-known and widest spread being Open Shortest-PathFirst (OSPF). The basic IP resilience mechanism,then, works as follows. When a failure occurs, somerouters detect it and inform the other routers by send-ing OSPF signaling messages. Meanwhile, they mod-ify the routing and direct packets to bypass the failedelements. When all the routers are aware of the fail-ure, the new routing that skips the failures is consis-tent in the whole network: in this way, traffic protec-tion is automatically achieved.
IP has not been casually mentioned: given the pre-dominance of TCP/IP as the protocol architecture thatsupports the great majority of telecom applications
Cost and benefits of survivability in an optical transport network
G U I D O M A I E R , M A S S I M O T O R N A T O R E A N D A C H I L L E P A T T A V I N A
Guido Maier is
Researcher at
CoreCom, Milan,
Italy
Massimo
Tornatore is a
PhD candidate
at Politecnico di
Milano, Italy
Achille Pattavina
is Professor at
Politecnico di
Milano, Italy
In optical networks a link failure may cause a huge data loss due to the ever-increasing capacity of
WDM links. Survivability to failures in the optical layer is thus of great importance. This paper presents
the most common protection techniques for optical mesh networks and introduces the reader to the
approaches that can be used to design the network minimizing the excess cost due to survivability.
On the other hand, we will show how the effectiveness of different protection mechanisms can be
compared in terms of lightpath availability, a quality-of-service parameter that gives a measure of
the degree of network resilience.
Figure 1 Layer structure of an IP-over-OTN network
IP router
OXC
Optical link
IP traffic relation
Lightpath
OT
NIP
la
ye
r
109Telektronikk 2.2005 ISSN 0085-7130 © Telenor ASA 2005
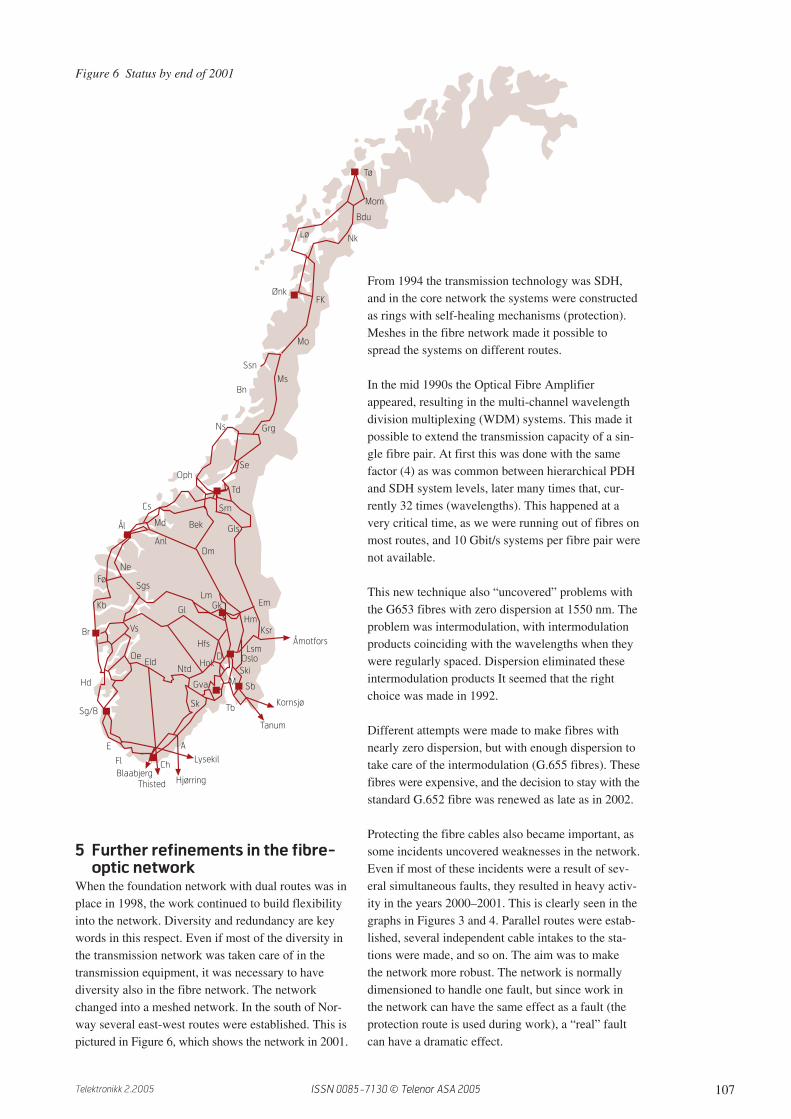
110 Telektronikk 2.2005
today, IP has become the most important and fre-quently adopted client for the optical layer. Figure 1shows schematically the IP-over-OTN architecture.
After our brief digression of IP (OSPF-based) protec-tion, the reader may wonder why in an IP-over-OTN
network resilience could not be provided at the IPlayer, making protection in the optical layer obsolete.The main reason to implement resilience in the opti-cal layer with its own protection mechanisms, is thefailure response time. Let us assume that at a giventime a failure struck a physical link of an IP-over-
Figure 2 (a) A failure occurs on a fibre link of an IP-over-OTN network. (b) The failure may be recovered atthe IP layer, e.g. by OSPF: the procedure takes time in the order of tens of second. (c) Optical protection isinstead much faster and reacts in a few milliseconds
OSPF signaling
OTN signaling
(a)
(b)
(c)
ISSN 0085-7130 © Telenor ASA 2005

111Telektronikk 2.2005
WDM network, as represented in Figure 2(a). As wehave explained above, IP traffic is recovered by adynamic change in routing, via OSPF protocol (seeFigure 2(b)): this implies delay for signaling propaga-tion and processing and delay for router reconfigura-tion. It should be noted that OSPF messages are sentwithin IP datagrams and thus require complex layer-3packet processing. Figure 2(c) shows the case inwhich protection is performed at the OTN layer. Stillwe have delay for signaling propagation and recon-figuration. However, signaling is sent at this layerexploiting optical control circuits directly from thefinal node to the ingress node of the protected light-path, without the need of processing in intermediateOXCs. Reconfiguration is also fast.
In conclusion, the main reason for implementing pro-tection at the optical layer is to achieve a fast recov-ery of faulted connections: optical protection mecha-nisms at the layer are able to restore connectivity inless than 100 ms (typically, well below 50 ms).OSPF-based traffic recovery requires tens of secondsto be carried out completely. The difference is ofseveral orders of magnitude1). Such difference allowsto recover connectivity so fast in the optical layerthat OSPF is not even able to detect the failure.
Let us go back now to the OTN, explaining opticalresilience in more detail. In the traditional ring-basednetworks the protection requirements are satisfied bywell-known and tested solutions existing for quite along time. For their simplicity and ease of integrationwith SDH structures, WDM ring topologies can beconsidered historically the second stage in the evolu-tion of optical networking and represent the environ-ment in which WDM protection techniques havecome to be standardized.
In recent years the issue of survivability of opticalconnections has become of outstanding importancealso in mesh WDM networks and has raised muchinterest in the research community. Undoubtedly, theadoption of protection techniques is traded off by amore complex network design; this has to include afurther aspect of dimensioning and handling of theadditional resources required to face the link failure,for example for the rerouting of lightpaths involvedin a failure. These problems can no longer be manu-ally solved in complex network architectures, as usu-ally happened in the earlier experimental WDM sys-tem deployments. Computer-aided planning tools andprocedures are needed in order to achieve an efficientutilization of network resources. Research on optical
networking has recently been investigating designand optimization techniques in order to provide oper-ators with the most efficient and flexible proceduresto solve the network design problem.
The improvement of the network performance attain-able by introducing protection can be quantitativelymeasured. Generally speaking, availability and relia-bility are therefore parameters to be used for bothrepairable and non-repairable systems. Given thatOTN is clearly repairable, the most important featureis connection availability. By this parameter the oper-ator is able to quantify the quality of service that isoffered to the user in terms of maximum downtimepercentage.
Clearly any protection technique requires additionalnetwork costs to deploy spare resources that aretraded off by the network operator’s capability ofguaranteeing agreed levels of connection availabilityto customers. While methods aimed at planning sur-vivable networks have been extensively studied in thelast decade and have resulted in a number of protec-tion methods, the related topic of how these affectavailability is receiving growing interest today. Inparticular, the definition of a standard model of ser-vice level agreement for the optical layer (O-SLA) istoday largely debated. A service level agreement is aformal contract between a service provider and a sub-scriber containing detailed technical specificationscalled service level specifications (SLSs). An SLSis a set of parameters and their values that togetherdefine the service offered to a traffic stream in a net-work. Until now, no standards for the contents of anSLS have been finalized, but interesting proposalshave been published as Internet drafts by the InternetEngineering Task Force (IETF) [3]. A recent pro-posal [4] identifies the service unavailability as a keyparameter to define a class of service distinction foroptical circuits (see Table I).
Availability and Reliability (A&R) analysis is a fun-damental tool for the operators to understand the rela-tions between the protection mechanisms they installand the performance of connection integrity of theirnetwork. The final goal is to optimize the trade-off
1) Often MPLS is adopted as intermediate layer between IP and OTN. Several protection mechanisms have been proposed for MPLS.These mechanisms are faster than OSPF, but still in the range of seconds.
CoS Premium Gold Silver Bronze
Service Unavailability 10-5 10-4 10-3 10-2
Table I Optical circuits class of service
ISSN 0085-7130 © Telenor ASA 2005
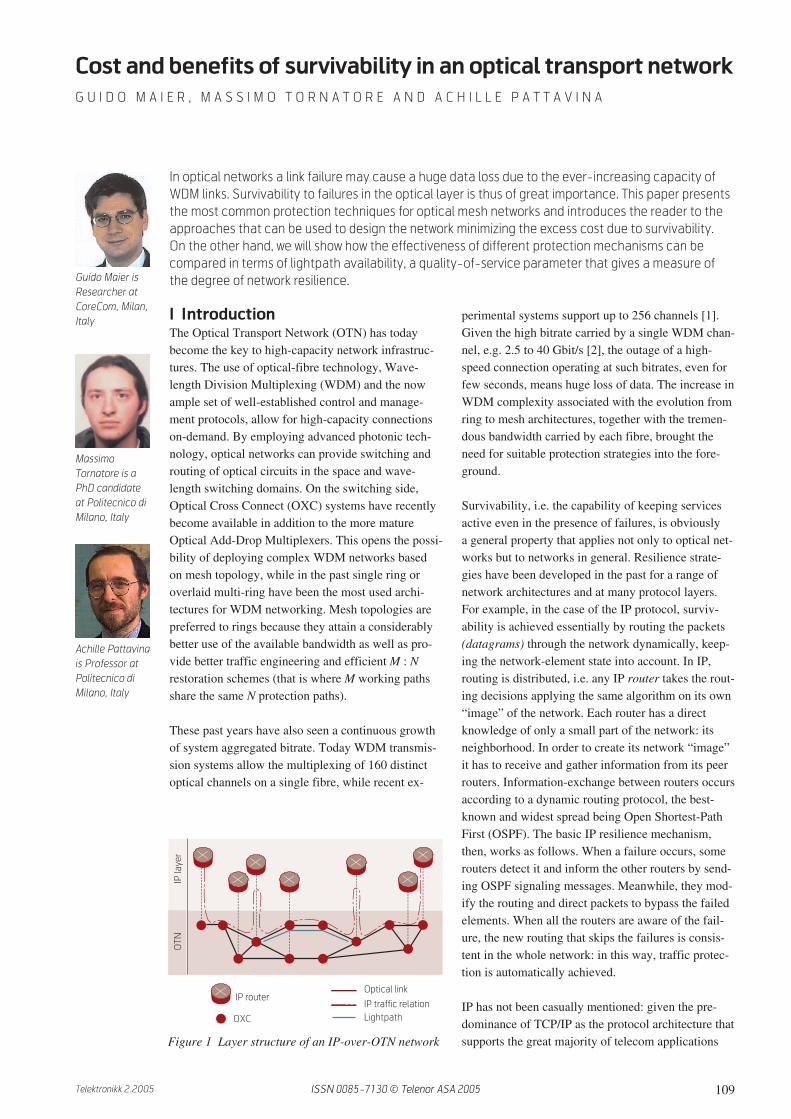
112 Telektronikk 2.2005
between extra deployment costs and higher revenuesfrom more advantageous service level agreements.
The first aim of this paper is to compare the perfor-mance of some protection techniques that have beenlargely discussed in previous literature in terms of thenumber of fibres required to support a given offeredtraffic. We will show how to obtain optimal solutionsby exploiting exact methods in order to guaranteecomparison between optimal results. Using heuristicapproaches to accomplish network dimensioningwould imply an uncertainty due to the approxima-tions and/or sub-optimality inherent in such methods.In particular we focus on Integer Linear Program-ming (ILP), a widespread technique to solve exactoptimization. ILP formulations used to carry on thiscomparative study are based on the universallyaccepted flow and route paradigm [5] that we willexplain in the following.
In the second part of this article we focus our atten-tion on the analysis and comparison of the availabil-ity performance of protected OTNs. In particular, wewill consider any possible end-to-end protection tech-nique: each dedicated and shared configuration willbe analyzed by a combinatorial approach, providing aclosed-form algebraic equation (sometimes by intro-ducing approximations). These simple back-of-the-envelope equations are, however, sufficient to revealuseful properties of end-to-end protection that are inturn presented later on.
The rest of the paper is organized as follows. SectionII describes the features of the protection strategiesthat will be analyzed and compared. Section IIIbriefly introduces the most common approaches tomodel protected network design, focusing on theILP-based method, where some consideration onthe advantages and drawbacks of exact vs. heuristicmethods are also given. To conclude the first part ofthis work, in section IV results obtained by meansof the ILP formulations to a case-study network areshown; this allows us to point out the network costimplied by the adoption of the different protectiontechniques. Section V opens the availability-focusedpart of the paper illustrating the assumptions andbasic principles on which our analytical model isbased; in Section VI we present the derivation of thealgebraic relations that evaluate the availability per-formance of the dedicated and shared N : M end-to-end protection schemes. In Section VII we reportsome numerical examples to compare the availabilitydegree provided by the different protection tech-niques and highlight dependencies of A&R on somenetwork parameters.
II Protection techniques in WDMnetwork
After the introductory discussion on WDM networksand the drivers for WDM survivability, let us reviewthe details of the protection techniques that have beentaken into account in this comparison study. In therest of the paper we will assume a mesh network asthe reference topology. Although the ring is the mostcommon physical topology today, WDM mesh net-works are gradually attaining growing importance,especially thanks to the development and improve-ment of the OXC. In a mesh network, survivability isa more complex problem than in a ring topologybecause of the greater number of routing and designdecisions that need to be made [10]–[12].
Two general and “orthogonal” criteria can be as-sumed in order to classify these techniques. A firstclassification criterion regards the entity to be pro-tected, so that protection can be applied directly onthe single optical link or on a whole lightpath con-necting two end-nodes. Actually, this simple distinc-tion reflects the particular sublayer of the WDM layer[ASON] in which a given protection mechanismoperates. Two alternatives exist: Optical Channel(OCh) sublayer or Optical Multiplex Section (OMS)sublayer. In the former case the lightpath is the entityto be protected, so that OCh-protection is also calledpath protection. In case of failure each single inter-rupted lightpath is switched on its protection path [6].Recovery operations are activated by the OCh equip-ment hosted in the end-nodes (source and destination)of the lightpath. These systems also have the duty ofmonitoring lightpaths for failure detection. The pro-tected entity is called working lightpath, while afterthe failure the optical circuit is switched over to aprotection lightpath. This lightpath can be pre-allo-cated or dynamically established.
On the other hand, the OMS-sublayer managed entityis the multiplex of WDM channels transmitted on afibre. Thus at this sublayer fault recovery regardseach network link individually, so that this approachis also called link protection [7]. The OMS equipmentin the terminations of the fibres composing a singlelink locally manages fault-detection and protectionswitching. The protection mechanism reacts to a fail-ure by diverting the interrupted WDM multiplex to analternative path, thus bypassing the damaged compo-nents. The main difference from path protection isthat all the lightpaths travelling along a broken fibreare simultaneously re-routed. Link protection is com-monly implemented adopting one of two alternativemodes: depending on signalling capabilities, eitherall the fibres belonging to a failed link must be jointlyre-routed, or the protection scheme can be applied at
ISSN 0085-7130 © Telenor ASA 2005
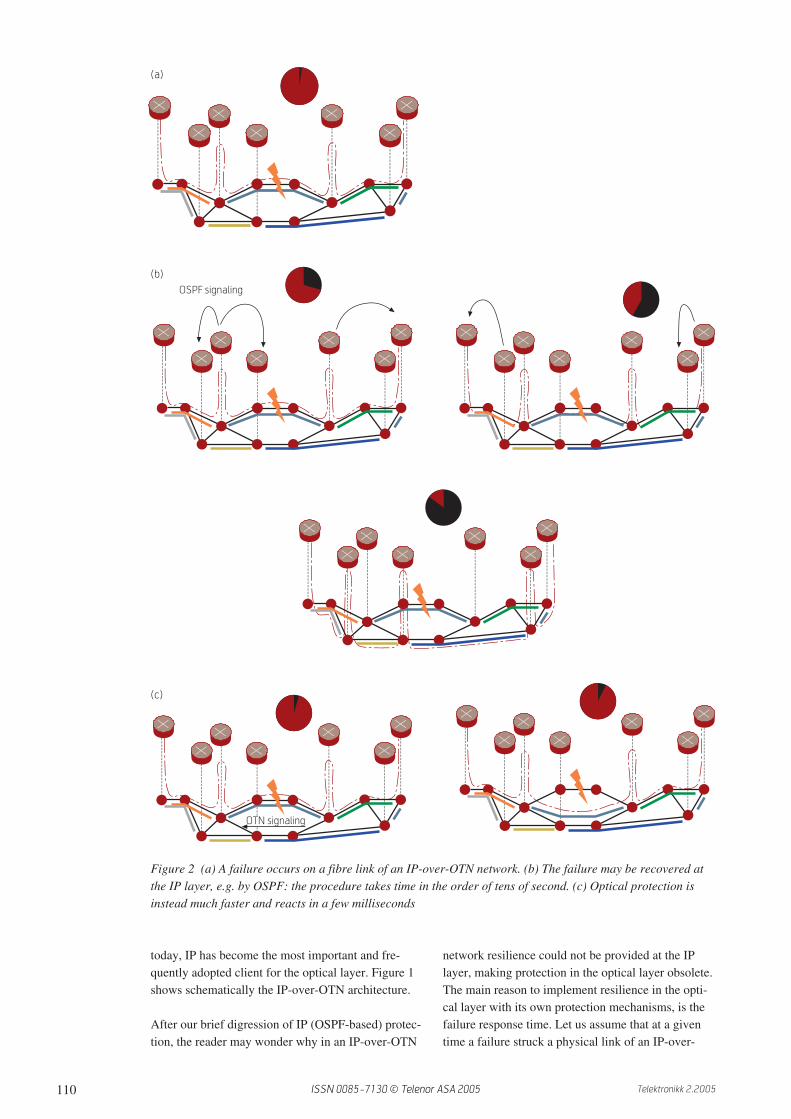
113Telektronikk 2.2005
the level of the single channel, setting an alternativepath for each failed wavelength.
A second classification criterion distinguishesbetween dedicated protection and shared protection.The simplest and most conservative procedure is thereservation of a set of spare resources exclusively toone working entity (a lightpath in OCh protection ora link in OMS protection). This is the so-called dedi-cated protection: it reduces the complexity of failurerecovery, but requires that at least 50 % WDM chan-nels cannot be used by the (non-preemptive) workingtraffic. Since pre-planned protection is based on theassumption that a multiple failure is a very unlikelyevent, two or more protection entities (lightpaths orfibre sequences for OCh and OMS protection, respec-tively) can actually share some resources (WDMchannels or a fibre, respectively). This is possibleprovided that the corresponding working entitiescannot be simultaneously involved by a single failureevent, i.e. they cannot belong to the same SharedRisk Link Group (SRLG), a concept introduced inrecent literature [8], [9]. In this case all the fibres inthe same link (bundle) form an SRLG2). Shared-pro-tection strategy exploits this property by preplanningthe network so that some WDM channels or fibres areshared by more protection entities. Shared protectionallows to sensibly reduce the amount of spareresources and to improve network utilization forworking traffic, at the cost of increasing the recoveryprocedure complexity (this point will be discussedlater).
A Path protection
Path protection at the OCh layer is obviously wellapplicable to mesh networks. To satisfy each connec-tion request a pair composed of a working and a pro-tection lightpath has to be established (Figure 3). Forthe protection mechanism to be effective against linkfailures, the links of the working and protection light-paths must be independent in the sense of failureoccurrence. In our analysis, this condition is satisfiedby setting up the two lightpaths in physical-routediversity: the primary and backup paths cannot shareany link (link disjointness3)).
Care must be taken when imposing physical routediversity. A network topology simply representingfibres or cables as separated arcs may be misleading.Ref. [8], [13] discuss cases in which distinct arcs
of the physical topology share the same infrastructure(e.g. two different fibre cables crossing a river on thesame bridge). Two dedicated path protections aredefined, 1 + 1 and 1 : 1. In the former case the samesignal is transmitted on two diverse paths by thetransmitter node, while the receiver node is in chargeof choosing the signal with the higher SNR (or, moregenerally, with better characteristics). A link failureevent can be bypassed without signalling exchange.In the second case (also called protection transfer-ring), low priority traffic can be transmitted on theprotection lightpath in absence of failure, but end-to-end signalling becomes necessary (Figure 3).
Dedicated path protection (DPP) is quite resourceconsuming in mesh networks because of the physicalroute diversity constraint. Sharing of WDM channelsamong protection paths may reduce the physicalresources employed for protection. Shared protectionmay be applied in an end-to-end sense using a singleprotection lightpath for N working lightpaths with thesame source-destination node pair. This technique isa special case of sharing in which N protection light-paths share all their WDM channels (known as 1 : Nprotection). Obviously 1 : N protection requires thatN + 1 link-disjoint paths are available between thesource and the destination nodes of the connection.So this protection strategy implies a high connectivitydegree in the source and destination nodes that ex-ploit it, but a realistic scenario of WDM networkdeployment, especially in wide-area application,
2) Let us observe that when applying a link protection strategy, two or more protected entities (the link) cannot be involved in a singlefailure event, under the hypothesis of failures affecting links but not nodes. So the dedicated case provides a large redundancy ofbackup capacity that will improve the survivability of the network against multiple failure events.
3) The term “link disjoint paths” has entered the common usage in literature to indicate the condition of preventing physical resourcesharing (see [7]). The term disjoint is not entirely appropriate, since in probability theory it refers to events not happening at thesame time: independent should be used instead. We will however follow the common convention in this paper.
Figure 3 Path protection in a mesh network: in 1 : 1dedicated protection, signaling is required
signaling
working lightpath
protection lightpath
ISSN 0085-7130 © Telenor ASA 2005
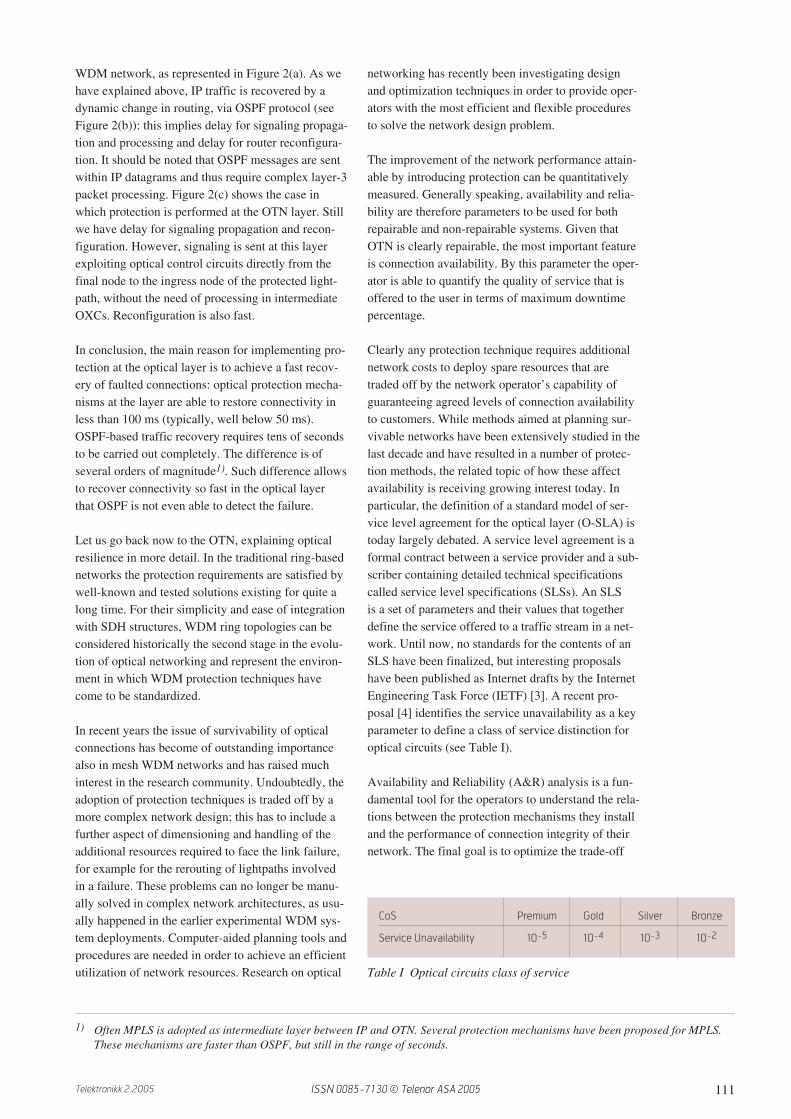
114 Telektronikk 2.2005
would probably be characterized by low values ofconnectivity index.
The end-to-end shared protection can be generalizedby adopting more than one – e.g. M – protectionpaths to backup N working lightpaths. This protectiontechnique, indicated as M : N can achieve higher reli-ability compared to 1 : N, as we will show later. It isworth mentioning that with M : N we need a total ofM + N disjoint paths between the two end-points.
The shared path protection (SPP) scheme is imple-mented in a wider sense on a mesh network by allow-ing partial sharing among the protection lightpaths. Inthis case an additional constraint must be taken intoaccount: protection lightpaths sharing WDM channelsmust be associated to working lightpaths that aremutually link disjoint [6], [11]. It is important tonotice that sharing allows savings in terms of trans-mission resources, but it also increases control planecomplexity. In 1 : 1 and in M : N protections, when afailure occurs, only the end-nodes are involved in therecovery process, because the protection lightpathsare completely set-up in advance. When shared-pathprotection is adopted in the wide sense in a mesh net-work, the fault event activates a more complex recov-ery procedure that requires a lot of signalling amongseveral network elements. It is in fact necessary toreconfigure all the OXCs that are terminations ofshared WDM channels (see Figure 4) according towhich particular working lightpath needs to be recov-ered [14]. These operations increase the recoverydelay, which will be limited by the time taken bythe signalling messages to reach all the involvedelements plus the time taken to reconfigure all theOXCs.
Since shared protection is a pre-planned strategy,the recovery operation could be controlled in a dis-tributed rather than in a centralized way, thus elimi-nating the intervention of the network managementsystem and reducing the amount of signalling. In thiscase the OXCs must be able to autonomously identifythe faulty working lightpath in order to switch acc-ordingly. The first operation requires real-time detec-tion of the lightpath identity and it is one of the mainmotivations that fostered the definition of an OChidentifier in the framework of the standardization ofthe OCh supervisory channel (ITU-T G.872, G.709,G.798 recommendations).
B Link protection
In WDM mesh networks, link protection at the OMSsublayer under some aspects can be preferable to pathprotection. In a complex topology, a local recoverymechanism, more suitable to distributed than to cen-tralized control, is easier to manage than an end-to-end mechanism. The present-day realizations of thisprotection technology are implemented by means ofself-healing rings that provide a local (along the ring)shared utilization of backup resources. Link protec-tion on a mesh network can be realized in variousways [15]. Basically two approaches can be followedto accomplish link protection; following a link failureeither all the fibres crossing the link are rerouted on acommon protection route, or each channel is reroutedindependently on different paths (Figure 5).
In our approach link protection consists in providinga single alternative path to each link in the network.In other words, given the number of fibres on a linkneeded to support offered traffic, an equivalent num-ber of fibres has to be planned along an alternative
W1
protection
W2
W1
protection
W2
working lightpath
protection lightpath
Figure 4 Shared path protection in a mesh network. Network configurations when a failure affects the light-path w1 (a) or the lightpath w2 (b), whose protection-lightpaths share a common fibre
ISSN 0085-7130 © Telenor ASA 2005
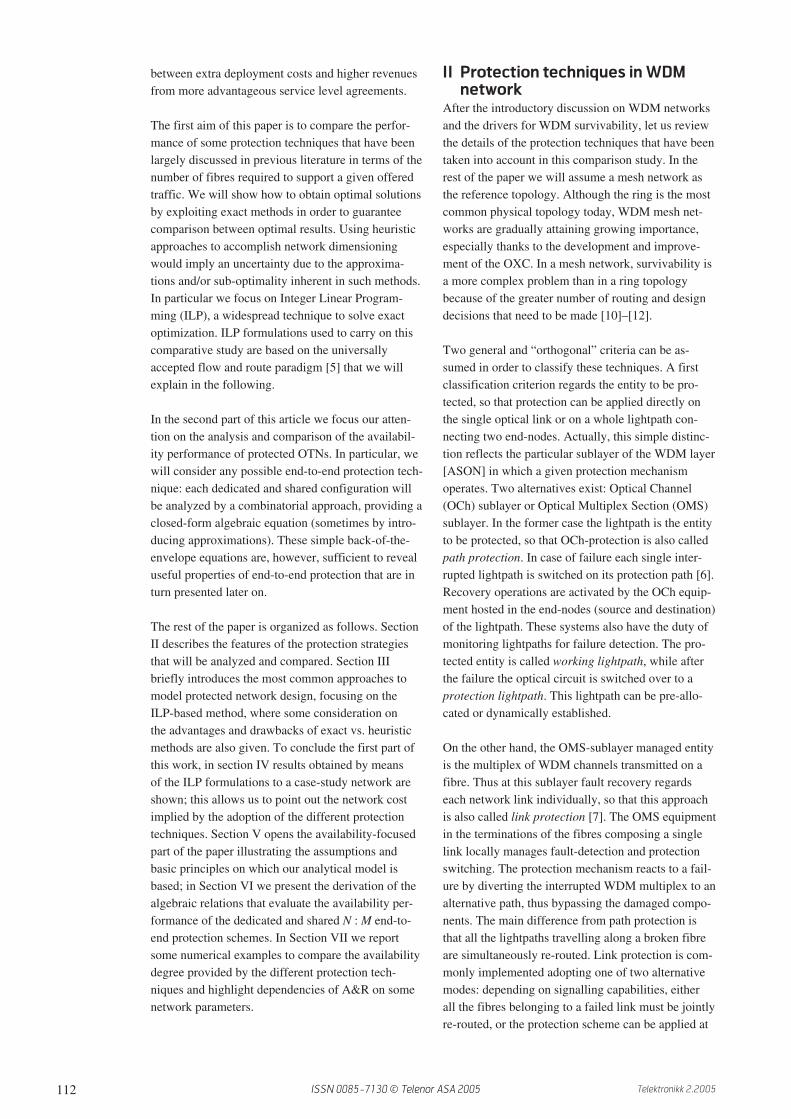
115Telektronikk 2.2005
route, by-passing the link to be protected. This can bedone reserving distinct backup capacity for each link(Dedicated Link Protection, DLP). Clearly, in orderto avoid an excessive waste of spare fibre capacity, ashared strategy is preferable, also considering that asingle failure may not affect more than one protectedentity (link) (Shared Link Protection, SLP). In thislatter case of SLP we will consider the two differentprotection approaches represented in Figure 5: pro-tection is guaranteed altogether for the whole fibre(SLP-F), or independently for each channel supportedby the fibre (SLP-C). This latter strategy (applied ina shared scenario) is expected to provide a more effi-cient utilization of spare resources, while it implies amore complex switching architecture to process fail-ures and route each channel separately at terminationnodes. This approach to reduce resource over-provi-sioning can be effectively implemented thanks to thenew capabilities provided by (G-)MPLS protocol.
III Fibre number estimationSolving the routing and wavelength assignment prob-lem in WDM networks has been proven to be an NP-hard problem [16]. Our objective involves the intro-duction of other two terms of complexity in the prob-lem: the models of protection techniques and theevaluation of the minimum number of fibres on eachlink to support a given traffic matrix. So the Routingand Wavelength Assignment (RWA) problem scalesto a more computational intensive Routing, Fibre andWavelength Assignment (RFWA) problem with pro-tection objectives. In order to solve the problem in areasonable computational time, in some cases wehave introduced some simplifications. These approxi-mations will not affect the validity of the comparisonbetween the different protection techniques underanalysis [11]. According to many studies that show
the marginal effect wavelength converters have onthe global amount of required transmission resources,we have decided to solve the case of networks withall nodes equipped with wavelength converters; thesenetworks are usually referred to as Virtual Wave-length Path (VWP) networks. This assumption allowsus to neglect the problem of wavelength assignment(wavelength continuity constraint), keeping the otherconstraints unchanged [5].
Of course, ILP represents a flexible mathematicaltool to model graph problems, such as those arisingfrom network routing and design when protectionrequirements are introduced. The application of LPto solve the design problem in optical networks is amature problem and a very rich literature exists onthis topic. The basic analysis has regarded the single-fibre case, in which the RWA problem has been stud-ied [11], [17]. In the multifibre scenario, the problemscales to the more complex RFWA problem: formula-tions to model and solve it can be found in [5], [10],[18]–[20]. All of these studies are based on two tradi-tional approaches: the flow formulation and the routeformulation. In the former the basic variables are theflows on each link relative to each source-destinationnode pair; in the latter the basic variables are thepaths connecting each source-destination pair.
ILP models to solve the RFWA problem are charac-terized by a well-defined set of constraints:
• solenoidality constraint;• capacity constraint;• integrality constraint.
First of all, the network flow problem requires a basicconstraint to guarantee that the traffic offered by asource node reaches its destination node. The so-
Figure 5 Link protection in a mesh network. When a link fails: (a) all the fibres crossing a link are rerouted ona common protection route, or (b) each channel is re-routed independently on different paths
working channel
link L fiber recovery path
Link L
working channel
link L fiber recovery path
Link L
(a) (b)
ISSN 0085-7130 © Telenor ASA 2005

116 Telektronikk 2.2005
called solenoidality constraint sets the flow conserva-tion condition; in other words, for each node and foreach connection request in the network, this conditionstates that the total flow leaving a node must be equalto the total flow incident on that node. This equationis slightly modified in the source (destination) node,where the outgoing (incoming) flow must be equal tothe required traffic.
Secondarily, the capacity constraint allows us todimension the physical network capacity. In order toensure a feasible resource allocation, it ensures thaton each link the sum of flows generated by all thenodes is smaller than the product of the number offibres by the number of wavelengths per fibre (i.e. thecapacity of the link expressed in terms of λ-channel).
Let us observe that, in the following comparison,only VWP networks have been investigated, whereone has only to deal with capacities, reducing the for-malization of the RFWA problem to the capacitatednetwork design problem [21]. When the nodes haveno wavelength conversion capabilities, every pathand protection structure becomes coloured, so thatthe problem has to also consider the wavelength con-straint needed to impose the same wavelength along apath. Therefore, the number of variables is multipliedby a factor |W|, when W is the set of available wave-lengths per fibre. In today’s WDM transmission sys-tems, realistic values of W are in the order of tens ofλ-channel (typical values are 20, 40, 64, 128 or 160).This makes the ILP approach even for small networksinfeasible and one has to rely on heuristics with lowercomplexity. Anyway our assumption of VWP net-work does not affect the objective of the proposedcomparison: different studies have highlighted themarginal role of wavelength conversion under statictraffic showing that in this case the two scenarios leadto very similar results. We can thus argue that theefficiency of the different protection strategies interms of required additional resources is not signifi-cantly affected by this assumption.
The integrality constraint has to be applied on flow(or route) and capacity variables. Actually, these twogroups of variables play completely different roles.Flow variables are related to the routing and multi-commodity flow problems and in these fields goodresults have been obtained by relaxing the integralityconstraints. It has been proven that for a single flowunit the previous constraint is superfluous, while, inthe generic n-connection case, techniques such asrandomized rounding based on LP relaxations haveshown some merits. On the other hand, the introduc-tion of the capacity variables implies that RFWAscales from a multicommodity flow problem to amore complex localization problem. The application
of a relaxation on these last variables does not oftenallow us to obtain a significantly lower bound.
Beside these basic conditions, additional constraintsmust be introduced in the formulations to model thedifferent protection techniques. Actually, this addi-tional set of constraints can be imposed in differentways with respect to the choice of flow or route vari-ables and to the detail in the description of the prob-lem (e.g. taking into account further circumstancessuch as node failures, partial wavelength conversion,cost function typology would require a differentstructure of the ILP formulation). In any case it ispossible to identify some common conditions to besatisfied. As far as the DPP (Dedicated Path Protec-tion) case is concerned, the main constraint stemsfrom the link disjointness condition: no more thanone lightpath associated to a connection request cancoexist in the same link (or more generally in thesame SRLG) [5], [10]. This check could be avoidedonly if we exploit as basic variable a diverse pathrouted pair, composed by a link-disjoint couple of aworking and a spare connection.
In the shared case a (pre-determined) protection pathis set up only if the corresponding working path failsdue to a network failure that occurs in any location.To handle such a mechanism in mathematical pro-gramming we have to introduce new indicator vari-ables that imply a large increase in the number ofvariables. More generally, the huge complexity in-volved with shared mesh protection exact models isdue to the following control: an optical channel canbe shared between several spare lightpaths, only iftheir associated working lightpaths are link-disjoint.In other words, if some working lightpaths are routedon a common link, their corresponding spare light-paths cannot share an optical channel. When this con-dition is fulfilled then if a link fails, it will always bepossible to reroute traffic on spare paths because thetwo connections will be utilising different channels.
In order to deal with the complex SPP management,the set of basic variables and constraints of dedicatedcase must be extended to store such kind of informa-tion: the working lightpath associated to a given con-nection crosses the link i and the associated sparelightpath crosses link j. The increase in complexitydue to the collection of this network knowledgemakes the ILP infeasible also in very small networks.Our optimizations have failed in finding optimalsolution starting from simple low-connected six-nodetopologies [20]. So an approximate route-basedapproach has been carried out, reducing the field ofadmissible paths. Anyway, a large body of previousstudies have confirmed that approximate solutionsare sufficiently close to optimum solutions.
ISSN 0085-7130 © Telenor ASA 2005

117Telektronikk 2.2005
The link protection has been subject to several mod-elling approaches, too [6], [15]. To the basic con-straints in this case we have added a new conditionthat must be applied to each single link: all the flowson a link need an alternative and link-disjoint path toreach the opposite end-node. A route-based approachwill pre-compute all (or just a subset of) the admissi-ble paths that circumvent a given link; in a flow-based case, we could impose additional solenoidalityconstraints on the end-nodes of each link to rerouteall the traffic flowing on the link (paying attention toreroute the traffic on the same network excluding thelink in object). The basic variable that models theentity to be re-routed (fibre or channel) will be differ-ent in the SLP-F and the SLP-C scenario.
IV Comparison on a case-studynetwork
After having presented the formulation for each pro-tection strategy, we compare now their performance.We have set as objective function the number offibres needed to support a given static traffic. Thiscoarse cost function has some merits: while minimiz-ing the fibre number, the objective function includesalso the cost of transmission equipment associated toeach fibre and tries to minimize the global amount ofswitching fibre port in the network. Clearly we arereferring to a simplified estimation with respect tothe actual amount of network resources: on the otherhand, a more complex description of network costwould increase the number of variables and con-straints, leading to computational infeasibility.
We present and discuss the results obtained by per-forming dimensioning on a case-study network, the(United States) National Science Foundation Network(NSFNET) that includes 14 nodes and 22 links. Itsphysical topology is shown in Figure 6; the offeredtraffic matrix (360 connection requests distributedon 108 node couples) is taken from Ref. [10].
The mathematical details of ILP formulations ex-ploited to obtain the following results can be foundin [19] for the unprotected case, in [20] for SPP andin [22] for SLP and DPP.
All the obtained results are the optimum of the prob-lem, except for the shared protection cases, whichanyway are proven to be close to the optimal ones.The computation time spreads from a few secondsto a maximum exceeding one day.
Figure 7 shows the total network fibre requirementsM associated to each protection strategy. The mostexpensive technique is the link protection in the dedi-cated case; there is no advantage from a backup-
capacity planning point of view in reserving the pro-tection resources separately to protect single failureevents. The positive effect on survivability of thislarge capacity redundancy emerges when multiplefailures occur. DPP returns a more efficient resultthan dedicated link protection (DLP), but it stillrequires more resources than shared strategies: bothshared path protection (SPP) and shared link protec-tion (SLP) show a better utilization of fibres; in par-ticular, the increase in fibre number with respect tounprotected case is always lower than 100 %.
Table II numerically reports the additional amount ofphysical capacity needed to support the different pro-tection techniques. We express the percentage extracost with respect to the unprotected case (un) bydefining the parameter Addpt for each protection tech-nique (pt = {DLP, DPP, SLP, SPP}):
Addpt =
(Mpt
Mun − 1
)· 100
Figure 6 NSFNET network physical topology
Figure 7 Total fibre number on NSFNET exploiting different protectiontechniques
Seattle WA
Salt Lake
City UT
Palo
Alto CA
San
Diego CA
Boulder COLincoln Champaign
Housten TX
Atlanta
Pittsburgh College Pk.
Princeton
Ithaca
Ann Arbor
7
10
4
12
5
18
13
4 75
5
2
2
12
5
5
4
127
9
8
0
200
400
600
800
1000
1200
1400
1600
0 5 10 15 20 25 30 35
DLP
DPP
SLP
SPP
Unprotected
Number of wavelengths, W
To
tal
fib
er
nu
mb
er,
M
ISSN 0085-7130 © Telenor ASA 2005
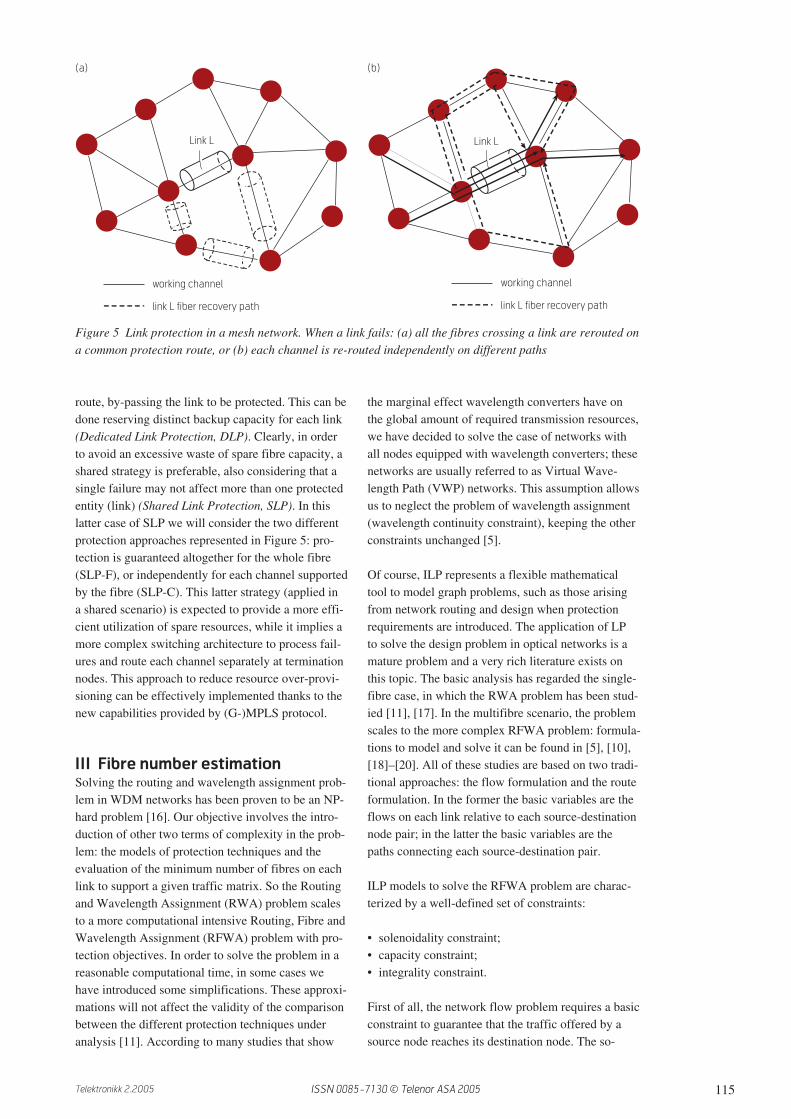
118 Telektronikk 2.2005
Considering any specific protection strategy, theadditional term of capacity shows a small variationfor all the values of W (number of wavelengths perfibre) that we have analyzed. Only the SLP-F caseseems to require a larger number of fibres for increas-ing values of W.
Figure 8, comparing the two protection techniquesSLP-C and SLP-F, shows that for a small number ofwavelengths there is no significant difference. How-ever, for fibres supporting a larger number of wave-lengths individually rerouting the single channels ofthe failed link appears to be more efficient. This gainon the number of fibres is paid by a more complexmanagement of the switching activity in the nodes.By increasing the complexity of the switching equip-ment, it can be verified that link protection is able toachieve the same performance as path protection.
V Assumptions and fundamentalsof the WDM-network availabilitymodel
The following A&R analysis is developed accordingto the following classical scheme: a) system identifi-cation and decomposition in functional elements; b)
characterization of each element in terms of its A&Rparameters; c) development of an A&R mathematicalmodel taking into account the relations among theelements within each subsystem and among the sub-systems within the system; d) A&R evaluation ofeach subsystem and of the whole system.
Since this paper will provide a comparison of differ-ent end-to-end protection mechanisms, the systemthat we are going to study for each case of protectionis the set of optical connections that may be involvedby common protection actions. We call this set ofconnections a protection group (PG). We will seethat, according to their various implementations, theprotection mechanisms can create interdependencybetween connections that have the same source anddestination (M : N case) or even connections amongdifferent couples of nodes of a network (mesh shared-protection). We will assume that routing and wave-length assignment have already been solved for theworking and protection lightpaths of all the connec-tions of the PG under study. This means that a WDMchannel has been reserved and is in use for everyWDM link of the network crossed by a WorkingLightpath (WL) of the PG. On the other hand, aWDM channel has been assigned for every WDMlink of the network on which a Protection Lightpath(PL) of the PG will be routed in case of failure.
Each connection of the PG is a subsystem of ourmodel. The functional elements should comprise allthe transmission and switching equipment crossed byeach lightpath. In this work we have, however, con-sidered ideal WDM switching devices, i.e. perfectlyreliable and free from any kind of failure (assumptionnot far from reality, according to Ref. [23]). Thisideal-behaviour assumption extends also to anydevice providing switching of the optical signals of aconnection from working to protection paths in caseof failure. Thus only WDM channels have to be takeninto account as functional blocks. A WDM channelis part of a WDM link, composed of the fibre cableinstalled between two adjacent nodes and equippedby a set of line devices (e.g. optical amplifiers). TheA&R parameters of a WDM channel can be obtainedby suitably combining those of the line devices plusthose of other possible devices such as transponders,transmitters, receivers, WDM multi-demultiplexers,etc. Such parameters are commonly specified bytechnology vendors. The details of the reliabilitydescription of a WDM channel (see for example Ref.[24]) are not of interest in this paper and will be omit-ted. We shall only say that the model is based on theusual approximation of considering a constant rate offailure z(t) = η, corresponding to a negative exponen-tial reliability function R(t) = e-ηt. According to suchan approximation, the Mean Time To Failure (MTTF)
W AddDLP AddDPP AddSLP-F AddSPP
2 327 % 162 % 52 % 48 %
4 327 % 160 % 58 % 50 %
8 330 % 158 % 65 % 52 %
16 330 % 145 % 82 % 50 %
32 343 % 116 % 95 % 56 %
Table II Percentage extra cost Addpt with respect tounprotected case for different protection techniques
0
100
200
300
400
500
600
0 5 10 15 20 25 30 35
SLP-F
SLP-C
Number of wavelengths, W
To
tal
fib
er
nu
mb
er,
M
Figure 8 Total fibre number on NSFNET with different granularity ofrerouted entities with shared link protection
ISSN 0085-7130 © Telenor ASA 2005
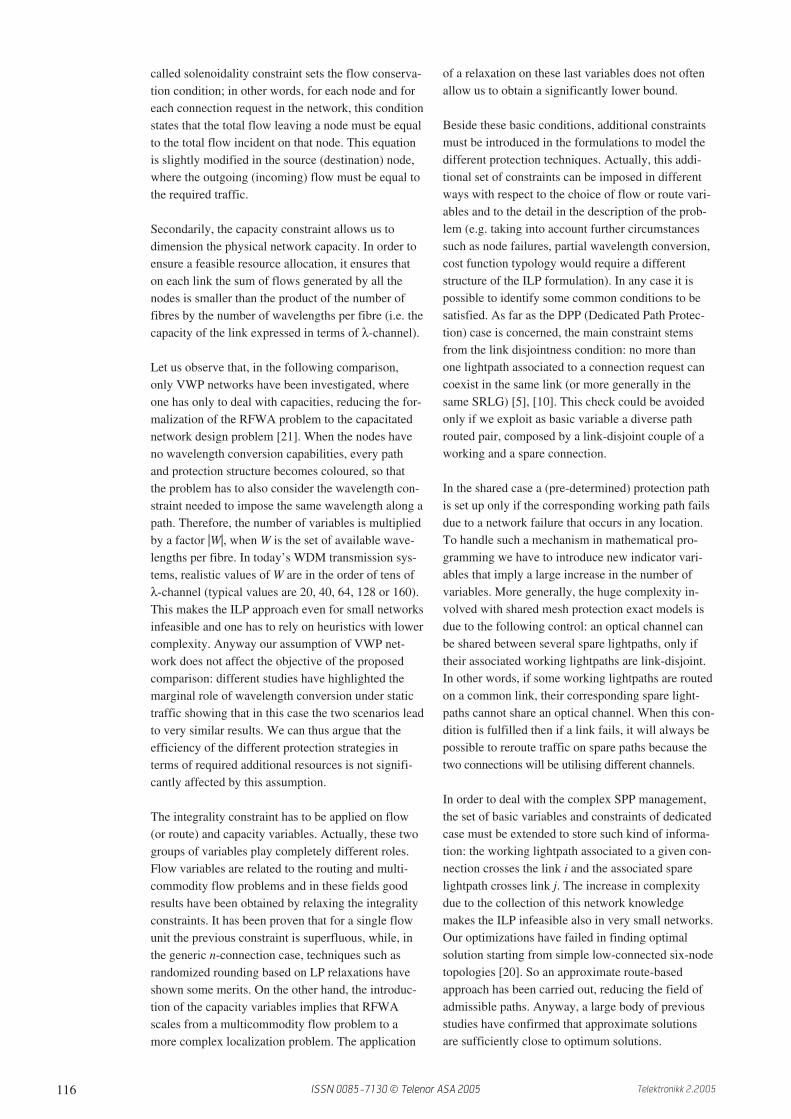
119Telektronikk 2.2005
of a WDM channel is independent of the components’age. Moreover, the WDM channels of a given opticalconnection are mutually failure-independent[25]–[27]. This assumption allows us to exploit thetheory of Lee on the analysis of switched networks[28] for all the M : N cases. The same cannot beapplied, instead, to the mesh shared protection case,as explained later on.
WDM links can be realistically considered repairablesystems: we thus assume the MTTF of a WDM chan-nel to be equal to its Mean Time Between Failures(MTBF); thus: MTBF = 1 / η. The Mean Time ToRepair (MTTR) of a WDM channel is also assumedto be constant in time. Eventually, for the purpose ofthis paper, we will assume each functional element ofour system (i.e. each WDM channel assigned to anylightpath of the PG) characterized by a known aver-age steady-state availability A = MTBF / (MTBF +MTTR) or by a known MTTF (the mean value of thereliability distribution).
All the components included in our model have beencharacterized in terms of their intrinsic availability.Externally-provoked failures are not considered4).In the examples reported in the following we willassume WDM channels assigned to PLs to have thesame A&R parameters as those assigned to WLs. Itshould be considered that a common routing methodis to route the WL on the first shortest path betweensource and destination and the PL on the second link-disjoint shortest path: the total A&R of the standbypath can be even worse than that of the primary path,the former usually being longer than the latter.Finally, let us specify that in this work we are notconsidering for simplicity the presence of disjointlinks belonging to the same shared risk link group(e.g. passing through the same conduit), nor protec-tion or restoration errors.
VI Availability of WDM path-protection schemes
In this section, we provide algebraic equations toevaluate the availability of the single optical connec-tions (subsystems) and of the entire PG (system). Wewill start from the simple dedicated 1 : 1 schemes,then we will increase first the number of workinglightpaths in the PG (1 : N) and then the number ofspare lightpaths (M : N). We will conclude with themesh shared-cases for which we introduce a simpleapproximation that has been shown to provide verygood results. All these schemes may be of practicalinterest in WDM network planning. It should be
noted however that due to the fundamental require-ment of path-protection (see Section I), at least all theWLs of a PG are link-disjoint. The increase of thenumber of mutually link-disjointness constraints inthe same PG makes the most complex schemes appli-cable only in extremely highly-connected networktopologies.
The following notation will be used, also in the fig-ures. Events, negated events and availability are iden-tified by E, E
–and A, respectively. These symbols
always appear with a subscript, the first letter ofwhich indicates what the symbol refers to: the wholePG system (s), a connection (k), a working (w) or aprotection (p) lightpath, a working (λ) or a spare (π)WDM channel. Except for the whole PG, a secondletter of the subscript identifies the particular elementin the considered system: e.g. Aw1 is the availabilityof working lightpath number 1. Each connection ob-viously corresponds to one and only one WL. There-fore a connection always has the same identifier of itsWL. The same does not apply to PLs when they areshared.
The equations are obtained by a combinatorialmethod [29], enumerating all the favourable casesand summing their probabilities. The well-known for-mulas of the availability of parallel and series sys-tems [30] are often applied. For instance, a WL wi isa series of WDM channels. Thus its availability is theproduct of the availability of all the elements λj of theset Λwi οf WDM channels assigned to it
Awi =
∑
∀λi∈Λwi
Aλj
4) Statistically modelling external failure agents is generally difficult: often, intrinsic availability only appears in system specifications.
λ1
protection lightpath
working lightpath
de
sti
na
tio
n, d
w1
p1
λ2
λ3
π1
π2
π3
so
urc
e, s
Figure 9 Protection group of 1 : 1 dedicatedprotection
ISSN 0085-7130 © Telenor ASA 2005
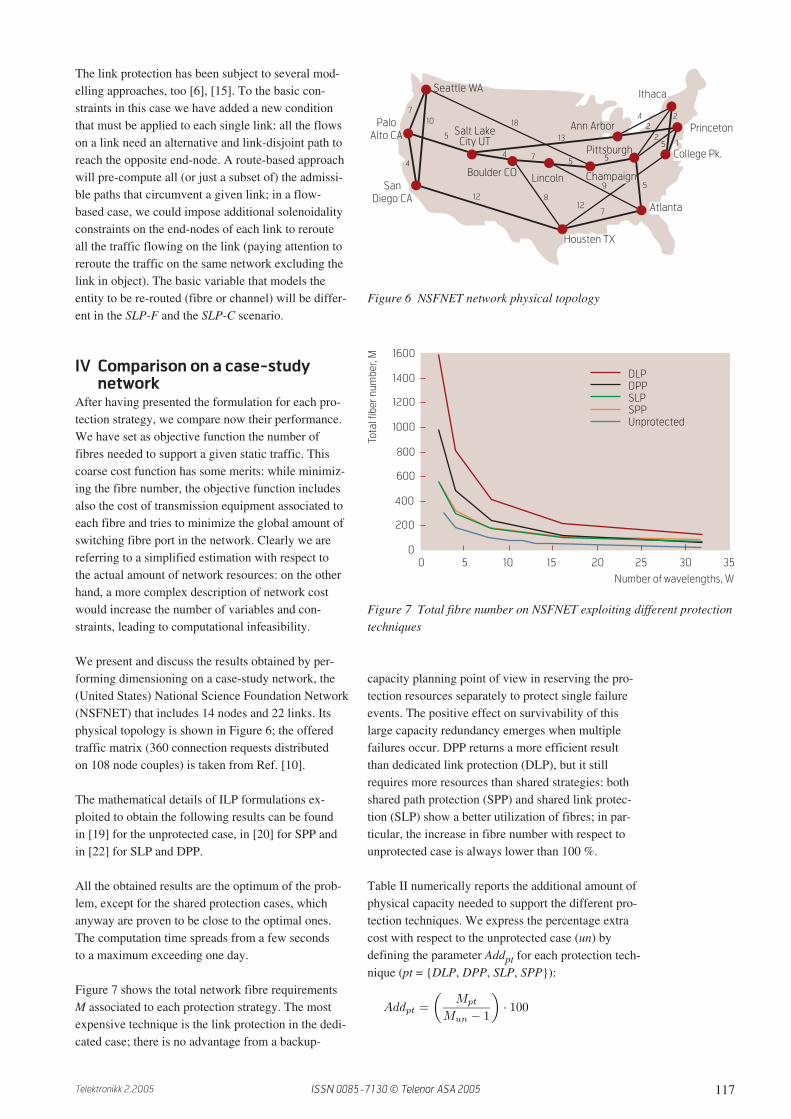
120 Telektronikk 2.2005
A 1 : 1 dedicated protection
In the 1 : 1 technique (Figure 9) the PG is simplycomposed of one connection (connection k1), whichis coincident with the entire system and comprises aworking (w1) and a link-disjoint protection lightpath(p1). The backup path, which is used when a failureoccurs on the working lightpath, is in this case dedi-cated to one single connection.
The system availability is given by the union of twodisjoint events: the WL is available (Ew1); the WL isnot available , but the PL is available and canbe used (Ep1)
The connection (and PG) availability is given by
As = Ak1 = Aw1 + Ap1 – Aw1Ap1 (1)
B 1 : N protection
The PG is composed of N connections with the samesource and destination, sharing a single PL (Figure 10).
We can similarly extend the 1 : 1 case to the generalcase of N connections (N WLs plus one PL, all mutu-ally link-disjoint). The system availability is ex-pressed by:
C M : 1 protection
In this scheme the PG comprises one single connec-tion k1 (Figure 11). Its WL w1 is protected by multi-ple link-disjoint PLs p1 … pM. pi is used when w1and all the PLs from p1 to p ( i – 1) are unavailable.Up to M failures can be recovered.
Eq. (2) expresses system availability in the generalM : 1 case.
(2)
D M : N protection
The most general path-protection configurationinvolving connections between the same end nodes isobtained by combining 1 : N and M : 1 in the M : Ncase. Unfortunately, a general equation for the M : Navailability cannot be written in a closed form, sinceits algebraic form changes with M and N.
E Mesh shared-protection
Let us start with the sample PG of Figure 12, com-posed of only two connections: the 2 × (1 : 1) case.This simple layout will help understand both theavailability evaluation mechanism and the approxi-mation that we are going to introduce to make thisevaluation feasible under more complex scenarios.
The two WLs w1 and w2 are protected by two PLs(p1 and p2) that share the WDM channel π 5. Thesystem availability is the probability that both con-nections are routed successfully and is obtained in
P{Es} = P
⎧⎨⎩
N⋂j=1
Ewj
N⋃h=1
⎛⎝Ewh ∩ Ep1 ∩
N⋂j=1
Ew(j �=h)
⎞⎠
⎫⎬⎭
As = (1 − NAp1)
N∏j=1
Awj +
N∑h=1
⎡⎣Ap1
N∏j=1
Aw(j �=h)
⎤⎦
P{Es} = P
⎧⎨⎩Ew1 ∪
M⋃h=1
⎡⎣Ew1 ∩ Eph
h−1⋂j=1
Epj
⎤⎦
⎫⎬⎭
(Ew1)
P{Es} = P{Ek1} = P{Ew1 ∪ (Ew1 ∩ Ep1)}
Figure 10 Protection group of 1 : N protection
wN
p1
s d
w1
p1
s d
w1
pN
Figure 11 Protection group of M : 1 protection
w1
p1π1
π2
π3
π4
π5
w2
p2
Figure 12 PG of the 2 × (1 : 1) mesh shared-protection
ISSN 0085-7130 © Telenor ASA 2005

121Telektronikk 2.2005
Eq. (3) and Eq. (4) by the union of three disjointevents.
(3)
where, keeping in mind that Ep2 = Eπ 2 ∩ Eπ 5 ∩ Eπ 4(Ap2 = Aπ1
. Aπ 5. Aπ 3) and Ep1 = Eπ 1 ∩ Eπ 5 ∩ Eπ 3
(Ap1 = Aπ2. Aπ 5
. Aπ 4), we set
Thus
As = Aw1Aw2 + Aw1(1 – Aw2)Ap2 –(1 – Aw1)Aw2Ap1 (4)
To evaluate the availability of a single connection, wehave to distinguish different double-link failure sce-narios. For instance, even if lightpath w2 and WDMchannel π 2 fail, connection k1 can be routed success-fully. So the first subsystem (protected connectionk1) is characterized by the following availability:
where
Thus
Ak1 = Aw1 + (1 – Aw1)Ap1Aw2 + (1 – Aw1)Ap1(1 – Aw2)(1 – Aπ 2) + (1 – Aw1)Ap1(1 – Aw2)Aπ 2(1 – Aπ 4) (5)
The need to consider all the possible multiple-failurecombinations makes the problem intractable forlarger PGs. We introduce an approximation byneglecting multiple failure scenarios. This is equiva-lent to considering only terms in which (1 – A)appears at the first order, neglecting higher-orderterms. It can be proven that the second order termsare always absent even without the approximation,except when the spare path is totally shared (but thiscase coincides with the 1 : N case). In the next sectionwe will show by numerical examples that the approx-imated formula converges to the real availabilityvalues for highly available components (rare-eventapproximation). The approximated availability ofconnection k1 is calculated in Eq. (6) and Eq. (7).
(6)
(7)
We extend now our analysis to a PG comprising them protected working connections whose protectionlightpaths share some optical channels (m × (1 : 1)scheme, Figure 13).
The system availability formulas Eq. (8) and Eq. (9)are obtained neglecting multiple-failure cases.
(8)
(9)
VII Availability numerical examplesIn this section we analyze the protection techniquesthrough numerical examples. We assume that eachworking lightpath wi is composed of a single hop(channel) with availability Awi = 1 – U. Each protec-tion lightpath px has the length Lpx = 3, being the avail-
P{Es} = P{(Ew1 ∩ Ew2) ∪ Ea ∪ Eb}
Ea = Ew1 ∩ Ew2 ∩ Ep2
Ea = Ew1 ∩ Ew2 ∩ Ep2
P{Ek1} = P{Ew1 ∪ Eα ∪ Eβ ∩ Eγ}
Eα = Ew1 ∩ Ep1 ∩ Ew2
Eβ = Ew1 ∩ Ep1 ∩ Ew2 ∩ Eπ2
Eγ = Ew1 ∩ Ep1 ∩ Ew2 ∩ Eπ2 ∩ Eπ4
P{Ek1} ≈ P{Ew1 ∪
[Ew1 ∩ Ep1 ∩ Ew2
]}
Ak1 ≈ Aw1 + (1 − Aw1)Ap1Aw2
P{Es} ≈ P
⎧⎨⎩
m⋂j=1
Ewj
m⋃h=1
[Ewh ∩ Eph3
m⋂k=1
Ew(k �=h)
]⎫⎬⎭
As ≈
m∏
j=1
Awj +
m∑
h=1
(1 − Awh)Aph
m∏
k=1
Aw(k �=h)
p1
w2
p2
w1
p3w3 pm
wm
Figure 13 PG of the m × (1:1) mesh shared-protection
ISSN 0085-7130 © Telenor ASA 2005

122 Telektronikk 2.2005
ability of each of its 3 WDM channels Awj = 1 – U.The total spare path availability is Apx = (1 – U)3.The reported numerical values refer to the availabilityof a single protected connection.
A M : N protection
For all the results in this section: U = 10-4. The con-nection unavailability values of 1 : N are plotted inFigure 14 as a function of N. The plot shows thatunavailability grows for increasing values of N witha linear slope of about 10-8 per ∆N = 1.
Table III refers to M : 1 protection: unavailabilitydecrease of orders of magnitude by adding protectionlightpaths, since a higher number of connection fail-ures can be recovered.
We can conclude that availability in M : N protectionis primarily determined by M, corresponding to thenumber of simultaneously recoverable failures. Thenumber N of working paths that share the backuppaths has instead a marginal effect compared to M.For example, from Table III and from Figure 14 wesee that 2 : 1 unavailability is 9 × 10-12 withM / N = 2, while in the 3 : 4 case unavailability is
1.2 × 10⁻¹⁴ with M / N = 0.75. Actually, 3 : 4provides protection against any three link failures,achieving a higher level of availability.
B Mesh shared-protection
In Sec. VI-E we have obtained the single connectionavailability using either the exact Eq. (5) or theapproximated Eq. (7). Table IV shows the accuracyof our approximations considering the network ofFigure 12. In the first row (U = 0.1) unavailability isselected on purpose with values unrealistic for opticalnetworks. We can observe that even in these extremeconditions the percentage of error of the approxi-mated result is quite small, while it is almost negligi-ble with realistic unavailability (U = 10-4).
The values in Figure 15 refer to the general m × (1 : 1)protection. The graph displays the unavailability ofa generic connection ki. We consider the two caseswhen its spare path has length Lpi = 5 and Lpi = 7,respectively. The number mki of connections sharingbackup channels with p1 varies from 2 to 6. Asalready observed for 1 : N (single fault recovery),Figure 15 shows a linear increase of connectionunavailability, associated to the increase of mki. Interms of availability performance, increasing thelength Lpi of the protection lightpath by x hops isequivalent to increasing the number of sharing con-nections mki by x.
C Final comparison
In the previous sections we have separately studiedthe different protection approaches. Now we canjointly compare the performances of the variousapproaches (Figure 16).
∼=
∼=
Protection technique Unavailability Uk1 = 1 – Ak1
2 : 1 8.99825 x 10⁻¹²
3 : 1 2.77556 x 10⁻¹⁵
4 : 1 1.11022 x 10⁻¹⁶
TABLE III Connection unavailability in M : 1protection
U Uk1 exact Uk1 approx % error
10-1 3.30049 × 10⁻² 3.439 × 10⁻² 4.2
10-4 3.9992 × 10⁻⁸ 3.9994 × 10⁻⁴ 5 × 10⁻³
Table IV Unavailability of connection k1 in the pg ofFigure 12
3.0 10-8
4.0 10-8
5.0 10-8
6.0 10-8
7.0 10-8
8.0 10-8
9.0 10-8
1.0 10-7
1 2 3 4 5 6 7 8
1:N
Number of sharing connections, N
Co
nn
ec
tio
n u
na
va
ila
bil
ity
, U
k1
Figure 14 Connection unavailability of protection scheme 1:N
Figure 15 Connection unavailability of m × (1:1) mesh shared-protection
6.0 10-8
7.0 10-8
8.0 10-8
9.0 10-8
1.0 10-7
1.1 10-7
1.2 10
2 3 4 5 6
mki
x(1:1), Lp1
=5
mki
x(1:1), Lp1
=7
Number of sharing connections, mki
-7
Co
nn
ec
tio
n u
na
va
ila
bil
ity
, U
k1
ISSN 0085-7130 © Telenor ASA 2005

123Telektronikk 2.2005
As already explained, unavailability improves consid-erably when the protection scheme is able to recovermultiple failures: this behaviour is apparent in Figure16. Mesh shared-protection and 1 : N, recovering sin-gle failures, give similar unavailability results.
VIII ConclusionsIn this paper we have dealt with four protectionstrategies that are candidates to be the best choice forthe next-generation WDM network: path and linkprotection in both the dedicated and the shared case.After outlining the schemes and their technologicalrequirements, we have described the mathematicalformulations that model these protection techniques.Using a case-study network, we have compared theresource requirements of each scheme by exploitingILP. The shared protections (path or link) providevery good results, as they require about 50 % ofadded capacity with respect to the unprotected case.The link protection in dedicated configuration needsa huge backup-capacity increase (330 %), while dedi-cated path protection achieves more efficient results(150 %). Finally, we have shown that shared link pro-tection needs less capacity when failed channels arererouted individually.
In the second part of the paper, we provided formulasto evaluate connection availability under several pro-tection schemes. In treating shared protection wehave introduced an approximation that allows usto analyze complex topologies. The formulae havebeen used in a comparative analysis of the differentresilience mechanisms, leading us to the followinginteresting general finding: the number of simultane-ous failures a protection scheme can recover sets theorder of magnitude to the availability of its protectedconnections.
References1 Bigo, S. Transmission of 256 wavelength-division
and polarization-division-multiplexed channels at42.7 Gb/s (10.2 Tb/s capacity) over 3x100km ofTeraLight fibre. In: Proceedings OFC’02, 2,2002, FC5-1–FC5-3.
2 ITU. Network node interface (NNI) for the opticaltransport network (OTN). ITU-T InternationalCommunication Union, Feb 2001. (G.709/Y.1331, Amendment 1)
3 Goderis, D et al. Service level specificationsemantics and parameters. Internet Draft, draft-tequila-sls-01.txt, Tech. Rep., June 2001.
4 Fawaz, W, Daheb, B, Audouin, O, Du-Pond, M,Pujolle, G. Service level agreement and provi-sioning in optical networks. IEEE Communica-tions Magazine, 42 (1), 34–35, 2004.
5 Caenegem, B V, Parys, W V, Turck, F D,Deemester, P M. Dimensioning of survivableWDM networks. IEEE Journal on Selected Areasin Communications, 16 (7), 1146–1157, Sept1998.
6 Ramamurthy, S, Mukherjee, B. Survivable WDMMesh Networks, part. I - Protection. In: Proceed-ings, IEEE INFOCOM’99, 2, 1999, 744–751.
7 Stern, T E, Bala, K. Multiwavelength Optical Net-works: A Layered Approach. Reading, MA, Addi-son Wesley, 1999.
8 Strand, J, Chiu, A, Tkach, R. Issues for routing inthe optical layer. IEEE Communications Maga-zine, 39 (2), 2001.
9 Doverspike, R, Yates, J. Challenges for mpls inoptical network restoration. IEEE Communica-tions Magazine, 39 (2), 2001.
10 Miyao, Y, Saito, H. Optimal design and evalua-tion of survivable WDM transport networks.IEEE Journal on Selected Areas in Communica-tions, 16 (7), 1190–1198, Sept 1999.
11 Baroni, S, Bayvel, P, Gibbens, R J, Korotky, S K.Analysis and design of resilient multifibre wave-
10-6
10-8
2 4 6 8 10
Number of sharing connections, N
Co
nn
ec
tio
n u
na
va
ila
bil
ity
, U
k1
10-10
10-12
10-14
1:N
2:N
3:N
Nx(1:1), Lp1
=5
Nx(1:1), Lp1
=7
Figure 16 Connection-unavailability comparison of various protectionschemes
ISSN 0085-7130 © Telenor ASA 2005

124 Telektronikk 2.2005
length-routed optical transport networks. Journalof Lightwave Technology, 17 (5), 743–758, 1999.
12 Anand, V, Qiao, C. Static versus dynamic estab-lishment paths in WDM networks. Part i. In: Pro-ceedings ICC ‘00, 2000, 198–204.
13 Zang, H, Ou, C, Mukherjee, B. Path-protectionrouting and wavelength assignment (RWA) inWDM mesh networks under duct-layer con-straints. IEEE/ACM Transactions on Networking,11 (2), 248–258, 2003.
14 Xiong, Y, Xu, D, Qiao, C. Achieving fast andbandwidth-efficient shared-path protection. Jour-nal of Lightwave Technology, 21 (2), 2003.
15 Lumetta, S, Medard, M, Tseng, Y. Capacityversus robustness: A tradeoff for link restorationin mesh networks. Journal of Lightwave Technol-ogy, 18 (12), 2000.
16 Chamtlac, I, Ganz, A, Karmi, G. Lightpath com-munications: an approach to high-bandwidthoptical WAN’s. IEEE/ACM Transactions onNetworking, 40 (7), 1172–1182, 1992.
17 Ramaswami, R, Sivarajan, K N. Routing andwavelength assignment in all-optical networks.IEEE/ACM Transactions on Networking, 3 (5),489–500, 1995.
18 Banerjee, D, Mukherjee, B. Wavelength-routedoptical networks: linear formulation, resourcebudgeting tradeoffs and a reconfiguration study.IEEE/ACM Transactions on Networking, 8 (5),598–607, 2000.
19 Tornatore, M, Maier, G, Pattavina, A. WDMNetwork Optimization by ILP Based on SourceFormulation. Proceedings, IEEE INFOCOM ‘01,June 2002.
20 Concaro, A, Maier, G, Martinelli, M, Pattavina,A, Tornatore, M. QoS Provision in Optical Net-works by Shared Protection: An Exact Approach.In: Quality of service in multiservice IP Networks,ser. Lectures Notes on Computer Sciences, 2601.Springer, Feb. 2003, 419–432.
21 Bienstock, D, Gonluk, O. Computational experi-ence with a difficult mixed-integer multi-com-modity flow problem. Mathematical Program-ming, 68 (32), 213–237, 1995.
22 Tornatore, M. Modelli matematici di program-mazione lineare a numeri interi per l’ottimiz-zazione delle reti ottiche wdm. Politecnico diMilano, 2001. (Master’s thesis)
23 Jereb, L, Jakab, T, Unghvary, F. Availabilityanalysis of multi-layer optical networks. OpticalNetworks Magazine, March/April 2002.
24 Tornatore, M, Maier, G, Pattavina, A, Villa, M,Righetti, A, Clemente, R, Martinelli, M. Avail-ability optimization of static path-protected wdmnetworks. In: Proceedings, OFC 2003, Mar. 2003.
25 Antonopoulos, A, O’Reilly, J J, Lane, P. A frame-work for the availability assessment of sdh trans-port networks. Proceedings, Second IEEE Sym-posium on Computers and Communications,666–670, July 1997.
26 Inkret, R, Lackovic, M, Mikac, B. WDM networkavailability performance analysis for the COST266 case study topologies. In: Proceedings, Opti-cal Network Design & Modelling, Feb. 2003.
27 Clouqueur, M, Grover, W. Availability analysisof span-restorable mesh networks. IEEE Journalon Selected Areas in Communications, 20 (4),May 2002.
28 Lee, C Y. Analysis of switching networks. BellSystems Technical Journal, 34 (6), 1287– 1315,1955.
29 Mood, A M, Boes, D C, Graybill, F A. Introduc-tion to the Theory of Statistics, 3rd ed. New York,McGraw-Hill, 1974.
30 Lewis, E E. Introduction to Reliability Engineer-ing. New York, John Wiley, 1987.
ISSN 0085-7130 © Telenor ASA 2005

125Telektronikk 2.2005
Guido Maier received his Laurea degree in Electronic Engineering at Politecnico di Milano (Italy) in 1995
and his PhD degree in Telecommunication Engineering at the same university in 2000. He is researcher at
CoreCom, where he has the position of Head of the Optical Networking Laboratory. His main areas of inter-
est are optical network modelling, design and optimization, ASON/GMPLS architecture and WDM switching
systems. He has authored more than 30 papers in the area of Optical Networks published in international
journals and conference proceedings. He is currently involved in industrial and European research projects.
email: [email protected]
Massimo Tornatore received his Laurea degree in Telecommunications Engineering from Politecnico di
Milano in 2001. He is currently a PhD candidate in the Electronics and Information Department of Poli-
tecnico di Milano under the supervision of Prof. Pattavina. His research interests include Design, Protection
Strategies, Traffic Grooming in Optical WDM Networks and Group Communication Security.
email: [email protected]
Achille Pattavina received his DrEng degree in Electronic Engineering from La Sapienza University of Rome
(Italy) in 1977. He was with the same University until 1991 when he moved to Politecnico di Milano, Milan
(Italy), where he is now Full Professor. He has authored more than 100 papers in the area of Communica-
tions Networks published in leading international journals and conference proceedings. He has been author
of the book Switching Theory, Architectures and Performance in Broadband ATM Networks (John Wiley &
Sons). He has been Editor of Switching Architecture Performance of the IEEE Transactions on Communica-
tions since 1994 and Editor-in-Chief of the European Transactions on Telecommunications since 2001. He
is a Senior Member of the IEEE Communications Society. His current main research interests are in the area
of optical networks and switching theory.
email: [email protected]
ISSN 0085-7130 © Telenor ASA 2005

126 Telektronikk 2.2005
The advantages of packet switching are by and largeindisputable: packet based services are increasinglydominating in the network, the internet protocol (IP)has prevailed, and there is wide consensus that cir-cuits do not fit the bill for datacom. But given theinherent poor processing capabilities of optics andthe maturity of electrical IP routers, why bother withoptical packets? Optical packet switching (OPS) isnot about processing packets optically. An opticalpacket or optical burst comprises a series of IP pack-ets, typically 10–100, i.e. it is a sort of mega-packet.The characteristic of an optical packet switched oroptical burst switched (OBS) network is that contraryto electrical (IP) packet switched networks the opticalpackets in OPS/OBS remain in the optical domainthroughout the network, all the way between theingress and egress point. The label, on the other hand,is typically detected at each node and processed elec-tronically. This way, decisions about packet forward-ing are made for a bunch of packets rather than on apacket-to-packet basis, hence achieving considerablybetter efficiency and enabling higher throughput andoverall scalability compared with IP/MPLS. This isfurther enhanced by the fact that since the packetsremain in the optical domain the node is transparentto bit-rate and format and therefore scales transpar-ently with increasing interface bit-rate. Optical packetswitching combines the advantages of two worlds: itretains the high switching efficiency high throughputand scalability of optical technologies, and combinesthese with the granularity and flexibility of packetswitching. The price to pay is higher complexity – inany case when compared with optical circuit switch-ing. So the question is whether the gains OPS/OBSbrings outweigh the extra complexity and justifydevelopment costs.
Considerable research effort has been invested inoptical packet/burst switched networks in recentyears, yet it has remained by and large unclearwhether there is a realistic case for a paradigm shiftto OPS/OBS networks. One main concern has earlierbeen whether such solutions are technologically fea-
sible in the first place – the switching speed and syn-chronisation requirements some solutions impose arenot always easy to meet. For this reason OPS hasoften been regarded as an interesting topic of aca-demic value, however, of limited relevance for realapplications in the foreseeable future. The switchingof a series of packets – a burst – instead of individualIP packets, leads to relaxed requirements in terms ofboth switching speed and synchronisation and is amore feasible version. However, the technology thatactually put OPS/OBS back on the table as a possiblecandidate for a real implementation, is relatively new:namely the widely tunable laser. This is a laser mod-ule whose output wavelength can be tuned continu-ously and reproducibly over a wide spectrum (30 nm)using a software control and it has become commer-cially available in the past five years. The advent ofwidely tunable lasers has enabled an OBS node archi-tecture based on Array Waveguide Gratings (AWG)and all-optical Tunable Wavelength Converters(TWC) that can be realised today and that has beenfound to be both technologically feasible and rela-tively low-cost. This architecture has been employedwithin the European Research Project IST STOLASand studied both theoretically and experimentally [1].In STOLAS the OBS network is optically labelswitched with the label and the payload co-propagat-ing. As a result, the optical burst or packet resemblesa traditional packet the way we know it from IP sothat well-established IP/MPLS processes can beapplied here with little – if any – modification.
In this paper we will use the node architectureemployed in STOLAS to evaluate the feasibility andviability of OPS/OBS. The main question we wantto shed light onto is whether there is a case for aparadigm shift to OPS/OBS – and if so, when andhow. To this end we firstly attempt to quantify thegains that can be obtained by OBS using a theoreticalstudy combined with network simulations. We thenproceed to a direct techno-economic comparisonbetween the capital investment required to build anOBS network, contra the investment required in the
Why bother with optical packets? An evaluation of theviability of optical packet/burst switching
E V I Z O U G A N E L I , R A G N A R Ø . A N D R E A S S E N , B O N I N G F E N G , A S T R I D S O L E M ,
N O R V A L D S T O L , H E I D I K J Ø N S B E R G , A A S M U N D S U D B Ø , B J A R N E E . H E L V I K
A N D R O L F B . H A U G E N
Evi Zouganeli
is Senior
Research
Scientist at
Telenor R&D
Ragnar Ø.
Andreassen
is Research
Scientist at
Telenor R&D
Boning Feng is
Associate Pro-
fessor at Oslo
University
College (OUC)
Astrid Solem
is Research
Scientist at
Telenor R&D
Optical packet/burst switching (OPS/OBS) combines the high throughput and scalability of optical
technologies with the granularity and flexibility of packet switching. The question is whether the gains
OPS/OBS brings outweigh the extra complexity and justify development costs. In this paper we quantify
the gains that can be obtained by OPS/OBS using network simulations combined with a theoretical
analysis. We also carry out a direct techno-economic comparison between OBS, IP/MPLS and a
circuit switched optical network (OCS) in order to reveal the viability of optical packet/burst switching.
ISSN 0085-7130 © Telenor ASA 2005
127Telektronikk 2.2005
case of an IP/MPLS networkand an optical circuit switched(OCS) network of similar per-formance.
The STOLAS conceptThe STOLAS network is anoptically labeled burstswitched network where theoptical label is encoded orthog-onally to the payload. Hencethe label and payload signalscan be encoded in parallelindependently of each other.This is achieved e.g. by modu-lating the phase of the opticalcarrier (DPSK) or by modulat-ing the frequency of the opticalcarrier itself (FSK) at low speed (155 Mbit/s) in orderto encode the label, whereas the payload is intensitymodulated at a higher speed (10 Gbit/s) [1] [2]. IPpackets are assembled in optical bursts of 10–100packets at the edge of this network and are then for-warded to the destination node according to QoS andtraffic engineering rules, as schematically shown in
Figure 1. The signal remains in the optical domainthroughout its journey from the ingress to the egressnode and the wavelength in each link is a freeresource for the bursts to contend for, subject to classof service. The generic STOLAS node is shown inFigure 2. It comprises a label reading and processingpart, an all-optical label swapping part, and an optical
Heidi Kjønsberg
is Research
Scientist at the
Norwegian Com-
puting Center
Aasmund Sudbø
is Professor at
the University
of Oslo and UniK
Bjarne E. Helvik
is Professor at
the Norwegian
University of
Science and
Technology
Rolf B. Haugen
is in charge of
coordinating
external activities
at Telenor R&D Figure 2 Schematic diagram of the generic STOLAS node comprising wavelength division de-mulitplexers,Optical Label Swappers, an Array Waveguide Grating and multiplexers to the fibre outputs
Network control and management
Edge
router
Optical label
controlled router
λa
packets
packets
Core
router
Label
1
λ bλ
c
Label
2
Label3
λd
Label
4
Figure 1 An optically burst switched network uses optical label switching toforward optical bursts of packets to their destination node
D
E
M
U
X
Optical label swapper
AWG
Input 1
Input 2
Add
Add
Drop
Drop
Control
Fiber delay line
D
E
M
U
X
c
o
u
p
l
e
r
Optical label swapper
Optical label swapper
Optical label swapper
Optical label swapper
Optical label swapper
Optical label swapper
Optical label swapper
Optical label swapper
Optical label swapper
Optical label swapper
c
o
u
p
l
e
r
Output 1
Output 2
Optical label swapper
Norvald Stol is
Associate Pro-
fessor at the
Norwegian
University of
Science and
Technology
ISSN 0085-7130 © Telenor ASA 2005

128 Telektronikk 2.2005
cross-connecting/forwarding part. The way this nodeattains forwarding of bursts to the right output is asfollows. All fibre inputs – here depicted at the lefthand side of the node – use the same optical carrierwavelengths. These are de-multiplexed via a standardpassive optical WDM de-multiplexer and subse-quently each of these signals goes through a process-ing card that comprises an Optical Label Swapper(OLS). Here, a small part of the signal is tapped outsuch that the label is read and processed electroni-cally while the main part of the signal is delayed andremains in the optical domain. Label swapping takesplace all-optically using a tunable laser and a labelswapper arrangement that makes use of a non-lineareffect that is called cross-phase modulation andwhich here takes place in an integrated Mach-Zehn-der interferometer. At the output of the OLS, theburst is carried by a new wavelength and a new opti-cal label has been encoded on the FSK signal. Theoutput the burst is subsequently forwarded to,depends on this new carrier wavelength. Indeed, theArray Waveguide Grating is a passive componentthat acts as a “hardwired“ wavelength dependentswitch, where the hardwired connections depend onthe input the signal enters the AWG from and the sig-nal’s wavelength. Hence, the fibre output the burst isforwarded to depends on the wavelength that isassigned to it through the preceding optical labelswapper – which is then controlled by standard(G)MPLS processes. It should therefore be noted thatwhen this node architecture is implemented, thewavelength is not available as a label. The wave-length is in this configuration rather used to carry outthe cross-connection function in the node instead.
This node architecture makes use of the fast wave-length switching properties of tunable lasers (wave-length switching at 50 ns was realized in STOLAS)
and avoids large and complex switching matrices inorder to realize cross-connection functionality. AWGsare inherently cheap components and currently broad-ly used as passive WDM multiplexers/de-multiplex-ers in existing networks. One of the prime cost deter-mining factors of the node is the number of tunablewavelength converters comprising the optical labelswapper, which needs to be minimized. At the sametime, internal blocking at the node also needs to beminimized. The trade-offs involved in node designare discussed in [3].
Estimated OBS performance gainscompared with OCS
Analytical study
The increased flexibility of OPS/OBS in relation toOCS should lead to better network traffic transportefficiency. Two main contributions to such increasedefficiency will come from increased statisticalresource sharing (i.e. multiplexing gain) and finerupgrade granularity. We will briefly consider boththese effects in the following [4].
In optical circuit switching, packets share theresource that corresponds to a Label Switched Path(LSP). An LSP in this case may comprise one ormore optical circuits with the same source-destinationpair (optionally also class of service or other differen-tiation factors). In optical packet or burst switchingon the other hand, all packets in all LSPs share thelink resource on a given internal network link. As thelink resources are generally much larger than LSPresources, statistical resource sharing in the OPS/OBS case will be better than for OCS. For a givenquality requirement (i.e. in terms of packet loss ornetwork overload), an OPS/OBS based network can
Figure 3 A schematic of theOptical Label Swapper
FSK
demodulation
Label
processing
∆ t
tunable
laser
signal
in
delay
Label
write
new FSK label
Tunable wavelength
converter
Label
read
1:10 splitter
SOAs signal
out
IM
FSK λ
Eout
IM
FSK
ISSN 0085-7130 © Telenor ASA 2005
129Telektronikk 2.2005
therefore carry the same traffic with less dimensionedcapacity compared to an OCS-based network.
As end-to-end traffic increases, more wavelengthchannels need to be added to the network. In an OCSnetwork, the capacity of each LSP will need to beupgraded incrementally by a whole wavelength chan-nel to accommodate any traffic increase within thisLSP. In the case of OBS, on the other hand, incre-mental capacity increase can be made at the internallink level. The incremental increase relative to LSPcapacity will then be much smaller, as an internal linkcarries many LSPs. On average, this will give betterutilisation in the network, particularly in the casewhere end-to-end LSP demand is in the range of oneor very few optical channel capacities.
In the following we focus on a simple study of theseeffects, and attempt to quantify the OPS/OBS gainsthat may be expected under various circumstances. Inbrief, in the calculations we assume a simplified sym-metric case. We consider a symmetric µxµ torus1)
network where all sub-links have the same capacityserving the same number of traffic streams. A givennumber of continuously active identical and indepen-dent variable bit-streams are considered, where indi-vidual streams have known peak rates h and meanrates m. As a simple approximation to a variablebitrate stream, we consider an on/off source model.We calculate the probability for a single stream toexperience overload, and pose the requirement thatthis probability must be less than 10-6. We then cal-culate the resources required in order to meet thisrequirement in the case of an OPS and an OCS net-work for different types of sources.
In Figure 4 we show results for sources of differentsizes and a range of m/h values. The left panel shows
results when we consider sources of known peak-rates h relative to network link rate C, while the rightpanel shows the corresponding results if we assumewe know the relative mean rates of sources. In bothcases, we assume the network, source properties andquality requirement as given, and calculate on thisbasis the permissible loads and dimensioningrequired for the two different network technologies.The gain factor κ is given as the ratio between theOCS required resources and the OPS/OBS requiredresources.
In order to relate the figures to everyday life, we mayfor the left figure consider that traffic originate inxDSL-based networks of e.g. 10 Mbit/s maximumpeak rate. A C/h ratio of 105 would then correspondto link transmission rates of 1 Tbit/s in the network.This would typically be a hundred 10 Gbit/s chan-nels, i.e. one or two fibres. Our model predicts around20 % extra capacity for circuit switching in this case.If there are no efficient constraints in peak rates oforiginating traffic sources, the right figure is morerelevant. This may be the case if traffic originates incorporate networks, which may well have transmis-sion capacities comparable to transport networks. Ifwe for example then consider a backup application,generating a mean rate of 10 Mbit/s, a C/m ratio cor-responds to the same network capacities as in the pre-vious case, but results in an OCS increase factor oftwo (i.e. a 100 % increase) for the more burstysources. The gains decrease with decreasing networksize (number of nodes). For example, for a networkof 25 nodes the gains are reduced by an estimated12 % in relation to the values presented in Figure 4.
Granularity gains become significant in the case ofnetworks with a relatively low number of channelsper LSP. An example calculation is shown in Figure
1) A torus network is a regular grid network of µxµ nodes where node (i, µ) is connected to (i, 1) and node (1, i) is connected to (µ, i),for all i = 1 … µ.
Figure 4 Link capacity increase factor (κ) for OCS versus OPS as a function of overall link capacity C/h orC/m for m/h-values of 0.05, 0.2 and 0.4. The left panel shows results for C/h variations while the right panelshows results for C/m variations. In all calculation the quality requirement was P(overload) = 10-6 and thenetwork size was 81 nodes
LgC/h
3.5 4.0 4.5 5.0 5.5 6.0
LgC/h
1 .2
1 .6
2.0
2.4
k m/h = 0.05
m/h = 0.2
m/h = 0.4
4.25 4.5 4.75 5.0 5.25 5.5 5.75 6.0
1 .5
2.0
2.5
3.0
km/h = 0.05
m/h = 0.2
m/h = 0.4
ISSN 0085-7130 © Telenor ASA 2005
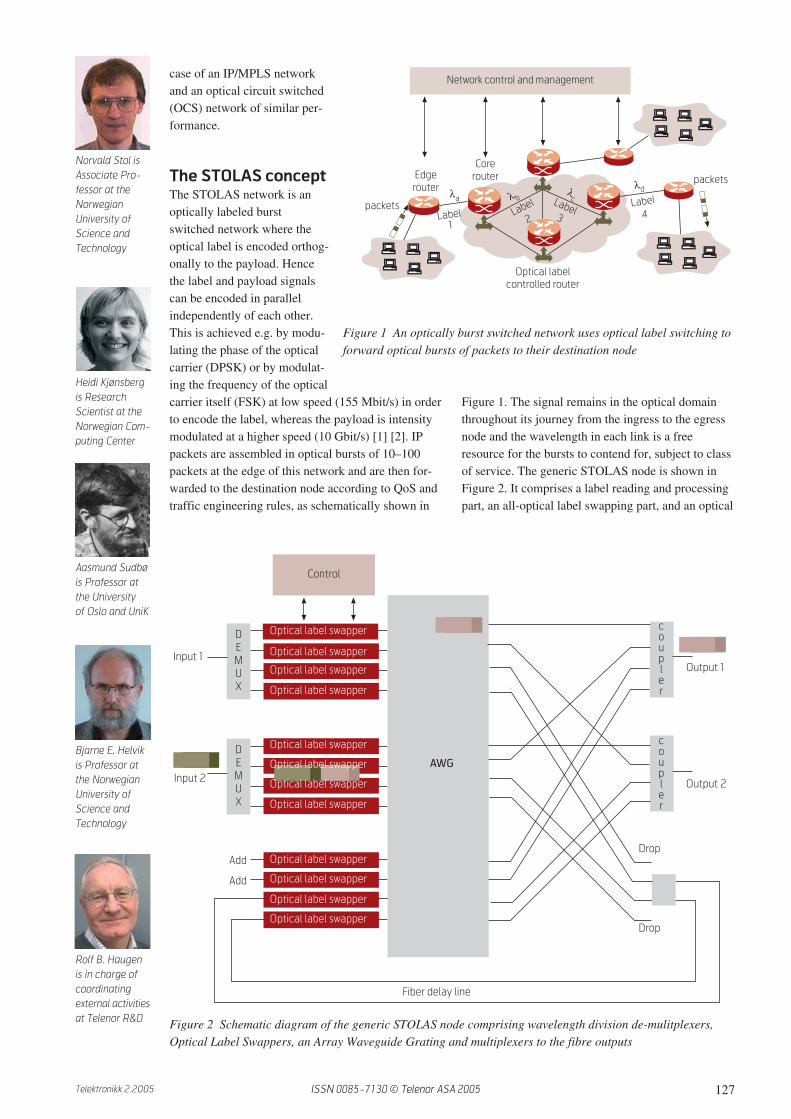
130 Telektronikk 2.2005
5 where in effect the end-to-end traffic is shown toincrease with smaller increments in the case of OBS.The OBS gain factor κ is depicted on the right handside of the figure where high values of κ may beobtained at certain upgrade instances. Note that thisis also an indication of the flexibility that can beobtained in case of failure or general cases of trafficengineering. Indeed, the OBS network can easieraccommodate unforeseen traffic changes sincestreams can be broken down at sub-wavelength leveland accommodated in different routes through thenetwork.
On the whole this simplified theoretical analysis haspointed out that multiplexing and granularity gainswith OBS are highly dependent upon traffic charac-teristics. Gains of significance are obtained first forrelatively large sources (high mean value m above2 Mbit/s) of high burstiness h/m > 5 and become moresignificant for larger networks (number of nodes).
Network simulations
Based on the insights that were gained by the analyti-cal study we have carried out detailed network simu-lations to quantify the gains that may be obtained byOBS. The analytical study pointed out the signifi-cance of the assumptions with regard to traffic char-acteristics. Therefore a lot of effort was invested inthe description of realistic traffic scenarios for thenear to medium future and the subsequent derivationof realistic traffic characteristics for our network sim-ulation studies [5][6]. The method for deriving a real-istic input traffic that corresponds to around year2009 is described in Appendix 1. In the sameappendix we describe the simulator details whereasin the following we focus on an outline of the mainassumptions and the obtained results.
In brief, we consider a mix of private and businessclients and traffic is calculated as originating from amix of nine application components for each of these
Figure 5 Granularity gains. End-to-end dimensioned sub-link capacities as a function of # of sources per link(left) and corresponding OCS versus OPS/OBS increase factor κ (right) for the source parameters h = 50Mbit/s and m/h = 0.05 for a medium sized network of 25 nodes
Figure 6 The 4 x 4 node grid network
market segments. Each of these application compo-nents is modelled using a parameterisation of threegeneric source types, namely voice, video and data.Finally, we use estimated service penetration valuesfor each of these applications in each market segmentas well as an evolution of these with time. The result-ing traffic is believed to be a good approximation ofrealistic traffic in a typical European region by year2009. The network we use in our simulations is a4 x 4 Manhattan Street network, or regular grid, asshown in Figure 6.
At the ingress node of the OBS network IP packetsare assembled into optical bursts according to desti-nation node and class of service (if applicable). Weassume synchronous slotted operation, i.e. bursts offixed length are created and released at given inter-vals that are identical for the whole network. Further,a thorough investigation using our network simula-tions [7] has revealed that best performance is ob-tained for relatively large bursts of about 100 µs, oraround 80 IP packets per optical burst, and this burstlength is subsequently used in the simulations.
Limited buffers of about 17 Mbytes are assumed atthe ingress. We set a requirement for the total packet
14
12
10
8
6
4
2
4.6 4.8 5.0 5.2 5.4 5.6 5.8
lg(n)
e2
e c
ap
ac
ity
4.6 4.8 5.0 5.2 5.4 5.6 5.8
lg(n)
12.4
2.0
1.6
1.2
kOCS
OPS/OBS
10 Gbit/s transmission
No granularity
1,1
2,2 2,3
3,2 3,3
4,4
1,2 1,41,3
2,1 2,4
3,1 3,4
4,1 4,2 4,3
ISSN 0085-7130 © Telenor ASA 2005
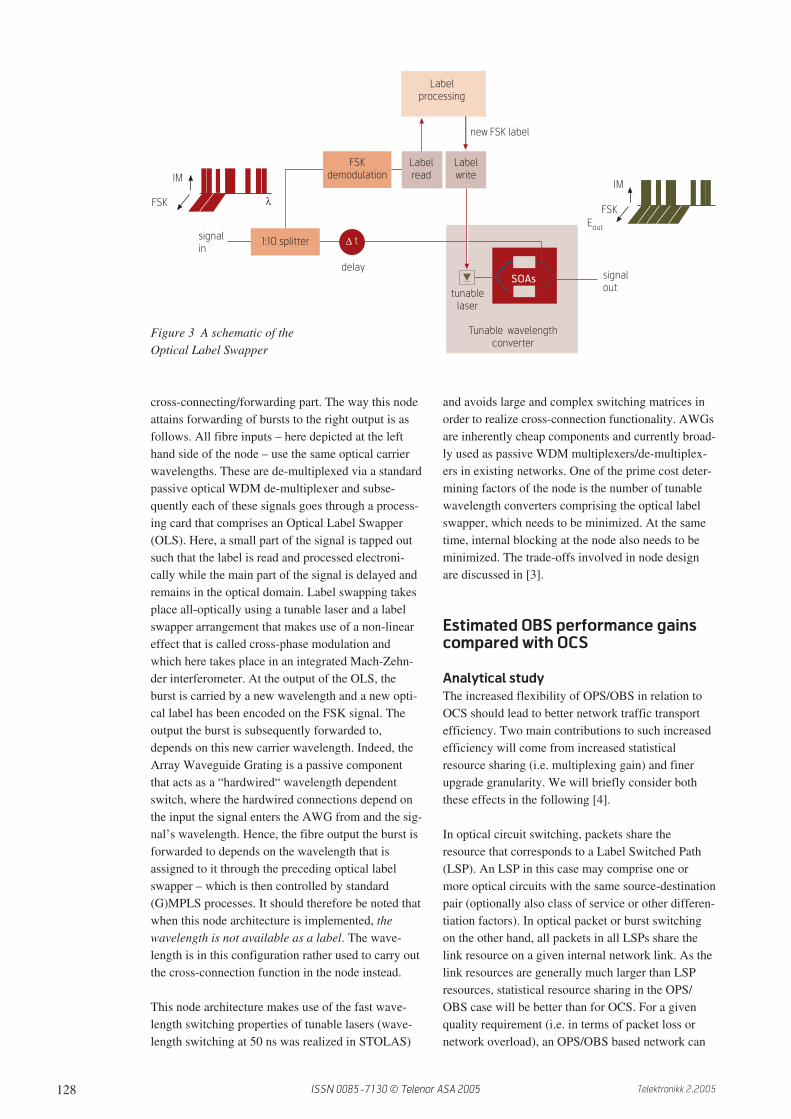
131Telektronikk 2.2005
loss Loss < 10-5 and calculate the resources that arerequired to meet this requirement for the givenoffered traffic. We then compare the resourcesrequired by the two technologies under consideration,namely OBS and OCS.
Note that load balancing is implemented in the net-work. We do not assume any over-dimensioning ofOCS for protection purposes. However, trafficbetween two end-to-end node pairs is divided intotwo diverse “shortest path” LSPs. This means that ineffect ASON (Automatically Switched Optical Net-work) functionality and QoS is assumed in OCS. Incase of failure high priority traffic from the failed linkwill be directed over to the second LSP path wherelow priority traffic will have to be dropped to makespace for the re-directed traffic from the failed link.Any other assumption would have required anincrease of the OCS resources by about 30 %, whichmay not be a fair basis for a comparison with OBS.In other words, we have assumed a best-case scenariofor OCS.
The traffic interest between the nodes is shown inTable I. Note the significantly diverse traffic levelsbetween different node pairs. This is important inorder to ensure the generality of the results.
Our results are shown in Figure 7. Different trafficlevels have been simulated. The total offered traffic
To 1,1 1,2 1,3 1,4 2,1 2,2 2,3 2,4 3,1 3,2 3,3 3,4 4,1 4,2 4,3 4,4
node
Fromnode
1,1 - 30.3 19.7 61.2 19.7 15.5 15.5 30.3 30.3 15.5 15.5 19.7 61.2 19.7 30.3 61.2
1,2 31.9 - 10.2 31.9 10.2 8.0 8.0 15.6 15.6 8.0 8.0 10.2 31.9 10.2 15.6 31.9
1,3 21.2 10.5 - 21.2 7.1 5.3 5.3 10.5 10.5 5.3 5.3 7.1 21.2 7.1 10.5 21.2
1,4 61.2 30.3 19.7 - 19.7 15.5 15.5 30.3 30.3 15.5 15.5 19.7 61.2 19.7 30.3 61.2
2,1 21.2 10.5 7.1 21.2 - 5.3 5.3 10.5 10.5 5.3 5.3 7.1 21.2 7.1 10.5 21.2
2,2 16.6 8.5 5.3 16.6 5.3 - 4.0 8.5 8.5 4.0 4.0 5.3 16.6 5.3 8.5 16.6
2,3 16.6 8.51 5.3 16.6 5.3 4.0 - 8.5 8.5 4.0 4.0 5.3 16.6 5.3 8.5 16.6
2,4 31.9 15.6 10.2 31.9 10.2 8.0 8.0 - 15.6 8.0 8.0 10.2 31.9 10.2 15.6 31.9
3,1 31.9 15.6 10.2 31.9 10.2 8.0 8.0 15.6 - 8.0 8.0 10.2 31.9 10.2 15.6 31.9
3,2 16.6 8.5 5.3 16.6 5.3 4.0 4.0 8.5 8.5 - 4.0 5.3 16.6 5.3 8.5 16.6
3,3 16.6 8.5 5.3 16.6 5.3 4.0 4.0 8.5 8.5 4.0 - 5.3 16.6 5.3 8.5 16.6
3,4 21.2 10.5 7.1 21.2 7.1 5.3 5.3 10.5 10.5 5.3 5.3 - 21.2 7.1 10.5 21.2
4,1 61.2 30.3 19.7 61.2 19.7 15.5 15.5 30.3 30.3 15.5 15.5 19.7 - 19.7 30.3 61.2
4,2 21.2 10.5 7.1 21.2 7.1 5.3 5.3 10.5 10.5 5.3 5.3 7.1 21.2 - 10.5 21.2
4,3 31.9 15.6 10.2 31.9 10.2 8.0 8.0 15.6 15.6 8.0 8.0 10.2 31.9 10.2 - 31.9
4,4 61.2 30.3 19.7 61.2 19.7 15.5 15.5 30.3 30.3 15.5 15.5 19.7 61.2 19.7 30.3 -
Table I Traffic interest in 4 x 4 matrix (in Gbit/s)
361
234
188
234
117
75
0
50
100
150
200
250
300
350
400
Th
e n
um
be
r o
f c
ha
nn
els
OCS
OBS
OBS/OCS=40%
OBS/OCS=65%
OBS/OCS=50%
Average traffic per
LSP: 11.8 Gbit/s
Average traffic per
LSP: 5.9 Gbit/s
Average traffic per
LSP: 2.95 Gbit/s
Figure 7 Comparison of OBS and OCS in the 4 x 4 grid network. Aburst length of 100 µs and a maximum burst assembly time of 300 µshave been assumed in the simulations
ISSN 0085-7130 © Telenor ASA 2005
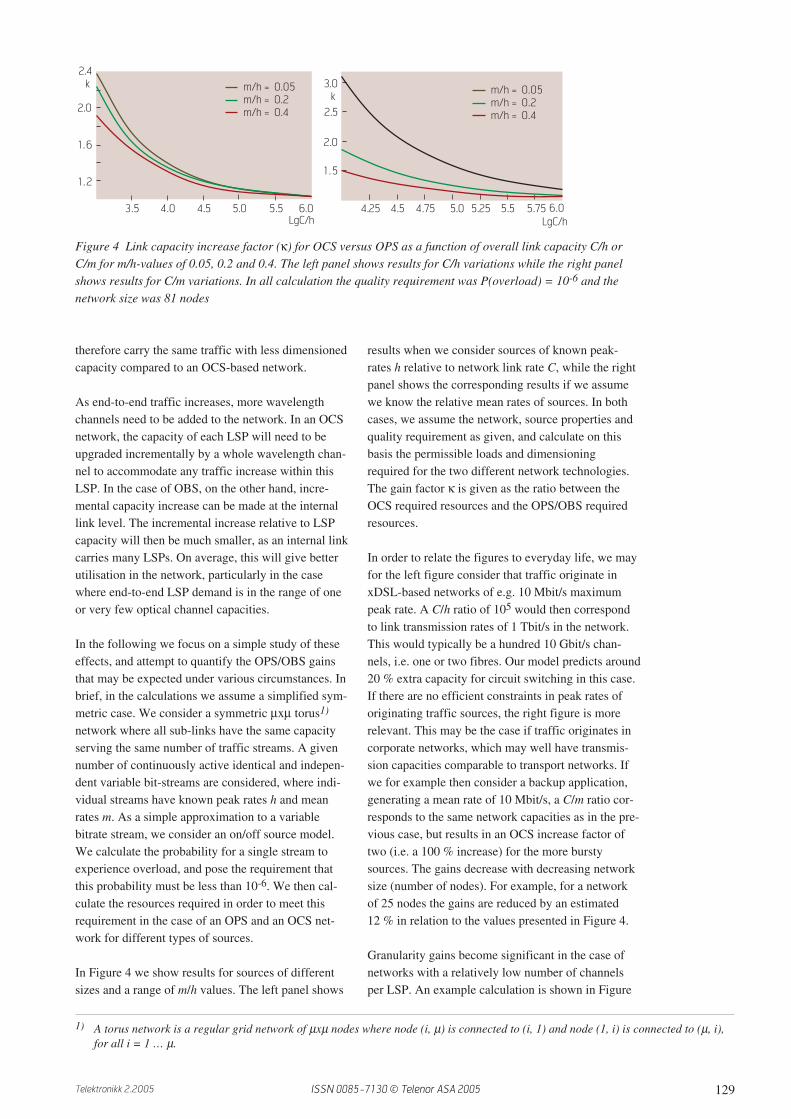
132 Telektronikk 2.2005
in the first scenario is 1581 Gbit/s. Due to the largetotal number (134) of LSPs, however, the averagetraffic per LSP is 11.8 Gbit/s. In the other two scenar-ios the offered traffic is halved to 790 and 395 Gbit/s,and the average traffic per LSP is 5.9 and 2.95 Gbit/s,respectively. According to the results, a relativelyhigh degree of statistical multiplexing in OBS resultsin considerably better performance for OBS whencompared with OCS. We also see that the lower thetraffic per LSP, the higher is the gain obtained withOBS. The main reason for this is the granularity ofthe optical light path that results in reduced utilizationof the available bandwidth in the case of OCS.
Our results indicate that an OBS network may typi-cally require close to half the wavelength resourcesrequired by a corresponding OCS network. This canalso be interpreted as follows: OBS node gear maycost roughly twice as much as OCS gear and still bea cost efficient solution.
Traffic burstiness
Given the importance of the input traffic, it is impor-tant to reflect on how well the assumed traffic bursti-ness corresponds to a likely scenario in 2009 and whatmay be expected further ahead. Our traffic model(Appendix 1) builds upon more or less existing appli-cations whereas new applications may appear thataffect traffic burstiness. Virtual reality type applica-tions with extreme real-time demands may appear inthe relatively near future, where information exchangeof very large bursts of data is necessary. Such applica-tions cannot allow the smoothing of traffic that wehave introduced in our simulations to reflect bottle-necks that are inherent in the network today and in thenear future. Hence such traffic would become a seriouschallenge for metro and core networks and would giveraise to higher burstiness. The appearance of accessnetworks with much higher capacity may in itself con-tribute to an increase of the burstiness of the trafficstreams. However, the effect of mobile networks isdifficult to predict in this respect. Even thoughmobile applications are also bursty, the peak rate ofthese services is low compared to similar services inthe fixed network, due to limited radio resources. Ifvideo type mobile based services are a big success, acertain percentage of traffic carried in the metro andcore network will also be of this type. This may actu-ally contribute to the opposite effect, i.e. it mayreduce the total burstiness of the composite traffic.
On the whole, we believe that neither access net-works with larger capacities, extremely demandingvirtual types of applications, or an explosion of videotype mobile services will happen in the near future.Therefore our assumptions regarding traffic bursti-ness should hold for the time horizon of the current
simulation study where we have been aiming at aboutyear 2009. However, it should be pointed out thathigher burstiness may be expected in the future andthis would lead to higher gains from OBS.
Conclusions of the theoretical and
simulation study
According to the theoretical evaluation gains of anysignificance may only be obtained for:
• Traffic of relatively large mean value and highburstiness, i.e. of a different type than what istypical in networks today;
• Relatively large networks;• Relatively low traffic volume per traffic stream.
The results of the network simulations have been inaccordance with the analytical studies. The number ofwavelength resources required in the OBS networkmay be of the order of 50 % of the number requiredin an OCS network. However, this is obtained for rel-atively low traffic per end-to-end traffic stream,whereas modest gains are obtained in the case ofsmall networks with relatively high volumes ofaggregated traffic – i.e. with several optical channelsper end-to-end stream. The introduction of QoS dif-ferentiation will lead to an increase in the number ofLSPs combined with a reduction of the average traf-fic per LSP and hence increase the gains obtainedfrom OBS.
Techno-economic evaluationSo far we have discussed the gains that can beattained by OBS. Performance improvements aloneare however by no means adequate – OBS solutionswill have to pass the acid test of economic viability.For OBS to become a competitive solution, it isrequired that the same performance as competingtechnologies is achieved for lower total investment,and/or that attractive performance improvements areattained for lower investment than with competingtechnologies, and/or that OBS leads to attractive per-formance improvements that cannot be provided byother technologies. Note that in the latter case OBSshould bring about an added feature that can increaserevenues above any required excess investment,either by providing a competitive edge or by provid-ing the means for the introduction of new services.
In this section we carry out a techno-economic analy-sis where we compare OBS directly with two com-mercial technologies, namely IP/MPLS and OCS.The current analysis is however limited to a compari-son of the required investment costs, whereas rev-enues are not included.
ISSN 0085-7130 © Telenor ASA 2005

133Telektronikk 2.2005
For this study we implemented an adaptation of atechno-economic tool that has been developed withinthe IST project TONIC [8] [9] [10]. The tool we haveimplemented carries out a calculation of (among oth-ers) capital investment for an assumed ingress trafficvolume – given a certain network topology, routingassumptions, technology and equipment choices. Thenetwork nodes are dimensioned according to the tech-nology assumed and equipment components are cho-sen from a “shopping list” of viable types for eachtechnology.
We have used this tool to compare a STOLAS OBSnetwork with two commercially available technolo-gies, namely OCS and IP/MPLS, where OCS is at asomewhat earlier stage of maturity than IP/MPLS.The equipment price implemented in our tool forthese two technologies is based on typical marketprices today. A STOLAS OBS network is based onprimarily existing optical hardware; however, thetechnology as such is not commercially available andrequires a good deal of development. Comparingcommercially available technologies with emergingtechnologies is a rather challenging task that intro-duces a fair amount of uncertainty. We have chosento employ a kind of scenario analysis in order to shedlight and quantify the conditions and requirementsthat can lead to different technologies prevailing.
One of the main challenges of the current study lieswith deducing a (future) sales price for the OBS tech-nology when the available information today is pri-marily the current cost of the constituent componentsand subsystems. Clearly we cannot forecast the futureprice of OBS – this is determined by market forcesand pricing strategy and is not directly foreseeable.What we can do, however, is find out what wouldbe a reasonable price for this technology that wouldallow a manufacturer to make a profit and break evenwithin a reasonable amount of time. In essence theassumption here is that cost-based pricing is employed.On this assumption we have derived possible pricelevels for STOLAS OBS as dictated by currentempirical rules within the telecom equipment indus-try. The sales price, P, may be estimated from thecost of optical components (sub-systems) CHW,according to the following empirical formula:
P = 2.5 × Cproduction = 2.5 × [3 × [1.3 × CHW]],
where Cproduction is the cost of production. The factor1.3 is used to account for software costs of around30 % of the cost of hardware. Note that such a largepercentage of software costs corresponds to high-endof IP routers whereas in the case of optical equipmentone estimates about 10 % ratio of software over hard-ware cost. However, we expect OBS to comply with
the packet switched paradigm and have thereforeassumed high software costs. The factor 3 in the priceequation shall account for non-optical hardware at thenode, such as chassis, cables, power supplies, coolingfans etc. Typically, optical equipment accounts forabout one fourth of the total cost in relatively maturesystems, while in just developed systems it may dom-inate costs entirely. Hence a factor 3 is rather conser-vative and shall lead to an overestimation of thecosts. In order to estimate the node price for futureyears, a price evolution with time is assumed for eachcomponent comprising the node. From these thehardware cost CHW and hence the final price P maybe estimated as a function of time. The evolution ofconstituent components is based on fitting historicalprice evolution for each component the past couple ofyears into a projection using learning curves [9].
The assumed cost of the main OBS subsystems andcomponents is summarised in Table II.
Ingress interface modelling, traffic input,
network topology and routing
Results are obtained from an analysis carried out on a4 x 4 grid network with homogeneous traffic volumesat all ingress nodes and homogeneous traffic interestbetween node pairs across the network. In our analy-sis it is assumed that the traffic entering the networkis in all cases IP packets. These are processed at anIP/MPLS edge router, the cost of which is notincluded in the comparison since it is identical forall cases. Then the packets enter our grid networkthrough Layer 2 interfaces (Figure 8). The reason forthis choice is that in order to be able to carry out afair comparison between the different solutions weneeded to define an interface that is identical in allcases. The three technologies we are comparing(OBS, OCS, IP/MPLS) are implemented rather dif-
Price per unitUS$
year 2005
Tunable laser, CW 3500
Tunable laser, modulated at 2.5 Gbit/s 5000
Tunable laser, modulated at 10 Gbit/s 5000
Tunable laser, modulated at 40 Gbit/s 7000
Synch: 14 x (ms range 2 x 2 switch) + (µs range 2 x 2 switch) 35,000
Semiconductor Optical Amplifier (SOA) 300
Array waveguide grating, per port 40
Processing electronics (Optical Label Swapper) 100
Table II OBS hardware costs: list of main components and subsystemprices
ISSN 0085-7130 © Telenor ASA 2005

134 Telektronikk 2.2005
ferently in real networks and have traditionally had,in any case to an extent, somewhat different areas ofapplication.
We have assumed shortest path routing in our study.End-to-end traffic from each ingress node to eachdestination node is split to two equal parts anddirected to the destination node following the (two)shortest paths. In the general case these are: a) oneconnection following the same row as the ingressnode until the column of egress is reached where thepath bends in the direction of the destination node,b) the remaining half of the end-to-end stream fol-lows first the same column as the ingress in the direc-tion of the row of the egress until it reaches this rowwhere it bends towards the egress. In the case ofnodes in the same row or column, two half-streamconnections are assumed for each end-to-end stream;however, these now follow the same shortest path.In addition to balancing the traffic load, this routingscheme will allow for restoration of high prioritytraffic in case of failures in the network.
The same restoration scheme has been assumed forall technologies, where a failure situation is takencare of by dropping low priority traffic in order toaccommodate rerouted high priority traffic. Therequired functionality is assumed to be included atthe edge of the network, where similar Ethernet-based functionality will be used to differentiatebetween low and high priority traffic in case of nodeor link failure. Hence, for the studied technologies,
the network is not over-dimensioned with any addi-tional capacity in order to take care of protectionaspects. This implicitly assumes that the OCS net-work is automatically switched.
QoS differentiation has not been explicitly imple-mented in the comparison presented here.
IP/MPLS
The evolution of IP/MPLS has been used as a refer-ence for scenario analysis in the rest of the study andhence no scenarios have been created for IP/MPLS.The evolution parameters of all other technologieshave been defined in relation to the evolutionassumed for IP/MPLS, hence the latter can beregarded in relative rather than absolute terms.
IP technology is broadly used and can be consideredrelatively mature. At the same time there are continu-ous improvements of the technology on both theswitching and interface sides. We have consideredthe price reductions of the IP-MPLS switch itself tobe in the order of 9–10 % the first coming years. Thisis reasonably well founded in historical data. Eventhough IP switches have been around for some time,the total world market is expected to be rather large,and thus only a small proportion of the total sales isbound to have been realised so far. In addition, con-stant developments with respect to MPLS, GMPLS aswell as the incorporation of advanced optical compo-nents, may also pull in the same direction.
For the Ethernet interfaces, on both the client and net-work sides, sales are only in their infancy. Ethernettechnology is rather new for such network nodeapplications such that the expected learning curvecoefficient may be in the range of 0.75. This is fur-ther supported by the price reduction that has beenobserved in the past couple of years. These lead to aprice reduction in the order of 17 % in the first com-ing years.
OCS price evolution scenarios
OCS optical cross connects (OXCs) are commerciallyavailable and their price is given per port for a rangeof sizes. A typical commercial price per (10 Gbit/s)port has been used for OCS in reference year 2005,where a 10 % cost of software has been included.Two scenarios are considered for the price evolutionof OXCs. In the “low-price” scenario it is assumedthat the price evolution will be dictated primarily bythe price fall of the constituent technology (i.e. hard-ware). Based on estimates of the market for OXCs,the low volume today and the relative market matu-rity of the technology, we estimated a price reductionof 14 % for OXCs for the first coming years in thisscenario.
Figure 8 Schematic of the assumed ingress architecture, applicable toall technologies considered
Modelled Network
Client Networks
Layer 2 Interfaces
Edge Router
ISSN 0085-7130 © Telenor ASA 2005

135Telektronikk 2.2005
In the second scenario (called OCS ASON) it isassumed that the price of OCS switches will decreasewith time at a rate lower than that of IP/MPLS due tothe fact that significant development is required inthe OCS case to achieve functionality comparableto IP/MPLS networks. The exact evolution is deter-mined based on the following hypothesis. A veryviable and cost-efficient solution to realise an all-optical OXC, is to base it on an AWG node architec-ture with tunable laser transmitters and tunable wave-length converters. The hardware is then rather similarto that of the OBS node – the only difference is thatin the case of OCS there is no need for burstificationprocesses, synchronisation, and label processing.Hence the software is simpler in the OCS case. Inaddition all hardware associated to label extractionand rewriting is not required; however, the corre-sponding costs are negligible. The cost associatedwith the pure OBS processes is on the whole not esti-mated to be very high so that in principle, there is noinherent reason why OBS should cost dramaticallymore than OCS when both technologies reach com-parable levels of maturity.
To account for the above, we have defined the morepessimistic OCS ASON scenario as follows. Sinceburstification processes take place only at the ingress,we keep ingress costs separate and estimate theseindependently for OCS and OBS. The rest of thenode cost, i.e. total switch costs including networkinterfaces but excluding ingress costs, are in this sce-nario considered to be comparable for OCS and OBSby year 2015 – albeit with OBS still being moreexpensive. More specifically, the OBS switch costs33 % more than the OCS switch. Note that in the costof the OBS switch in this case we include the cost ofthe optical label swapper unit. This OCS ASON sce-nario leads to a modest price reduction of about 5 %for the OCS switch the first coming years.
We consider both OCS scenarios as realistic. Notethat both scenarios assume ASON functionality; how-ever, they differ in their estimate of the developmentcosts associated for introducing such functionality inan OCS network. OCS ingress interfaces are consid-ered identical to IP/MPLS ingress interfaces, the onlydifference being that the transmission terminal costs
Figure 9 A schematic of the OBS node model used in the current study. Coarse synchronisation devices areincluded in each input fibre and the corresponding costs are included in the switch cost. The Network inter-faces comprise Optical Label Swappers. Ingress interface costs simulate costs corresponding to an OBSingress router
Ingress Interfaces
Network Interfaces
OBS PoS
Tx/Rx
OBS
Synchronization
per fibre
Client Networks
Layer 2 Interfaces
Edge Router
ISSN 0085-7130 © Telenor ASA 2005
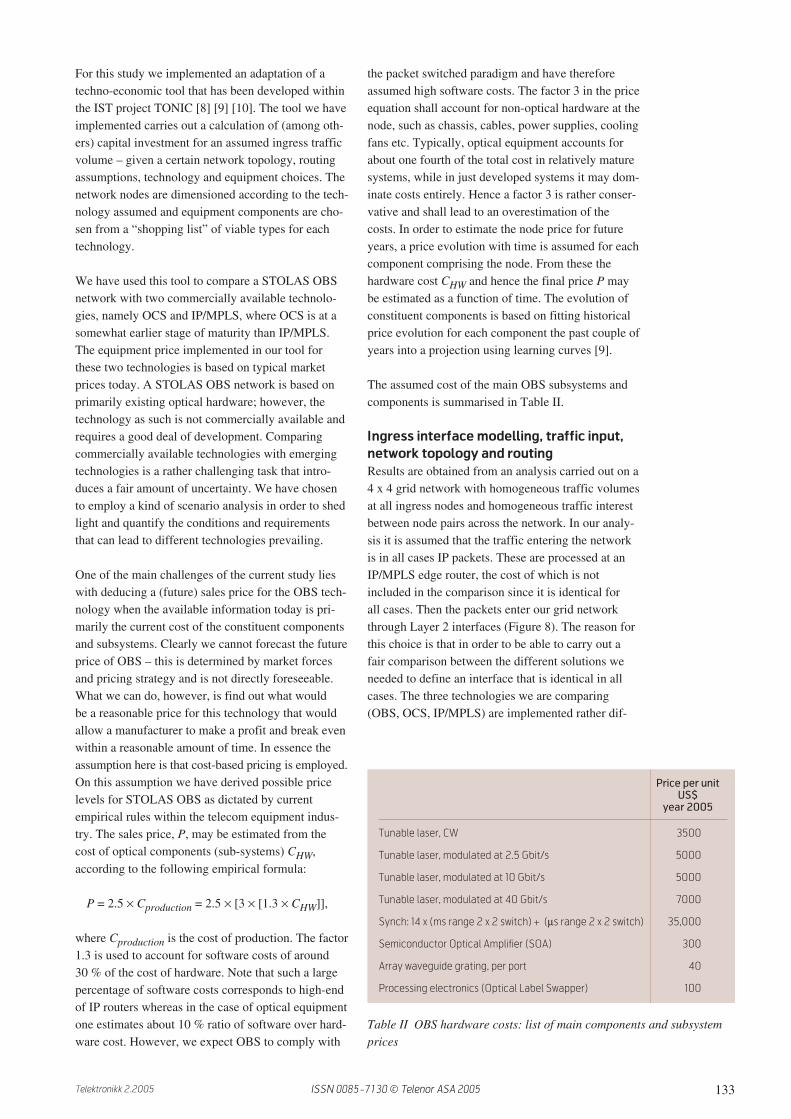
136 Telektronikk 2.2005
twice as much as for the IP/MPLS case to account forthe more stringent requirements for all-optical trans-mission.
OBS cost modelling
A schematic of the OBS node model we used in ourstudy is shown in Figure 9. At the input of the mod-elled network there are Layer 2 interfaces whereaswithin the OBS network optical bursts are transmittedcomprising a series of IP packets. These bursts areformed at the OBS-ingress and are then transmittedall optically through the OBS network until theyreach their destination. For this purpose some sort offraming of the signal will be required for pure trans-mission quality purposes. This interface simulates anOBS edge router, where IP/MPLS packets are gath-ered in buffers according to class of service and desti-nation, bursts are created and sent out in the OBS net-work. This function is quite similar to any IP/MPLSedge router and should in principle cost as much asan IP/MPLS edge router. It requires little hardwaredevelopment, however, software development willbe required in order to realise the burst managementfunctions that are OBS specific. These are primarilyrelated to the formation of bursts – such as determin-ing the time-out factor, releasing or delaying bursts,prioritising, etc.
We account for OBS ingress costs by including anOBS Packet-over-SONET (PoS) type of interface atthe ingress side that is dimensioned according to thenumber of bursts that are generated at each node. Theidea is that packets will need to be encapsulated insome sort of transmission frame and here we can usecurrent PoS interfaces as the starting point to estimatethese costs. There are more stringent requirements onthe transmission part in the OBS case due to thetransparent by-passing of intermediate nodes and thisis taken into account. In addition the OBS interface
will need to employ tunable lasers in this configura-tion instead of the conventional lasers currently used,so that their price will need to be adjusted upwardsaccordingly.
The question is still though how different should theprice of the OBS ingress interface be from a conven-tional IP/MPLS ingress, both initially and in follow-ing years. As our study revealed, interface costs arerather dominant compared with the cost of the rest ofthe node hardware after the empirical formula hasbeen applied. Therefore we created scenarios basedon interface cost.
The scenarios we have chosen consider that the OBSingress will cost somewhere between 2 and 3 times asmuch as an IP/MPLS ingress (PoS). This assumptionis not doing OBS any favours. The scenarios are sum-marised in Table III. Since the OBS edge router hasbeen modelled using the dedicated OBS PoS inter-faces, we have considered four likely scenarios forthe price and price evolution of these interfaces. InScenario A, C and D the OBS ingress price fallsfaster than the IP/MPLS. This is a reasonableassumption since the much higher price of the OBSingress is a result of its relative immaturity ratherthan inherently higher costs than IP/MPLS, as dis-cussed above. Scenario B assumes that OBS ingresscosts three times as much as IP ingress interfaces andat the same time these two follow the same learningcurve, i.e. the same price evolution. This scenario isclearly unrealistically pessimistic and is used for sen-sitivity purposes only.
Results
Results were calculated for a number of end-to-endtraffic levels. Note that both IP/MPLS and OBS scalenicely with input traffic, whereas in the case of OCSthe results are very dependent upon the chosen inputtraffic level – as a result of the coarse granularity ofOCS. Indeed, if the input traffic is close to an integermultiple of the traffic per channel, then the OCSchannels are well filled and relatively good results areobtained from OCS. On the other hand, when the traf-fic level is such that one deviates significantly froman integer multiple of the traffic per channel, thenless favourable results are obtained. This is more thecase when the traffic per end-to-end stream is lessthan one channel. In a real network, some links willcomprise well-filled channels while others will beless well filled, so that this effect is evened out. In ourcalculations, however, we assume a homogeneousnetwork and equal traffic between all nodes, hencethe choice of input traffic level will be decisive forthe obtained results. In order to be able to accommo-date traffic variations, a good margin over the meantraffic value needs to be allowed in the case of OCS,
OBS Interface cost Price
in 2005 reduction
per year
Scenario A 3x IP/MPLS 22 % realistic
Ingress interface
Scenario B 3x IP/MPLS 17 % unrealistically
Ingress interface pessimistic
Scenario C 3x IP/MPLS 22 % realistic
Ingress interface
Scenario D 2x IP/MPLS 22 % somewhat
Ingress interface optimistic?
IP/MPLS Ingress N/A 17 %
TABLE III OBS scenarios considered in the analysis
ISSN 0085-7130 © Telenor ASA 2005
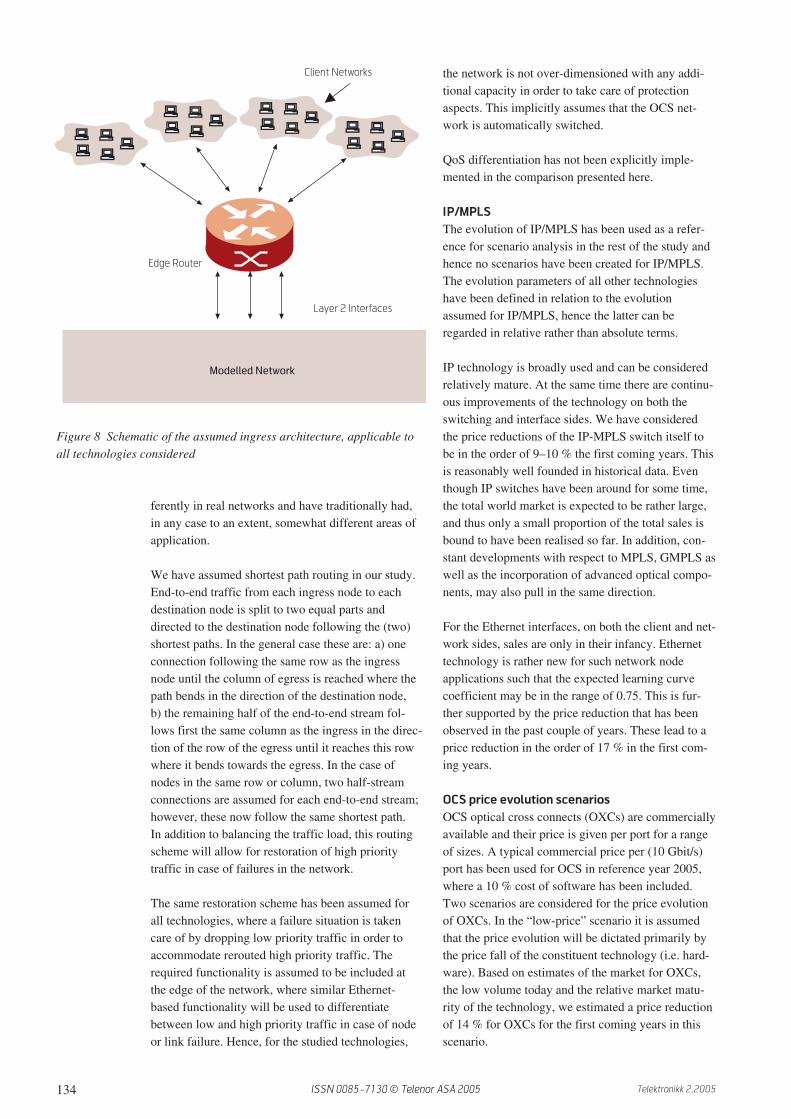
137Telektronikk 2.2005
also in real networks. In order to take these intoaccount, we have carried out our study for input traf-fic levels that correspond to over 60 % filled OCSchannels in the first reference year of an investmentperiod. This is, however, also evened out over thewhole five-year period of investment considered here,since we have assumed a yearly traffic increase of25 %. We have thus taken care to attain a realisticrepresentation of OCS.
In Figure 10 we present a comparison of the Net Pre-sent Value (NPV) of investment for IP/MPLS and thefour OBS scenarios for an end-to-end traffic per nodepair T = 10 Gbit/s. The NPV is presented for threefive year investment periods. It may be seen that alsothe unrealistically pessimistic scenario for OBS (Sce-nario B) seems to give comparable results withIP/MPLS in 2015. The other three scenarios lead tolower investments for OBS compared to IP/MPLS.
In the following, we include scenario A and scenario Cin our comparisons as we consider these two as themost likely scenarios, while we discard the worst casescenario (B) as well as the most optimistic scenario(D). These were used primarily in order to act as a sen-sitivity study and to illustrate the range within whichwe consider it most likely that scenarios may vary.
In Figure 11 we present a comparison of the chosenOBS scenarios, IP/MPLS, and the two OCS scenariosfor a Core case with PoS interfaces and T = 26 Gbit/s.The two OBS scenarios come out positively in year2015 while they are still too expensive as comparedwith OCS in year 2010. Note, however, that 10 Gbit/schannels have been assumed for all technologies tothis point.
These results reflect the conclusion of the theoreticaland simulation study, i.e. that multiplexing gainsalone may not be sufficient justification for movingto an OPS/OBS paradigm. Indeed, although opticaltechnologies appear to have an advantage by year
2015, there is no clear advantage from OBS com-pared with OCS in terms of cost efficiency.
Thus far we have, however, forced all technologies touse 10 Gbit/s channels so that the obtained picture is
Figure 10 NPV of investment per five-year period for IP/MPLS and thefour OBS scenarios. The results shown correspond to a Core case withPoS interfaces and an end-to-end traffic stream T = 10 Gbit/s per nodepair. 10 Gbit/s channels have been assumed for all technologies
Figure 11 NPV of investment per five-year period for IP/MPLS, the twoOCS scenarios and two of the OBS scenarios. The results shown corre-spond to a Core case with PoS interfaces and an end-to-end trafficstream T = 26 Gbit/s per node pair. 10 Gbit/s channels have beenassumed for all technologies
Figure 12 This figure shows the NPV of investment for two OBS scenarios, two OCS scenarios, and IP/MPLSfor year 2005 and 2015. On the left hand side all technologies use 10 Gbit/s transmission channels. On theright hand side of the figure the choice between 10 Gbit/s and 40 Gbit/s channels is free: here the two OCSscenarios still use 10 Gbit/s, while IP/MPLS and OBS use 40 Gbit/s channels
0
100
200
300
400
500
600
2005 2010 2015
Reference year
Ne
t p
rese
nt
valu
e [
mill
ion
US
$]
OBS scenario A
IP/MPLS
OBS scenario B
OBS scenario C
OBS scenario D
Ne
t p
rese
nt
va
lue
[m
illi
on
US
$]
OBS scenario A
OCS low price
0
400
800
1,200
2005 2010 2015
Reference year
IP/MPLS
OCS ASON
OBS scenario C
Ne
t p
rese
nt
va
lue
[m
illi
on
US
$]
0
100
200
300
400
10Gbit/s
interfaces
Free
0
20
40
60
80OBS scenario A
OCS low price
IP/MPLS
OCS ASON
OBS scenario C
10Gbit/s
interfaces
Free
ISSN 0085-7130 © Telenor ASA 2005
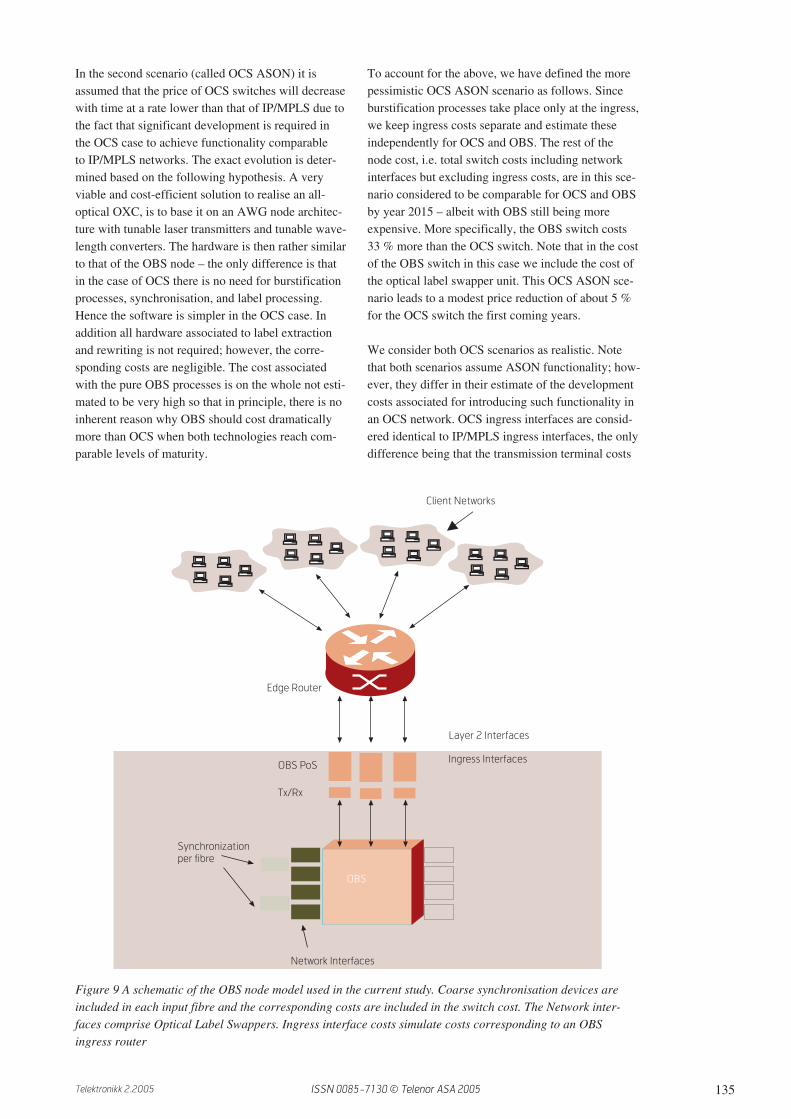
138 Telektronikk 2.2005
in fact misleading. OBS and IP/MPLS can use higherchannel bit rates since all connections on the link canshare the available bandwidth. This is not the case forOCS where dedicated channels need to be allocatedto each end-to-end (half) stream. In Figure 12 we pre-sent a comparison between technologies for the case
Figure 13 Cost split per technology and scenario for 2005 and 2015. T = 26 Gbit/s
Figure 14 Total number of interfaces required per technology.IP/MPLS and OBS will choose high channel bandwidths (40 Gbit/s)to optimise cost, whereas for OCS this is not a viable option since aninteger number of wavelengths needs to be assigned to each end-to-end(half) stream
0
50,000
100,000
150,000
200,000
250,000
OBS s
cenario A
OBS s
cenario C
OBS s
c A fr
ee
OBS s
c C fr
ee
OCS A
SON
OCS lo
w pric
e
IP/M
PLS
IP/M
PLS 40G
Ingress interface
Network interface
Switch
10,000
20,000
30,000
40,000
Co
st [
US
$]
x 10
00
OBS s
cenario A
OBS s
cenario C
OBS s
c A fr
ee
OBS s
c C fr
ee
OCS A
SON
OCS lo
w pric
e
IP/M
PLS
IP/M
PLS 40G
OB
S s
ce
na
rio
A
OB
S s
ce
na
rio
C
OB
S s
ce
na
rio
A 4
0 G
OB
S s
ce
na
rio
C 4
0 G
OC
S A
SO
N
OC
S l
ow
pri
ce
IP//
MP
LS
IP//
MP
LS
40
G
OB
S s
ce
na
rio
A
OB
S s
ce
na
rio
C
OB
S s
ce
na
rio
A 4
0 G
OB
S s
ce
na
rio
C 4
0 G
OC
S A
SO
N
OC
S l
ow
pri
ce
IP//
MP
LS
IP//
MP
LS
40
G
�
�����
�����
�����
�����
������ ��
������ ��
���������� ��
���������� ��
������ ��
Technology
To
tal
nu
mb
er
of
inte
rfa
ce
sT
ota
l n
um
be
r o
f in
terf
ac
es
4,000
3,000
2,000
1,000
0
OBS
10Gbit/s
OBS
40Gbit/s
IP/MPLS
10Gbit/s
IP/MPLS
40Gbit/s
OCS
10Gbit/s
Technology
where 10 Gbit/s per channel are used for all technolo-gies and for the case where the choice of bit rate maybe optimised per technology. In this case IP/MPLSand OBS use 40 Gbit/s channels, leading to consider-able savings. It should be noted that we have assumedthat the cost of 40 Gbit/s interfaces is 2.5 times thatof 10 Gbit/s interfaces – as indeed traditionally qua-drupling of interface bit-rate has led to a cost increaseby a factor 2.5.
In Figure 13 we see a comparison between yearlyinvestment per technology, showing the detailed costsplit per technology in year 2005 and 2015. It may benoted that as the total number of interfaces is reducedwith the choice of higher bit-rate channels in the caseof OBS, switching costs are also reduced. This isbecause switches are dimensioned according to thetotal number of interfaces in the case of OBS whileIP/MPLS switches scale according to the totalamount of traffic that is handled at the node. OBS isa clear winner in year 2015. Even when the networkinterface costs are included, the total cost of the nodeis primarily determined by the cost of the ingressinterfaces. The same conclusions as for Figure 12with T = 26 Gbit/s could be drawn also for T =43 Gbit/s. In that case IP/MPLS attained even lessfavourable results.
In Figure 14 we see the number of interfaces pertechnology. The difference between OBS and IP/MPLS is due to the fact that we have assumed anincrease of the traffic handled by OBS by 5 % toaccount for synchronisation guard bands. The mainsource of gains obtained with OBS is illustrated inthis figure, where we can see how the number ofinterfaces may be reduced in the OBS case becausehigher bit rate transmission channels can be used.This is also the case for IP/MPLS; however, the costof processing all through-passing traffic at each nodepays its toll such that IP/MPLS is not a good solutionfor relatively high capacity per end-to-end stream.
Figure 15 Comparison between technologies for ametro case (Ethernet interfaces) with relatively lowtraffic per end-to-end stream (T = 3.5 Gbit/s)
0
20
40
60
2005 2015
Year
Ne
t p
rese
nt
va
lue
[mil
lio
n U
S$
]
OBS scenario A
IP/MPLS light
IP/MPLS core
OCS 2.5 Gbit/s
ISSN 0085-7130 © Telenor ASA 2005

139Telektronikk 2.2005
For comparison purposes, we also present a study for arelatively low traffic metro network in Figure 15. Herewe have included IP/MPLS equipment (IP/ MPLSLight) that is more suitable for lower traffic and that ischeaper per bit of traffic handled than the IP/MPLSCore equipment. The latter has been used in our studythus far since we have been considering relatively hightotal traffic at each node, around 1 Tbit/s. In additionwe consider here OCS with 2.5 Gbit/s channels andhave reduced the cost of the cross connect accordingly(assuming low price opto-electronic OXC). It is inter-esting to see that IP/MPLS appears to be a competitivesolution also in year 2015 for this amount of traffic.However, note that OBS costs lie at the same level.
Summary and conclusionThe purpose of this study has been to evaluate the via-bility of optical packet or optical burst switching. Tothat end we first carried out an analytical evaluation ofthe gains that may be obtained with OPS/OBS com-bined with network simulations, where we addressedprimarily two aspects: statistical multiplexing gainsand granularity gains. The analytical study implied thatgains of any significance may only be obtained forlarge networks and traffic of high mean value andlarge burstiness, or for relatively low traffic volumes.A thorough network simulation study was carried outboth in order to quantify OBS gains and to give someinsight as to where and when these become significant.The results were by and large in accordance with theanalytical study. These have indicated that the numberof wavelength resources required in the OBS networkmay be of the order of 50 % the number required in anOCS network. However, this is obtained for relativelylow traffic per end-to-end traffic stream, whereas mod-est gains are obtained in the case of small networkswith relatively high volumes of aggregated traffic – i.e.with several optical channels per end-to-end stream.The introduction of QoS differentiation will lead to anincrease of the number of LSPs combined with areduction of the average traffic per LSP and henceincrease the gains obtained from OBS.
On the whole, the study of multiplexing and granular-ity gains of OBS as compared with OCS has pointedout that relatively modest multiplexing gains may beexpected. Hence statistical multiplexing gains alonemay not provide enough justification for a paradigmshift to OPS/OBS.
A techno-economic comparison of STOLAS OBSand two competing commercially available technolo-gies – IP/MPLS and OCS – was carried out. Theanalysis was scenario based. The main cost for OBSis actually associated with the Ingress Interfaces sothat OBS scenarios were created for the price and
price evolution of this interface. OCS scenarios werecreated according to whether the introduction ofASON functionality will require considerable devel-opment work or not. Our results ought to be regardedin relative rather than absolute terms and the studywas carried out with reasonable sensitivity marginsfor a fair scenario assessment.
Our results indicate the following: For networks withseveral channels per link, optical technologies arepreferable to IP/MPLS in the near future. If all tech-nologies are forced to use the same kind of transportinterfaces – 10 Gbit/s channels – then OCS achievesa good performance and there does not seem to beany clear advantage in moving to an OBS paradigminstead of OCS, in any case not in terms of clear costsavings. However, this conclusion is in fact mislead-ing: when each technology optimises the type oftransmission interfaces it uses, then 40 Gbit/s inter-faces are employed in OBS and this can lead to con-siderable savings compared to OCS by year 2015.
It is, of course, not possible to predict with certaintythe future evolution of the commercial technologies,let alone that of optical packet switching. Neither is itpossible to know with certainty whether the particulartechnology we considered here will in fact becomecommercial. However, this exercise has made a cou-ple of things rather clear. Firstly, it appears perfectlypossible to build a cost-efficient OBS node and thereis no component that makes this technology inher-ently prohibitively expensive. Secondly, OBS is moreefficient than OCS also for relatively high end-to-endtraffic between nodes, due to the fact that linkresource sharing in OBS allows the use of higher bit-rate interfaces whereas this would deteriorate granu-larity in the case of OCS. Thirdly, IP/MPLS ceases tobe an efficient solution at relatively low traffic den-sity levels and the introduction of optical interfacesbrings costs down.
This study has focused on comparisons between net-works with given traffic interests and has not takeninto account traffic dynamics for example throughoutthe day or in case of failure. When the advantages ofOBS that are related to flexibility and handling ofdynamic changes are taken into account in addition tothe indicated cost savings due to efficient use of thelink capacity, the message is rather clear:
IP/MPLS as we know it is a great solution for lowtraffic density networks. However, for higher trafficdensity optical technologies take over because theyeliminate excessive processing of through-passingtraffic and provide efficient switching for high-throughput nodes. OCS networks can provide thisfunctionality in the near future. In the longer term,
ISSN 0085-7130 © Telenor ASA 2005

140 Telektronikk 2.2005
OBS will be developed to provide a combination ofefficient switching/processing of large volumes oftraffic – a typical characteristic of optical technolo-gies – with the low granularity and flexibility ofpacket based networks.
References1 IST STOLAS. 26 October 2005 [online] – URL:
http://www.ist-stolas.org/
2 Koonen, T, Morthier, G, Jennen, J, de Waardt, H,Demeester, P. Optical packet routing in IP-over-WDM networks deploying two-level opticallabelling. ECOC 2001, Amsterdam, The Nether-lands, October 2001.
3 Cheyns, J, Develder, C, Colle, D, VanBreusegem, E, Demester, P. Cost efficientupgrading of OPS nodes. Proc. OpNeTec, Pisa(Italy), October 2004, 71–78.
4 Andreassen, R Ø, Helvik, B E. A note on trafficperformance gain for optical burst/packet switch-ing. Proc. Optical Network Design & ModellingConference, ONDM 2004, Ghent, Belgium, 2–4Feb 2004.
5 Zouganeli, E, Andreassen, R Ø, Haugen, R B,Solem, A, Feng, B, Sudbø, Aa, Stol, N, Helvik, BE, Emstad, P J. Performance evaluation of a meshoptical burst switched network with tunable lasersand tunable wavelength converters. ConTel 2003,Zagreb, Croatia, June 11–13, 2003.
6 Zouganeli, E, Andreassen, R Ø, Sudbø, Aa,Emstad, P J, Helvik, B E, Stol, N, Haugen, R B.Stacked label optical burst switched networksusing tunable lasers: Prospects, Viability andArchitectures. Optical Network Design & Mod-elling Conference, ONDM’03, Budapest, Hun-gary, Feb 2003.
7 Andreassen, R Ø, Stol, N, Zouganeli, E, Haugen,R B, Helvik, B E, Emstad, P J, Solem, A, Feng, B,Sudbø, Aa. Application dependent performanceof a mesh optical burst switched network andeffect of burst size. European Conference onOptical Communications, ECOC’03, Rimini,Italy, Sept 2003.
8 TONIC (Techno-Economics of IP Optimised Net-works and Services). 26 October 2005 [online] –URL: http://www-nrc.nokia.com/tonic/
9 Olsen, B T et al. RACE 2087/TITAN: Tool forIntroduction scenarios and Techno-economic
studies for the Access Network. Proc. RACEOpen Workshop on Broadband Access, Nijmegen,The Netherlands, June 7–8, 1993.
10 Olsen, B T et al. Techno-economic evaluation ofnarrowband and broadband access network alter-natives and evolution scenario assessment. IEEEJ. of Selected Areas in Communications, 14 (6),1184–1203, 1996.
11 Feng, B, Stol, N, Zouganeli, E, Andreassen, R Ø,Solem, A, Haugen, R B, Sudbø, Aa, Helvik, B E.Direct comparison between optical circuit andoptical packet/burst switching using simulations.OECC/COIN 2004, Yokohama, Japan, July 2004.
12 Zouganeli, E, Andreassen, R Ø, Feng, B, Stol, N,Solem, A, Helvik, B E, Sudbø, Aa, Haugen, R B.Optical packets, circuits, or packets and circuits:Viability of optical packet/burst switching. Invitedpaper at OECC 2005, Seoul, July 2005.
13 Zouganeli, E, Solem, A, Kjønsberg, H, Andreas-sen, R, Feng, B, Stol, N, Sudbø, Aa, Helvik, B E.Techno-economic evaluation of optical packet/burst switching. ECOC 2005, Glasgow, Sept 2005.
14 EURESCOM P918. 26 October 2005 [online] –URL: http://www.euresom.de
Appendix 1 Traffic input and methodfor network simulations
Traffic input for the network simulation
The aim of this section is to produce (realistic) trafficmatrices for input to the STOLAS network. To thatend we follow the methodology reported in EURES-COM project P918 [14], albeit in a slightly simplifiedway. This methodology takes as input a number ofgeographical regions, i, with populations Ni, wherecertain fractions of the populations employ certainapplication services. The penetration of each individ-ual service may differ from region to region, depend-ing on the mix of user categories (residential users,large/small business users etc). From the knowledgeof the number of users, penetration of the servicesand traffic generated per user (for the respectiveapplications), we are able to establish the necessarytraffic parameters. Specification of the latter isalways related to the busy period.
The busy period for traffic originating from the busi-ness segment is between 10h00 and 15h00 whereasthe busy period for the private segment is between21h00 and 22h30. In order to dimension the networka rule of thumb for the calculation of the composite
ISSN 0085-7130 © Telenor ASA 2005

141Telektronikk 2.2005
maximum traffic volume is to add 15 % of the maxi-mum volume generated by one segment to the maxi-mum volume generated by the other segment. Themaximum traffic is here calculated separately for theprivate and the business sector and the compositemaximum is calculated using the above mentionedrule of thumb. The traffic parameters will all berelated to year 2009 where we assume the core net-works to be all-IP. The traffic predictions are derivedfrom IST project TONIC [8] as well as internal workin Telenor.
Specification of the network
Traffic at the ingress is generated from “client net-works” where this term is used in a wide sense, to beunderstood as the sum (or aggregation) of all possibleclient networks that generate traffic to the sameingress node. That is, if there are competing serviceproviders in a region, with their respective clientnetworks, we treat this multitude as one big networkwith the same traffic characteristics as the sum of theindividual ones.
We consider sixteen geographical regions different inpopulation size as well as composition (i.e. differentmix of user categories). These are distributed evenlyto different network nodes. Hence, with our clientnetwork definition above, there will be four types ofclient networks with Ni (i = 1, ..., 16) users. Note thatwe assume most traffic to be packet based by 2009.
Table IV gives the number of Internet users (residen-tial and corporate) in region i. A user is here definedas a user-line. In the private sector, a user is thus ahousehold. In the business sector, a user is a user-linewithin a company.
The relative numbers of residential and corporateusers are based primarily on empirical values com-bined with an additional assumption of our own thatbigger regions will comprise a larger percentage ofcorporate users than smaller regions.
Application penetration
Nine application components have been consideredhere as summarized in Table V. The first three ofthese are Real-Time applications such that there isa maximum delay and jitter that can be tolerated bythese. The remaining six applications are not Real-Time such that relaxed delay and jitter requirementsare posed for these.
The penetration of application k (k = 1, …, 9) inregion i is denoted by Q pk
i and Q cki for private and
corporate users respectively. For simplicity we will,however, assume the penetration of applications tobe the same in all the regions, i.e. Q pk
i ≈ Q pk ∀i and
Q cki ≈ Q c
k ∀i. Note, however, that the relative mixof corporate and private users vary between regions.Penetration rates for each application are given inTable V separately for corporate and private users.These values are based on material from EURES-COM P918 that is slightly modified here in orderto accommodate the somewhat different scenarioassumptions that apply in our case. It is assumedhere, for example, that all telephony is transportedover our network, whereas only IP-telephony is con-sidered in P918.
The number of potential users in region i of a givenapplication k is then (using the “rule of thumb” men-tioned earlier) given by
U pki
= N piQ p
k+ γ N c
iQ c
kk = 1, ..., 9 i = 1, ..., 5
or alternatively
U cki
= γ N piQ p
k+ N c
iQ c
kk = 1, ..., 9 i = 1, ..., 5
Residential and corporate
users in Region i 1 2 3 4
Np
i(millions) 0.7 1.0 1.5 2.0
Nc
i(millions) 0.8 1.0 1.5 3.0
Table IV Number of Internet users in Region i
Application component Penetration rates
Corporate users, Residential users,
Qck
Qpk
1 Telephony 1.0 1.0
2 Interactive video (HQ) 0.1 * 0.0
3 Interactive video (LQ) 0.2 0.2
4 Video/audio streaming (LQ) 0.3 0.05
5 Video/audio streaming (HQ) 0.0 0.6
6 Web browsing 1.0 1.0
7 File transfer (machine-human) 1.0 1.0
8 File transfer (machine-machine) 0.04 * 0
9 Messaging 1.0 1.0
* The penetration rates above are given with reference to the total number of business users.
Services like Videoconferencing and Back-up file transfer are, however, carried out centrally
at each company and not by each corporate user. The estimated penetration rate per company
is divided by a factor of 10 in order to correct for this for these two services, where this factor
reflects an estimate of the average number of employees per company. Note that this may vary
from segment to segment and from country to country.
Table V Penetration per application for corporate and residential users(presumed to correspond to year 2009)
ISSN 0085-7130 © Telenor ASA 2005
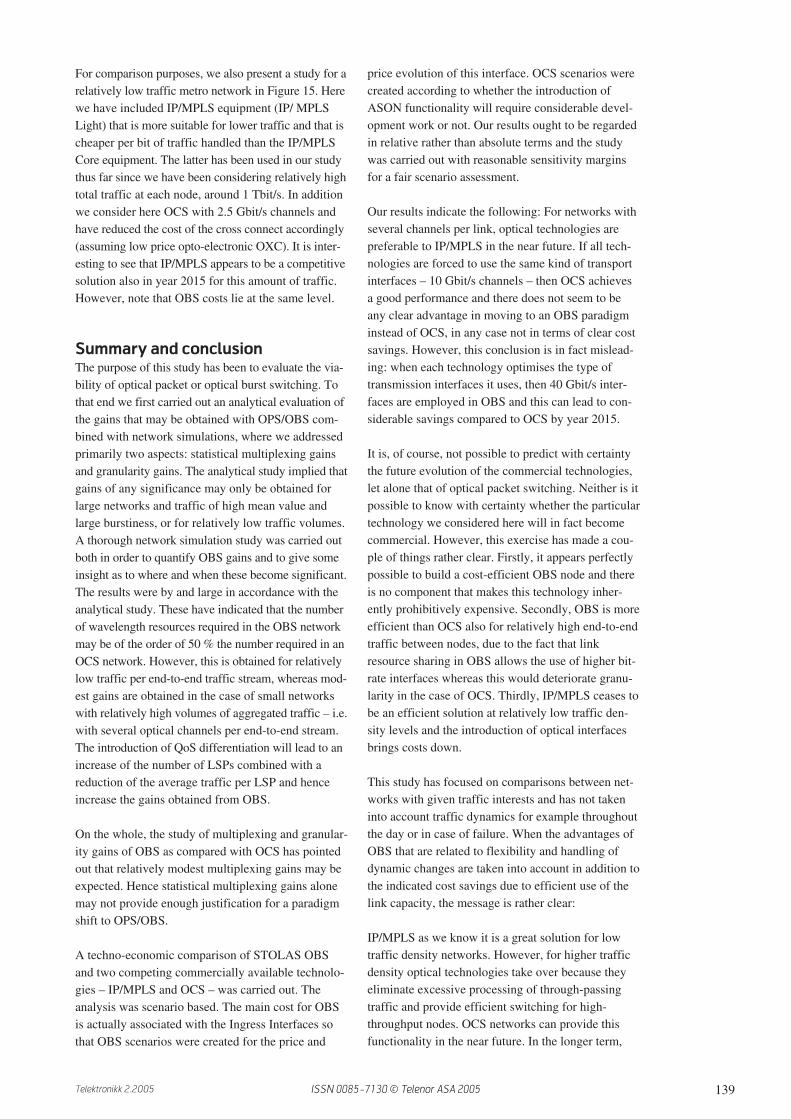
142 Telektronikk 2.2005
The first equation describes a scenario with focus onthe private segment, while the last one describes ascenario with focus on the corporate segment. Thefactor γ in the above expressions denotes the fractionof corporate busy-hour traffic present in the private-segment busy hour, and vice versa (we assume sym-metry in the rule of thumb).
Traffic parameters
In telephony, we know that the traffic generated byeach user is a = 0.1 erlang in the busy period. This isthe same as saying that he spends 10 % of the timeon the phone, or, alternatively, 10 % of the users areactive on the phone during the busy period. The bitrate traffic, â, is defined as â a * bit rate = 6.4 kbit/sfor a telephone channel with 64 kbit/s bandwidth.
≡
Continuous Block transfer Block transfer
Application component stream Residential users Corporate users
rup rdown λ νup νdown λ νup νdown
bit/s bit/s msg/s byte byte msg/s byte byte
1 Telephony 64 64
2 Interactive video (HQ) 400 400
3 Interactive video (LQ) 100 100
4 Video/au stream (LQ) 0 1500
5 Video/au stream (HQ) 0 4000
6 Web browsing 0.25 0 32k 0.25 0 500k
7 File transf (mach-hum) 0.025 0 30k 0.025 0 1.5M
8 File transf (mach-mach) 0.01 0 10M 0.01 0 10M
9 Messaging 0.002 20k 0 0.003 100k 0
Table VI Basic traffic parameters for applications
For Web browsing the ‘similar’ number is 0.4; that is,40 % of the Web-users are connected to the Internetduring the busy period. But in this case the 0.4 is notthe (erlang) traffic, since the user is not generatingmessages continuously. And, in addition, the traffica Web-user generates is basically in the downstreamdirection (towards the user). Hence, for Web-users,we also need to know λ , the number of messagesgenerated per second, and ν, the size of an averagemessage. Observations give the following numbersfor λ and ν, λ = 0.25, νup ≈ 0 and νdown = 32 kbyte.Here ‘up’ and ‘down’ refer to upstream and down-stream traffic respectively. This gives a downstreambit rate traffic of â = a * λ * ν * 8 = 0.4 * 0.25 * 32 *8 kbit/s = 25.6 kbit/s. This is four times the bit ratetraffic of the telephone user, but the Web-user is alsospending four times as long at his terminal.
Application component Residential users Corporate users
a â (kbit/s) a â (kbit/s)
up down up down
1 Telephony 0.1 6.4 6.4 0.3 6.4 6.4
2 Interactive video (HQ) 0.01 4 4 0.01 4 4
3 Interactive video (LQ) 0.04 4 4 0.07 7 7
4 Video/audio streaming (LQ) 0.01 0 2 0.01 0 2
5 Video/audio streaming (HQ) 0.1 0 200 0.1 0 200
6 Web browsing 0.4 0 25.6 0.4 0 400
7 File transfer (machine-human) 0.05 0 0.3 0.05 0 15
8 File transfer (machine-machine) 0.01 0 8 0.01 0 8
9 Messaging 0.25 0.39 0 0.25 0.6 0
Table VII User segment dependent traffic parameters
ISSN 0085-7130 © Telenor ASA 2005
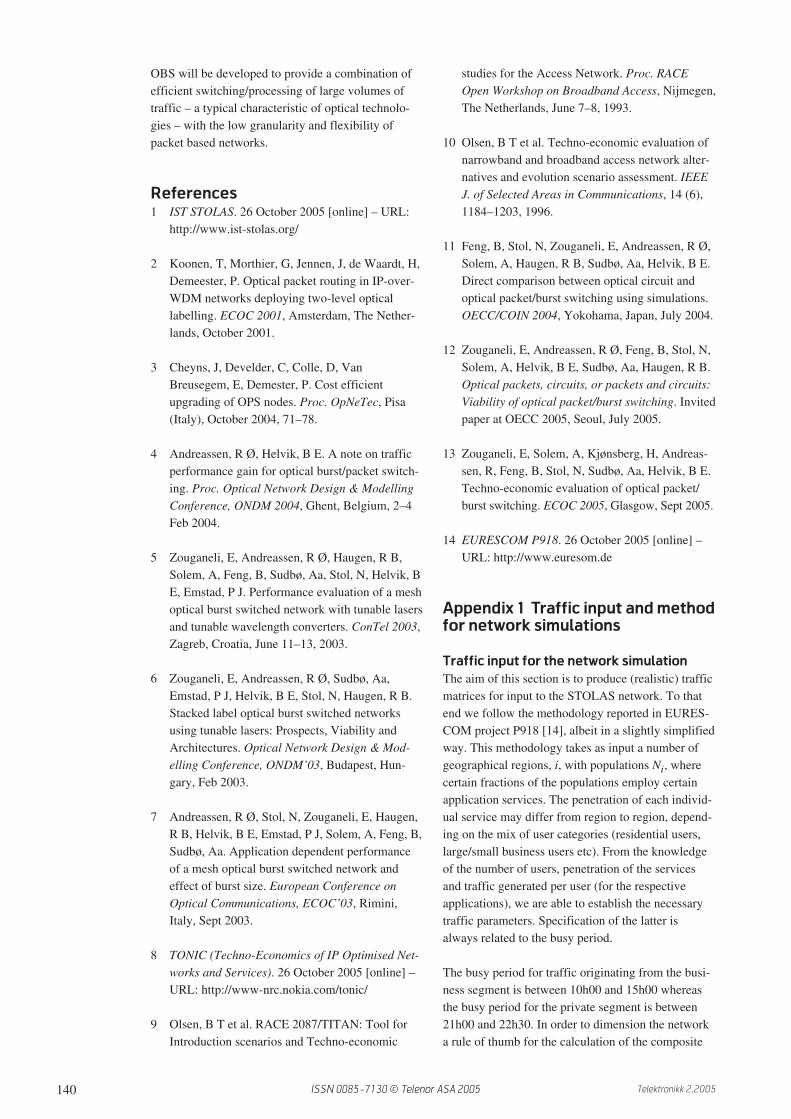
143Telektronikk 2.2005
In order to have a unified notation, we define a as thefraction of time a user is engaged at his terminal dur-ing the busy period. For the continuous stream appli-cations (application 1–5) a is simply the traffic peruser. For applications 6–9 the traffic per user is mostconveniently expressed through the bit rate traffic:â = a * λ * ν * 8. The total generated bit rate trafficfor application k in region i is thus given by
 xki
= â xk
U xki
x = c, p
As mentioned above, the first five activity compo-nents in Table VI are called continuous stream appli-cations. The last five are more conveniently lookedupon as transfer of blocks of information (bytes)and are thus called block transfer. Table VII lists theessential parameters for our basic applications. Fromthese parameters the (bit rate) traffic,
 xki
, x = c, p
can easily be calculated.
Traffic matrix
The traffic matrices specify the traffic between anytwo regions i and j. Routing will in general depend onapplication, but we will here consider as an approxi-mation that the geographical distribution of traffic
is the same for all applications. Let mi,j then be amatrix which gives relative numbers for the trafficflow, i.e. the matrix elements denote the fraction ofthe total traffic generated in region i that is destinedfor region j. Some applications are bi-directionalwhile others are essentially unidirectional. For thebi-directional applications, traffic originating in onedirection will create traffic also in the opposite direc-tion. For the unidirectional applications, the directionof generated traffic is given in Table VII, with theconvention that upstream is the direction from i to j– in other words there is no traffic in the directionwhere n or r are zero. The resulting traffic matrix isincluded in the main article (Table I).
Network simulations
Simulation model
Figure 16 is a schematic of our generic simulatormodel. Slotted operation is assumed, which impliesthat a synchronization unit would be required at theinput to the node. Bursts are created per destination ateach ingress node, and each burst will in general con-tain packets from many different applications. Burstsare not allowed to be longer than one time slot. Inaddition, a time-out value has been defined such thatingress delay cannot exceed a certain maximumvalue.
Mean
Application Parameters traffic
[kbit/s]
1 Telephony Silence detection 64 kbit/s when ON 3.733 kbit/s OFF; 25.57
variant of 1 prob. ON: 0.3623
2 File-transfer 8 0.01 msgs/s, mean length 10x8 Mbit 800.00
(Machine-Machine)
3 Video/audio streaming 5 Fixed rate 4000.00
(HQ)
4 Interactive video (HQ) 2 Fixed rate 400.00
5 Interactive video (LQ) 3 Fixed rate 100.00
6 Video/audio streaming 4 Fixed rate 1500.00
(LQ)
7 Web browsing 6 residential 0.25 msgs/s, mean length 32x8 kbit 64.00
8 File-transfer 7 residential 0.025 msgs/s, mean length 30x8 kbit 6.00
(Man-Machine)
9 Messaging 9 residential 0.002 msgs/s, mean length 20x8 kbit 0.32
10 Web browsing 6 corporate 0.25 msgs/s, mean length 500x8 kbit 1000.00
11 File-transfer 7 corporate 0.025 msgs/s, mean length 1.5x8 Mbit 300.00
(Man-Machine)
12 Messaging 9 corporate 0.003msgs/s, mean length 100x8 kbit 2.40
Table VIII Mapping of Applications to simulator source types
ISSN 0085-7130 © Telenor ASA 2005

144 Telektronikk 2.2005
A scheduler is defined to take care that bursts are sentout synchronized to the switching node as well asdelay bursts at a local queue when there is no freewavelength with which to enter the network. Weassume pure ingress switching nodes in the network,i.e. no control signaling is needed from the opticalpart of the switching node to the scheduler. The corenodes are assumed to have no internal congestion [3].
Bursts that cannot be served may overflow to a oneslot delay feedback fibre link with a given numberof available wavelengths (32). This feedback fibreis shared by all directions/outputs from a switchingnode. At the core nodes, the arbitration is fair in thesense that it starts serving incoming bursts (of samepriority) available at a certain slot period with equalprobability and then serves the input fibres in a roundrobin fashion. Bursts originating from the feedbackloop are however served first.
The simulator is implemented in the programminglanguage Simula, based on the DEMOS (“DiscreteEvent Modelling On Simula”) package developed byGraham Birtwistle. The freeware conversion tool andscript system “Cim”, which is developed at the Uni-versity of Oslo, is used to run the simulations. Cimconverts the Simula code to language C and runs itusing the C run-time system available on the usedhardware platform. The results that are presented inthe paper have been obtained from a series of runs.The load was varied by taking a fraction of the trafficthat corresponds to the scenario in Section IV. Inaddition, the slot size has been varied.
Traffic sources
We have chosen to use three basic source types tomodel all the different service components describedin Section IV. The three basic source types used areas follows:
• “Speech”: Speech codec with silence detection.Active (ON) period negative exponentially dis-tributed with mean value 0.96 seconds, and silent(OFF) period negative exponentially distributedwith mean value 1.69 seconds. Active rate is64 kbit/s, passive rate is 3.73 kbit/s. This sourcetype is used in the simulator to model the “Tele-phony” source type.
• “Data”: Negative exponentially distributed timebetween time instants where information unitsbecome available. Length of information unit (tobe divided into IP packets for transport) is assumedPareto distributed. Seven different parameter setsare used to model the source types “Web browsing– residential”, “Web-browsing – corporate”, “File-transfer (machine-human) – residential”, “File-transfer (machine-human) – corporate”, “File-trans-fer (machine-machine)”, “Messaging – residential”and “Messaging – corporate”.
• “MPEG-compressed Video”: Deterministic timebetween generation of frames. Length of a frameis taken from a Gamma distribution, but is alsocorrelated with the previous frame, if in the same“Group-of-pictures” (GOP). GOP lengths are dif-ferent and out-of-phase for each source, as are thetime instants where IP packets are sent towards theingress nodes. Four different parameter sets are
Source
(type,
destination
priority)
Source
(type,
destination
priority)
Burst assembly
(destination,
priority)
(destination,
priority)Burst assembly
(destination,
priority)
Mixes different
types of traffic in
same bursts
Traffic generated
locally towards
switch p
SWITCH p
Packets Bursts
Allocation of
wavelength
Based on destination
via routing table, priority
and some allocation rules
FDL
From other
switchesTo
switch
n
(at dest)
Shared feed-
back fibre
FDL
To
switch
m
Source
(type,
destination
priority)
Figure 16 Simulator structure with one slot feedback fiber (generic model)
ISSN 0085-7130 © Telenor ASA 2005
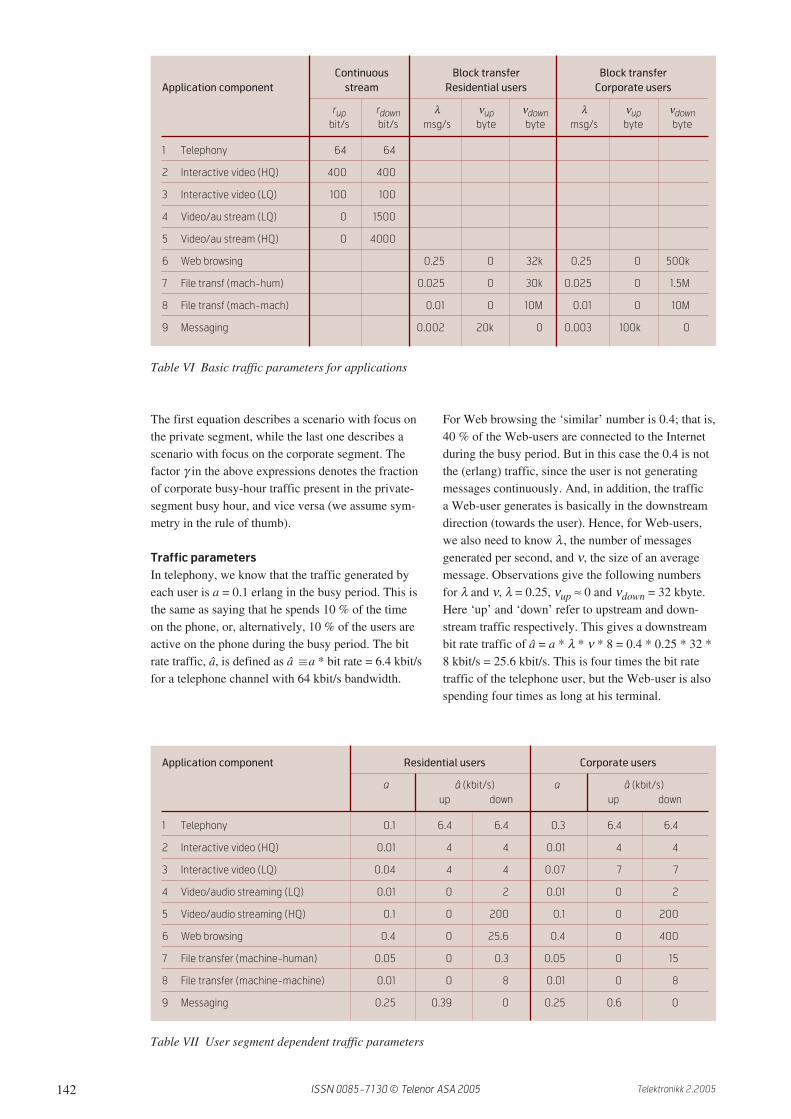
145Telektronikk 2.2005
used to model the source types “Interactive video(HQ)”, “Interactive video (LQ)”, Video/audiostreaming (LQ)”, and “Video/audio streaming(HQ)”.
Note that this leads to a “streaming fashion” behaviourfor “speech”- and “video”-based sources, but to veryheavy offered traffic bursts generated from all “data”-based source types. We make no assumptions on anyavailable transport level flow control protocol for“data”-based source types (i.e. no TCP or TCP-likeprotocol is in use); overflow from these traffic burstsmust be handled by the network itself (e.g. by smooth-ing of traffic streams in electronic buffers and/or delib-erate burst dropping – both in the ingress nodes).
The main limitation on the size of the network sce-narios that could be studied in our initial simulationruns was found to be RAM of the computers used.A main contributor to RAM processes is the sourceprocesses, especially the data sources which must bemodeled as one process for each actual source. How-ever, the traffic scenario we used in D121 leads to alarge number of active sources of especially certaintypes that generate very small amounts of traffic.These can safely be excluded from the scenario with-out influencing our results in any measurable way.Control simulation runs were carried out to verifythis. Therefore the following source types wereexcluded from the our final simulation runs:
• “File Transfer (Machine-Machine) – source type8 corporate
• “File-Transfer Man-Machine) – source type 7 residential
• “Messaging” – source type 9 residential• “Messaging” – source type 9 corporate.
Introduction of bottlenecks in the network
If a direct access to an ingress node of the optical net-work is assumed for all source types, then for datatype sources, this means that a (Pareto distributed)information unit is divided into IP packets andoffered to the network at once, regardless of length.This is an assumption that easily leads to unrealisti-cally high peak rates. In our simulations we assumethat IP packets generated from sources will passthrough an access network with limited capacitybefore arriving at the ingress node of the optical net-work. This also means that traffic streams from trafficfrom data type sources will be manifested at the edgeof the optical network as considerably less bursty.
• For “residential data” type sources, an accessnetwork capacity of 10 Mbit/s has been assumed,implying fast Ethernet connections or similar.
• For “corporate data” type sources, an accessnetwork capacity of 1 Gbit/s has been assumed,implying Gigabit Ethernet or similar.
In practice in the simulator this has been imple-mented directly into the data source processes. IPpackets are then sent out with the proper spacingin accordance with this.
Explicit modeling of limited buffer space in
the ingress
In our study an amount of RAM is modeled for eachingress node. The buffer is a shared resource for allpackets arriving at the ingress node. It is, however,possible to define limits of buffer usage depending onpriority class of the arriving packet, i.e. highest prior-ity class will always be able to use all free bufferspace, the next priority class may be given access tothe buffer only if (e.g.) less than 90 % of the buffer isoccupied, and so on.
OCS simulations
In the current study the focus has been to quantify thegains of OBS compared with OCS, hence OCS net-works had to be simulated. It is important to clarifythe method used here.
The first point to make is that we focus on core (ormetro) networks and simulate only the actual trans-portation of information through the core (or metro)network. Higher protocol level functionality is mod-eled only in as far as it has implications for our simu-lations, i.e. in order to make sure that our results arerealistic in a certain context. One such higher-levelfunctionality is the realization of an “emulated” end-to-end “circuit-switched” connection type by apply-ing some type of priority mechanism to informationunits in a packet based network. If the optical corenetwork is also packet (or burst) based and statisticalmultiplexing is used to arbitrate resources (in thiscase wavelengths in a certain direction at a certaintime), such a mechanism must also be present in thecore (or metro) network. Packets or bursts must thenbe divided into priority classes and differentiationwith regard to access to resources must be imple-mented.
It is, however, still an open question whether an opti-cal core network should be based on statistical multi-plexing or not. An alternative is to implement trans-port through the core network as pre-allocated light-paths (a series of wavelengths through the core net-work) from the given ingress node to an egress node.This may be implemented for example as a GMPLSlabel switched path (LSP) where the actual wave-length is a label between two nodes of the core net-
ISSN 0085-7130 © Telenor ASA 2005
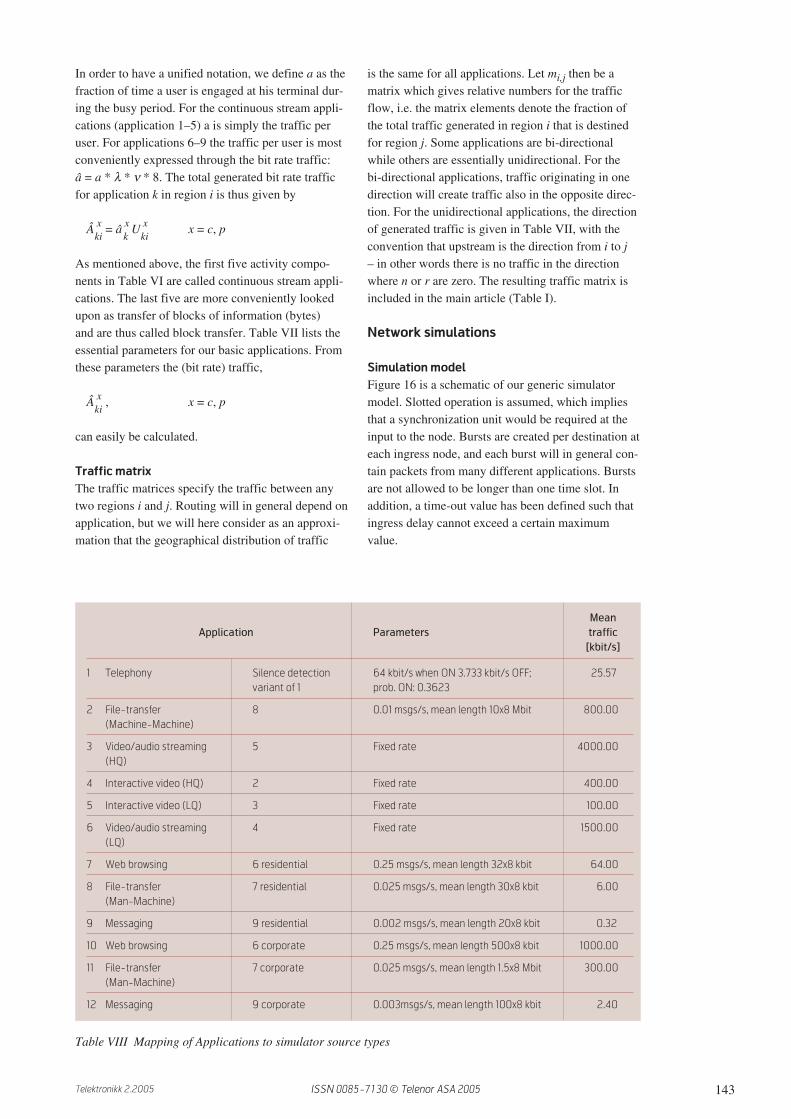
146 Telektronikk 2.2005
For a presentation of Evi Zouganeli, please turn to page 2.
Ragnar Ø. Andreassen received his MSc degree in Physics from the University of Oslo in 1988, and his PhD
from the Norwegian University of Science and Technology, Trondheim, in 1997. Since 1988 Andreassen has
been with Telenor R&D, where he has worked in various fields associated with telecommunication services,
network technologies and business aspects. His current research interests include network architectures,
network traffic and dependability performance, and charging and pricing of telecommunication services.
email: [email protected]
Boning Feng received his ME and PhD degrees in telematics from the Norwegian Institute of Technology
(NTH), Trondheim, Norway, in 1985 and 1990, respectively. Since 2005 he has been Associate Professor
at Oslo University College (OUC), Faculty of Engineering. Prior to that he was Senior Research Scientist at
Telenor R&D (1998–2004) and Associate Professor at Norwegian University of Science and Technology
(1990–1997). From 1996 to 1997 Boning Feng was Visiting Scholar at University of California at Davis
(UCD), Davis, CA. He is also Adjunct Associate Professor at University Graduation Center at Kjeller, Norway.
His field of interests include internet protocols, traffic modelling, control aspects of networks, and discrete
event simulation.
email: [email protected]
Astrid Solem graduated from the Norwegian University of Science and Technology in 1988. She has since
then been working at Telenor, the first four years in the Network division and then at Telenor R&D where she
has been working with technology and business aspects of network architectures for fixed and mobile net-
works on contract from Telenor business units and European Research projects. She is currently in charge
of monitoring the work in Study Group 13 on behalf of Telenor.
email: [email protected]
work. The wavelengths are then part of an OCS con-nection through the core network and not availableas a resource for statistical arbitration.
It is thus important to underline that it is only theoptical core network that is circuit switched, not theaccess networks. The actual usage of lightpaths willstill be statistical as seen from higher protocol level.
In our simulations we assume that one efficient wayof doing this will be to organize packets into burstsbefore suing the lightpaths to transport these burststhrough the core network. An alternative would havebeen to transport the packets directly. However, itwould in this case be required that packets are sortedinto different priority classes at higher protocol lev-els, so that organizing packets into bursts of differentpriorities may be an efficient way of achieving this.
Norvald Stol received his Siv.Ing. degree (MSEE) in 1983 from the Norwegian Institute of Technology (NTH),
Trondheim, Norway. He was awarded the degree Dr.Ing. in telematics from the Norwegian University of
Science and Technology (NTNU) in 1997. Since 1998 Norvald Stol has been Associate Professor at NTNU,
Department of Telematics. Prior to that he was Research Scientist at SINTEF (1984–1991 and 1994–1998)
and Research Scholar at NTH/NTNU (1991–1994). His interests include high capacity access and trans-
port networks, mobile communication, Quality of Service aspects of networking, traffic modelling, and
discrete event simulation. His current research focus is on different aspects of optical networking. He has
managed a number of research projects and been active in EU initiated research collaborations. Norvald
Stol is author/co-author of a number of papers and reports. He has held lectures and presentations in
Norwegian and international fora. He is former Chairman of the NIK foundation (1999–2003).
email: [email protected]
ISSN 0085-7130 © Telenor ASA 2005
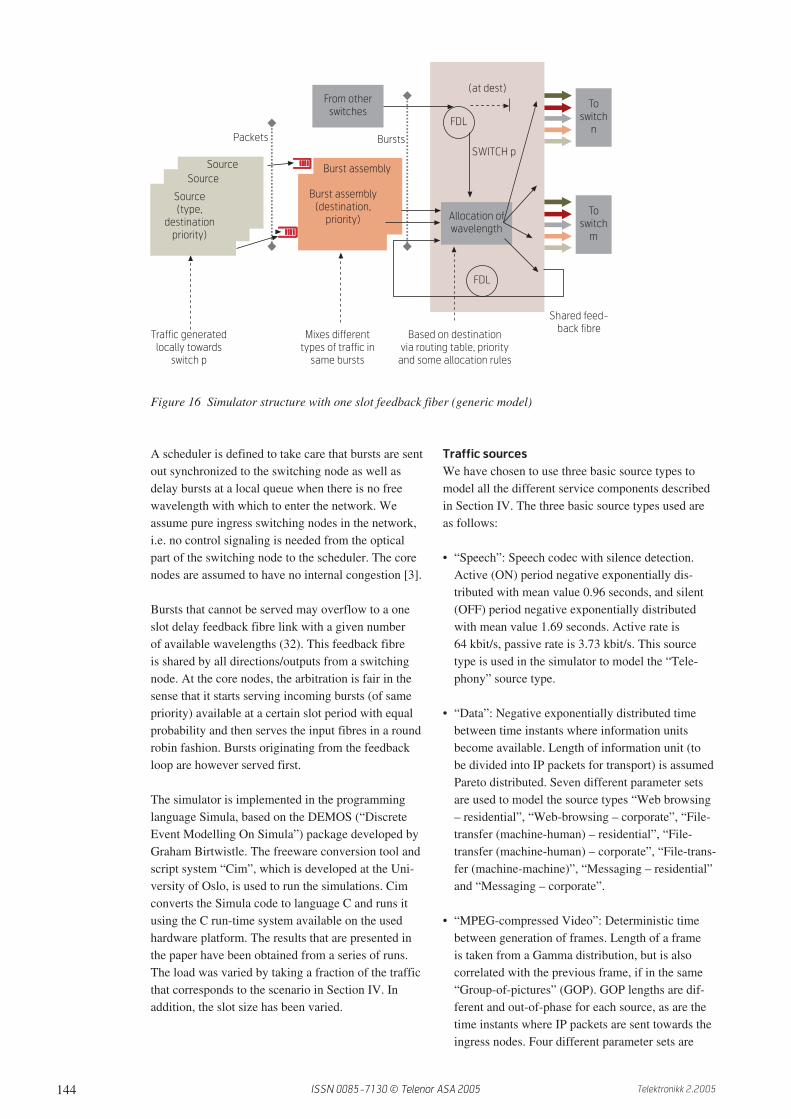
147Telektronikk 2.2005
Heidi Kjønsberg received the degree Dr.Scient (PhD) from the University of Oslo in 1999. She has since
2005 been employed as a research scientist at the Norwegian Computing Center. Prior to that she was
a research scientist at Telenor R&D (2000–2005) and has also had a post doc position financed by the
Norwegian Research Council at Indiana University, Bloomington, IN, USA. At Telenor R&D she mainly
worked on internet protocols, traffic engineering and traffic modelling. She now works on stochastic
modelling in connection to the oil industry.
email: [email protected]
For a presentation of Aasmund Sudbø, please turn to page 33.
Rolf B. Haugen received his PhD in Physics from the University of Colorado in 1972. After one year as visit-
ing scientist at Centre for Theoretical Physics in Trieste, Italy, he joined Telenor Research in 1973 and has
since then been with the company. Haugen started his research work in the field of teletraffic theory and
performance analysis. He has later, as Chief of Research, been in charge of several research groups within
Telenor R&D. He is currently in charge of coordinating Telenor R&D’s external activities, which include
standardization, EU and EURESCOM projects and collaboration with Norwegian universities.
email: [email protected]
Bjarne E. Helvik is Professor at the Norwegian University of Science and Technology (NTNU), Department
of Telematics. He is also with the Norwegian Centre of Excellence (CoE) in Quantitative Quality of Service in
Communication Systems. He is Siv.ing. (MSc) from the Norwegian Institute of Technology (NTH) in 1975
and was awarded the degree Dr. Techn. in 1982. He previously held various positions with ELAB, SINTEF
Telecom and Informatics and as Adjunct Professor at NTH.
His field of interests includes QoS, dependability modelling, measurements, analysis and simulation,
fault-tolerant computing systems and survivable networks. His current research focus is on distributed,
autonomous and adaptive fault-management in telecommunication systems, networks and services.
He also deals with teletraffic issues and the architecture of networks and network based systems.
email: [email protected]
ISSN 0085-7130 © Telenor ASA 2005

148 Telektronikk 2.2005
IntroductionImproved residential access and corporate communi-cation needs may trigger an increased demand forcore networks supporting multimedia applicationssuch as video-conferences, online gaming, video-on-demand and web-television streaming. Supportingthese services requires a network with a better perfor-mance than today’s IP network. The future “layer 3”network will benefit from being served by a high-capacity optical layer network that complies with thefollowing requirements:
1 Support high utilisation of resources; i.e. handlehigh capacity and link loads in a cost efficient way;
2 Support fine granularity that can be tailored to theapplications’ needs;
3 Support the quality needed by strictly real timeservices; i.e. low packet loss and low delay;
4 Support variable length IP packets, as used in theInternet today.
We will start by giving a background for the currentdevelopments in technologies for core networks,before discussing how the different switching tech-niques have the potential to meet these requirements.
In the mid-1990s, the introduction of the erbiumdoped fibre amplifier (EDFA) enabled the morebandwidth efficient wavelength division multiplexing(WDM) transmission systems that resulted in reducedcore transmission cost. However, cost-effective corenetworks also require cost-effective switching androuting. Today, the switching is performed electroni-cally; optical to electrical to optical (O/E/O) conver-sions are hence required in the switching nodes. With
increasing bandwidth demand, the cost of these con-versions and the limited capacity of electronic switch-ing may become a network capacity bottleneck.Implementing optical switches with ms-range switch-ing time, e.g. based on micro electro-mechanical sys-tems (MEMS) technology, is nowadays becomingfeasible. Currently, operators and vendors are work-ing on control plane architectures for resulting opticalcircuit switched (OCS) networks. OCS networks offerexplicit transfer guarantees. This leads however toset-up delays of at least several milliseconds, due tothe propagation delay induced by awaiting the set-upconfirmation.
Future optical networks should be able to serve aclient layer that includes packet-based networks, suchas the Internet. These may have a highly dynamicconnection pattern, with a significant portion ofbursty traffic between the communicating pairs. Inthis case, OCS transport at a granularity of 2.5 Gbit/s,10 Gbit/s or 40 Gbit/s may lead to low resource utili-sation. It would require over-dimensioning of thenumber of connections as well as of the bandwidthreservation of each connection, in order to avoidexcessive delay and extensive buffering at the ingressrouter. Optical packet switching (OPS) and opticalburst switching (OBS) have the potential to overcomethese problems by introducing statistical multiplexing(SM) at the optical layer. Several optical switchingtechnologies have demonstrated nanosecond tomicrosecond range switching times, opening up forthese new switching schemes. Telenor R&D andNTNU participate actively in European based studiesof both concepts, through the ongoing IST projectsNOBEL [1] and STOLAS [2], the recently concludedCOST 266 action “Advanced Infrastructure for Pho-tonic Networks” [3], as well as the ongoing COST291 action “Towards digital optical networks”. Fur-
Burst, packet and hybrid switching in the optical core network
S T E I N A R B J Ø R N S T A D , M A R T I N N O R D , T O R O D D O L S E N , D A G - R O A R H J E L M E
A N D N O R V A L D S T O L
Steinar Bjørnstad
is Senior System
Architect at
Canal Digital
Martin Nord is
Research
Scientist at
Telenor R&D
Torodd Olsen is
research scientist
at Telenor R&D
Dag-Roar Hjelme
is Chief Scientist
at Optomed
Norvald Stol is
Associate Pro-
fessor at NTNU
The cost of transmission in fibre-optical networks has been much reduced in recent years. With
increasing bandwidth demand, the cost and speed limitations of electronic switching are expected
to become the limiting factors in future telecommunication core networks. Optical packet switching
(OPS) and optical burst switching (OBS) have the potential to remove this bottleneck, by introducing
statistical multiplexing in optical switched networks. Optical hybrid switching combines optical packet
or burst switching with Optical Circuit Switching (OCS), and, thus offering both high throughput and
a circuit switched quality. In this paper we give the rationale for introducing OPS, OBS or a hybrid
network and describe the required switching functionality in each case. Then we discuss and analyse
different packet/burst handling schemes and make a detailed simulation analysis of an optical packet
switch, identifying the most promising design choices. Furthermore we describe a hybrid switch and
present simulations showing its basic properties.
ISSN 0085-7130 © Telenor ASA 2005

149Telektronikk 2.2005
thermore, a hybrid concept combining packet switch-ing, optical or electronic, with optical circuit switch-ing, is studied in the Optical Packet switched Migra-tion capable Network with Service Guarantees(OpMiGua) project. The circuit switched part ofthe network offers a Guaranteed Service Transport(GST), while the Statistically Multiplexed (SM) partof the network ensures high throughput for a BestEffort (BE) type of traffic. The OpMiGua projectreceives parts of its funding from the Norwegiannational research council (NFR). Project partners areTelenor, NTNU and Network Electronics, a Norwe-gian company developing and manufacturing WDMsystems for broadcasting applications.
OPS and OBS conceptsInevitably, there are some differences in terminologywithin the research community. We start this sectionby explicitly describing some concepts and termsused in this article. Both OPS and OBS are based onthe idea of separating forwarding from switching inthe network nodes. Forwarding decisions are basedon the information contained in the optically trans-mitted control information. As illustrated in Figure 1,in the OPS case this is realised as a packet headerwhile in the OBS case it can be a separate packetpreceding the burst (Burst Control Packet, BCP). TheBCP may travel together with the burst at a separatewavelength, alternatively it is encoded on the burstusing a different modulation format than used for thepayload, e.g. as in IST STOLAS [2]. The BCP andOPS header are converted to the electronic domainat the packet/burst switch input interface. It is subse-quently electronically processed in the control unit,which then configures the node resources for switch-ing, wavelength conversion or buffering of the dataunit. On the other hand, the burst or packet payload isoptically switched, thus avoiding the costly O/E/Oconversion, and in principle simplifying the interfacecards to the optical fibres.
OPS definition
OPS assume in-band encoding of control information(same wavelength, simultaneous transmission). Sincethe header follows the rest of the packet closely, thereis no reservation possible. Reading and reinsertion ofpacket headers with strict timing requirements arerequired, due to the short packet duration – typicallyaround 1 µs. Typically, OPS proposals assume packetsizes from around 40 to 1500 B, representative oftoday’s Internet traffic [4]. Some aggregation ofclient packets to form an optical packet may berequired, since the smallest client packet sizes onlycorrespond to 32 ns payload at 10 Gbit/s bitrates. Therelation between packet format, switching technologyand overhead is studied in more detail in [5].
OBS definition
OBS was introduced quite recently [6] and aims atoffering granularity in between optical wavelengthchannels and optical packets, at the same time min-imising optical complexity. OBS assumes moreextensive burst aggregation to form bursts with tensof kB of payload, thereby relaxing the requirement tooptical switches, from the nanosecond to the micro-second range. Client layer packets are assembled inedge nodes, and transported through the optical net-work in optical bursts. Another key concept of OBSis one-pass reservation; i.e. burst transmission is ini-tiated without awaiting a set-up confirmation. Asillustrated in Figure 1, BCPs are transmitted ahead ofthe corresponding burst. The relative delay is termedoffset, and as a minimum it equals the time requiredto settle the switches and perform control processingin the network nodes. The reservation schemedepends on the amount of information that the BCPcontains on its corresponding burst. Reserve a FixedDuration (RFD) type BCPs include both the start-and end times of bursts. The combination of RFDscheme, offset and the principle of delayed reserva-tion (DR), enables advanced burst scheduling. Forexample, a newly arriving burst can be reserved in agap left by already reserved bursts. This can optimisebandwidth usage and enable offset based QoS differ-entiation methods. A more detailed overview of OBSis provided in [7].
Optical Circuit and Packet switched Hybrid
(OpMiGua)
When SM is efficiently exploited, constant delay andzero packet loss is not guaranteed. Combining prop-erties of Optical Circuit Switches (OCS) with thoseof optical packet switches (OPS), may offer both bet-ter cost and performance [8]. Recently, a hybrid net-work concept was proposed [9, 10], combiningpacket switches with a Wavelength Routed OpticalNetwork (WRON); i.e. an optically circuit switchednetwork as shown in Figure 2. In this concept, a frac-
Figure 1 Main differences for transferring control information in OBSand OPS. a) illustrates that OBS typically has an “out-of-band” BCP,transmitted on a different wavelength and with a time-offset comparedto the burst payload. b) illustrates that OPS typically has an “in-band”header, transmitted at the same wavelength and simultaneously as thepacket payload. A number of variations on these main principles havebeen proposed
Toffset
Burst payload Control packet/
header
Packet
payload
Packet
header
a) b)
ISSN 0085-7130 © Telenor ASA 2005

150 Telektronikk 2.2005
tion of the packets, the Guaranteed Service Transport(GST) packets, follow the wavelength paths definedby the configuration of the optical cross connects(OXCs). The remaining packets (SM packets) areswitched in packet switches according to their headerinformation. The GST packets are not subject topacket loss, and delay is fixed. On the other hand, SMpackets have a BE quality. They will be dropped dur-ing congestion, and the use of buffering implicates avariable delay.
In the hybrid network concept the link resources aredivided in the time domain with packet length granu-larity. By sending GST packets through the WRON,and sending lower quality packets through the packetswitches on link bandwidth not consumed by GSTtraffic, both high throughput efficiency and the guar-anteed service are achieved [8]. The GST class is ableto accommodate services requiring circuit switchedquality, while lower quality traffic is statistically mul-tiplexed and experience only a moderate penalty fromthe GST traffic. We term this network concept Optical
packet switched Migration capable network withGuaranteed service (OpMiGua). If the WRON net-work is used for transit traffic, studies show thathybrid networks achieve potentially large savingscompared to both packet- and circuit switched net-works [11]: Compared to a circuit switched network,one can save wavelengths because SM improves theutilization of the wavelength paths. Compared to apacket switched network, reduction in packet switchsizes can be achieved, because the packet switches donot process packets that are sent through the WRON.Assuming a reference network applied within theCOST 266 project with associated traffic demandforecast for 2008, it is found that the hybrid networkonly needs 1/3 of the wavelengths needed in a purecircuit switched network. Compared to a pure packetswitched network, the amount of packet processing inthe nodes is reduced corresponding to a 30 % reduc-tion in number of wavelengths.
Comparison of optical switching schemes
In Table 1 we compare basic properties of OCS, OPSand OBS, aiming at identifying main properties ofeach switching paradigm. Note that these conceptsare not standardised, and no universally accepteddefinition exists.
Recent papers on OPS/OBS show a converging trend:First, the packet/burst handling schemes discussedbelow are becoming more similar. Second, in contrastto conventional OBS, buffers are now being imple-mented in new OBS designs, similar to OPS designs.Note that implementing buffers imply that packetsmay arrive out-of-order even when packets in thesame stream follow the same network path. Such out-of-order delivery is avoided in OCS. However, someimportant differences remain. These include finergranularity, but also higher overhead in OPS. OBSstill assumes out-of-band control encoding and moreadvanced scheduling. Furthermore, its coarser granu-larity gives more tolerance to the switching time ofswitch matrices.
In OCS, since each connection has reserved dedicatedresources, it can offer explicit transfer guarantees.This means that once a connection is set up, therewill be no loss of packets inserted on that circuit. Incontrast, such explicit/absolute transfer guaranteesrequire retransmission protocols for OPS and OBSnetworks. However, properly dimensioned networks,possibly combined with “MPLS type” circuit orientedtraffic engineering, can offer statistical quality of ser-vice guarantees which may serve the purpose, e.g.average packet loss rate (PLR) of 10-6. Moreover,employing QoS differentiation gives the networkdesigner the possibility of offering two or more PLRlevels to the clients.
Figure 2 Hybrid network model illustrating theefficient sharing of the physical layer. If the WRONnetwork is an S-WRON, the cross connect can be amatrix, manually configurable. If a D-WRON net-work is preferred, the cross connect should be con-figured by a control plane. The connected cross-con-nects and packet switches are physically co-located.These can be separate units with a common controlunit, or they can be integrated, sharing physicalresources in the node
WRON
Statistical
multiplexing
Packet switchCross connect
Physical fibre layer
WRON connections
Statistical multiplexed path
GST packet
OPS
Statistical
MuX
ISSN 0085-7130 © Telenor ASA 2005

151Telektronikk 2.2005
The hybrid scheme combines absolute and statisticalQoS guarantees. Headers are only needed on the BEtype of traffic. If a Static WRON (S-WRON) isemployed, overhead for setting up connections isavoided for the GST packets. GST connections maybe of the duration of a packet, burst or dynamic cir-cuit. In this paper we consider the connection dura-tion to correspond to that of a burst.
Packet/burst handling schemesBoth in OBS and in OPS the switching matrix isrequired to be re-configurable on the burst/packettime scale, to allow the packets/bursts to efficientlyshare node and fibre resources. The switching opera-tion is hence more demanding in OPS than in OBS.The basic principles for switching architectures andfunctionalities are in principle independent of thepacket/burst-handling scheme. In the hybrid scheme,the BE traffic may be burst switched or packetswitched, thereby having the same requirements tothe switching architectures as OBS and OPS, respec-tively. The GST packets follow circuit switchedpaths, hence demands to the switching matrix forthese packets are equal to those for circuit switching.In Figure 3 we show the four potential handlingschemes for OPS and OBS, classified accordingto synchronisation and data unit type.
The following summarises main points to considerwhen making a choice concerning operation modeand data unit type (fixed or variable length).
In asynchronous optical networks, each transmitter/output port in the nodes emits optical packets asyn-chronously, so that packets arrive at random momentsat the OPS nodes’ interfaces. Synchronous operationrequires optical synchronisers for packet alignment atthe switch interfaces and a global network clock forpractical realisation.
Fixed length packets (FLP) schemes require fragmen-tation of client packets and padding to fill the opticalpackets. Both factors increase the overhead; i.e.bandwidth consumption for successful transmissionthrough the OPS network [5], and thus the blockingratio for the same client load. In addition, fragmenta-tion calls for reassembly of client packets, whichincreases egress node complexity. For fragmentedpackets, it can in some cases be hard to tell duringreassembly whether a missing fragment is lost orsimply delayed. Fibre delay line (FDL) based bufferdesign and management is simpler for FLP than forvariable length packets (VLP), and it is simpler tomaintain the packet order. The complexity of othercontention resolution methods may be independent ofthe packet length. In general, a switch matrix operat-ing in synchronous, FLP mode will have less con-tention than when operating in asynchronous mode[12]. Furthermore, in this mode, a re-arrangeablenon-blocking switch matrix may have equal perfor-mance to a strictly non-blocking switch matrix [13].For optimum scheduling, variable packet lengthrequires coding of packet duration in the packetheader.
OCS (including
set-up) OBS OPS Hybrid
Recommended size > GB ~ tens of kB ~ 40 – 1500 B ~ 40 B – > GB
of transfer unit
Explicit transfer Yes No No Yes (GST part)
guarantee
Statistical QoS N/A Yes Yes N/A (GST part)
guarantees possible Yes (BE part)
Loss type Set-up request Loss of burst Loss of packet Loss of packet
rejection (BE part)
Control Out-of-band In-band or In-band Out-of-band (GST part)
Out-of-band In-band (BE part)
Latency mainly ~ 3 x prop. delay ~ Prop. delay ~ Prop. delay ~ Prop. delay
given by1) + burst assembly
delay, offset
Control overhead Connection BLP Packet header Packet header (BE part) and
given by set-up Connection Set-up part
if D-WRON for GST
Table 1 Main properties of Optical Circuit-, Burst- and Packet switched networks1) Latency is end-to-end delay. This row is valid in the case of no set-up rejections, packet or burst loss
ISSN 0085-7130 © Telenor ASA 2005

152 Telektronikk 2.2005
Contention resolutionIn the hybrid scheme, contention resolution is notneeded for the GST packets since they have an abso-lute guarantee and follow reserved wavelength pathsthrough the network. For the BE traffic, requirementsto contention resolution will be as for OPS or OBS,depending on the scheme chosen.
Time domain contention resolution
Buffering enables so-called store-and-forward net-works, in which contending packets are stored untilthey can be forwarded. For unlimited buffer capaci-ties, the network can guarantee that all packets reachtheir destination. With optimum routing schemes, thisscheme also guarantees that the packet follows theshortest possible path, which maximises the networkoverall capacity.
Optical buffering
Most optical buffers proposed rely on Fibre DelayLines (FDL), which are known to be bulky and to
Figure 3 Potential and viable (dark red boxes) OBS and OPS packet/burst handling schemes. As mentionedearlier, control information in OBS may also co-propagate in-band with the burst
OPS packet handling scheme Synchronous FLP Asynchronous VLP
Synchronisers / network clock Required Not required
Edge node assembly More complex Less complex
Architecture required to avoid internal blocking Reconfigurably non-blocking Strictly non-blocking
Requirements to contention resolution Lower Higher
Overhead Higher Lower
Table 2 Main properties of attractive OPS packet handling scheme
"Slotted" network
Optical Packet Switching (OPS)
("in-band" control information)
Synchronous
Network
Optical Burst Switching (OBS)
("out-of-band" control information)
"Synchronous network" -
packets/bursts are transmitted/received
synchronously (at periodic instants)
OPS/OBS
(No transfer acknowledgement before sending data)
Very similar packet/burst-handling schemes
Different control planes and packet/burst lengths
Fixed
length
packets
Asynchronous
Network
Synchronous
Network
Asynchronous
Network
Variable
length
packets
Fixed
length
packets
Variable
length
packets
Fixed
length
bursts
Variable
length
bursts
Fixed
length
bursts
Variable
length
bursts
A main motivation for OBS is to reduce the opticaltechnology complexity. Therefore, avoidance of burstalignment is essential, and asynchronous operationrequired. Burst assembly mechanism typically in-cludes timers to prevent excessive delay, and variableburst length gives the assembler more freedom tooptimise burst lengths. Furthermore, in asynchronousoperation, fixed burst length does not in generalreduce blocking probability. Hence, we consider inthis study that OBS networks operate asynchronous-ly, with variable length bursts, as is the custom inmost work on OBS.
On the other hand, as further discussed in [7] OPShas two schemes that in general are more attractive,namely synchronous operation with FLP and asyn-chronous operation with VLPs. The two schemes’main advantages are summarised in Table 2.
ISSN 0085-7130 © Telenor ASA 2005
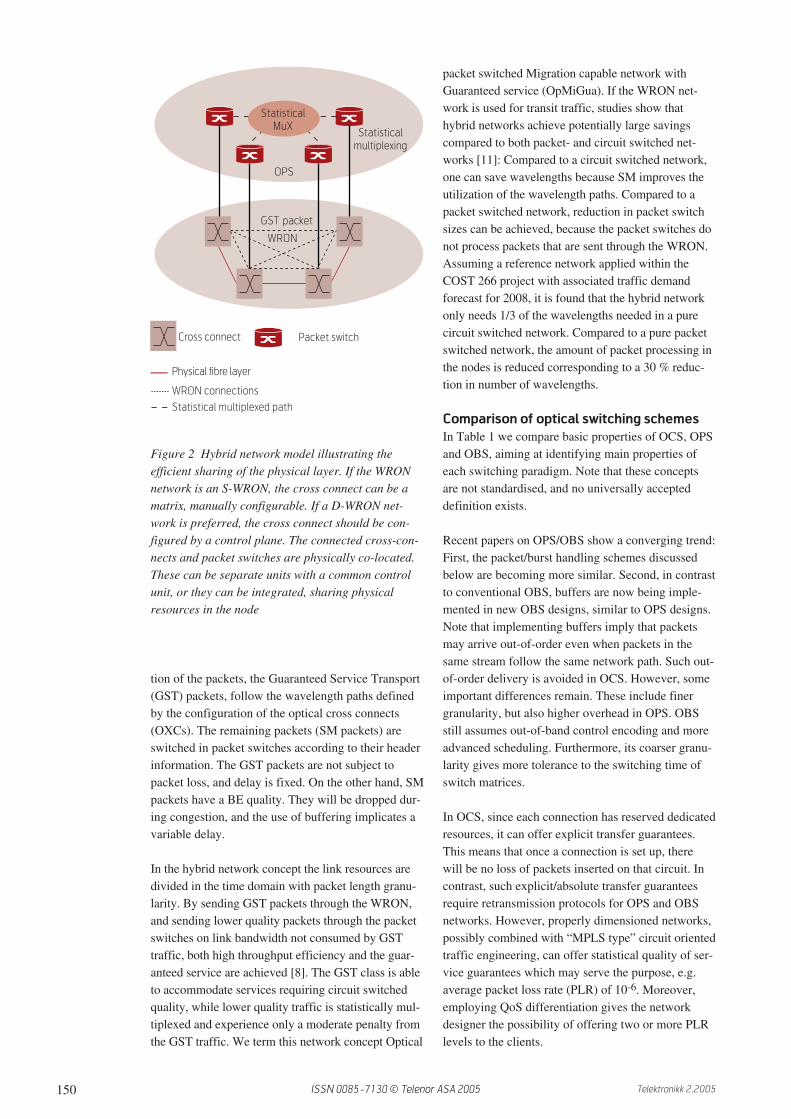
153Telektronikk 2.2005
require stable external temperature to maintain a stablepropagation delay. The time spent in the FDL is deter-mined by the fibre length – it is not a RAM. Morecomplex buffer designs, achieved by interconnectingre-circulating FDLs or by broadcast-and-select archi-tectures [14] can increase the accessibility after inser-tion. However, both the increased loss, which must becompensated for by EDFAs, and the switch cross-talkintroduced, decrease signal quality. Variable lengthpackets further increase buffer size and buffer designcomplexity. Complex FDL multi-stage buffers may berequired, and available size in OPS nodes is in practicelimited. Alternatively, [15] has demonstrated a variableoptical delay circuit for use in optical buffers, suitablefor variable length packets. However, this requiresextensive hardware such as re-circulating loop, fil-ters, circulators and λ-converters.
Electronic buffering
Most OPS designs assume an electronic control unit,since electronic processing is superior to optical pro-cessing. Similarly, electronic memory is inexpensivecompared to FDLs. However, electronic bufferingrequires opto-electronic interfaces. Avoiding such inter-faces is one of the main targets in OPS. We believe thatbuffering in OPS core routers should be used in combi-nation with other contention resolution schemes. There-fore, only a small fraction of the packets undergobuffering, thus only a few buffer input interfaces areneeded. An OPS design partly based on electronicbuffering is proposed in [16], and a design that relieson electronic buffering only is proposed in [17].
Wavelength dimension contention resolution
By sharing the total traffic on several wavelengths,i.e. decreasing the load on each wavelength, the con-tention problem is minimized, and with a sufficientnumber of wavelengths a sufficient packet loss ratiocan be achieved [18]. However, because efficient util-isation of the link-capacity is important for achievingcost-effective transport networks, a relatively highload on each of the wavelengths is desirable. Con-tention can be resolved by using λ-converters to con-vert packets to vacant wavelengths at the same fibrewithout increasing the number of wavelengths. Dueto properties of statistical multiplexing, this methodimproves with the number of wavelengths per fibre.Furthermore, the signal quality aspects are potentiallyexcellent, since the non-linear response of somewavelength converters has a re-shaping effect (2R).Adding a clock-recovery and a pulsed local source,full regeneration (3R) can be achieved [19], and theintegration potential opens up for compact devices.This must be exploited to achieve cost-effective con-tention resolution due to the high number of wave-length converters needed in this approach. The tuningspeed is an important parameter for tuneable wave-
length converters since it determines the optical guardband needed between subsequent packets.
Contention resolution by deflection routing
When two packets contend for the same outputfibre/wavelength pair, the conflict can be solved bysimply forwarding one of the packets on anotherfibre, and let an alternative OPS node be responsiblefor forwarding and switching the packet towards itsdestination. This contention resolution scheme iscalled “deflection routing”, and can be seen as spatialcontention resolution. In a sense the whole network isused as a buffer. The great advantage of this approachis its simplicity, since buffers and wavelength con-verters may be avoided. An important drawback isthe significant loss of packet order that follows,which increases the edge node complexity. Further-more, the overall network capacity decreases with theincreased average hop-count, so that deflection rout-ing does not work well for high loads, especially inasynchronous networks [20].
Comparison of contention resolution
schemes
The main advantages of electronic buffering are com-patibility with asynchronous scheme, low footprint,excellent signal quality aspects and the commercialavailability. The main drawback is the limited trans-parency and the potentially higher cost of the O/Einterfaces.
Wavelength conversion has the same advantages, andsomewhat better transparency properties. Further-more, the performance improves with the number ofwavelengths. Demonstrations of wavelength conver-sion at high bit rates prove their feasibility.
Optical buffering is transparent, but has no randomaccess in the time domain. FDLs have negativeimpact on the signal quality. Asynchronous schemesrequire more advanced scheduling processing thanslotted schemes. Relying purely on FDLs in thisscheme seems unrealistic due to the large footprintrequired for extensive FDL arrays or use of complexmulti-stage buffers.
Deflection routing’s greatest advantage is the lowhardware complexity in the core nodes and its trans-parency. However, the increased hop count, whichlimits network capacity, especially for asynchronousnetworks, is a drawback. Furthermore, deflectionrouting in slotted networks requires complex edgenodes, since the need for fragmentation in combina-tion with the possibility of loss of packets, willrequire larger edge buffers and mechanisms capableof reassembling fragments and suitable time-out valuesto decide when a fragment is lost or simply delayed.
ISSN 0085-7130 © Telenor ASA 2005
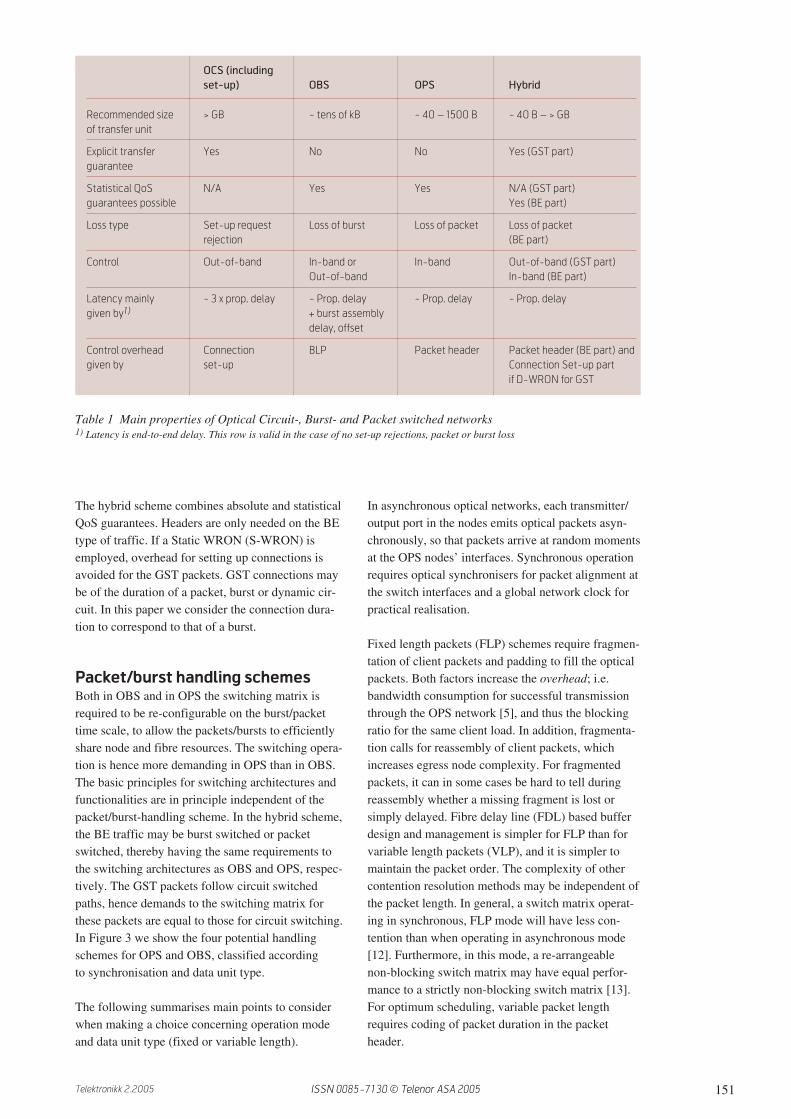
154 Telektronikk 2.2005
Combining contention resolution and
packet handling schemes
A combination of contention resolution schemesshould be used for optimum performance/complexityratio. [21] demonstrates the technical feasibility byimplementing contention resolution in an OPS nodeusing wavelength conversion, optical buffering anddeflection routing. Wavelength conversion has goodsignal quality aspects and is effective in resolvingcontention. To achieve very low PLRs it should beused with buffering, e.g. FDLs as in [22, 23]. Here,the wavelength conversion minimises the buffering,and in slotted scheme a small amount of single unitlength FDLs can be used. This combination will notwork as well for asynchronous packet handlingscheme, which requires more buffers and more com-plex FDL buffer design. We believe that asynchron-ous mode will benefit from the random access andsimple design of electronic buffers in combinationwith wavelength conversion.
Node design in OPS
A scalable packet switch design
A modular and scalable design, scaling to a very highnumber of wavelengths, and a high node degree isshown in Figure 4. The design is based on using λ-converters and Array Waveguide Gratings (AWG),thereby avoiding the use of optical switches. Benefitsof this design are that the signal path does not intro-duce large attenuation, contributing to the scalabilityof the switch, and that no additional λ-converters areneeded when using the wavelength dimension forcontention resolution. When a signal is sent into anAWG, the wavelength of the signal will decide atwhich output on the AWG the signal will occur. Thisprinciple is exploited for routing the packets to thedesired output. The input WDM signal of each fibre
is demultiplexed to its corresponding wavelengthsand fed to the input of the λ-converters. The outputsof each λ-converter are then fed to the AWG inputs.By tuning the output wavelength, packets can be sentto any of the AWG outputs. The packet will be sentto the scheduled output if a vacant wavelength can befound. If no output with correct destination is avail-able, the packet will be sent to one of the bufferinputs, if a vacant buffer input can be found. If not,the packet will be dropped. Buffered packets areclocked out of the buffer and sent back to an AWGinput as soon as a wavelength output to the destina-tion becomes available. At the buffer output, thewavelength, and thus the output of the first AWG, isdecided by tuning a tuneable laser. This type of archi-tecture is called a feedback design, and has the bene-fit of supporting packet priority also when FDLs areused for buffering [24].
In this design, each of the input fibres is coupled to acorresponding input plane. Hence, the AWG size ineach plane equals the sum of the number of wave-lengths, ‘W’, and buffer inputs, ‘B’, which is inde-pendent of the number of fibres and node degree.Each plane has ‘W’ outputs. The outputs are fed toa second set of ‘W’ AWGs with size N X N, makingthe maximum allowable number of fibres depend onthe AWG size.
The buffer is shared among all the planes. Total num-ber of buffer inputs corresponds to the number ofbuffer output ports in each plane. The buffer portsfrom each of the planes are passively coupledtogether using 1 : N couplers so that port ‘1’ in plane‘1’ are coupled to port ‘1’ in plane ‘2’ through ‘N’,and the same goes for the rest of the ‘B’ ports. Ateach of the buffer outputs, wavelengths are set usingtuneable lasers. By setting the wavelength, the packetis forwarded to the decided output.
Electronic Optical Wavelength Deflection
buffering buffering conversion routing
Random access Yes No N/A N/A
Packet sequence Modified (typically) Modified (typically) Maintained Modified
Hop count Minimum Minimum Minimum Increased
Additional delay ~ µs ~ µs ~ ns ~ ms
Payload Clock Recovery Required Not required Only for 3R Not required
Transparency Limited Yes Possible Yes
Scheme control Simple May be complex Simple Simple
SNR Very good (3R) Degraded Good (2/3 R) Degraded
HW complexity Intermediate Complex Intermediate Low
Table 3 Comparison of four buffering schemes
ISSN 0085-7130 © Telenor ASA 2005

155Telektronikk 2.2005
Forwarding of a packet undergoes two stages. In thefirst stage, the packet’s wavelength at the output fibreis decided. In the second stage, the packet is for-warded to the destined fibre. A packet occurring atone of the input fibres is forwarded to its destinationas follows: In each plane, which is the first stage inthe forwarding, the wavelengths in each fibre aredemultiplexed to ‘W’ corresponding fibre-lines. Eachline is then fed to a λ-converter, setting the wave-length so that the packet is forwarded to any of thedesired outputs of the AWG, making it possible tofreely choose at which AWG at the second stage thepacket will occur. This makes the first stage wide-sense non-blocking as described for the basic design.
After passing the first AWG, the packet is sentthrough a λ-converter before occurring at the input ofthe chosen AWG in the second stage. By setting theoutput wavelength of the λ-converter, forwarding toany output fibre can be chosen, thereby making thewhole switch wide-sense non-blocking. The packetthen undergoes a third wavelength conversion, con-verting to a vacant wavelength at the output fibrebefore the packet is sent through a passive coupleron to the output fibre.
Hybrid node design
For separating SM and GST packets in the node, theState of Polarization (SOP) may be used [9]. Figure 5illustrates the node design with polarization separa-tion and combination mechanisms as well as an OPS
with an electronic packet switch buffer [10]. Polariza-tion Beam Splitters (PBSs) physically separate SMand GST packets at the input interface. Neither guardband between GST and SM packets nor headers onGST packets and processing in the detecting node,are required. Because of polarization variations in thetransmission fiber, Automatic Polarization Control(APC) at the node inputs is necessary. It will howeveroperate on a relatively slow timescale of millisecondsto seconds, corresponding to the frequency of varia-tions in the fibre’s physical environments [25]. Theviability of a transmission path through a model-nodeis experimentally verified in [9]. The physical viabil-ity of a node input interface, with combined wave-length conversion and header payload separation isproposed and experimentally verified in [26]. Analternative to segregating by polarization is to replacethe PBS by a fast switch and send the class informa-tion in a packet header. The switch setting is thenbased on the header information [10].
The cross-connect in the node may be static(S-WRON) or dynamic (D-WRON). An S-WRONcross-connect is simple and reliable and does notneed remote control, avoiding a control plane. Sec-ondly, in S-WRONs, path setup delay is avoidedenabling a GST without waiting time. For D-WRONs,however, connections can be established dynamicallyfor relatively short time intervals, supporting trafficpatterns that vary with a moderate frequency.
Figure 4 The scalable packet switch design, with two switching stages, using a fully shared buffer. In the circleis shown the principle of the second switching stage
Fiber 1
Fiber N
MUX/output
11
N
1
N
λ2Plane 1
Plane 2
Plane N1
N
N
2
N
Shared
buffer
&
add/drop
unitN X B
Buffer inputs/outputs
Add inputs
Drop outputs
1
N
2
1
2
N1
2
N
Output 1
Output W
Output 2
(n+B)X
(n+B)
AW
Tunable
λ-conv.
1
2
W
1
B
2
1
W
1
B
Buffer
inputs/
outputs
λ1
λ2
λW
DMUX
λ W
AWG
&
λW- conv
First switching
Fixed
λ-conv .
AWG
W
Second switching
Fiber 2
Fiber 3Plane 3
Tunable
λ-conv.
λ 2
AWG
&
λ2- conv
λ1
AWG
&
λ1 - conv
λ1
λ2
λ2
λW
λW
λ1
λW
λ1
out.
1
Ou
tpu
t λW
out.
out.
ISSN 0085-7130 © Telenor ASA 2005
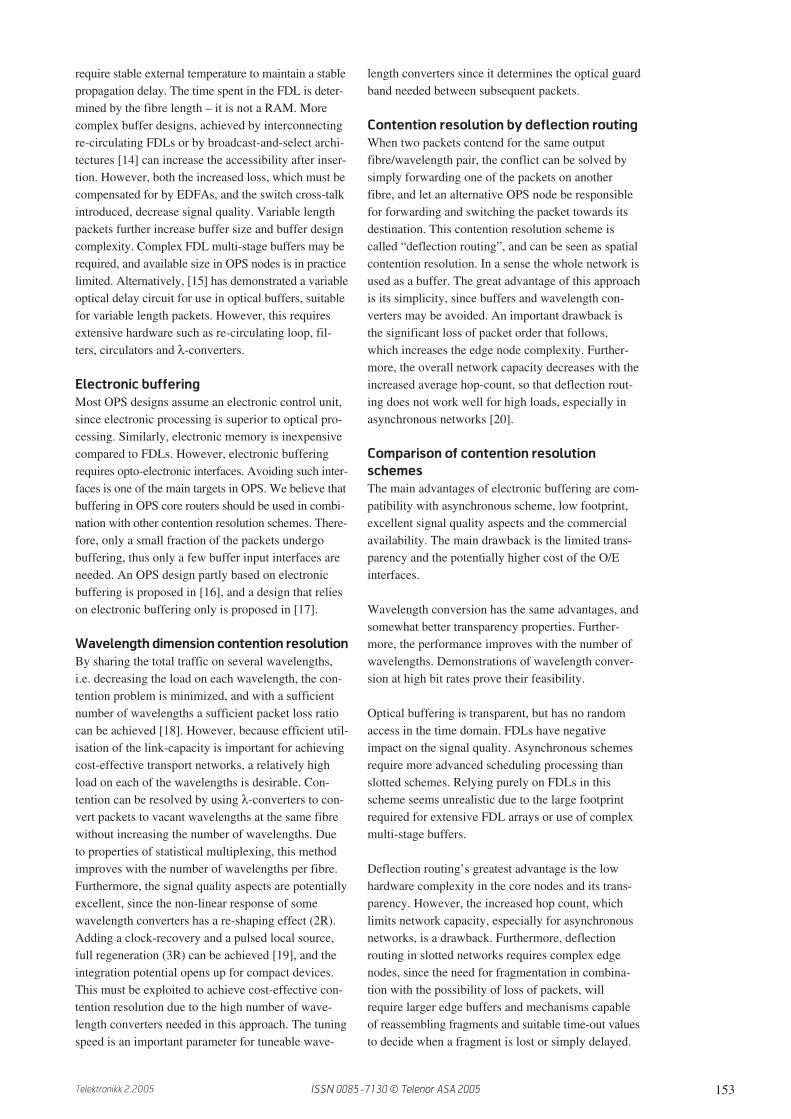
156 Telektronikk 2.2005
SimulationsThe aim of our simulations is to compare the perfor-mance of synchronous and asynchronous packetscheduling and fixed/variable length packet schemes.Furthermore, we analyse the basic characteristics ofa hybrid node. We do this by characterising packetdelay and packet loss. In our simulations we assumean optical packet switch using the wavelength dimen-sion for contention resolution in combination with aminimised number of electronic buffer inputs, asdescribed above and in [17]. Since the wavelengthdimension can be used for contention resolution, theswitch must be capable of doing wavelength-conver-sion. In this switch, full wavelength conversion isassumed, thus packets arriving at any input with anywavelength can be switched to any output and con-verted to any wavelength.
Since electronic buffering provides random accessin the time domain, packets that are buffered areallowed clocking in and out of the buffer at randomtimes. The switching matrix is assumed to be strictlynon-blocking, thus it avoids internal blocking.
Simulation parameters
We assume an optical switch with ‘N’ fibre inputs,each with ‘W’ wavelengths. We have used N * Windependent traffic generators, generating fixed orvariable length packets according to a Poisson arrivalprocess, corresponding to a load of 0.8 normalisedload. The traffic generators generate packets asyn-chronously. When simulating synchronous packetarrivals, packets are synchronised to discrete timeslots at the input, thereby causing a slotted operationof the packet switch.
Both the input and the output traffic are uniformlydistributed at the inputs and outputs, respectively.Since electronic buffering is assumed, the packets canstay in the buffer for an arbitrary period of time. Thebuffer size is set to 100 kB, which in our simulationsis sufficient to avoid additional packet loss due tobuffer overflow. Packets in the buffer are handledwith FIFO priority. We expect that the future trans-port network will employ links with high channel(wavelength) counts, but have approximately thesame node degree as we see in the networks of today.Therefore we have chosen to evaluate the perfor-mance of the switch in a backbone network with a
Figure 5 Node design with an optical cross connect (OXC) for the GST packets and an optical packet switchwith shared buffering for the SM packets. The GST packets are separated using a PBS for each of the wave-length inputs, before they are delayed through FDLs, cross connected and scheduled at the output. The OXCmay be static (hardwired) or dynamic, and may contain wavelength converters at the output for reducingblocking probability. FDL = Fibre Delay Line, W = number of link-wavelength. N = Number of link inputs,B = number of buffer inputs, s = W * n = number of switch inputs, PM = Polarization Maintaining coupler,APC = Automatic Polarisation controller, PC = Polarisation Controller
λW
Input
fiber Nλ1
N*W = ‘ s’ inputs
MUX
λ1
λW
Control electronics
Output
OPS
SM
PBS 1
PBS W
PBS W
PBS 1 OXC
GST
N*W detectors
λW
λ1
DMUX
DMUX
FDL
FDL
FDL
FDL
PM 1
PM W
PM 1
PM W
Buffer
1
B
1
B
Input
APC
APC PC
PC
PC
PC
1
s s
1
MUX
λ1
λW
1
s
SM
GST
SM
GST
SM
SM
GST
GST
Input
fiber 1Output
fiber 1
Output
fiber N
ISSN 0085-7130 © Telenor ASA 2005
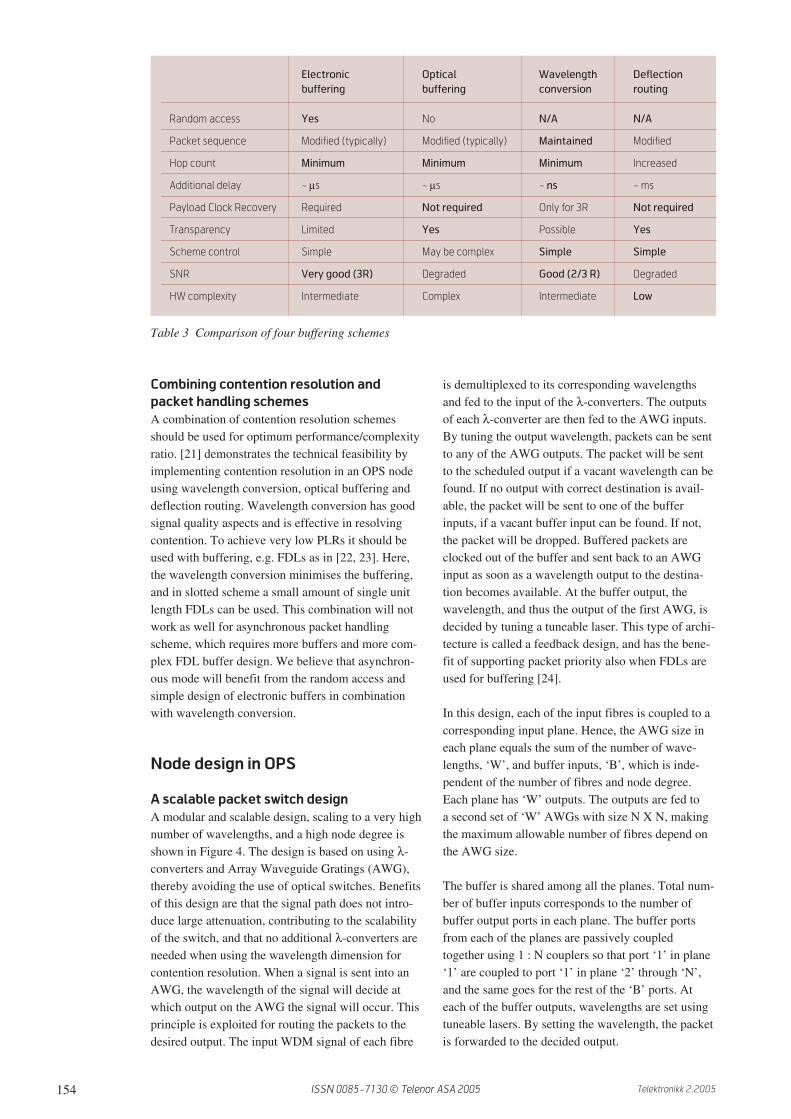
157Telektronikk 2.2005
node-degree of ‘8’ and a high link channel count,starting at 32. Performance is analysed varying bothnumber of buffer interfaces and channel count. In thecase of asynchronous operation, both fixed and vari-able packet length is evaluated. The fixed packetlength is 500 bytes, while the variable packet lengthdistribution is based on measurements of packetlengths in Internet [4]. It has the following distribu-tion, expressed in number of packet occurrences:40–44 bytes 62 %, 45–552 13%, 553–576 8 %,577–1500 17 %.
In [24] the mean delay is shown to decrease quicklyas the number of wavelengths increases. We find thesame tendency. The longest mean delay observed iswith 32 link channels, asynchronous packet arrivaland fixed packet length, where a delay as low as6.8 . 10-4 (+/- 7 . 10-5) of the duration of a packetis found. With moderate packet lengths of 500 bytes,and a bit rate of 10 Gbit/s, this corresponds to a 270ps mean delay. Transmission delay is therefore domi-nant and will be increasingly dominant as the linkchannel count increases. Packet loss is therefore themain topic in this analysis.
PLR performance electronic buffering;
Fixed versus variable packet length,
asynchronous operation
In our simulations, we have chosen to vary the num-ber of buffer interfaces. For a given link channelcount, this is the parameter to minimise since it is animportant cost factor that directly governs the PLR.In Figure 6 we have compared the performancebetween using fixed and variable length packets whenswitching asynchronously, assuming an electronicRandom Access in Time Memory (RATM) buffer.Results when varying both the number of wave-lengths and the number of buffer interfaces are shown.
Results for both fixed and variable length packets(VLP) are shown for 32 and 256 wavelengths. Forboth wavelength counts there is a marginal perfor-mance difference between performance of fixed andvariable packet lengths. The difference is close to orwithin the confidence interval. Since there is no syn-chronization mechanism at the inputs of the switch,packets do not arrive in distinct timeslots, causing lit-tle or no difference in performance when switchingfixed or variable length packets. Since the perfor-mance difference is small, we see it as beneficial touse VLPs, and therefore for the rest of this paperVLPs are assumed when switching is asynchronous.
As expected, packet loss is shown to decrease as thenumber of channels is increasing when keeping thenumber of buffer inputs at a constant level. This isdue to the wavelength dimension’s impact on con-
tention resolution. This implies that as the number ofchannels increases, the number of buffer inputs canbe decreased while maintaining an acceptable packetloss probability. When the number of link-wave-lengths reaches 256, 15 buffer inputs are sufficientto reach a packet loss probability better than 10-6. At256 wavelengths, a PLR of 3.2 . 10-5 is achievedwithout using buffers, hence with a sufficiently highnumber of wavelengths, an acceptable PLR can bereached without using buffering. This is confirmedin Figure 7, where results from simulations withoutbuffering are plotted. We see clearly that the slottedscheme achieves a better PLR. We also observe thatwhen the link channel count increases, the differencein packet loss performance between the two schemesincreases. At the most demanding PLR threshold of10-6, buffering very few packets is necessary. At 128channels per link, the highest packet loss probabilityis that of the asynchronous scheme, with a PLR of10-3. This implies that for this high channel countsystem, even this scheme will only need very limitedbuffering resources.
In Figure 8, the PLRs for the slotted and asynchron-ous scheme, for link channel counts of 32 and 128,are shown. When having 32 wavelengths in each link,a PLR of 10-6 can be achieved by using approximate-ly 50 and 24 buffer interfaces in the asynchronousand slotted schemes, respectively. Thus, the slottedscheme requires less than half as many buffer inputsas the asynchronous scheme. Assuming 128 wave-lengths in each link, these numbers decrease to 24and 14, respectively. The drastic decrease in requiredbuffer inputs, especially for the asynchronous scheme,indicates that the asynchronous approach becomesincreasingly attractive with the increasing number oflink wavelengths.
Figure 6 Packet loss ratio (Y-axis) as a function of number of bufferinputs (X-axis). Performance using fixed (broken lines), and variablelength packets (continuous lines) are compared. ‘W’ is the number ofwavelengths in each fibre, ‘F’ indicates fixed packet length. The errorbars mark the limits of a 95 % confidence interval. Where only theupper limit is given, the lower limit is lacking. Higher precision canbe achieved, making simulation time excessively long
1,0E-08
1,0E-06
1,0E-04
1,0E-02
1,0E+00
0 5 10 15 20 25 30 35 40 45 50 55 60 65
Number of buffer inputs
Pa
ck
et
loss r
ati
o
F32W
F256W
32W
64W
128W
256W
ISSN 0085-7130 © Telenor ASA 2005
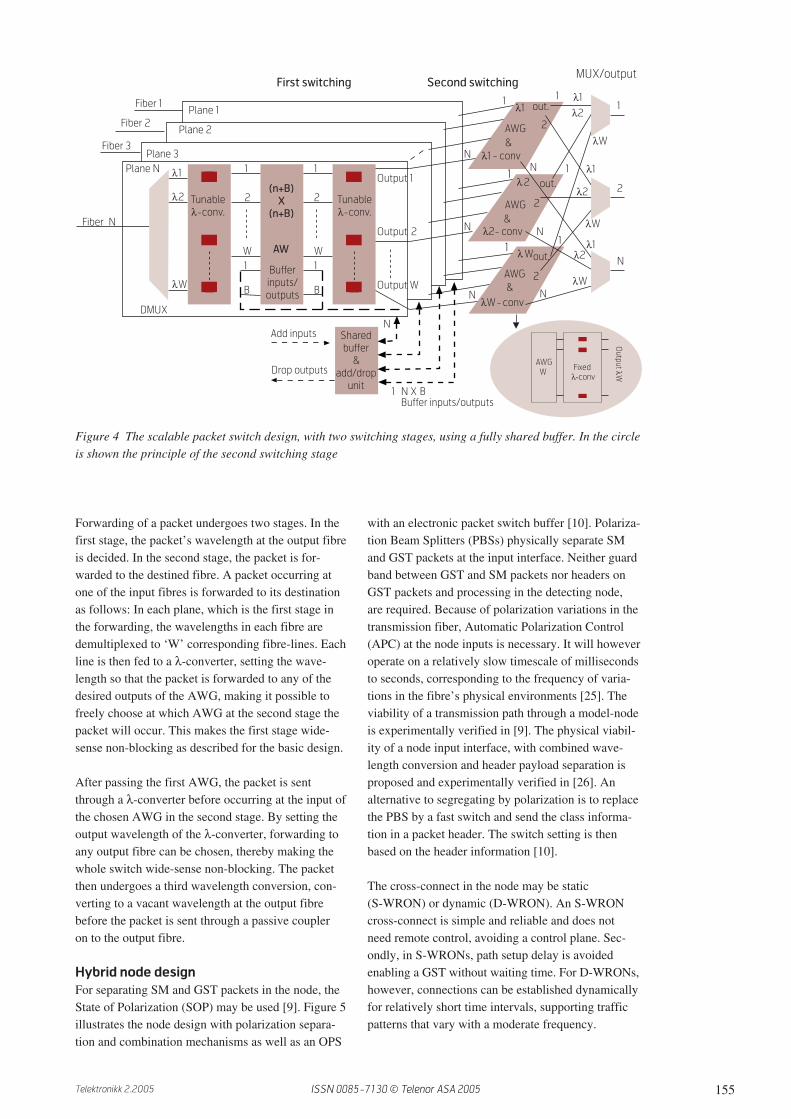
158 Telektronikk 2.2005
Figure 9 PLR and buffered packets delay of SM traffic as a function ofGST traffic share. B = 20 buffer inputs; GST relative packet length =100 times mean SM packet length; 1 . 108 packets simulated for each ofthe plotted values. The error bars indicate the 95 % confidence interval.Delay values are given relative to the duration of an SM packet withmean packet length
Pa
ck
et
loss r
ati
o
0,0E+00
2,0E-03
4,0E-03
6,0E-03
0 20 40 60 80 100
GST traffic share (%)
0
0,5
1
1,5
2
2,5Packet loss ratio
Delay
Performance of a hybrid node
The GST class is given absolute priority so that itsquality is given solely from physical parameters inthe WRON network, like transmission delay and sig-nal quality. The quality of the SM (= BE) traffic doeshowever depend on characteristics of the GST traffic,especially on the GST traffic share, which may typi-cally vary. To illustrate how the GST traffic share inan OpMiGua node influences the performance of theSM traffic, we have simulated Packet Loss Ratio(PLR) and buffered delay for the SM traffic. Weassume the node design shown in Figure 5 with a pas-sive OXC and an OPS consisting of a strictly non-blocking switching matrix and a limited number Bbuffer inputs. Parameters are as for the previous sim-ulations. The number of link wavelengths is W = 32.The switch experiences a uniform traffic distributionpattern from both the traffic classes. The GST packetsare forwarded to a fixed destination and wavelength,thereby avoiding congestion with other GST packets.
We have chosen to evaluate the performance of thesystem when the GST packet length is fixed. TheGST packet length is set to 100 times the mean SMpacket length, making overhead caused by the GSTpacket’s output reservation negligible. The long fixed-length GST packets correspond to an aggregation ofseveral, e.g. IP-packets in a fixed length container.
We assume the buffering to be randomly accessiblein the time domain, i.e. electronic buffering withina short time frame, and potentially optical memorywithin a longer time frame. Consequently, the packetscan stay in the buffer for an arbitrary period of time.However they are scheduled to an output as soon asa wavelength to the destination becomes vacant. ThePacket Loss Ratio (PLR) and delay results are plottedin Figure 9.
There are two counteracting effects impacting on thePLR. First, the GST packets are given absolute prior-ity and as the GST traffic share increases, the lowerpriority SM traffic is increasingly penalized, resultingin an increase in PLR. On the other hand, as the GSTtraffic share increases, the remaining SM traffic sharegets a relatively higher share of buffering resourcesavailable, resulting in a decrease in PLR. In Figure 9we find that for low GST traffic shares of up to 30 %,the first effect is dominating, resulting in an increasein PLR. As the GST traffic share increases, the sec-ond effect becomes dominant and the PLR decreasessignificantly. For 90 % GST, no packet loss wasobserved for the 1 . 108 packets that were simulated.This indicates that given a specific PLR requirement,packet switch resources may be reduced if GST traf-fic shares are high.
Figure 7 Packet loss as a function of number of link channel counts.No buffering has been used in the simulations. Results are shown for theasynchronous and the slotted schemes. The error bars mark the limitswithin a 95 % confidence interval. When only the upper limit is given,lower limit is inadequate because it is less than 0. Higher precision canbe achieved, making simulation time unduly long
Figure 8 PLR as a function of number of buffer interfaces. Results areshown for asynchronous variable packet length and slotted scheme with32 and 128 wavelengths (W) per link
Pa
ck
et
loss r
ati
o
1,00E-06
1,00E-04
1,00E-02
1,00E+00
0 32 64 96 128 160 192 224 256 288
Wavelengths pr link
Synchronous
Asynchronous
Pa
ck
et
loss r
ati
o
1,0E-08
1,0E-06
1,0E-04
1,0E-02
1,0E+00
0 5 10 15 20 25 30 35 40 45 50 55 60 65
Number of Buffer interfaces
Asynchronous 32W
Asynchronous 128W
Slotted 32W
Slotted 128W
ISSN 0085-7130 © Telenor ASA 2005

159Telektronikk 2.2005
The GST induced contention on SM packets in-creases with increasing GST traffic share. Conse-quently, the delay increases because buffered packetswill wait longer before a wavelength becomes vacant.In the delay values in Figure 9, the clocking of thepackets into the buffer is not accounted for. This cor-responds to a cut-through solution, where packets canbe clocked out of the buffer while they are still beingclocked in. If such a solution is not available, one unitof delay must be added. The magnitude of the delayvalues indicates that packet reordering within a wave-length channel will occur. However, the bit-rate of awavelength channel is typically in the order of 10Gb/s. If the packets of an application are multiplexedevenly into the wavelength channel, e.g. for a 100Mb/s application, every 100 packet in the wavelengthwill belong to the application. With mean delay val-ues below 1.5 mean SM packet duration, packetreordering will therefore be of low probability.
ConclusionThere seems to be a convergence of the optical packetswitching and optical burst switching concepts whenit comes to packet/burst handling and contention res-olution. Acceptable loss rates as well as QoS differ-entiation can be achieved in both concepts. In gen-eral, we see OBS as a first step towards a realdynamic network, with OPS as the ultimate goal.The hybrid network combines circuit switching witheither packet- or burst switching. This concept allowsguaranteed service with no packet loss and fixeddelay, throughput efficiency of statistical multiplex-ing, and bypassing of transit traffic through a WRONnetwork allowing smaller packet switches. A hybridnetwork can be implemented today, combining elec-tronic packet switches with optical circuit switches.Furthermore it enables a migration path towards thetechnology found most beneficial for the future, beit a pure OPS network or the hybrid combinationincluding an OPS as part of the hybrid node.
The optical packet switch designs discussed in thispaper all rely heavily on wavelength conversion, andalso on relatively large AWGs. Hence, for thesedesigns to become attractive it is crucial that thementioned components become cost effective.
Since the complexity of optical buffering is regardedas the chief argument against optical packet switch-ing, we have compared buffering techniques andevaluated their performance in slotted and asyn-chronous mode. We conclude that optical packetswitches using FDLs is an attractive solution if thenumber of wavelengths in each link is low and thebitrate at each wavelength is too high for electronicprocessing/buffering. In this case, the slotted scheme
appears to be advantageous, as it reduces the com-plexity of FDL based buffers.
However, if extensive use of wavelength divisionmultiplexing is preferred, and the bitrate at eachwavelength is sufficiently low to be processed elec-tronically, electronic buffering appears advantageous.Only a very small number of electronic buffer inter-faces are necessary to obtain sufficient performance,even when using the asynchronous scheme.
For high capacity optical packet switches, capable ofhandling several Tbit/s, it is our view that the limitedincrease in buffering required for the asynchronousscheme is less complex than the slotted scheme’srequirements for network synchronisation, opticalpacket alignment, and electronic edge reassembly.
Therefore, the most viable optical packet switchednetwork design could employ an asynchronous, vari-able packet length handling scheme, with packetswitches using a combination of wavelength conver-sion and electronic random access memory for con-tention resolution. For even higher link wavelengthcount, we expect that buffering will not be required,and the network will become transparent.
AcknowledgmentsThanks to Telenor R&D and the Research Council ofNorway (NFR) for financial support for this work.
References1 Next Generation Optical Networks for Broadband
European Leadership. March 15, 2005 [online] –URL: http://www.ist-nobel.org/Nobel/servlet/Nobel.Main?seccio=3_1
2 Vlachos, K et al. An Optical IM/FSK CodingTechnique for the Implementation of a Label-Controlled, Arrayed Waveguide Packet Router.In: IEEE Journal of Lightwave Technology, 21(11), 2617–2628, 2003.
3 Bjørnstad, W, Gauger, C, Nord, M (eds). Chapter4, Optical Burst Switching and Optical PacketSwitching. In: Extended Final Report of CostAction 266, Advanced Infrastructure for PhotonicNetworks. Inkret, R, Kuchar, A, Mikac, B (eds).Croatia, University of Zagreb, Faculty of Electri-cal Engineering and Computing, 2003. [URL:www.ure.cas.cz/dpt240/cost266/index.html]
4 Claffy, K, Miller, G, Thompson, K. The nature ofthe beast: Recent traffic measurements from anInternet backbone. Proc. INET’98, 1998.
ISSN 0085-7130 © Telenor ASA 2005

160 Telektronikk 2.2005
5 Technical Committee Telecommunications COST266, workgroup 2, Advanced Infrastructure forPhotonic Networks, Optical Packet and Burstswitching Report. (ed. S Bjørnstad) Chapter 4. (MNord). Analysis of required switching times andidentification of suitable switching technologiesin optical packet switching. http://www.ure.cas.cz/dpt240/cost266/ or available on request.
6 Yoo, M, Jeong, M, Qiao, C. A High Speed Proto-col for Bursty Traffic in Optical Networks. In:SPIE’s All-Optical Communication Systems,3230, 79–90, 1997.
7 Nord, M, Bjørnstad, S, Gauger, C. OPS or OBS inthe Core Network? Proc. of ONDM conference,Jan 2003, Budapest.
8 Packet switched hybrid optical networks. Bjørn-stad, S, invited paper. In: Proceedings of Interna-tional Conference on transparent optical networks2004 (ICTON 2004), July 5-8, Wrocklaw, Poland.
9 Bjørnstad, S, Nord, M, Hjelme, D R. QoS differ-entiation and header/payload separation in opticalpacket switching using polarisation multiplexing.Proceedings of ECOC 2003, Mo3.4.6, 28–29.
10 Bjørnstad, S, Hjelme, D R, Stol, N. A highly effi-cient optical packet switching node design sup-porting guaranteed service. Proceedings of ECOC2003, Mo4.4.5, 110–111.
11 Van Breusegem, E, Cheyns, J, Colle, D, Pickavet,M, Demeester, P. Overspill Routing In OpticalNetworks: a new architecture for future-proof IPover WDM networks. OptiComm 2003, Dallas(TX, USA), Oct. 2003.
12 Hansen, P B, Danielsen, S L, Stubkjaer, K E.Optical packet switching without packet align-ment. Proc. ECOC’98, Madrid, Spain, 1998,591–592.
13 Haas, Z. The ‘staggering switch’: An electroni-cally controlled optical packet switch. JLT, May1993, 925–936.
14 Guillemot, C et al. Transparent Optical PacketSwitching: The European ACTS KEOPS ProjectApproach. In: IEEE Journal of Lightwave Tech-nology, 16 (12), 2117–2133, 1998.
15 Sakamoto,T et al. Variable optical delay circuitusing wavelength converters. In: Electronic Let-ters, (37) 7, 454–455, 2001.
16 O’Mahony, M J et al. The application of opticalpacket switching in future communication net-works. In: IEEE Communication Magazine, (39)3, 128–135, 2001.
17 Bjørnstad, S, Hjelme, D R, Stol, N. An opticalpacket switch design with shared electronic buffer-ing and low bit rate add/drop inputs. In: Proc. ofIEEE ICTON, Mo.C.6, Warzaw, April 2002.
18 Danielsen, S L, Joergensen, C, Mikkelsen, B,Stubkjaer, K E. Optical Packet Switched NetworkLayer Without Optical Buffers. Photonics Tech-nology Letters, 10 (6), 1998.
19 Lavigne, B. All-optical 3R regeneration based onsemiconductor technology. In: Proc. of PIS,TuA1, Cheu Island, Korea, July 2002.
20 Yao, S, Mukherjee, B, Yoo, S J B. ElectricalIngress Buffering and Traffic Aggregation forOptical Packet Switching and Their Effect onTCP-Level Performance in Optical Mesh Net-works. In: IEEE Communications Magazine,66–72, Sep 2002.
21 Yoo, S J B et al. Optical-Label based PacketRouting System with Contention Resolution inWavelength, Time and Space Domains. In: Proc.of OFC’02, WO2, Anaheim, March 2002.
22 Callegati, F, Corazza, G, Raffaelli, C. Exploita-tion of DWDM for Optical Packet Switching withQuality of Service Guarantees. In: IEEE JournalOn Selected Areas in Communications, 20 (1),190–201, 2002.
23 O’Mahoney, M J et al. An optical packetswitched network (WASPNET)– concept andrealization. In: Optical Networks Magazine,46–53, Nov/Dec 2001.
24 Chia, M C et al. Packet Loss and Delay Perfor-mance of Feedback and Feed-Forward Arrayed-Waveguide Gratings-Based Optical Packet SwitchesWith WDM Inputs–Outputs. In: IEEE Journal ofLightwave Technology, 19 (9), 1241–1244, 2001.
25 Nicholson, G et al. Polarization Fluctuation Mea-surements on Installed Single-Mode Optical FiberCables. In: IEEE Journal of Lightwave Technol-ogy, 7 (8), 1989.
26 Nord, M, Bjørnstad, S, Nielsen, M L, Dagens, B.Demonstration of optical packet switching schemefor header-payload separation and class-based for-warding. OFC 2004, TuQ2, March 22–27.
ISSN 0085-7130 © Telenor ASA 2005
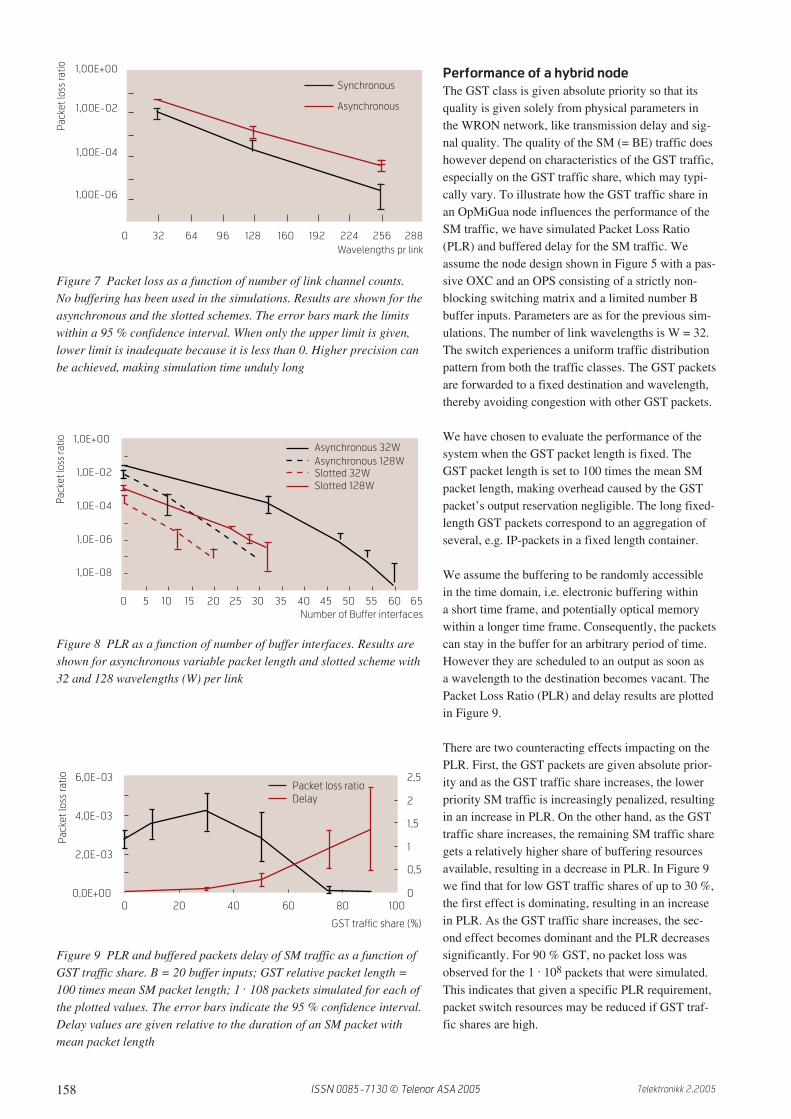
161Telektronikk 2.2005
Steinar Bjørnstad received his MSc in electronics from the Institute of Physics, University of Oslo in 1991,
and his PhD in telecommunication from the Institute of Physical Electronics at the Norwegian University of
Science and Technology (NTNU) in 2004. He worked with electronic design at Ring-Master 1991–1995
and at NERA Contec Design 1995–1996. He was then with Telenor R&D as Research Scientist on optical
communication until 2005, when he started work as Associate Professor at the Institute of Telematics at
NTNU, and as Senior System Architect on transport networks at Canal Digital. His interests include optical
communication systems and networks, systems for television broadcasting, quality of service aspects of
networking, discrete event modelling, electronic design and electromagnetic compatibility. He has managed
several research projects and been active in several projects funded by the EU within the ACTS, IST and COST
programs. He has authored and co-authored a number of papers, and has currently three patents pending.
email: [email protected]
Dag-Roar Hjelme is Chief Scientist at Optomed and Adjunct Professor at the Department of Electronics and
Telecommunication, NTNU, both Trondheim. He earned his Siv.Ing. degree in Electrical Engineering from
the Norwegian Institute of Technology (NTH), Trondheim, and his PhD in Electrical Engineering from the
University of Colorado, USA. Prior to joining Optomed he was Senior Research Scientist at the Department
of Photonics, SINTEF Electronics and Cybernetics, where he managed research projects on optical sensor
technology and optical communication systems. After receiving his PhD he was Post-Doctoral Research
Associate and later Staff Scientist at the University of Colorado, where his research focused on semicon-
ductor lasers, integrated optics, microwave optics, and fiber optic systems. He is the author and co-author
of more than 30 refereed journal papers and 70 conference presentations. He is co-inventor of six inter-
national patents. Dr. Hjelme is a member of the Norwegian Academy of Technological Sciences.
email: [email protected]
For a presentation of Norvald Stol, please turn to page 146.
Martin Nord received MSc degrees from the University of Essex and Institut National des Sciences
Appliquées de Toulouse in 2000. He subsequently started working as a research scientist for Telenor R&D
on optical networking. From 2002 to 2005 he pursued PhD studies on performance aspects and physical
realisation of optical packet switched networks at the Research Center COM, Technical University of
Denmark. His current research for Telenor R&D targets broadband network architectures for core-, metro-
and access networks.
email: [email protected]
Torodd Olsen is a Research Scientist at Telenor R&D and has been working in the field of optical commu-
nications since 1986, including participation in several projects of the EU-funded ACTS and IST programme.
He received his higher national diploma in electronics from Østfold Technical College, Sarpsborg, Norway
in 1976. He is currently involved in project management and support, and recent contributions feature
techno-economical studies of optical networking technologies.
email: [email protected]
ISSN 0085-7130 © Telenor ASA 2005
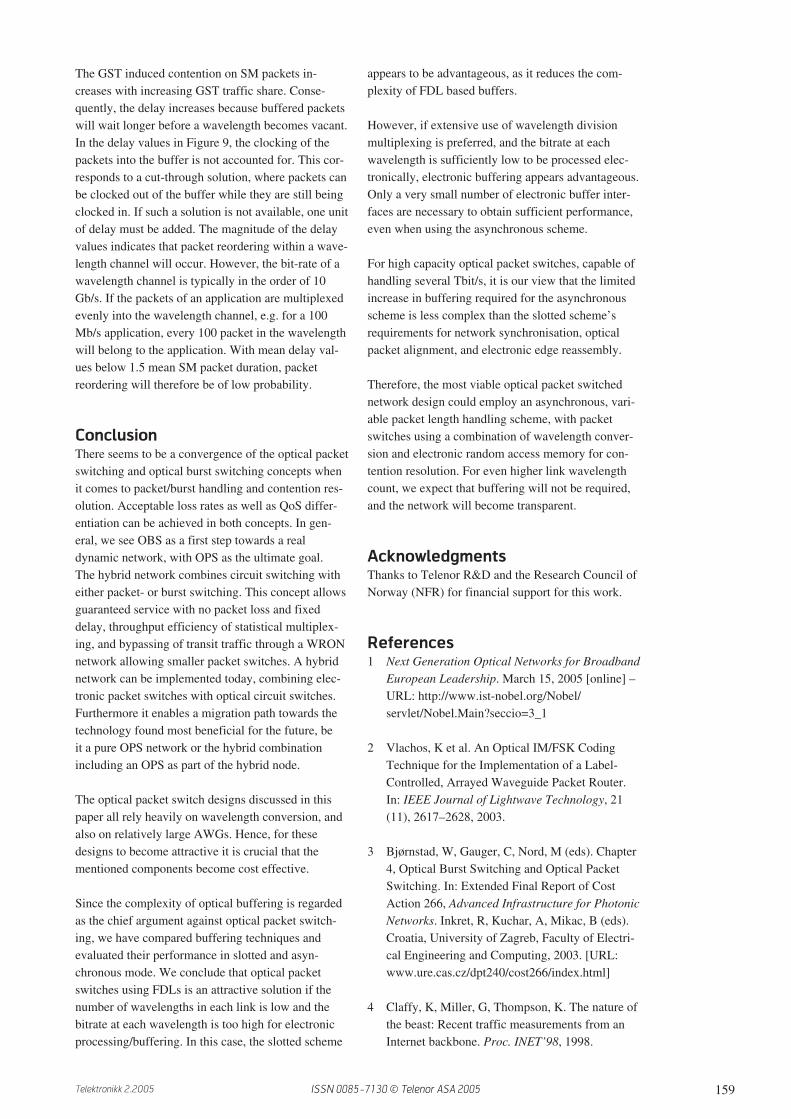
162 Telektronikk 2.2005
1 Background
1.1 Rationale for undertaken work
The extended use of wavelengths in the range 1260 nmup to nearly 1700 nm for WDM optical transmissionhas received considerable attention in the later years.Responding to this interest, the leading standardisa-tion body ITU-T has defined a continuous opticalspectrum from 1260 nm to 1675 nm as listed inTable 1. Up to now, the ITU-T does not consider theU-band to be suitable for transmission, due to ex-pected high losses.
In so-called Coarse Wavelength Division Multiplex-ing (CWDM), where the spacing between evenly dis-tributed channels is approximately 20 nm, one cer-tainly foresees to use the whole span approved byITU.
As for Dense Wavelength Division Multiplexing(DWDM), wavelengths through the S-, C- and L-band are for the moment considered to be optimal,but clearly also other wavelength bands can be takeninto use.
Figure 1 shows the intended wavelength allocation ofCWDM and DWDM relative to a typical optical fibreattenuation spectrum.
The majority of installed cables up to now, at least asfar as the traditional operators including Telenor areconcerned, have contained standard G.652-fibres.In the Telenor case 100 % have been standard G.652fibres.
Optical fibre cables with standard G.652-fibres havecut-off values of approximately 1260 nm, and arethus able to transmit this large wavelength span. Thefibres also have dispersion values of some positivemagnitude from around 1300 nm and upwards, which
Revealing the wide spectrum installed fibre cable loss inTelenor’s network
S V E N D H O P L A N D
Svend Hopland
is Chief Engineer
at Telenor
Nordic Fixed
By performing extensive measurements on installed single mode fibre cables in Telenor’s network, we
have revealed statistical values for fibre attenuation and splice loss in cables with standard G.652
fibres from different time periods. Data are provided at six different wavelengths in the 1241–1642 nm
wavelength range. A mathematical model has been derived for the continuous full spectrum fibre
attenuation and used to fit the field data. As a result, total link loss statistics for the installed cables
have been calculated at the 16 different CWDM wavelengths.
The main observations are that average fibre attenuation, splice loss and their standard deviations
have decreased significantly at all wavelengths since the late 1980s. In particular, fibre attenuation
at the water peak at 1383 nm has decreased dramatically. In cables installed after 2000, the fibre
attenuation and splice loss are very low in the entire wavelength range 1260–1675 nm.
The present levels of hydrogen due to corrosion of armour wires in a limited number of old underwater
cables without hydrogen barrier do not result in significant additional loss in major parts of the trans-
mission bands. Long term field measurements and high temperature accelerated tests have shown
that the hydrogen levels in these cables have stabilized after 8–10 years and will decrease during the
next 20–30 years.
Extensive testing of duct cables have shown that temperature induced loss will not occur in installed
cables for wavelengths up to 1675 nm. Additional loss due to tension and crush will not occur provided
the cables have been installed properly. The field measurements have provided evidence for the test
results.
Band designation Wavelength [nm]
O 1260 – 1360
E 1360 – 1460
S 1460 – 1530
C 1530 – 1565
L 1565 – 1625
U 1625 – 1675
Table 1 ITU-T band designations for continuousoptical spectrum from 1260 nm to 1675 nm
ISSN 0085-7130 © Telenor ASA 2005
163Telektronikk 2.2005
is necessary to reduce non-linear effects in DWDM-systems. It is thus possible to use this fibre type forDWDM in a very broad wavelength range.
Fibre production methods as well as fibre cableconstructions and fibre splicing techniques have im-proved since the late 1980s, resulting in a historicalchange of the installed fibre cable loss spectrum.However, in practice, a link is only routinely mea-sured shortly after installation at one specific wave-length, usually at 1550 nm using OTDR equipment.Hence the magnitude of fibre attenuation and spliceloss are provided at reasonably low cost and givesalso an indication of the link loss in the C-band(1535–1565 nm). Obviously, other parts of the spec-trum remain unknown.
This is the reason why very little wide spectrumdata exist worldwide from actual field installations.Telenor has recently performed extensive field mea-surements with corresponding data analysis and curvefitting procedures to provide wide spectrum data oninstalled cables from different time periods. Thiswork has for the first time revealed accurate and reli-able field data [1] [2] [3] [4] [5].
Supplementary to the field measurements, Telenorhave performed extensive fibre cable testing to inves-tigate possible additional losses due to installed cableenvironmental conditions such as temperature, ten-sion and crush [6].
1.2 Fibre and cables used by Telenor
The fibres used in Telenor’s cables are StandardG.652 with fibre cut-off values in the 1190 nm –1330 nm range. The installed cables consist of fibresin stranded loose tubes or in a central steel tube sur-rounded by different kinds of protection and tensionmembers to form duct, aerial and underwater cables,respectively.
1.3 Factors affecting the spectral loss
In principle, the total fibre attenuation in an installedcable link in the 1200–1750 nm wavelength regionconsists of contributions originating from fibre pro-duction as well as contributions originating from thecable itself. The intrinsic fibre loss is expected todominate the overall fibre cable loss. After installa-tion, however, environmental factors such as temper-ature, crush and tension, or hydrogen intrusion, maycause additional attenuation in the cabled fibres.Fibre splices, including the bending of fibres in orga-nizers will also add to the total loss.
1.3.1 Fibre intrinsic attenuation
The fibre intrinsic attenuation is composed of threebasic mechanisms:
• Rayleigh scattering loss at the lower wavelength end;• Water (OH–) absorption loss with its peak at
1385 nm;• Infrared (IR) absorption loss at longer wavelengths.
The Rayleigh loss is caused by scattering of light bythe fibre core glass molecules. It is dominant at lowerwavelengths and decreases with increasing wave-length. The so-called “water peak” is caused by OH–
hydroxyl ions originating from the fibre productionprocess and has its maximum value at 1385 nm. Theinfrared absorption is caused by glass molecularvibrations within the fibre core. It increases withincreasing wavelength and becomes dominant atlonger wavelengths.
Each of these contributions exhibit variations dueto variations in fibre production parameters. Specifi-cally, the water peak may vary significantly from onefibre manufacturer to another, from production toproduction, and even during the same production.Moreover, it has shown a historical evolution towardsgenerally lower values.
1.3.2 Cable induced attenuation
Bend loss
During installation and through the cable lifetime,environmental factors such as temperature, tensionand crush may cause additional attenuation in thecabled fibre. The origin of this loss is different typesof bending of the fibres inside the cable structure.Generally, all bending loss increases with increasingwavelength and moreover, the different bending typeshave different wavelength dependencies.
Figure 1 Typical fibre attenuation spectrum and relative to the use ofCWDM and DWDM
1200 1250 1300 1350 1400 1450 1500 1550 1600 1650 1700
0.00
0.10
0.20
0.30
0.40
0.50
0.60
0.70
0.80
0.90
O E L US C
Water peak
DWDM
CWDM
Fib
er
att
en
ua
tio
n (
dB
/k
m)
Wavelength (nm)
ISSN 0085-7130 © Telenor ASA 2005

164 Telektronikk 2.2005
Hydrogen induced losses
In cables with metallic armouring such as underwatercables, hydrogen will be generated due to corrosionof the armouring wires and hydrogen molecules maydiffuse into the cable core and eventually into thefibres. As a result, the fibre attenuation increasesaccording to a specific wavelength dependent absorp-tion pattern. This can be prevented if a hermetichydrogen barrier is used between the armouring andthe fibres. Except for a limited amount of underwatercables in the late 1980s, Telenor has installed under-water cables including hydrogen barriers.
Fibre splices in cable
Fibre fusion splices along the installed cable includ-ing the bending of fibres in splice organizers willcause additional wavelength dependent loss.
2 Measurement methods used forwide spectrum
2.1 Spectrum analyser
In the field measurements as well as in the cable testmeasurements, we have used a white light source anda spectrum analyser to measure the continuous spec-tral loss curve of individual fibre paths from 1200 nmto 1750 nm.
This method integrates all losses between input andoutput connector and it is not possible to distinguishbetween fibre attenuation and splice loss. However,the detailed form of absorption peaks such as OH andmolecular hydrogen may be revealed. Spectral mea-surements are rather difficult and time consuming toperform. They require careful data analysis, and arenot highly accurate. Both ends of the cable have to beaccessed during measurement. In practice, the maxi-mum fibre length that could be measured by thismethod is approximately 8–10 km.
2.2 Optical Time Domain Reflectometry
(OTDR)
An OTDR measurement is a single wavelength mea-surement utilizing the signature of backscattered laserlight along the fibre length. Only one end has to beaccessed during measurements, and fibre lengths upto 100 km can easily be reached. Data analysis maybe automated and fibre attenuation length distributionand splice losses can easily be separated and mea-sured with high accuracy.
If multiple OTDR wavelengths are used to measurethe same fibre length, it is possible to deduct the fullfibre attenuation spectrum for individual fibre lengthsbetween splices using a mathematical curve fittingmethod [2]. It is however required that the OTDR
wavelengths are distributed in a certain strategicpattern over the full optical spectrum.
3 The basic field measurements
3.1 Methodology
In the field we performed OTDR measurements onsix different wavelengths: 1241 nm, 1310 nm,1383 nm, 1550 nm, 1625 nm and 1642 nm. A cou-pling fibre of approximately 1 km was used at themeasurement end. Normally, we would measurecable sections that could be reached end-to-end at allwavelengths. The sections were measured from bothends in order to calculate the splice losses. As a gen-eral rule we only used individual fibre attenuationdata measured on fibre lengths longer than 1 km inorder to obtain high measurement accuracy.
For each section, fibre attenuations for individualfibre lengths between splices as well as splice losswere analysed and calculated for all wavelengths.Subsequently, loss statistics for fibre attenuation andsplice loss were produced.
The cables included in the measurements are basi-cally duct cables and some underwater cables.
In the late 1980s, Telenor installed some underwatercables without hydrogen barrier, which resulted insome limited hydrogen ingress into the fibres. Thehydrogen induced losses stabilized after a few yearsat low levels at 1310 nm and 1550 nm [6] [7] [8].Using cables with hydrogen barriers since 1992, allH2-induced peaks have been removed, and the lossvalues at all wavelengths are expected to be similarto duct cables. Investigation of hydrogen levels andfield measurements of spectral loss in old underwatercables are treated separately in Chapter 5. We havenot included any old underwater cables in the basicfield measurements.
3.2 Results
3.2.1 Fibre attenuation
In Figure 2, the fibre attenuation average values andstandard deviations are summarised. The most impor-tant observations are:
• Average values decrease at all wavelengths withtime, in particular at the water peak.
• In 2003 cables the average value at 1383 nm is0.346 dB/km, which is nearly as low as the averagevalue at 1310 nm (0.336 dB/km).
ISSN 0085-7130 © Telenor ASA 2005
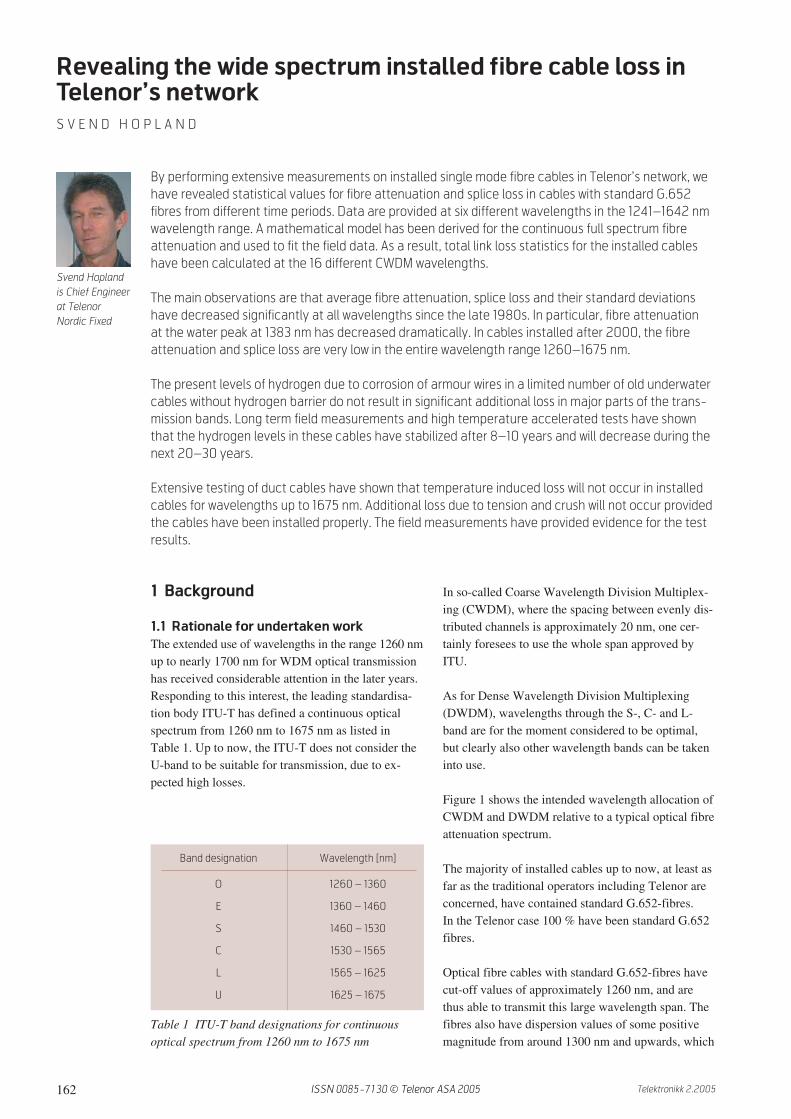
165Telektronikk 2.2005
• The average value at 1625 nm is 0.023 dB/kmhigher than at 1550 nm in cables from before 1990,and only 0.013 – 0.014 dB/km higher in the newercables.
• The average value at 1642 nm is 0.016 dB/kmhigher than at 1625 nm and in cables from before1990, and only 0.012 – 0.014 dB/km higher in thenewer cables.
• Not surprisingly, the standard deviation is muchlarger at the water peak than at other wavelengths.
3.2.2 Splice loss
Figure 3 shows the average splice loss and standarddeviation versus wavelength for cables installedbefore 1990 and around 2000. Splice loss in cablesinstalled in 2003 has not been measured yet, but wemay assume that splice loss is of the same magnitudeor lower than in 2000 cables.
Important observations are:
• Splice loss has generally decreased at all wave-lengths from around 0.1 dB to less than 0.05 dBfrom 1990 to 2000.
• In newer cables, splice loss decreases with increas-ing wavelength up to 1625 nm. A very small andinsignificant increase is noted at 1642 nm.
3.2.3 Total loss
The total link loss is calculated by adding fibre atten-uation and splice loss. A typical distance betweensplices may be from 1 km up to 4–6 km, dependingon the cable type and method of installation. There-fore, different distances between splices should betaken into account when calculating the total loss.
Figure 4 Fibre and splice loss for different time periods with 2 kmbetween splices
Figure 2 Fibre attenuation and standard deviation for different time periods
Figure 3 Splice losses and standard deviations versus wavelength fordifferent time periods
1250 1350 1450 1550 1650
0.00
0.04
0.08
0.12
0.16
0.20
1250 1350 1450 1550 1650
0.20
0.40
0.60
0.80
Wavelength (nm)
Av
era
ge
fib
re a
tte
nu
ati
on
(d
B/k
m)
before year 1990
year 2000
year 2003
before year 1990
year 2000
year 2003
Wavelength (nm)
FIi
bre
att
en
ua
tio
n s
tan
da
rd d
ev
iati
on
(d
B/k
m)
before year 1990
year 2000 and later
0.12
0.10
0.08
0.06
0,04
0.02
0.00
0.12
0.10
0.08
0.06
0,04
0.02
0.00
1350 1450 1550 1650
Wavelength (nm)
Av
era
ge
sp
lic
e l
oss (
dB
)
Sta
nd
ard
de
via
tion
(dB
)
before year 1990
year 2000
year 2003
1250 1350 1450 1550 1650
0.20
0.40
0.60
0.80
1.00
Fib
er
& s
pli
ce
lo
sse
s (
dB
/k
m)
2 km between splices
average value
worst cast
upper limit
Wavelength (nm)
ISSN 0085-7130 © Telenor ASA 2005
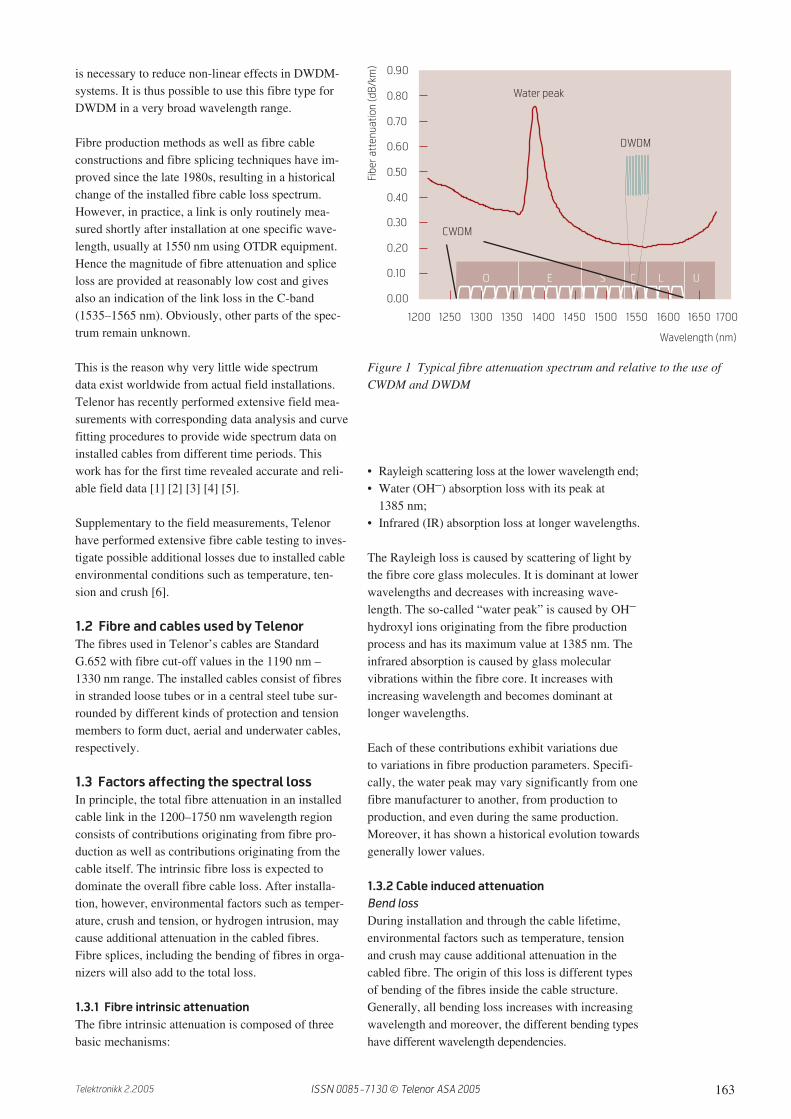
166 Telektronikk 2.2005
Depending on the number of cable lengths splicedtogether, the fibre attenuation and splice loss in a linkare averaged to a certain extent. Therefore, the pre-dicted link loss value will be somewhere between theaverage value and the average value plus the standarddeviation.
The upper limit (worst case) of the total loss at eachwavelength, is calculated using the equation:
Total loss (λ) = ave(fibre att.) + ave(spl.loss) +stdev(fibre att.) + stdev(spl.loss) (3.1)
The results based on equation (3.1) are illustrated inFigure 4.
4 Extension of basic fieldmeasurements
4.1 Methodology
The previous section have given statistical results forfibre attenuation at fixed wavelengths; however, fibreattenuation values in the gaps between the OTDR-wavelengths still remain unknown. To solve thisproblem we have tried to find a mathematical modelfor the full spectrum fibre attenuation in the field. Wehave investigated a number of spectral field measure-ments performed on our installed cable base; in par-ticular, we have isolated and studied in detail thewater peak absorption in order to reveal the detailedform of the water peak.
The derived mathematical model for total fibre atten-uation has been applied on the 6-wavelength data setsand full spectrum fibre attenuation has been calcu-lated for all measured fibre lengths using an auto-mated mass curve fitting procedure. Accordingly, wehave been able to calculate statistical parameters forfibre attenuation at any wavelength of interest forcables installed in different time periods. An empiri-cal model has been used to estimate splice loss versuswavelength in order to include them in link loss cal-culations.
Using this method we are able to present statisticalparameters for total link loss including fibre attenua-tion and splice loss at all the CWDM wavelengths oninstalled cables with standard G.652 fibres from dif-ferent time periods. We can also present estimatedfibre attenuation values in the region 1650–1675 nmbased on the curve fittings. This method can be usedto give information of fibre attenuation and link lossesat any wavelength of interest in cables installed at dif-ferent time periods. The method will be described inthe following chapters.
4.2 Mathematical model for fibre
attenuation
The total fibre attenuation in an installed cable lengthin the wavelength region 1200–1700 nm consists ofcontributions originating from fibre production aswell as contributions originating from the cable itself.
The spectral loss of cabled fibre can be expressed as:
α = αR + αOH + αIR + αUV + αH2 + αbend (4.1)
where αR is the Rayleigh scattering loss, αOH is theOH– absorption loss, αIR is the infrared absorptionloss, αH2 is hydrogen induced loss caused by mole-cular hydrogen ingress from cable materials such asarmouring, and αbend is bend loss due to cable envi-ronmental conditions such as low temperature, fibretension or impact/crush in the cable.
The Rayleigh loss is proportional to λ-4 and the fol-lowing relationship is assumed:
(4.2)
The infrared molecular vibration absorption is givenby:
(4.3)
where B and C are constants.
αUV , the absorption loss by the UV tail of the germa-nium doping can be ignored because it is very small.
Hydrogen intrusion only exists in a limited number ofTelenor’s old underwater cables, and the OTDR mea-surements used for curve fitting have not includedsuch cables. Therefore, αH2 can be ignored.
Bend loss increases with increasing wavelength andis not easy to distinguish from other fibre loss. How-ever, field measurements by OTDR at 1625 nm and1642 nm have indicated that bend losses are verysmall in Telenor installed cables [1]. In addition,extensive testing of the cables has confirmed thatbend loss due to low temperature or fibre tension /cable crush is not likely to occur in Telenor’s fieldinstallations [6]. Therefore, αbend can be ignored.
4.3 Model for water peak derived from field
measurements
The OH absorption spectrum is an important lossfactor, especially in the older installations where thepeak value is high. We have measured spectral losscurves from 1200 nm to 1750 nm in a number ofinstallations of different age and different cable typesand the detailed spectral characteristics of the water
αR = A ·
1
λ4
αIR = B · e−
C
λ
ISSN 0085-7130 © Telenor ASA 2005
167Telektronikk 2.2005
peak have been investigated. An OH– spectrumderived from a spectral measurement of a duct cableinstalled in 1988 is shown in Figure 5.
We have found that all OH– absorptions revealed inthis investigation can be adequately represented bythree Gaussian absorption components, giving anaccurate description of the total absorption.
The general expression for the OH– absorption isgiven by:
(4.4)
where A, B, C, D, E, F, G, H and I are constants.
We have isolated a number of OH– absorptions takenfrom cable installations from different time periodsand normalized them in order make a qualitative andquantitative comparison. As shown in Figure 6, dif-ferent curve forms have been revealed. However, it isevident that the differences mainly occur at the edgesof the absorption band in the wavelength region1410–1480 nm. For small OH peaks, the effect ofthese variations on the total loss will be minor.
We have selected two models, which are representa-tive for the outer limits of the variations. OH-model 1(= duct 1988) represents the lowest values all throughthe OH– absorption, while OH-model 2 (= duct1999) represents the highest values. These two OH–
models will be referred to in later calculations.
4.4 Curve fitting method
The OTDR values at 1241 nm and 1310 nm areselected to make a fit to the Rayleigh scattering usingequation (4.2). This is possible because the OH–
absorption does not contribute at 1241 nm and1310 nm, and the IR absorption is so small that itcan be ignored.
Subsequently, the Rayleigh scattering contributionsare calculated for the remaining wavelengths 1383 nm,1550 nm, 1625 nm and 1642 nm – and subtractedfrom the original values. From the difference values,the 1550 nm, 1625 nm and 1642 nm values areselected to make a fit to the IR-absorption usingequation (4.3). This is possible because the Rayleighcontributions have been removed and the OH–
absorption does not contribute here.
Next the IR absorption contribution is calculated at1383 nm, and subtracted from the result of the previ-ous step. The remaining value is now clean and canbe used to make a fit to the OH– absorption using
αOH = αgauss1 + αgauss2 + αgauss3 =
A · e−
(λ−I)2
2B2 + C · e−
(λ−G)2
2D2 + E · e−
(λ−H)2
2F2
1300 1350 1400 1450 1500 1550
0.00
0.10
0.20
0.30
0.40
0.50
0.60 αOH
=αgauss1
+αgauss2
+αgauss3
αgauss2
αgauss1
αgauss3
αOH
Fib
er
att
en
ua
tio
n (
dB
/k
m)
Wavelength (nm)
Figure 5 Water peak in 1988 duct cables
1300 1350 1400 1450 1500 1550
0.0
0.2
0.4
0.6
0.8
1.0
No
rma
lise
d v
alu
e
Wavelength (nm)
duct 1988
duct 1994
duct 2002
duct 2001
duct 1999
underwater 1989
underwater 1988
OH-model 1 = duct 1988
OH-model 2 = duct 1999
Figure 6 Normalized field OH– absorptions
Fib
er
att
en
ua
tio
n (
dB
/k
m)
1250 1350 1450 1550 1650
0.00
0.10
0.20
0.30
0.40
0.50
0.60
0.70
αtotal
αOH
αP
αIP
1750
Wavelength (nm)
Figure 7 Single curve fit for fibre attenuation
ISSN 0085-7130 © Telenor ASA 2005

168 Telektronikk 2.2005
equation (4.4) and OH-model 1 or OH-model 2. Fig-ure 7 illustrates the different steps in the curve fittingprocedure.
4.5 Results
4.5.1 Mass curve fitting of fibre attenuation
Figure 8, Figure 9 and Figure 10 show the resultsof the mass fittings for cables installed before 1990,around 2000 and 2003, respectively. The calculatedspectra have been plotted from 1200 nm to 1675 nmand we have chosen OH-model 1. Figure 11 showsthe results for cables installed in 2000 when usingOH-model 2. Comparing the spectra in Figure 9 andFigure 11, we observe only minor differences in thewavelength region 1410–1500 nm.
As a result of the curve fitting method described here,we are able to calculate statistical parameters for fibreattenuation in the field at any wavelength. A case ofgreat interest is attenuation statistics for CWDMwavelengths.
Table 2 shows the calculated statistics at the CWDM-wavelengths for cables installed around 2000 usingOH-model 1. For comparison, the results of calcula-tions using OH-model 2 are also included. We notethe small differences in the statistical values in theregion 1410–1500 nm.
In order to compare the curve fitting results with theactual field measurements, we have calculated thefibre attenuation statistics for the OTDR wavelengthsusing OH-model 1. The results are shown for cablesinstalled 2000 in Table 3. We note that the calculatedvalues are in excellent agreement with the actualmeasured values at the OTDR wavelengths.
We also note that the estimated average attenuationvalues in the longer wavelength region from 1650–1675 nm are in the range 0.23–0.26 dB/km for cablesinstalled 2000, which are very low values.
4.5.2 Splice loss
The measured average splice loss and standard devia-tion versus wavelength for cables installed before1990 and around 2000 or later have been shown ear-lier in Figure 5. We have used this graph to find thesplice loss average and standard deviation at wave-lengths other than the OTDR wavelengths, assuminga linear relationship between the wavelength mea-surement points.
4.5.3 Total loss
Equation (3.1), shown earlier, is used to calculatetotal loss in a link at the CWDM wavelengths in thecase of 2 km or 4 km between splices. Table 4 shows
1250 1350 1450 1550 1650
0.20
0.40
0.60
0.80
1.00
1.20
1.40
Fib
er
att
en
ua
tio
n (
dB
/k
m)
Wavelength (nm)
Cables installed
around 1990
38 samples
OH-model 1
Figure 8 Mass curve fits for fibre attenuations incables installed before 1990 using OH-model 1
Fib
er
att
en
ua
tio
n (
dB
/k
m)
1250 1350 1450 1550 16500.00
0.20
0.40
0.60
0.80
1.00
1.20
1.40
Cables installed
around 2000
64 samples
OH-model 1
Figure 9 Mass curve fits for fibre attenuations incables installed around 2000 using OH-model 1
1250 1350 1450 1550 16500.00
0.20
0.40
0.60
0.80
1.00
1.20
1.40
Fib
er
att
en
ua
tio
n (
dB
/k
m)
Wavelength (nm)
Cables installed 2003
223 samples
OH-model 1
Figure 10 Mass curve fits for fibre attenuations incables installed 2003 using OH-model 1
1250 1350 1450 1550 16500.00
0.20
0.40
0.60
0.80
1.00
1.20
1.40
Fib
er
att
en
ua
tio
n (
dB
/k
m)
Wavelength (nm)
Cables installed 2000
64 samples
OH-model 2
Figure 11 Mass curve fits for cables installed around2000 using OH-model 2
ISSN 0085-7130 © Telenor ASA 2005
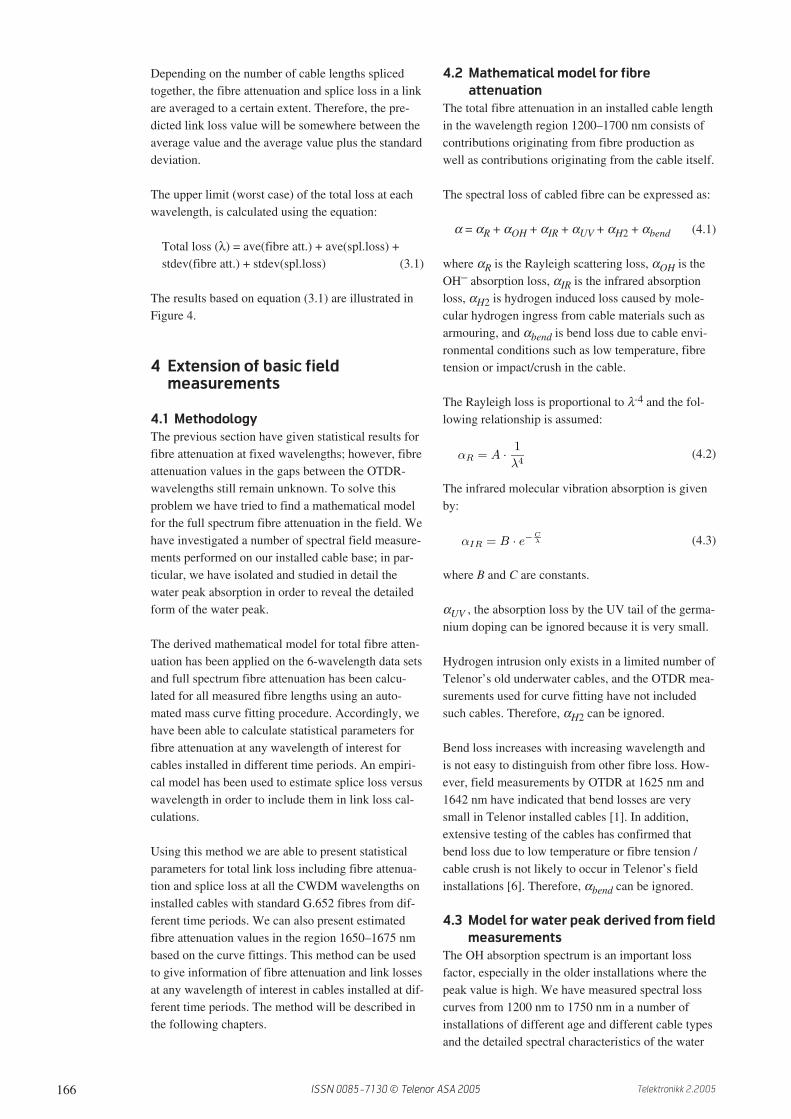
169Telektronikk 2.2005
Cables installed 2000
CWDM edge Fiber attenuation (dB/km) Fiber attenuation (dB/km)
wavelength (nm) OH-model 1 OH-model 2
Average Stdv Average Stdv
1261 0.396 0.018 0.396 0.018
1281 0.371 0.017 0.371 0.017
1301 0.349 0.016 0.350 0.016
1321 0.329 0.015 0.330 0.016
1341 0.313 0.01 0.315 0.016
1361 0.307 0.020 0.314 0.025
1381 0.499 0.196 0.500 0.200
1401 0.371 0.098 0.389 0.115
1421 0.285 0.037 0.305 0.054
1441 0.253 0.020 0.272 0.036
1461 0.229 0.012 0.249 0.026
1481 0.215 0.010 0.228 0.017
1501 0.206 0.010 0.211 0.012
1521 0.199 0.010 0.201 0.010
1541 0.194 0.010 0.195 0.010
1561 0.192 0.010 0.192 0.010
1581 0.192 0.010 0.192 0.010
1601 0.196 0.010 0.196 0.010
1621 0.204 0.011 0.205 0.010
Table 2 Fibre attenuation statistics at CWDM wavelengths for cables installed around 2000
Cables installed around 2000
Wavelength (nm) Fitted values (dB/km) Measured values (dB/km)
Average Stdev Average Stdev
1241 0.422 0.019 0.420 0.020
1310 0.340 0.016 0.342 0.017
1383 0.509 0.209 0.507 0.207
1550 0.193 0.010 0.194 0.010
1625 0.207 0.010 0.206 0.010
1642 0.221 0.011 0.221 0.012
1650 0.228 0.012 NA NA
1660 0.240 0.014 NA NA
1670 0.254 0.017 NA NA
1675 0.263 0.020 NA NA
Table 3 Fibre attenuation statistics at OTDR wavelengths for cables installed around 2000
ISSN 0085-7130 © Telenor ASA 2005
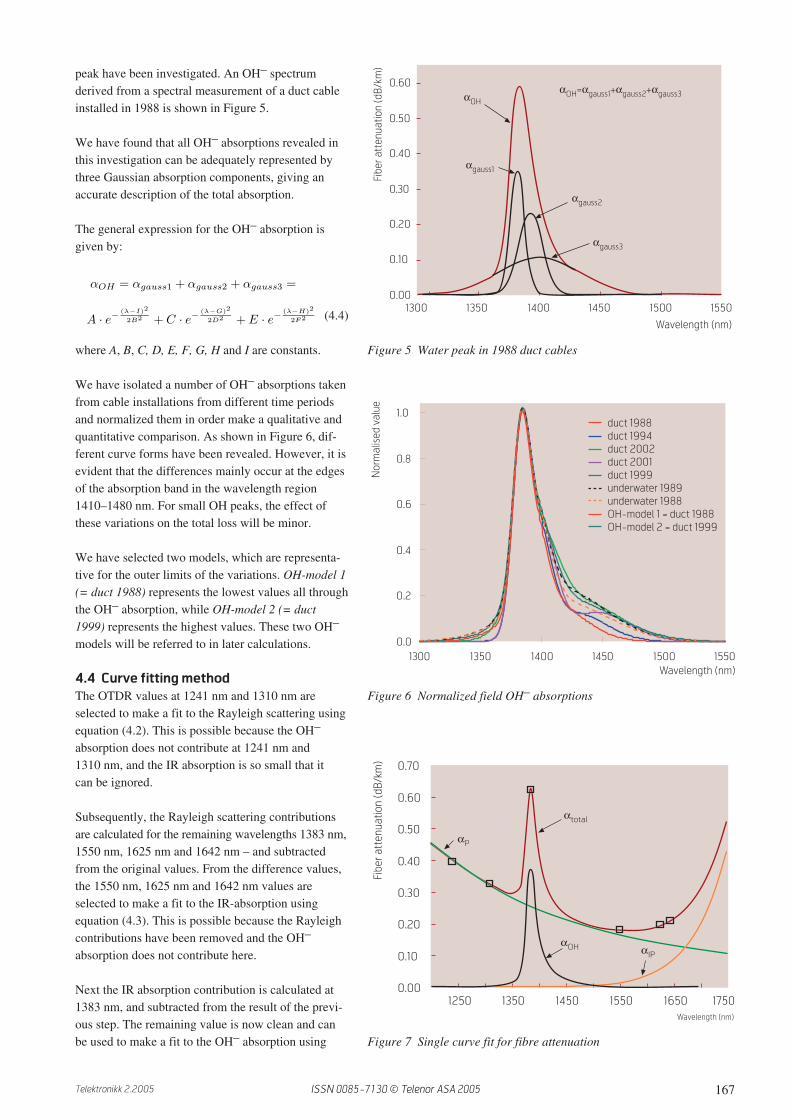
170 Telektronikk 2.2005
the results for cables installed in 2000. The value rep-resenting each centre wavelength is selected as thehighest value in the corresponding interval.
5 Hydrogen induced loss in under-water cables
5.1 Background
Norway has a very long coastline, which makes theinstallation of underwater fibre optic cables veryattractive. Telenor installed the first fibre optic seacable in 1983 in Sognefjorden on the west coast ofNorway, and the first cable in a freshwater lake wasdeployed in 1985 in Norway’s largest lake, Mjøsanear Lillehammer. Up to now, Telenor has installedmore than 2500 km of underwater cables along theNorwegian coast and more than 1000 km in lakes.
During the early installation period from 1986 to1990, we had no hydrogen barrier in the cables toprevent hydrogen ingress in the fibres due to corro-sion of the armour wires. From the early 1990s, costeffective solutions with hydrogen barriers such ashermetic fibres and hydrogen absorbing materialswere available, and were included as a standard inour cables. Later on, other methods were introduced,
and since 1998 we have used an underwater cableconstruction with fibres inside a hermetically sealedcentral steel tube.
5.1.1 Old underwater cable construction
Our old underwater cable construction is basicallyvery simple, with a fibre core consisting of fibres instranded loose tubes or a slotted core element, sur-rounded by an inner sheath of low-density poly-ethylene. Then follows the armour wire layer(s)with a rubber asphalt/bitumen filling compound, andfinally an outer sheath of high-density polyethylene,as shown in Figure 12. Different types of armour areused for different environments. Typically, SA andDA armour are used for sea installations, while SSAarmour is used in lakes.
The cable core was identical to our standard ductcable. In these underwater cables, no hydrogen bar-rier is included and hydrogen from the armour wiresis allowed to diffuse freely in and out of the cableconstruction.
5.1.2 Newer underwater cable constructions
From 1991–92, Telenor introduced hermeticallycoated fibres in the old cable construction. The her-metic ceramic coating is applied directly to the fibre
Cables installed 2000
CWDM center Fiber attenuation (dB/km) Total loss (dB/km) Total loss (dB/km)
wavelength (nm) 2 km between splices 4 km between splices
Average Upper limit Average Upper limit Average Upper limit
stdv stdv stdv
1271 0.396 0.414 0.421 0.467 0.409 0.441
1291 0.371 0.388 0.396 0.440 0.383 0.414
1311 0.349 0.365 0.373 0.416 0.361 0.391
1331 0.329 0.344 0.353 0.394 0.341 0.369
1351 0.313 0.329 0.337 0.377 0.325 0.353
1371 0.499 0.694 0.521 0.741 0.510 0.718
1391 0.509 0.718 0.531 0.765 0.520 0.742
1411 0.371 0.469 0.393 0.514 0.382 0.491
1431 0.285 0.322 0.307 0.366 0.296 0.344
1451 0.253 0.273 0.274 0.317 0.263 0.295
1471 0.229 0.242 0.250 0.284 0.240 0.263
1491 0.215 0.226 0.236 0.267 0.226 0.247
1511 0.206 0.216 0.226 0.256 0.216 0.236
1531 0.199 0.209 0.219 0.249 0.209 0.229
1551 0.194 0.205 0.214 0.243 0.204 0.224
1571 0.192 0.202 0.211 0.240 0.201 0.221
1591 0.196 0.206 0.214 0.243 0.205 0.225
1611 0.204 0.215 0.223 0.251 0.213 0.233
Table 4 Loss statistics at CWDM-wavelengths for cables installed 2000
ISSN 0085-7130 © Telenor ASA 2005
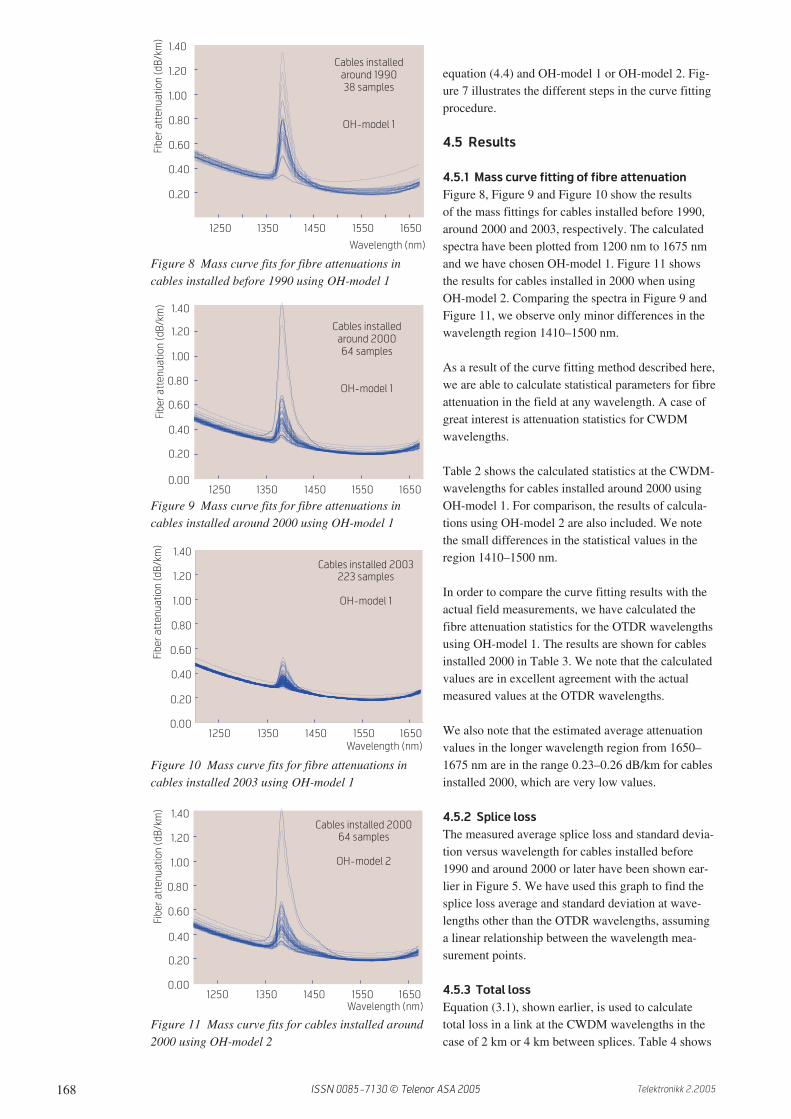
171Telektronikk 2.2005
surface during fibre production and prevents hydro-gen from entering into the fibre core. Hermetic coat-ings have proven to be a lifetime full proof protectionagainst hydrogen.
Figure 13 shows the underwater cable constructionthat we have used since 1998. Here, the unprotectedfibres are placed inside a hermetic steel tube in thecentre of the cable. The steel tube has been longitudi-nally laser welded to provide hermetic seal. The steeltube also gives better mechanical protection to thefibres in case of external crush and tension to thecable. The steel tube has proven to give a lifetimefull proof hydrogen protection to the fibres.
5.2 Investigating old underwater cables
Telenor, along with many other cable owners hasbeen concerned about hydrogen ingress in theirinstalled cables without hydrogen barrier. As a con-sequence, Telenor started late 1988 an extensive mea-suring program on installed submarine cables in orderto reveal the hydrogen level present in the cables. Theinitial results indicated low levels of hydrogen duringthe first few years after installation [7] [8]. However,it was not possible at that time to evaluate the long-term development of the hydrogen level.
Telenor continued to perform hydrogen induced lossmeasurements on selected installed fibre optic under-water cables. In addition, we performed long-termaccelerated tests on armoured cables.
Considering the large number of field measurementsover more than 10 years, and the results of the accel-erated tests, we are in a position to give reliable indi-cations of the long term behaviour of hydrogeninduced loss.
5.2.3 Installed cable routes
The cable network along the coast connects the mainpopulated areas and consists partly of underwatercable and partly of land cable. The overall average
underwater route length is 6.9 km, and the maximumsea depths typically vary between 50 and 800 m, withthe deepest route of 1300 m. The sea bottom topogra-phies along our submarine cable routes are largemountain formations, sharp and high ridges of severalhundred metres, leads and troughs, as well as flatparts. Nearly 100 % of the underwater cables aresurface laid due to the high cost of burial.
5.2.4 Field measurements
We decided early to measure mainly underwater cablesinstalled at sea, since they are heavier armoured, situ-ated in the harshest environments and also prone tomechanical damage due to fishing activities etc. Theunderwater cables were selected from different partsof the coast, with different maximum depths androute topographies. Also, we selected singlearmoured cables (SA) and double armoured cables(DA) in representative proportions. In total, we havemeasured 35 cables from the early installation period,which constitute nearly 30 % of all our submarinecables without hydrogen barrier. The selection istherefore in all respects representative of our marineinstallations.
For these early installed cables we have measuredthe hydrogen level 1–2 times a year over a period ofmore than ten years. In addition, from the later instal-lation period we have measured ten cables with
inner jacket
armor wires
armour filling:
bitumen/rubber
outer jacket HDPE
SSA: single layer
2.6 mm wires
Cable
core Cable
core
SA: single layer
4.2 mm wires
Cable
core
DA: doble layer
2.6/4.2 mm wires
Figure 12 Old underwater cable constructions
fibres
steel tube
inner jacket LDPE
armour wires
armour filling: bitumen
outer jacket HDPE
Figure 13 Underwater cable construction usedsince 1998
inner jacket
armour wires
armour filling:
bitumen/rubber
outer jacket HDPE
ISSN 0085-7130 © Telenor ASA 2005
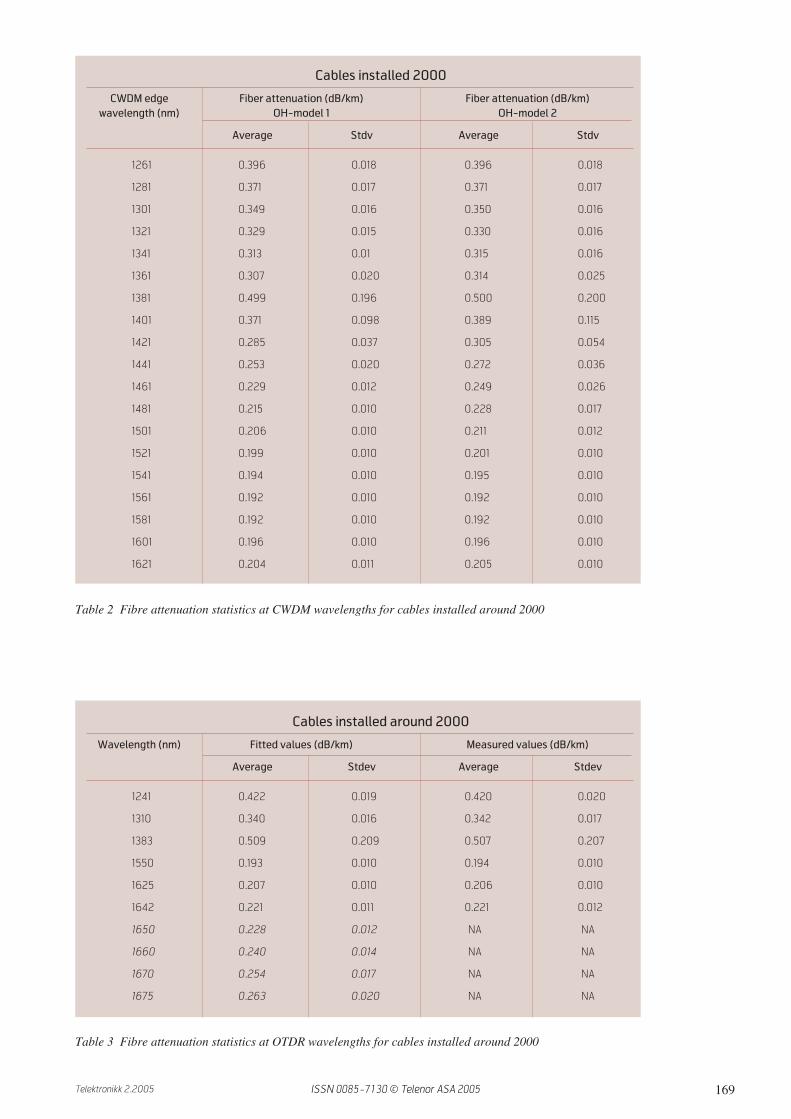
172 Telektronikk 2.2005
hydrogen barriers such as hydrogen absorbing materi-als and hermetic fibres for comparison. Some of thesecables have been regularly measured over a period offive years.
Hydrogen molecules may diffuse in and out of thecable construction and the observed hydrogen level inthe cabled fibre is determined by the equilibrium con-dition between inward and outward diffusion. Thislevel may change with time if the hydrogen genera-tion rate in the armour layers changes.
Hydrogen molecules interact with the glass moleculesand a number of well-defined absorption peaksappears in the fibre attenuation spectrum. The mainpeak appear at 1244 nm and several smaller peaksmay be observed at different longer wavelengths.
To monitor the hydrogen level over time we haveused two different special OTDR-modules withslightly different centre wavelengths, which both areclose to the peak wavelength of the hydrogen-inducedloss at 1244 nm. With the reference module (OTDR 1= 1238 nm), we are able to detect approximately50 % of the 1244 nm peak height, while the othermodule (OTDR 2 = 1241 nm) detects approximately70–80 % of the peak height. They are used simultane-ously in order to compare and verify changes in fibre
losses. Both modules are checked for stability of cen-tre wavelengths and half widths prior to all field mea-surements. We have measured several fibres in eachcable and average values are used to characterise thehydrogen level in the cable.
In all field measurements the fibres were also mea-sured at the 1310 nm and 1550 nm wavelengths.
Figure 14 shows the long-term fibre loss in our DAand SA underwater cables. Each cable shows an indi-vidual time dependent pattern. After 6–7 years, thehydrogen induced loss has more or less stabilised.The average value for the DA cables is clearly higherthan the corresponding level for the SA cables. Theratio between average hydrogen induced loss in SAand DA cables after 6.5 years is found to be 1 : 2.58.This is in good agreement with the ratio of the sur-face areas of the armour wires for the SA cables andthe DA cables, which is calculated to be 1 : 2.34.Thus, the hydrogen generation rate seems to be pro-portional to the surface area of the armour wires.
Hermetic fibres are considered to be a full proof life-time protection against hydrogen levels of consider-ably higher magnitude than what is present in ourcables. For comparison, measurements on these
Figure 14 Long term loss in old single armoured (SA) and double armoured (DA) underwater cables measured with OTDR 1 at1238 nm
Normal fibre loss
OTDR 1
00 01 02 03 04 05 06 07 08 09 10
0.40
0.50
0.60
0.70
0.80
0.90
1.00
1.10
1.20
DA; no barrier
SA: no barrier
DA and SA with hermetical fibres
SA with hydrogen absorbing material
Years after installation
Fib
re l
oss (
dB
/k
m)
ISSN 0085-7130 © Telenor ASA 2005
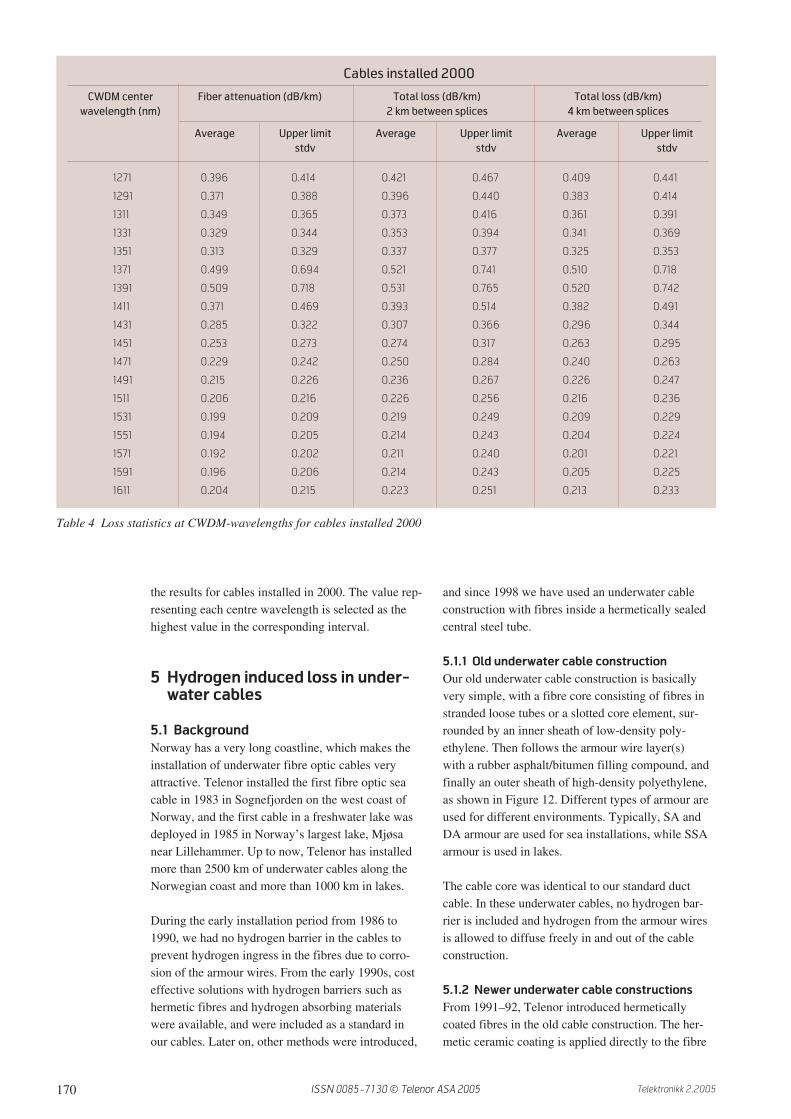
173Telektronikk 2.2005
cables are included in Figure 14. No sign of loss dueto hydrogen absorption is visible in the hermetic fibres.
Figure 15 shows the corresponding long term loss at1550 nm measured in SA cables and DA cables. Herethe hydrogen-induced loss has been mapped into the1550 nm wavelength. It should be noted that normalfibre loss in old cables was not always close to 0.20dB/km and also other minor loss could be present at1550 nm. However, we can deduce from Figure 20that the hydrogen induced loss 6–7 years after instal-lation at 1550 nm is in the region 0.01 – 0.02 dB/kmand 0.02–0.04 dB/km for SA cables and DA cables,respectively.
5.2.5 Accelerated temperature tests
In order to study long-term hydrogen effects morein detail, a temperature controlled seawater bath wasconstructed. Cable samples were deployed in sea-water and subjected to a temperature of + 60° Celsius.Accordingly, the hydrogen level rises to much highervalues than in the field measurements. Some selectedresults are shown in Figure 16. Each sample showsan initial rise of the hydrogen level to a maximumvalue, followed by a long decaying period. SSAcables have less armour than the SA cables.
It is difficult to estimate the exact time before maxi-mum value is reached because of a temporary varia-tion in temperature in this period. However, a rise
time of 50–60 days for both SA and SSA cables isa reasonable approximation. The rise time does notseem to be strongly dependent on amount of armour.
The time needed to reduce the hydrogen level to halfof its maximum value is approximately 300 days onaverage for the SA cables and approximately 100days on average for the SSA cables. Clearly, thedecay time increases with increasing amount ofarmour.
Figure 16 Fibre loss and temperature versus time in SA and SSA cables heated in seawater
Normal fibre loss
1550 nm: SA and DA submarine cables
with no hydrogen barrier
DA
00 01 02 03 04 05 06 07 08 09 10
0.19
0.20
0.21
0.22
0.23
0.24
0.25
0.26
SA
Years after installation
Fib
re l
oss (
dB
/k
m)
Figure 15 Long-term loss in old single armoured (SA) and doublearmoured (DA) underwater cables measured at 1550 nm
0 50 100 150 200 250 300 350 400 450 500 550 600
20
30
40
50
60
70
0
1
2
3
4
5
6
7
8
9
Cable D: SSA
Cable A: SA
Cable B: SACable C: SSA
Normal fibre loss
Fib
re l
oss O
TD
R 2
(d
B/k
m)
OTDR 2
0 50 100 150 200 250 300 350 400 450 500 550 600
Te
mp
. (d
eg
r. C
)
Days
ISSN 0085-7130 © Telenor ASA 2005
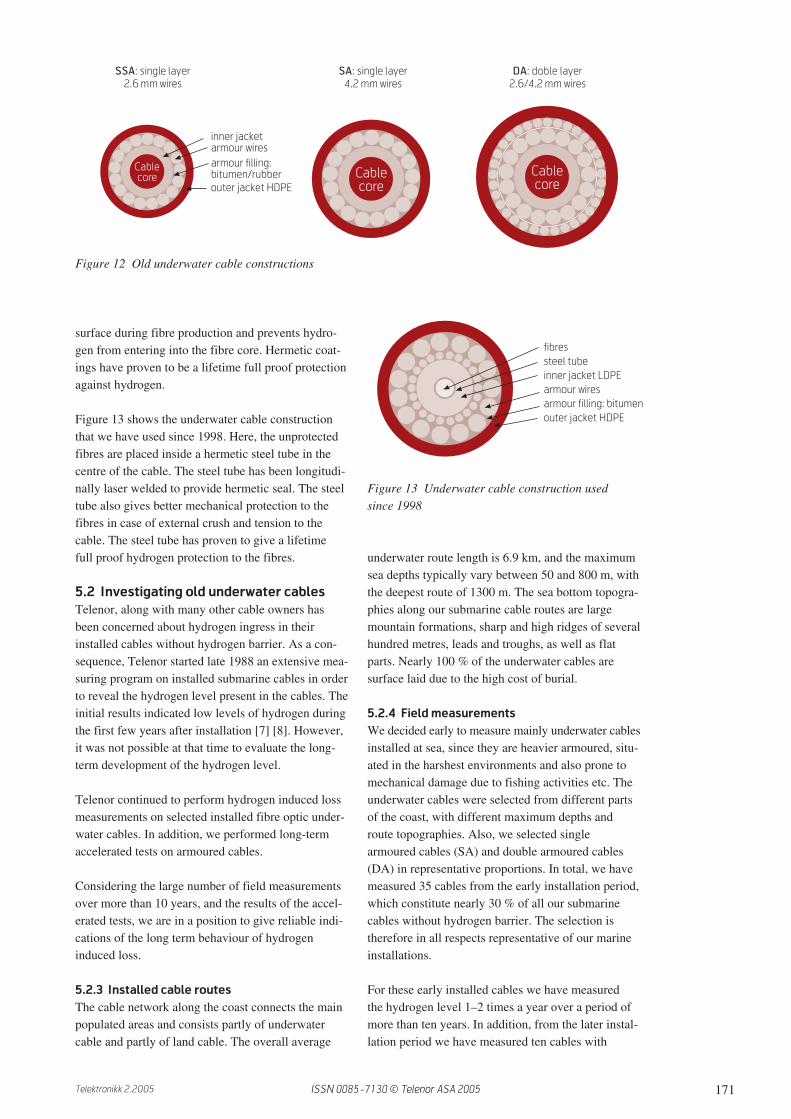
174 Telektronikk 2.2005
We observe that the decay time is typically 5–6 timeslonger than the rise time for SA cables. For DAcables a higher ratio would be expected.
5.2.6 Expected long term field development
The high temperature experiment results are in agree-ment with the field measurements, which have shownincreasing but stabilised hydrogen levels after 6–8years, corresponding to the equivalent rise time of50–60 days at the elevated temperatures. We canthus calculate a time reduction factor of 0.10 – 0.16year/day for the high temperature experiment.
As a consequence, the time required for hydrogenlevels in the field to decrease to half their maximumvalues, is estimated at more than 30 years for SAcables (decay-time . time reduction factor), and evenlonger times would be expected for DA cables.
In view of the test results, the installed cables willafter 6–8 years go through a period of stable anddecreasing hydrogen levels during the following10–20 years. Some measurements in 2002 of spectralloss in 14 year old underwater cables (shown in Fig-ure 17) have confirmed this prediction. Further fieldmeasurements will be performed.
5.3 Spectral loss signatures in old
underwater cables
Figure 17 shows recently measured spectral loss(2002) for an underwater cable installed in 1988. Weregister the characteristic main molecular hydrogenpeak at 1244 nm as well as two smaller H2 relatedpeaks at 1590 nm and 1700 nm, respectively. We alsoobserve the OH– peak at 1385 nm, which is notlinked to molecular hydrogen as stated earlier. Allthese peaks will affect the different bands as outlinedin more detail in the following.
Figure 18 shows the spectral loss in the O-band (1260– 1360 nm). Due to the main H2 absorption at 1244nm and the rather high OH– absorption at 1385 nm,the attenuation values for the old underwater cablesincrease slightly near the band edges in the O-bandcompared to duct cables, while in the central regionof the band, the spectral loss is very similar to theduct cables.
In the E-band the loss in the old underwater cables aswell as the old duct cables is generally high due to thepeak OH– absorption.
Figure 19 shows the spectral loss of old underwatercables and duct cables in the S-, C-, L- and U-band(1460 – 1675 nm). Due to the high OH– absorptionat 1385 nm, the attenuation for underwater cablesis increasing towards the S-band edge at 1460 nm,Figure 19 Spectral loss of fibre cables in the S-, C-, L- and U-band
Figure 18 Spectral loss of fibre cables in the O-band
1250 1350 1450 1550 1650 1750
0.00
0.20
0.40
0.60
0.80
1.00
1.20 Measured length 6431 m
including 4 splices
4 fibers
OTDR-values
Wavelength (nm)
Fib
er
loss (
dB
/k
m)
1260 1280 1300 1320 1340 1360
0.00
0.20
0.40
0.60
0.80
underwater 1988, 4 fibres
underwater 1989, 3 fibres
duct 1988, 4 fibres
duct 1994, 4 fibres
duct 1999, 6 fibres
duct 1999, 9 fibres
duct 2001, 6 fibres
OTDR-values
Av
era
ge
lo
ss (
dB
/k
m)
Wavelength (nm)
O-band: 1260 nm - 1360 nm
OTDR-values
Wavelength (nm)
1460 1500 1540 1580 1620 1660 17000.00
0.20
0.40
0.60
0.80
1.00
underwater 1988, 4 fibres
underwater 1989, 3 fibres
duct 1988, 4 fibres
duct 1994, 4 fibres
duct 1999, 6 fibres
duct 1999, 9 fibres
duct 2001, 6 fibres
OTDR-values
Av
era
ge
fib
re l
oss (
dB
/k
m)
Wavelength (nm)
S-band
1460-1530 nm
C-band
1530-1565 nmL-band
1565-1625 nm
U-band
1625-1675 nm
Figure 17 Spectral loss in old underwater cables
ISSN 0085-7130 © Telenor ASA 2005
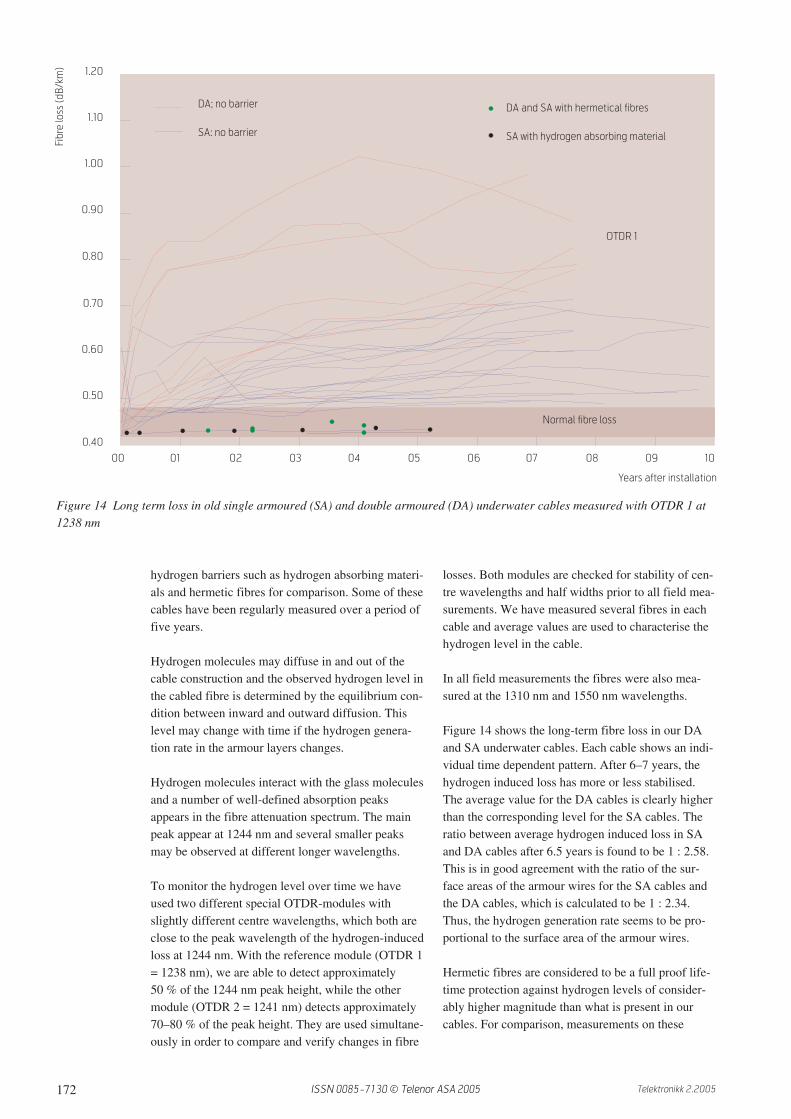
175Telektronikk 2.2005
while the H2 absorption at 1700 nm leads to anincrease towards the U-band edge at 1675 nm. Thesmall peak at 1590 nm is observed.
In addition to the peaks at 1700 nm and 1590 nm, itis a fact that the fibre attenuation is slightly higherthan normal at 1550 nm and at 1625 nm due to themolecular hydrogen induced loss [7] [10].
6 Cable testing
6.1 Background
During installation and throughout the lifetime of thecable, it may be subjected to environmental condi-tions such as high/low temperatures, tension andcrush, which may cause additional wavelength depen-dent loss in the fibres. At the time of a field measure-ment, this loss may not be present. In order to get thefull picture of possible added loss during their life-time, the different cable types have to be tested up toand beyond their specified limits.
For reasons outlined in Chapter 5, one crucial testto withstand for armoured underwater cables is thehydrogen test, which is performed by the cable manu-facturer. The Telenor hydrogen test specificationrequires zero hydrogen ingress throughout the cablelifetime. Mechanical testing of armoured cablesrequires heavy equipment and is also performed bythe manufacturer.
Telenor has its own facilities for testing land (duct)cables. This gives Telenor the possibility to examineand characterize the wavelength dependence of addi-tional loss due to temperature, crush and tension onthe cable. Such information is of crucial importanceconsidering the extended use of wavelengths. All thetest equipment and procedures are defined in detailby the standardisation body IEC for reproducibilityand comparison between users.
Such data is not available from the cable manufac-turer since their testing is performed at one wave-length only, usually 1550 nm.
In our investigation different duct cable samples fromdifferent time periods were subjected to extensivetesting, during which the added spectral loss wasrecorded and analysed. In the following, the mainresults are presented.
6.2 Temperature test
Figure 20 shows the wavelength dependence ofinduced loss due to low temperatures in a duct cablefrom 2001. The additional loss is less than the speci-fied limit of 0.1 dB/km at temperatures below -40° C,
for wavelengths up to 1700 nm. Similar results wereobtained for duct cables produced in 1994–95. Weshould note that our aerial cables have better temper-ature performance than our duct cables due to the sus-pended part of the figure eight construction. There-fore, these results indicate that Telenor’s aerial andduct cables are temperature resistant throughout theU-band (1625–1675 nm), even if they are specifiedonly for 1550 nm operation.
6.3 Tension test
Figure 21 shows additional loss due to fibre elonga-tion at cable tensions well above the specified limit,below which no fiber elongation is allowed, for a newduct cable. We note that induced loss is present at allwavelengths. Furthermore, they increase with in-creasing wavelength and elongation. Similar wave-length dependence, but with different loss increase
1250 1350 1450 1550 1650 1750
0.0
2.0
4.0
6.0
8.0
10.0
12.0
14.0
16.0
0.57 %
0.46 %
0.35 %
0.22 %
0.12 %
0.04 %
Lo
ss in
cre
ase
(d
B/k
m)
Wavelength (nm)
New duct cable
( ): fiber elongation
Figure 20 Temperature induced loss increase in a duct cable ofrecent date
Figure 21 Loss increase due to fibre elongation during tension test
1250 1350 1450 1550 1650 17500.00
0.40
0.80
1.20
1.60 52o
C
50o
C
48o
C
46o
C
44o
C
42o
C
40o
C
35o
C
Lo
ss in
cre
ase
(d
B/k
m)
Wavelength (nm)
New duct cable
Acceptance level
ISSN 0085-7130 © Telenor ASA 2005

176 Telektronikk 2.2005
magnitude has been observed in cables from othermanufacturers.
Considering that it is unlikely that longer lengthsof cable will remain tensioned above the limit afterinstallation, we believe that loss due to excess cabletension should not be a problem if the cables areinstalled properly. This assumption has been con-firmed in the field measurements results, where addi-tional loss of this character has not been visible in the1642 nm OTDR curves.
6.4 Crush test
Figure 22 shows the wavelength dependencies forloss increases for selected crushes at 15 min holdtime during mandrel/plate crush test for a duct cableof recent date.
It should be noted that less than 5–10 % of the totalnumber of crushes resulted in one single loss increaseas shown in Figure 22. Thus the probability of lossincrease is very low, and consequently a large num-ber of crushes had to be performed in order to estab-lish reliable statistics. The results are typical for newcables, while the statistics for older cables with otherconstructions may be poorer [10]. Added loss of thistype has not been visible in the basic field measure-ments described in Chapter 3.
7 SummaryWe have revealed statistical values for fibre attenua-tion and splice loss measured in the field on installedcables with standard G.652 fibres from different timeperiods, at six different wavelengths: 1242 nm,1310 nm, 1383 nm, 1550 nm, 1625 nm and 1642 nm.The main observations are that the average fibreattenuation, splice loss and their standard deviations
have decreased significantly at all wavelengths sincethe 1980s. Especially the water peak attenuation at1383 nm showed high values with considerablespread before 1990. In the 2003 cables, the averagewater peak attenuation is almost as low as the averageattenuation at 1310 nm.
To study the fibre attenuation at wavelengths differ-ent from the measured ones, a mathematical modelhas been found to fit the fibre attenuation in the fieldby studying field measured spectra. The variationsfound in water peak form have been small and limitedto the 1410 – 1480 nm region. The mathematicalmodel has been applied to the field OTDR measure-ments at six wavelengths and the full fibre attenua-tion spectra have been calculated. The curve fittingresults are in excellent agreement with the actualmeasured values at the OTDR wavelengths. We havecalculated statistical parameters for fibre attenuationin the field at the CWDM wavelengths and alsoincluded the splice loss to form the total link loss atthe CWDM wavelengths. The applied method givesextended and valuable information of fibre cableattenuation in installed cables from different timeperiods.
The levels of hydrogen present in our old underwatercables without hydrogen barrier do not result in sig-nificant additional loss in major parts of the transmis-sion bands. More details with respect to the widespectrum fibre attenuation in old underwater cableswill be further investigated.
Extensive testing of Telenor’s duct cables has re-vealed the detailed wavelength dependence of losscaused by excessive temperature, tension and crush.The test results have shown that temperature inducedloss will not occur in our installed cables for wave-lengths up to 1675 nm. Furthermore, the test resultshave shown that additional loss due to tension andcrush is not likely to occur in cables if they are prop-erly installed. Proof of this has been confirmed by thefield measurements.
8 AcknowledgementThe author wishes to express great appreciation toIdar Gangsø at Telenor Networks who has performedthe field measurements and the cable tests with greatskills and much enthusiasm during many years.
9 References1 Hopland, S. Loss Measurements in Installed Fibre
Optic Cables At 1383 nm and 1642 nm. Proceed-ings International Wire & Cable Symposium
1250 1350 1450 1550 1650 1750
0.00
1.00
2.00
3.00
4.00
5.00 crush A
crush B
crush C
crush D
crush E
crush F
Lo
ss in
cre
ase
(d
B/k
m)
Wavelength (nm)
New duct cable
Figure 22 Mandrel-plate crush induced loss in duct cable ofrecent date
ISSN 0085-7130 © Telenor ASA 2005

177Telektronikk 2.2005
2003, Philadelphia, Pennsylvania, USA, 16–19November 2003.
2 Hopland, S. A Full Spectrum MathematicalModel for Fibre Attenuation in the Field and itsApplication to OTDR Measurements at SixSelected Wavelengths. Proceedings InternationalWire & Cable Symposium 2004, Philadelphia,Pennsylvania, USA, 14–17 November 2004.
3 Hopland, S. Fibre cable field loss measurementsin a broad wavelength range. Contribution ITU-Tmeeting April 2004. Not official; presented asWorking Document.
4 Hopland, S. Fibre cable field loss measurementsin a broad wavelength range. Contribution ITU-Tmeeting November 2004. White Paper COM15-12.
5 Hopland, S. Application of a mathematical modelfor fibre attenuation in the field to curve fit OTDRmeasurements in a broad wavelength range. Con-tribution ITU-T meeting November 2004.Delayed document D-152.
6 Hopland, S. Loss Performance of Standard SingleMode Fiber Cables in the wavelength Region1200-1750 nm. Proceedings International Wire& Cable Symposium, Lake Buena Vista, Florida,USA, 18–21 November 2002.
7 Hopland, S. Long Term Behaviour of HydrogenInduced Losses in Installed Fibreoptic Submarineand Underwater Cables. Proceedings Interna-tional Wire and Cable Symposium, Philadelphia,Pennsylvania, USA, 17–20 November 1997,316–325.
8 Hopland, S. Measurements of low hydrogen lev-els in installed open fibre optic submarine cables.Proceedings International Wire & Cable Sympo-sium, St. Louis, Missouri, USA, 18–21 November1991, 742–749.
9 Hopland, S. Investigation of total and distributedhydrogen levels in installed fiberoptic submarinecables. Proceedings International Wire & CableSymposium, Atlanta, Georgia, USA, 14–16November 1989, 684–688.
10 Hopland, S. Investigation of 1625 nm loss perfor-mance of fibre optic cables intended for use at1550 nm. Proceedings International Wire &Cable Symposium, Atlantic City , NJ, USA,15–18 November 1999.
Svend Hopland is Chief Engineer on optical fibre cables and fibre transmission at Telenor Nordic Fixed. He
graduated from the Norwegian Institute of Technology (NTH) in 1985 with a PhD on optical fibres and
joined Telenor in 1986. He has been responsible for development projects on underwater fibre cables and
fibre cable specifications at Telenor. He has pioneered and developed an advanced method for installing
underwater cables in the extremely difficult sub sea terrain along the Norwegian coast, for which he
received an award at the International Wire and Cable Symposium in 1993. He has done extensive investi-
gations on hydrogen generation in installed underwater cables. Recently, he has pioneered field measure-
ments on wide spectrum fibre cable link losses and done extensive cable testing to support his field investi-
gations. He has published more than 25 papers in international conferences and journals, and given several
contributions to ITU-T.
email: [email protected]
ISSN 0085-7130 © Telenor ASA 2005

178 Telektronikk 2.2005
16-QAM 16-level Quadrature A modulation method in which the amplitude of two quadrature waves is changed in order to
Amplitude Modulation represent the data signal. A constellation diagram is often used to represent this kind of modulation.
in QAM the constellation points are usually arranged in a square grid with equal horizontal and verti-
cal spacing, although other configurations are possible. The number of points in the grid is usually a
power of 2 (2, 4, 8 etc.), and since QAM usually is square; the most common forms are 4-QAM (or
QPSK), 16-QAM, 64-QAM, 128-QAM and 256-QAM. QPSK and 16-QAM are e.g. used in current and
future mobile radio systems like 3G/HSDPA and WiMax/IEEE 802.16, while 64-QAM and 256-QAM
are often used in digital cable television and cable modems.
ACTS Advanced Communications Thematic Programme of the Fourth Framework Research Programme funded by the European
Technologies and Services Union. It ran from 1994 to 1998 (the last project ended 2000) with a total funding from EU of 681
million Euro.
http://www.cordis.lu/acts
ADSL Asymmetric Digital A data communications technology that enables faster data transmission over copper telephone
Subscriber Line lines than a conventional modem can provide. The access utilises the 1.1 MHz band and has the
possibility to offer, dependent on subscriber line length, downstream rates of up to 8 Mb/s. Upstream
rates start at 64 kb/s and typically reach 256 kb/s, but can go as high as 768 kb/s.
APON ATM over PON A Passive Optical Network (PON) that carries fixed length packets (cells) of 53 bytes. It is specified in
the ITU-T G.983 standard and based on asynchronous transfer mode (ATM), and has therefore been
referred to as APON (ATM PON). Further improvements to the original APON standard – as well as
the gradual falling out of favor of ATM as a protocol – led to the final version of ITU-T G.983 being
referred to more often as Broadband PON, or BPON. A typical APON/BPON provides 622 megabits
per second (Mbit/s) of downstream bandwidth and 155 Mbit/s of upstream traffic, although the stan-
dard accommodates higher rates.
www.ponforum.org
ASON Automatically Switched ASON is a complete definition of the operation of automatically switched transport networks,
Optical Network management, control, data plane, and was developed by Study Group 15 of the ITU-T. ASON is
an architecture that defines the components in an optical control plane and the interactions be-
tween those components. It also identifies which of those interactions will occur across a multi-ven-
dor divide, and therefore require standardized protocols. Other areas are intentionally not standard-
ized in order to allow vendors or operators to provide value adding.
ATM Asynchronous A high bandwidth, low-delay, connection-oriented, packet-like switching and multiplexing tech-
Transfer Mode nique. ATM allocates bandwidth on demand, making it suitable for high-speed connections of voice,
data and video services. Access speeds are up to 622 Mb/s and backbone networks currently oper-
ate at speeds as high as 2.5 Gb/s. Standardised by ITU-T [Newton03].
Availability Fraction of the operational life of a component (a subsystem, a system) during which it is regularly
functioning or providing its service.
Back-up/spare Set of resources used to carry rerouted traffic in failure conditions.
capacity (lightpath)
BER Bit Error Rate The ratio of error bits to the total number of bits transmitted.
BPF Band Pass Filter A band pass filter is a device that passes frequencies within a certain range and rejects (attenuates)
frequencies outside that range. An example of an analogue electronic band pass filter is an RLC
circuit (a resistor-inductor-capacitor circuit).
CATV Cable Television Cable television or Community Antenna Television (CATV) (often shortened to cable) is a system of
providing television, FM radio programming and other services to consumers via radio frequency
signals transmitted directly to people’s televisions through fixed optical fibres or coaxial cables as
opposed to the over-the-air method used in traditional television broadcasting (via radio waves) in
which a television antenna is required.
CP Control Plane
CWDM Coarse Wavelength A relatively low-cost WDM technology that uses wide spacing (about 10 – 20 nm) between wave-
Division Multiplexing lengths and un-cooled optics. CWDM is standardised by ITU-T G.694.1.
www.itu.int
Terms and acronyms inOptical Communications
ISSN 0085-7130 © Telenor ASA 2006
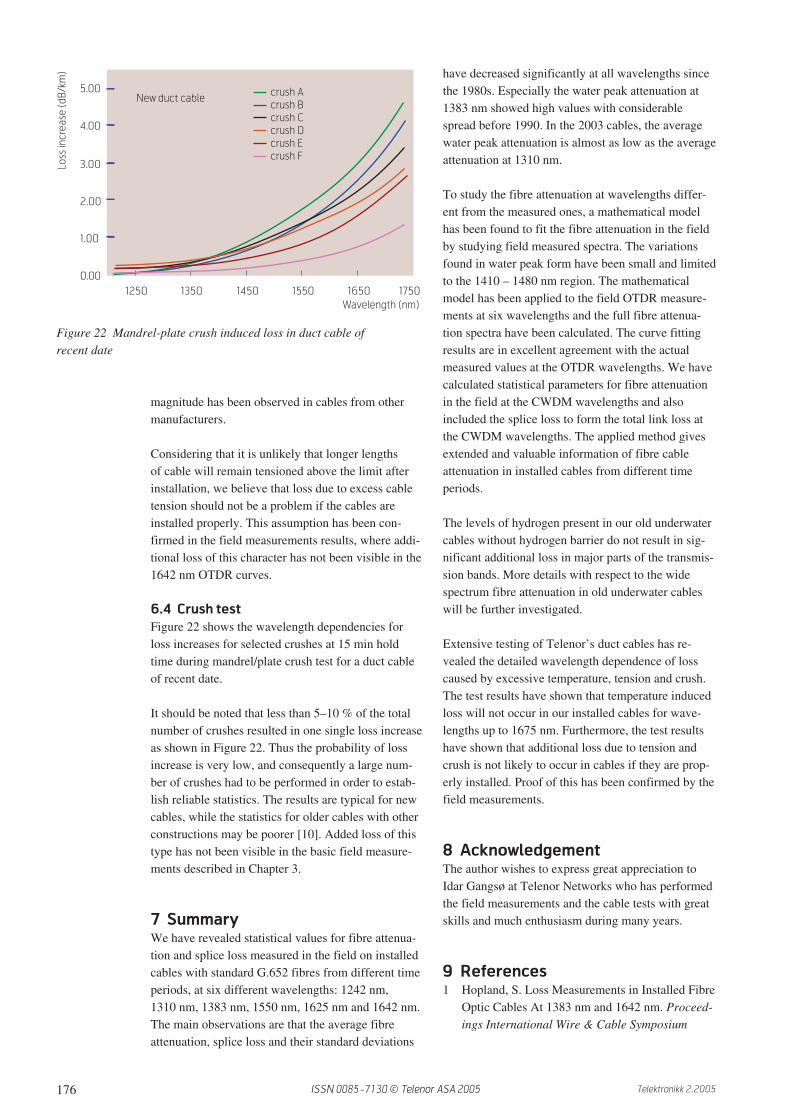
179Telektronikk 2.2005
DA Double Armour
Dedicated (shared) Protection mechanism in which back-up resources are dedicated to a single (shared between many
protection different) optical connection(s).
DGD Differential Group delay is the rate of change of the total phase shift with respect to angular frequency through
Group Delay a device or transmission medium. In an optical fibre, it is the transit time required for optical power,
traveling at a given mode’s group velocity, to travel a given distance.
DLP Dedicated Link Protection A protection scheme where link protection is implemented, i.e. where in case of failure routes are
diverted around the failed link or node but where the rest of the path remains unaltered; and where
one protection link is dedicated to each working link.
DPP Dedicated Path Protection A protection scheme where path protection is implemented, i.e. where in case of failure the whole
path is diverted through an alternative route; and where one protection path is dedicated to each
working path.
DWDM Dense Wavelength A carrier class WDM technology that uses expensive, cooled optics and tight spacing between wave-
Division Multiplexing lengths of less than a nanometre based on specifications of the International Telecommunication
Union (ITU).
http://www.itu.int
EDFA Erbium Doped Fibre amplifiers are optical amplifiers that use a doped optical fibre, which bears the communica-
Fibre Amplifier tion signal, and is optically pumped with a laser having a high-powered continuous output at an
optical frequency slightly higher than that of the communication signal. A fibre amplifier is capable
of amplifying a complete wavelength-division multiplexed set of signals as a single wideband optical
signal. The most common dopant used in fibre amplifiers is erbium, and such a fibre amplifier is
known as an erbium-doped fibre amplifier (EDFA). Commercial EDFAs typically have a frequency of
operation in the C and L band (approx. 1530 to 1605 nm), a low noise with noise figure of 3 – 6 dB, a
high gain (20 – 40 dB) and less sensitivity to polarization of the light signal. Maximum optical output
power is typically 14 – 25 dBm, with an internal gain of 25 – 50 dB. The gain variations are +/- 0.5
dB. The length of the active fibre is 10 – 60 m for C-band EDFAs and 50 – 300 m for L-band EDFAs.
The number of pump lasers is 1 – 6, and the pump wavelength is 980 or 1480 nm.
EFM Ethernet in the The IEEE Std 802.3ah-2004 specification. This is an amendment to the Ethernet specification com-
First Mile bining a minimal set of extensions to the Media Access Control (MAC) and MAC Control sublayers
with a family of Physical (PHY) Layers. These Physical Layers include optical fibre and voice grade
copper cable Physical Medium Dependent sublayers (PMDs) for point-to-point connections in sub-
scriber access networks. It also introduces the concept of Ethernet Passive Optical Networks
(EPONs). The specification has been superceded by the IEEE Std 802.3-2005 standard.
www.ieee802.org/3/efm/
ELED Edge Emitting Diodes A light-emitting diode with output that emanates from between the heterogeneous layers. It has
greater radiance and coupling efficiency to an optical fibre or integrated optical circuit than a sur-
face-emitting LED, but not as great as the injection laser.
EPON Ethernet over PON A Passive Optical Network (PON) that carries variable length (up to 1518 bytes) packets . Promoted
by the IEEE 802.3 Working Group
www.ieee802.org/3/
FEC Forward A technique of error detection and correction in which a transmitting host computer includes a
Error Correction number of redundant bits in the payload (data field) of a block or frame of data, The receiving device
uses the extra bits to detect, isolate and correct any errors created in transmission.
FICON Fibre Connection
FR Frame Relay An efficient data transmission technique used to send digital information quickly and cheaply to one
or many destinations from one point. It can be used for voice, data, local area network (LAN), and
wide area network (WAN) traffic. Each frame relay end user gets a private line to a frame relay node.
The frame relay network handles the transmission to its other end users over a path, which is always
changing and is invisible to the end users. Frame relay is a packet switched Telecommunications
network, commonly used at the data link layer (layer 2) of the Open Systems Interconnection refer-
ence model. Generally the concept of permanent virtual circuits (PVCs) is used to form logical end-
to-end links mapped over a physical network. Switched virtual circuits (SVCs), analogous to circuit
switching in the public switched telephone network, are also part of the Frame relay specification but
are rarely applied in the real world. Frame relay was originally developed as a stripped-down version
of the X.25 protocol.
ISSN 0085-7130 © Telenor ASA 2006

180 Telektronikk 2.2005
FSAN Full Service Network concept defined by the FSAN Working Group in order to derive a common set of require-
Access Network ments among providers to give to equipment vendors in an attempt to accelerate the commercial
deployment of optical access systems. The FSAN organization was established in 1995 by seven
major telecommunications service providers. The work has included defining requirements for BPON,
APON and GPON. The organization feeds their recommendations into the ITU-T, specifically Study
Group 15, Question 2, and recommendations in the G.983.x and G.984.x family have been approved
based on work done by the FSAN committee.
www.fsanweb.org, www.ponforum.org
FTTB Fibre To The Building This is in reference to fibre optic cable, carrying network data, connected all the way from an Inter-
net service provider to a customer’s physical building.
FTTCab Fibre to the Cabinet Also known as FTTN (Fibre to the Neighbourhood). A Hybrid Fibre Coax (HFC) network architecture
involving an optical fibre which terminates in either a street side or neighbourhood cabinet which
converts the signal from optical to electrical. The subscriber connection is either over twisted pair
cable or coaxial cable.
FTTH Fibre To The Home The installation of optical fibre from directly into the subscriber’s home. FTTH is also referred to as
fibre-to-the-building (FTTB), which includes optical fibre that is installed directly into a home or
enterprise.
GFP Generic framing A layer 2 telecommunications protocol. An encapsulating mechanism with a fixed amount of encap-
procedure sulation overhead, which is independent from the binary content of the client. It is a frame based
encapsulation for PDUs (Packet Data Units). GFP is a traffic adaptation protocol, providing conver-
gence between packet-switched and transmission networks. GFP maps packet-based protocols
such as Ethernet, Fibre Channel, FICON, ESCON, and various forms of digital video into SONET/SDH,
typically using Virtual Concatenation (VCAT) to provide right-sized pipes for data services. Com-
pared to older framing schemes such as PoS (Packet over SONET/SDH), ATM (Asynchronous Trans-
fer Mode) and 8B/10B encoding, GFP offers significantly reduced latency and improved bandwidth
utilization. GFP offers two different mapping modes, GFP-T and GFP-F. The ITU standard defining
GFP is G.7041. GFP-F (GFP Framed) is normally used to encapsulate packet/frame-based protocols
such as IP/PPP or Ethernet/ MAC. The frame is entirely assembled before transmission through the
SONET/SDH network. GFP-T (GFP Transparent) offers direct transmission of data streams requiring
low-latency, such as VoIP, digital video (e.g. DVB-ASI) and SAN (e.g. Fibre Channel) applications.
GFP-T is optimized for protocols using 8B/10B encoding.
www.itu.int
Gigabit Ethernet A term describing various technologies for implementing Ethernet networking at a nominal speed of
1 Gb/s. Gigabit Ethernet is supported over both optical fibre and twisted pair cable. Physical layer
standards include 1000BASE-T, 1 Gb/s over cat-5e copper cabling and 1000BASE-SX for short to
medium distances over optic fibre. While it is currently deployed in high-capacity backbone network
links its speed is largely not yet required for small network installations. Gigabit Ethernet began to
penetrate the desktop as of 2000.
GMPLS Generalised Multi- Also known as Multi-protocol Lambda Switching, a technology that provides enhancements to Multi-
Protocol Label Switching protocol Label Switching (MPLS) to provide the control plane (signaling and routing) to support net-
work switching for time, wavelength, and space switching as well as for packet switching. In particu-
lar, GMPLS will provide support for photonic networking, also known as optical communications. It is
used not only to support packet based paths but other technologies such as Optical MUX (Multi-
plexer), ATM and Frame Relay switches. This common control plane promises to simplify network
operation and management by automating end-to-end provisioning of connections, managing net-
work resources, and providing the level of QoS that is expected in the new, sophisticated applications.
GPON Gigabit PON A PON (Passive Optical Network) which extends the BPON (Broadband PON) to support bitrates in
excess of 1 Gb/s. It is specied by ITU-T G.984.
www.ponforum.org, www.itu.int
GPRS General Packet An enhancement to the GSM mobile communication system that supports data packets. GPRS en-
Radio Service ables continuous flows of IP data packets over the system for such applications as web browsing and
file transfer. Supports up to 160 kb/s gross transfer rate. Practical rates are from 12 – 48 kb/s.
http://www.etsi.org, http://www.3gpp.org
GSN Global Seamless An ASON/GMPLS network demonstrator built by Deutsche Telekom in a joint effort with system
Network vendors in 2002. The focus of the GSN was the UNI (user network interface) and the ASON/GMPLS
functionalities within one operator domain.
ISSN 0085-7130 © Telenor ASA 2006

181Telektronikk 2.2005
GSN+ The phase 2 of the GSN (Global Seamless Network) demonstrator ready in 2004, focusing on the
NNI (Network-Network Interface) functionalities between domains and new services.
HDPE High Density A thermoplastic made from oil. It takes 1.75 kg of oil (in terms of energy and raw materials) to make
Polyethylene 1 kg of HDPE. HDPE is resistant to many different solvents and is often used in food containers like
containers for milk, liquid laundry detergent, etc., some plastic bags, containment of certain chemi-
cals, chemical resistant piping systems like those used in high-tech industry, and geothermal heat
transfer piping systems.
HDWDM High Density Wavelength
Division Multiplexing
HFC Hybrid Fibre Coax A network which incorporates both optical fibre and coaxial cable to create a broadband network.
It has been commonly employed by cable TV operators since the 1990s.
HIPER- A Point-to-MultiPoint (PMP) network architecture intended for high speed (up to 120 Mb/s) and high-
ACCESS QoS fixed wireless access. Applications include broadband access for residential and small business
users to a wide variety of networks as a flexible and competitive alternative to wired access net-
works, however HiperACCESS is not an LMDS-type systems. HiperACCESS standardization focuses
on solutions optimized for frequency bands above 11 GHz (e.g. 26, 28, 32, 42 GHz) with high spectral
efficiency under LOS (Line Of Sight) conditions. For bandwidths of 28 MHz, both FDD and TDD chan-
nel arrangements as well as H-FDD terminals are supported. HiperACCESS is an interoperable stan-
dard, allowing for PMP systems with base station and terminal stations from different manufacturers.
The HiperACCESS (HA) specifications are being developed by TC (Technical Commitee) BRAN.
www.etsi.org
HIPERLAN/2 A short-range variant of a broadband radio access network intended as a complementary access
mechanism for UMTS systems as well as for private use as a wireless LAN type system. HiperLAN
offers high speed (up to 54 Mb/s) access to a variety of networks including the UMTS core networks,
ATM networks and IP-based networks. Basic applications include data, voice and video, with specific
Quality of Service parameters taken into account. HiperLAN/2 systems can be deployed in offices,
classrooms, homes, factories, hot spot areas such as exhibition halls and, more generally, where
radio transmission is an efficient alternative or complements wired technology. The HiperLAN/2
specifications are being developed by ETSI Project BRAN.
www.etsi.org
IEEE 802.11 Refers to a family of specifications developed by the IEEE for wireless local area networks. It also
refers to the “Wireless LAN working group” of the IEEE 802 project. 802.11 specifies an over-the-air
interface between a wireless client and a base station or between two wireless clients. The IEEE
accepted the specification in 1997. There are several specifications in the 802.11 family, including
i) 802.11 – provides 1 or 2 Mbit/s transmission in the 2.4 GHz band, ii) 802.11a – an extension that
provides up to 54 Mbit/s in the 5 GHz band. It uses an orthogonal frequency division multiplexing
encoding scheme rather than FHSS or DSSS, iii) 802.11b provides 11 Mbit/s transmission in the
2.4 GHz band and was ratified in 1999 allowing wireless functionality comparable to Ethernet,
iv) 802.11g provides 20+ Mbit/s in the 2.4 GHz band, v) 802.11z is a method for transporting an
authentication protocol between the client and access point, and the Transport Layer Security (TLS)
protocol. More variants are also under preparation, including support of 100 Mbit/s traffic flows.
http://www.ieee802.org/11/
IEEE 802.3 The permanent CSMA/CD (Ethernet) working group of the IEEE 802 project.
http://www.ieee802.org/3/
IETF Internet Engineering A large open international community of network designers, operators, vendors, and researchers
Task Force concerned with the evolution of the Internet architecture and the smooth operation of the Internet.
It is open to any interested individual. The technical work of the IETF is done in its working groups,
which are organized by topic into several areas (e.g. routing, transport, security, etc). Much of the
work is handled via mailing lists. The IETF holds meetings three times per year. The IETF working groups
are grouped into areas and managed by Area Directors (AD). The ADs are members of the Internet
Engineering Steering Group (IESG). Providing architectural oversight is the Internet Architecture
Board (IAB). The IAB also adjudicates appeals when someone complains that the IESG has failed. The
IAB and IESG are chartered by the Internet Society (ISOC) for these purposes. The General Area
Director also serves as the chair of the IESG and of the IETF, and is an ex-officio member of the IAB.
The Internet Assigned Numbers Authority (IANA) is the central coordinator for the assignment of
unique parameter values for Internet protocols. The IANA is chartered by the Internet Society (ISOC)
to act as the clearinghouse to assign and coordinate the use of numerous Internet protocol parameters.
www.ietf.org/rfc/rfc3935.txt
ISSN 0085-7130 © Telenor ASA 2006

182 Telektronikk 2.2005
ILP Integer Linear In mathematics, linear programming (LP) problems are optimization problems in which the objective
Programming function and the constraints are all linear. Linear programming is an important field of optimization.
Many practical problems in operations research can be expressed as linear programming problems.
Certain special cases of linear programming, such as network flow problems and multicommodity
flow problems are considered important enough to have generated much research on specialized
algorithms for their solution. A number of algorithms for other types of optimization problems work
by solving LP problems as sub-problems. Historically, ideas from linear programming have inspired
many of the central concepts of optimization theory, such as duality, decomposition, and the impor-
tance of convexity and its generalizations. If the unknown variables are all required to be integers,
then the problem is called an integer programming (IP) or integer linear programming (ILP) problem.
In contrast to linear programming, which can be solved efficiently in the worst case, integer pro-
gramming problems are in the worst case undecidable.
IP Internet Protocol A protocol for communication between computers, used as a standard for transmitting data over
networks and as the basis for standard Internet protocols.
http://www.ietf.org
ISDN Integrated Services A digital telecommunications network that provides end-to-end digital connectivity to support a
Digital Network wide range of services, including voice and non-voice services, to which users have access by a lim-
ited set of standard multi-purpose user-network interfaces. The user is offered one or more 64 kb/s
channels.
http://www.itu.int
ITU International Tele- On 17 May 1865, the first International Telegraph Convention was signed in Paris by the 20 founding
communication Union members, and the International Telegraph Union (ITU) was established to facilitate subsequent
amendments to this initial agreement. It changed name to the International Telecommunications
Union in 1934. From 1948 a UN body with approx. 200 member countries. It is the top forum for discus-
sion and management of technical and administrative aspects of international telecommunications.
http://www.itu.int
ITU-T International Tele-
communication Union
– Standardization Sector http://www.itu.int/ITU-T/
LAN Local Area Network A network shared by communicating devices, usually in a small geographical area. A system that
links together electronic office equipment, such as computers and word processors, and forms a
network within an office or building.
LCAS Link Capacity A mechanism to dynamically alter the SONET/SDH bandwidth. Together with Generic Framing
Adjustment Scheme Procedure (GFP) and Virtual Concatenation (VC) LCAS are key enablers of new and flexible data ser-
vices over SONET/SDH. LCAS is specified by ITU-T G.7042.
www.itu.int
LED Light Emitting Diode A semiconductor device that emits incoherent narrow-spectrum light when electrically biased in the
forward direction. This effect is a form of electroluminescence. The color of the emitted light depends
on the chemical composition of the semiconducting material used, and can be near-ultraviolet, visi-
ble or infrared. Nick Holonyak Jr. (born 1928) of the University of Illinois at Urbana-Champaign
developed the first practical visible-spectrum LED in 1962.
Lightpath Optical circuit
Link protection A local protection mechanism protecting all the set of lightpaths crossing a and managed by the
termination nodes of the link.
LPDE Low Density Low density polyethylene (LDPE) is a thermoplastic made from oil. It is unreactive at room tempera-
Polyethylene tures, except by strong oxidizing agents, and some solvents cause its swelling. It can withstand tem-
peratures of 80 °C continuously and 95 °C for a short time. It is translucent or opaque, quite flexible,
and tough to the degree of being almost unbreakable. It is widely used for manufacturing various
containers, dispensing bottles, wash bottles, tubing, and various molded laboratory equipment. Its
most common use is in plastic bags.
LP-LD Low-power Laser
MAN Metropolitan Large computer networks usually spanning a campus or a city using wireless infrastructure or
Area Network optical fibre connections to link their sites. Some technologies used for this purpose are Asynchron-
ous Transfer Mode (ATM), Fibre Distributed Data Interface (FDDI) and Switched Multimegabit Data
Service (SMDS). These older technologies are in the process of being displaced by Ethernet-based
MANs in most areas. MAN links between LANs have been built without cables using either micro-
wave, radio, or infra-red free-space optical communication links.
ISSN 0085-7130 © Telenor ASA 2006

183Telektronikk 2.2005
MEMS Micro-Electro- Tiny mechanical devices that are built onto semiconductor chips and are measured in micrometres.
mechanical Systems In the research labs since the 1980s, MEMS devices began to appear as commercial products in the
mid-1990s. They are used to make pressure, temperature, chemical and vibration sensors, light re-
flectors and switches as well as accelerometers for airbags, vehicle control, pacemakers and games.
The technology is also used to make ink jet print heads, microactuators for read/write heads and all-
optical switches that reflect light beams to the appropriate output port.
MM Multimode A type of optical fibre mostly used for shorter distances, e.g. with a building. It can carry 1 Gbit/s for
typical building distances; the actual maximum speed (given the right electronics) depends upon the
actual distance. The earliest fibre optic cables used a technique termed multi-mode transmission.
The light signals from the laser are broken up into a number of paths along the length of the fibre
and is reflected off the fibre wall. The amount of reflection that occurs dictates the quality of the sig-
nal. Typical transmission speeds/distances limits are 100 Mbit/s up to 2 km, 1 Gbit/s for distances up
to 500–600 metres, and 10 Gbit/s for distances up to 300 metres. Multi-mode optical fibre has two
categories: Step Index and Graded Index. The core is the light transmission element at the center of
the optical fibre. All the light signals travel through the core. A core is typically glass made from a
combination of silicon dioxide (silica) and other elements. Graded index multimode fibre uses a lower
index of refraction towards the outer edge of the core. Therefore, the outer area of the core is less
optically dense than the centre, and light can go faster in the outer part of the core. A light ray fol-
lowing a mode that goes straight down the centre of the core has a shorter path compared to a ray
following a mode that bounces around in the fibre. All rays should arrive at the end of the fibre at the
same time.
MPLS Multi Protocol An IETF standard intended for Internet application. MPLS has been developed to speed up the trans-
Label Switching mission of IP-based communications over ATM networks. The system works by adding a much
smaller “label” to a stream of IP datagrams allowing “MPLS”-enabled ATM switches to examine and
switch the packet much faster.
www.ietf.org
MSTP Multi-Service
Transport Platform
MTTF Mean Time To Failure An expression of failure rate, which is the average frequency with which something fails. Failure rate
is important in the fields of reliability theory and product warranties. The failure rate depends on the
failure distribution, which describes the probability of failure prior to a specified time. The failure rate
is not always constant, so the hazard function is used to describe the instantaneous failure rate at
any point in time. A formal defintion of failure rate can be: “The total number of failures within an
item population, divided by the total time expended by that population, during a particular measure-
ment interval under stated conditions.” [MacDiarmid, P, Morris, S et al. (no date) Reliability Toolkit:
Commercial Practices Edition, 35–39. Rome, NY, Reliability Analysis Center and Rome Laboratory]
MVDS Multipoint Video
Distribution Service
MZM Mach-Zehnder Modulator A waveguide based optical modulator scheme based on a Mach-Zehnder (MZ) interferometer
arrangement. Here the optical signal is divided into two equal parts that are subsequently sent to
two waveguides of initially identical transmission properties and length such that the total phase
shift on propagation through these is exactly equal. One of the waveguides includes a part where
the phase shift can be varied. At the end of these two waveguides, the two signals are coupled back
together and interfere with each other. By varying the phase change through the variable phase
modulator, one can control the interference of the signals at the output and hence the amplitude of
the output signal. An intensity modulator can be constructed this way.
NGN Next Generation A network concept that aims at providing a framework to encompass the large variety of existing
Network and emerging protocols and services, facilitate a further evolution of these, decouple the evolution
from the underlying network infrastructure and facilitate the interfacing of a plethora of available
media. The rationale behind NGN lies founded in paradigm shifts that have been taking place within
the technological solutions and the business models in the telecom industry as a whole. The concept
is based on IP-technology and is being specified by ITU-T.
www.itu.int
NMS Network Management A combination of hardware and software used to monitor and administer a network.
System
NNI Network to Network
Interface
ISSN 0085-7130 © Telenor ASA 2006
NSFNET National Science A major part of early 1990s Internet backbone. Organisations connecting to the Internet in the early
Foundation Network 1990s had to sign a usage agreement directly with NSFNET to gain access to large parts of the Pub-
lic Internet, regardless of which Internet Service Provider they purchased Internet access from. From
1987 to 1995 the NSFNET was operated on behalf of the NSF by Merit Network, Inc, a non-profit cor-
poration governed by public Universities. On 30 April 1995, the NSFNET Backbone Service was suc-
cessfully transitioned to a new architecture, where traffic is exchanged at interconnection points
called NAPs (Network Access Point).
OADM Optical Add-Drop A main element of optical fibre networks which combines or multiplexes several lower-speed streams
Multiplexing of data into a single beam of light. OADMs can be used both in long-haul core networks and in
shorter distance metro networks.
OCDMA Optical Code Division In optical communications different signature sequences of optical pulses (codes) are used to
Multiple Access distinguish different data streams. The duration of the sequence must be at least equal to that of
a data bit.
OCh Optical Channel
OEO Optical-Electrical- A wavelength switch that terminates the optical signal at input and output and performs electrical
Optical switching.
OFDM Orthogonal Frequency A spread spectrum technique that distributes the data over a large number of carriers spaced apart
Division Multiplexing at precise frequencies. This spacing provides the “orthogonality” in this technique, which prevents
the demodulators from seeing frequencies other than their own. The benefits of OFDM are high
spectral efficiency, resilience to RF interference, and lower multi-path distortion. This is useful
because in a typical terrestrial wireless scenario there are multipath channels (i.e. the transmitted
signal arrives at the receiver using various paths of different length). Since multiple versions of the
signal interfere with each other (inter symbol interference (ISI)) it becomes very hard to extract the
original information. OFDM is sometimes called multi-carrier or discrete multi-tone modulation. It is
the modulation technique used for digital TV in Europe, Japan and Australia. It is used in DAB, ADSL
and WLAN 802.11a and g and WMAN 802.16 standards.
OH Hydroxyl Hydroxide (OH-) is a polyatomic ion consisting of oxygen (O) and hydrogen (H). It has a charge of -1.
Hydroxide is one of the simplest of the polyatomic ions. The term hydroxyl group is used to describe
the functional group OH when it is a substituent in an organic compound. Organic molecules con-
taining a hydroxyl group are known as alcohols. The hydroxyl radical, OH, is the neutral form of the
hydroxide ion. Hydroxyl radicals are highly reactive and consequently short lived.
OIF Optical Internet Industry group whose mission it is to foster the development and deployment of interoperable
working Forum products and services for data switching and routing using optical networking technologies. OIF’s
purpose is to accelerate the deployment of interoperable, cost-effective and robust optical inter-
networks and their associated technologies. Optical internetworks are data networks composed of
routers and data switches interconnected by optical networking elements.
http://www.oiforum.org/
OLT Optical Line Terminal Optical termination in the local exchange.
OMS Optical Multiplex Section The optical multiplex section layer provides transport for the optical channels. The information con-
- layer network tained in this layer is a data stream comprising a set of optical channels, which may have a defined
aggregate bandwidth.
ONU Optical Network A network element that is part of a fibre-in-the-loop system interfacing the customer analogue
Unit access cables and the fibre facilities.
OOO Optical-optical- Also called photonic switch or all-optical crossconnect. An optical wavelength switch that does not
optical terminate the optical signal.
OPEX Operations A company’s operational cost in contrast to CAPEX – Capital Expenditure, which is the company’s
Expenditure investment cost.
OSNR Optical Signal-to- The measure of the ratio of signal power to noise power in an optical channel. For a typical optical
Noise Ratio communication system for which the OSNR is relevant, the signal consists usually of nearly mono-
chromatic modulated light superimposed on a background comprised of (mostly unmodulated) opti-
cal power distributed over a broad wavelength range – a range including the signal wavelength. This
noise arises typically in optical amplification and it is better thought of as a power density rather
than a total power.
OSPF Open Shortest- A link-state, hierarchical Interior Gateway Protocol (IGP) routing protocol. The shortest path tree is
Path First calculated using cost as its routing metric. A link state database is constructed of the network topol-
ogy which is identical on all routers in the area.
184 Telektronikk 2.2005ISSN 0085-7130 © Telenor ASA 2006

185Telektronikk 2.2005
OTDR Optical Time Domain An opto-electronic instrument used to characterize an optical fibre. An OTDR injects a series of
Reflectometry optical pulses into the fibre under test. It also extracts, from the same end of the fibre, light that is
scattered back and reflected back. The intensity of the return pulses is measured and integrated
as a function of time, and is plotted as a function of fibre length. It may be used for estimating the
fibre’s length and overall attenuation, including splice and mated-connector losses. It may also be
used to locate faults, such as breaks.
OTH Optical Transport
Hierarchy www.itu.int
OTN Optical Transport ITU-T G.709
Network www.itu.int
OXC Optical Cross- A space-division switch that can switch an optical data stream from an input port to an output port.
Connect Such a switch may utilise optical-electrical conversion at the input port and electrical-optical con-
version at the output port or it may be all-optical. An OXC is assumed to have control plane proces-
sor that implements the signalling and routing protocols necessary for computing and instantiating
optical channel connectivity in the optical domain. {based on [ID-ipofw]}.
Path protection An end-to-end protection mechanism protecting a point-to-point optical connection and managed
by the source and destination nodes
PDH Plesiochronous A technology used in telecommunications networks to transport large quantities of data over digi-
Digital Hierarchy tal transport equipment such as fibre optic and microwave radio systems. The term plesiochronous
is derived from Greek plesio, meaning near, and chronos, time, and refers to the fact that PDH net-
works run in a state where different parts of the network are almost, but not quite perfectly, syn-
chronised. PDH is now being replaced by SDH (Syncronous Digital Hierarchy) equipment in most
telecommunications networks. PDH allows transmission of data streams that are nominally running
at the same rate, but allowing some variation on the speed around a nominal rate. The European
and American versions of the PDH system differ slightly in the detail of their working, but the princi-
ples are the same. The European system is described. The basic data transfer rate is a data stream
of 2.048 Mb/s. For speech transmission, this is broken down into 30 x 64 kb/s channels plus 2 x 64
kb/s channels used for signalling and synchronisation. Alternatively, the whole 2 Mb/s may be used
for non speech purposes, for example data transmission.
PG Protection group A set of optical connections that may be involved by common protection actions.
PL Protection Lightpath An optical lightpath that is used as an alternative to a working lightpath in case the latter
experiences failure, e.g. fibre cut or node failure.
PLANET Photonic Local Project AC050 in EUs 4th Framework Programme ACTS, lasting from 1996 to 2000. The objective of
Access Network the project was to define a cost effective full-service access network for the year 2000 supporting
a large splitting factor (up to 2000) and covering a wide range (up to 100 km). Especially the wide
range is required for a future access network in order to anticipate the expected switching node con-
solidation. The studied access network, called a SuperPON, has to give the subscriber access to both
narrowband/broadband, and distributive/interactive services.
PLOAM Physical Layer Operation,
Administration and
Maintenance
PMD Polarisation Mode A form of modal dispersion where two different polarizations of light in a waveguide, which normally
Dispersion travel at the same speed, travel at different speeds due to random imperfections and asymmetries,
causing random spreading of optical pulses.
PON Passive Optical Network A passive optical network (PON) is a system that brings optical fibre cabling and signals all or most
of the way to the end user. Depending on where the PON terminates, the system can be described
as fibre-to-the-curb (FTTC), fibre-to-the-building (FTTB), or fibre-to-the-home (FTTH). A PON con-
sists of an Optical Line Termination (OLT) at the communication company’s office and a number of
Optical Network Units (ONUs) near end users. Typically, up to 32 ONUs can be connected to an OLT.
The passive simply describes the fact that optical transmission has no power requirements or active
electronic parts once the signal is going through the network.
POTS Plain Old Telephone A very general term used to describe an ordinary voice telephone service. See also PSTN.
Service
ISSN 0085-7130 © Telenor ASA 2006
186 Telektronikk 2.2005
PRISMA Photonic Routing of Project AC349 in EUs 4th Framework Programme ACTS. The main objective was to increase the
Interactive Services flexibility of fibre-wireless networks, by introducing multiple wavelength channels in the fibre net-
for Mobile Applications work and selecting one or more wavelength channels as needed at the wireless base transceiver
stations (BTSs).
http://www.cordis.lu/infowin/acts/rus/projects/ac349.htm
Protection A resilience mechanism in which the back-up capacity is pre-planned.
PSTN Public Service Common notation for the conventional analogue telephone network.
Telephone Network
RAP Radio Access Point A device that “connects” wireless communication devices together to create a wireless network. It is
usually connected to a wired network, and can relay data between devices on each side. Many RAPs
can be connected together to create a larger network that allows roaming. In contrast, a network
where the client devices manage themselves is called an ad-hoc network.
Reliability The probability of failure of a component (a subsystem, a system).
Restoration A resilience mechanism in which the back-up capacity is dynamically searched for after a failure.
RFWA Routing, Fibre and The operation of assigning capacity to an optical connection in a mesh, multi-fibre and WDM
Wavelength Assignment network.
ROADM Reconfigurable OADM A new form of optical add-drop multiplexers (OADM) that adds the ability to switch individual net-
works. The key features of ROADMs is the ability to switch traffic and both the wavelength and
SONET/SDH layers.
RWA Routing and wave- The operation of assigning capacity to an optical connection in a WDM network.
length assignment
RZ Return-to-Zero A line code used in telecommunications signals in which the signal drops (returns) to zero between
each pulse. This takes place even if a number of consecutive zeros or ones occur in the signal. This
means that a separate clock does not need to be sent alongside the signal. The signal is self-clock-
ing. A variant, Return-to-zero, inverted, swaps the signal values for one and zero.
SA Single Armour Optical fibre cable technology in which the core is protected by a single layer of armoured steel wires.
SCMA SubCarrier Variant of frequency division multiple access used in optics. Different packet streams are modulat-
Multiple Access ed onto different electrical carrier frequencies. They subsequently modulate the light intensity of the
laser diode. The packet streams are thus put into different frequency bands. Each frequency band
constitutes an independent communication channel.
SDH Synchronous SDH is a standard technology for synchronous data transmission on optical media. It is the inter-
Digital Hierarchy national equivalent of North Amercan SONET. Both technologies provide faster and less expensive
network interconnection than traditional PDH equipment. It is a method of transmitting digital infor-
mation where the data is packed in containers that are synchronized in time enabling relatively sim-
ple modulation and demodulation at the transmitting and receiving ends. The technique is used to
carry high capacity information over long distances. SDH uses the following Synchronous Transport
Modules (STM) and rates: STM-1 (155 Mbit/s), STM-4 (622 Mb/s), STM-16 (2.5 Gb/s), and STM-64
(10 Gb/s). SDH is specified by ITU-T G.707.
www.itu.int
SLA Service Level A contract between a provider and a customer that guarantees specific levels of performance and
Agreement reliability at a certain cost. This contract should also define precisely what could be penalties and
back-up solutions in case of problems. SLA is especially important to define when an important part
of your system or activity relies on third party providers. SLA is also a very good approach for ser-
vices provided internally to your organisation where you should also have a customer approach
concern. [Awduche, D et al. Overview and Principles of Internet Traffic Engineering. May 2002. IETF
RFC 3272 ]
SLP Shared Link A protection scheme where link protection is implemented; i.e. where in case of failure routes are
Protection diverted around the failed link or node but where the rest of the path remains unaltered; and where
the protection link provides protection to more than one other link that then share link protection.
SLS Service Level
Specification
ISSN 0085-7130 © Telenor ASA 2006

187Telektronikk 2.2005
SM Single Mode An optical fibre in which only the lowest order bound mode can propagate at the wavelength of
interest. Single mode fibres are best at retaining the fidelity of each light pulse over longer distances
and exhibit no dispersion caused by multiple spatial modes; thus more information can be transmit-
ted per unit time giving single mode fibres a higher bandwidth in comparison with multi-mode fibres.
A typical single mode optical fibre has a core radius of 5 – 10 µm and a cladding radius of 120 µm.
Currently, data rates of up to 10 Gb/s are possible at distances of over 60 km with commercially
available transceivers.
SONET Synchronous A standard for optical telecommunications transport formulated by the Exchange Carriers Standards
Optical Network Association (ECSA) for the American National Standards Institute (ANSI), in ANSI T1.105.
http://www.ansi.org/, http://www.iec.org/online/tutorials/sonet/
SPP Shared Path A protection scheme where path protection is implemented; i.e. where in case of failure the whole
Protection path is diverted through an alternative route; and where the protection path provides protection to
more than one path that then share path protection.
STM Synchronous A transport level technique in which time-division multiplexing and switching is used across the
Transfer Mode user’s network interface.
STM-16 Synchronous Transfer
Mode transmission at
2.5 Gbit/s
STM-64 Synchronous Transfer
Mode transmission at
10 Gbit/s
Survivability The property of a system a network to completely or partly maintain its services in the presence
(resilience) of failures affecting some of its elements. This property is achieved by implementing in the system
suitable mechanisms of failure reaction (resilience strategy or mechanism), usually based on signal
duplication or traffic rerouting.
SW Software Essentially a computer program encoded in such a fashion that the program (the instruction set)
contents can be changed with minimal effort. Computer software can have various functions such as
controlling hardware, performing computations, communication with other software, human interac-
tion, etc; all of which are prescribed in the program. The term “software” was first used in this sense
by John W. Tukey in 1957; computer software is all information processed by computer system, pro-
grams and data. The concept of software was first proposed by Alan Turing in a report to National
Physics Laboratory (UK) in 1946 entitled “Proposed Electronic Calculator”.
TCP Transport Control Transport layer protocol defined for the Internet by Vint Cerf and Bob Kahn in 1974. A reliable octet
Protocol streaming protocol used by the majority of applications on the Internet. It provides a connection-
oriented, full-duplex, point-to-point service between hosts.
http://www.ietf.org
TDMA Time Division A technology for shared medium (usually radio) networks. It allows several users to share the same
Multiple Access frequency by dividing it into different time slots. The users transmit in rapid succession, one after the
other, each using their own timeslot. This allows multiple users to share the same transmission medium
(e.g. radio frequency) whilst using only the part of its bandwidth they require. Used in the GSM, PDC
and iDEN digital cellular standards, among others. TDMA is also used extensively in satellite systems,
local area networks, physical security systems, and combat-net radio systems.
TOBASCO Towards Broadband Project AC028 in EUs 4th Framework Programme ACTS. The main objective of the project was to up-
Access Systems for grade existing CATV networks having high splitting counts with broadband interactive services, by
CATV Optical Networks applying High-Density Wavelength Division Multiplexing (HDWDM).
http://www.cordis.lu/infowin/acts/rus/projects/ac028.htm
TPON Telephony over PON The original proposal for a Fibre to the Home (FTTH) network, but superseded by BPON (Broadband
PON), a much higher speed version capable of delivering multimedia high bandwidth services.
ULH Ultra Long Haul
ISSN 0085-7130 © Telenor ASA 2006

188 Telektronikk 2.2005
UMTS Universal Mobile The European member of the IMT 2000 family of 3G wireless standards. UMTS supports data rates
Telecommunication of 144 kb/s for vehicular traffic, 384 kb/s for pedestrian traffic and up to 2 Mb/s in support of in-
System building services. The standardisation work began in 1991 by ETSI but was transferred in 1998 to
3GPP as a corporation between Japanese, Chinese, Korean and American organisations. It is based
on the use of WCDMA technology and is currently deployed in many European countries. The first
European service opened in 2003. In Japan NTT DoCoMo opened its “pre-UMTS” service FOMA
(Freedom Of Mobile multimedia Access) in 2000. The system operates in the 2.1 GHz band and is
capable of carrying multimedia traffic.
http://www.3gpp.org/
Unavailability A fraction of the operational life of a component (a subsystem, a system) during which it is not
functioning or it is out of service.
UNI User Network A term used in ATM and Frame Relay networks, UNI is the interface between the ATM end user and
Interface a private ATM switch. It can also represent the interface between a private ATM switch and the pub-
lic carrier ATM network.
VC Virtual Container Data unit on SDG layer 1
VCAT VCAT enables transport pipes to be “right-sized” for various data payloads by allowing SONET/SDH
channels to be multiplexed in arbitrary arrangements. VCAT breaks down data packets and maps
them into the base units of TDM frames; e.g. STS-1 (51 Mb/s) for SONET, and AU4 (155 Mb/s) for
SDH. This data is then grouped into multiple data flows of varying size to create larger, aggregate
payloads optimally sized to match available SONET/SDH pipe capacity. VCAT is applied at the end-
points of the connections, which permits each channel used to be independently transmitted
through a legacy transport network. Data is typically encapsulated using GFP. The ITU standard for
VCAT is G.707.
VDSL Very high VDSL transmits data up to 26 Mb/s over short distances of twisted pair copper wire. The shorter the
speed Digital distance, the faster the connection rate. Specified by ITU-T G.993.1. Second generation, VDSL2,
Subscriber Line supports up to 100 Mb/s data rate either symmetric or asymmetric in the 1 – 3 km range. Specified in
ITU-T G.993.2.
www.itu.int
VOA Variable Optical
Attenuator
VoIP Voice over Internet Voice over Internet Protocol (also called VoIP, IP Telephony, Internet telephony, and Digital Phone)
Protocol is the routing of voice conversations over the Internet or any other IP-based network. The voice data
flows over a general-purpose packet-switched network, instead of traditional dedicated, circuit-
switched voice transmission lines.
VWP Virtual Wave- A method in which a signal path can travel on different wavelengths throughout the network. By
length Path avoiding a dedicated wavelength for an end-to-end connection, the network can reuse and optimize
wavelengths to provide the greatest amount of capacity.
WDM Wavelength A means of data transmission that uses optical multiplexing to enable two or more wavelengths each
division with its own data source to share a common fibre optic medium. Wavelength Division Multiplexing is
multiplexing a technology that allows optical signals operating at different wavelengths to be multiplexed onto a
single optical fibre and transported in parallel through the fibre. In general, each optical wavelength
may carry digital client payloads at a different data rate and in a different format. For example, a
mixture of SDH 2.5 Gbit/s and 10 Gbit/s can be carried over a single fibre. An optical system with
WDM capability can achieve parallel transmission of multiple wavelengths gracefully while main-
taining high system performance and reliability. Standardised WDM systems are specified by ITU as
Coarse (CWDM) and Dense (DWDM). CWDM is standardised in ITU-T G.694.1
www.itu.int
WDMA Wavelength Division In optical communication different wavelengths are used to send packets from different sources.
Multiple Access The wavelength constitutes independent communication channels and may carry different signal
formats.
Working A set of resources carrying traffic in normal network conditions (no failure).
capacity
(lightpath)
XC Crossconnect
ISSN 0085-7130 © Telenor ASA 2006