optical fiber power meter calibrations at nist ·...
TRANSCRIPT

NAT'L INST. OF STAND & TECH
II
NivST
PUBLJCATIONS
NIST Measurement Services:
Optical Fiber Power Meter nist
Calibrations at NIST ^^^^250-54
Igor VayshenkerXiaoyu Li
David J. Livigni
Thomas R. Scott
Christopher L. Cromer
X100
.057
NO.250-54
2000
NIST CENTENNIALS
National Institute of Standards and Technology • Technology Administration • U.S. Department of Commerce

#he National Institute of Standards and Technology was established in 1988 by Congress to "assist industry in
the development of technology . . . needed to improve product quality, to modernize manufacturing processes, to
ensure product reliability ... and to facilitate rapid commercialization ... of products based on nev\^ scientific
discoveries."
NIST, originally founded as the National Bureau of Standards in 1901, works to strengthen U.S. industry's
competitiveness; advance science and engineering; and improve public health, safety, and the environment. Oneof the agency's basic functions is to develop, maintain, and retain custody of the national standards of
measurement, and provide the means and methods for comparing standards used in science, engineering,
manufacturing, commerce, industry, and education with the standards adopted or recognized by the Federal
Government.
As an agency of the U.S. Commerce Department's Technology Administration, NIST conducts basic and
applied research in the physical sciences and engineering, and develops measurement techniques, test
methods, standards, and related services. The Institute does generic and precompetitive work on new and
advanced technologies. NIST's research facilities are located at Gaithersburg, MD 20899, and at Boulder, CO 80303.
Major technical operating units and their principal activities are listed below. For more information contact the
Publications and Program Inquiries Desk, 301-975-3058.
Office of the Director• National Quality Program
• International and Academic Affairs
Technology Services• Standards Services
• Technology Partnerships
• Measurement Services
• Information Services
Advanced Technology Program• Economic Assessment• Information Technology and Applications
• Chemistry and Life Sciences
• Materials and Manufacturing Technology
• Electronics and Photonics Technology
Manufacturing Extension PartnershipProgram• Regional Programs• National Programs• Program Development
Electronics and Electrical EngineeringLaboratory• Microelectronics
• Law Enforcement Standards
• Electricity
• Semiconductor Electronics
• Radio-Frequency Technology^
• Electromagnetic Technology^
• Optoelectronics^
Materials Science and EngineeringLaboratory• Intelligent Processing of Materials
• Ceramics• Materials Reliability^
• Polymers
• Metallurgy
• NIST Center for Neutron Research
Chemical Science and TechnologyLaboratory• Biotechnology
• Physical and Chemical Properties^
• Analytical Chemistry
• Process Measurements• Surface and Microanalysis Science
Physics Laboratory• Electron and Optical Physics
• Atomic Physics
• Optical Technology
• Ionizing Radiation
• Time and Frequency^
• Quantum Physics^
Manufacturing EngineeringLaboratory• Precision Engineering
• Automated Production Technology
• Intelligent Systems• Fabrication Technology
• Manufacturing Systems Integration
Building and Fire ResearchLaboratory• Applied Economics• Structures
• Building Materials
• Building Environment
• Fire Safety Engineering
• Fire Science
Information Technology Laboratory• Mathematical and Computational Sciences^
• Advanced Network Technologies
• Computer Security
• Information Access and User Interfaces
• High Performance Systems and Services
• Distributed Computing and Information Services
• Software Diagnostics and Conformance Testing
• Statistical Engineering
- 'At Boulder, CO 80303.
^Some elements at Boulder, CO.

NIST Special Publication 250-54
NIST MEASUREMENT SERVICES:Optical Fiber Power Meter Calibrations at NIST
Igor Vayshenker
Xiaoyu Li
David J. Livigni
Thomas R. Scott
Christopher L. Cromer
Optoelectronics Division
Electronics and Electrical Engineering Laboratory
June 2000
U.S. Department of CommerceWilliam M. Daley, Secretary
Technology Administration
Dr. Cheryl L. Shavers, Under Secretary of Commerce for Technology
National Institute of Standards and Technology
Raymond G. Kammer Director

Certain commercial entities, equipment, or materials may be identified in this document in order to
describe an experimental procedure or concept adequately. Such identification is not intended to imply
recommendation or endorsement by the National Institute of Standards and Technology, nor is it intended
to imply that the entities, materials, or equipment are necessarily the best available for the purpose.
National Institute of Standards and Technology Special Publication 250-54
Natl. Inst. Stand. Technol. Spec. Publ. 250-54, 41 pages (June 2000)
CODEN: NSPUE2
U.S. GOVERNMENT PRINTING OFFICEWASHINGTON: 2000
For sale by the Superintendent of Documents, U.S. Government Printing Office, Washington, DC 20402-9325

Contents
1. Introduction 1
2. Laboratory Standard 2
3 . Optical Fiber Power Meter Calibrations 6
3 . 1 Measurement Equation 6
3.2 Calibrations Using Fixed Laser Wavelengths 6
3.2.1 Measurement Assurance Program 1
0
3.3 Calibrations Using Variable Wavelengths From Tunable Laser Diodes 11
3.3.1 Tunable Laser Diode 11
3.3.2 Measurement System 13
3.4 Fiber Connector Issues 14
4. Uncertainty Assessment 15
5. Future Work 22
6. References 22
Appendix A. Laser Diode Optical Spectra 24
Appendix B. Measurement Flow Chart 25
Appendix C. Sample of a Calibration Report 26
Appendix D. Wavelength History 32
Appendix E. Sample Results and Shipping Instructions for MAP 33
Appendix F. Sample Data Sheet for MAP 34
Appendix G. ECPR Linearity Measurements 35
Appendix H. ECPR Uniformity Scans 36
iii


Optical Fiber Power Meter Calibrations at NIST
Igor Vayshenker, Xiaoyu Li, David J. Livigni, Thomas R. Scott, and Christopher L. Cromer
National Institute of Standards and Technology
325 Broadway, Boulder, CO 80303, USA
NIST has established measurement services for the calibration of optical fiber power
meters at the three nominal wavelengths of 850, 1300, and 1550 nm using either
coUimated beam or optical fiber/connector configurations. This paper describes the
measurement standards, techniques, systems, and uncertainties involved with the
NIST optical fiber power meter calibration services.
Key words: calibration; cryogenic radiometer; measurement service; optical power;
optical fiber power meter; spectral responsivity; tunable laser diode; uncertainty;
uniformity.
1. Introduction
The optical fiber power meter (OFPM) is perhaps the most common type of test equipment used
to support the development and implementation of optical fiber systems. To address the inherent
metrology requirements, NIST has developed and implemented measurement services to help
characterize these instruments [1]. These measurement services consist primarily of absolute laser
power calibrations using either coUimated beam or optical fiber/connector configurations. In
addition, NIST provides measurements of uniformity, nonlinearity, spectral responsivity (based
both on tunable lasers and broadband incoherent light sources) for OFPMs. Calibrations are
available at the three principal wavelength regions used by the optical fiber telecommunications
industry, 850, 1300, and 1550 nm and, consequently, our measurement services are based
primarily on these wavelengths. Other optical power meter users (e.g., compact-disc player
manufacturers, users of erbium-doped fiber amplifiers) are additionally interested in wavelengths
^ of 670, 780, and 980 nm. We have also incorporated these wavelengths into our absolute laser
power calibration program.
Most OFPMs are based on photodiode sensors made of either silicon (Si), germanium (Ge), or
indium gallium arsenide (InGaAs) and, thus, the accurate calibration of these devices must
accommodate the inherent characteristics of these devices (e.g., output sensitivity to both spectral
and spatial profile of the incident electromagnetic radiation). The electromagnetic radiation is
typically provided by laser diodes operating in single-mode or multimode configurations. Unlike
solid-state or gas lasers, which operate at well defined wavelengths, diode lasers (due to the
manufacturing process) do not operate at a specific wavelength (or center wavelength, for
muhimode lasers) but typically emit radiation that is within ±10 nm of some desired value.
Factors such as temperature variation can also change the wavelength profile. Consequently,
1
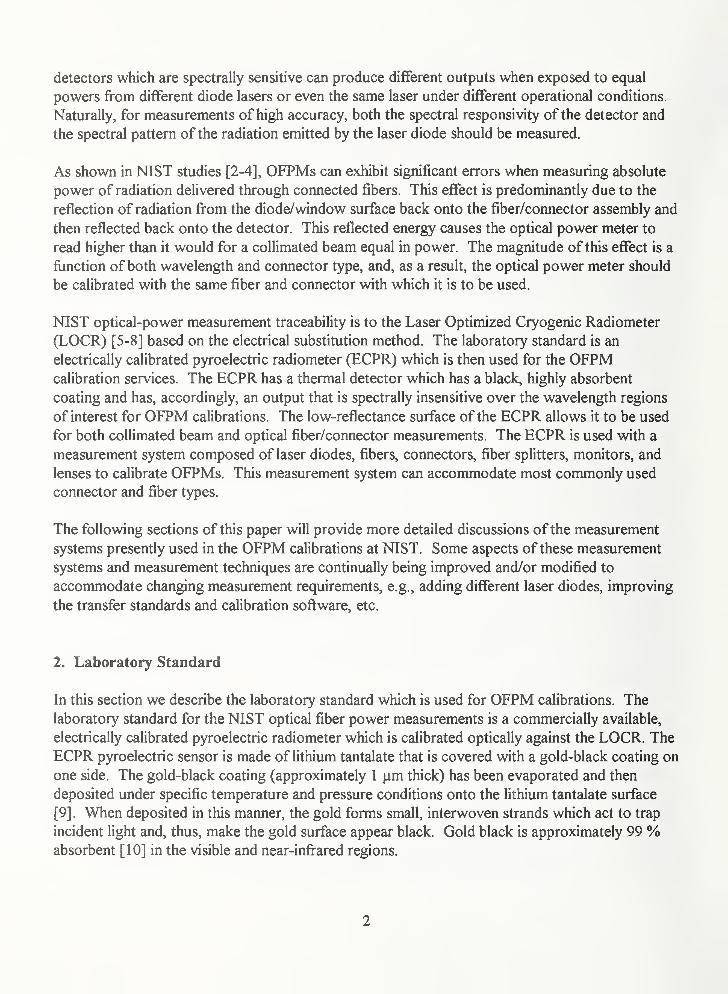
detectors which are spectrally sensitive can produce different outputs when exposed to equal
powers from different diode lasers or even the same laser under different operational conditions.
Naturally, for measurements of high accuracy, both the spectral responsivity of the detector and
the spectral pattern of the radiation emitted by the laser diode should be measured.
As shown in NIST studies [2-4], OFPMs can exhibit significant errors when measuring absolute
power of radiation delivered through connected fibers. This effect is predominantly due to the
reflection of radiation from the diode/window surface back onto the fiber/connector assembly and
then reflected back onto the detector. This reflected energy causes the optical power meter to
read higher than it would for a coUimated beam equal in power. The magnitude of this effect is a
function of both wavelength and connector type, and, as a result, the optical power meter should
be calibrated with the same fiber and connector with which it is to be used.
NIST optical-power measurement traceability is to the Laser Optimized Cryogenic Radiometer
(LOCR) [5-8] based on the electrical substitution method. The laboratory standard is an
electrically calibrated pyroelectric radiometer (ECPR) which is then used for the OFPMcalibration services. The ECPR has a thermal detector which has a black, highly absorbent
coating and has, accordingly, an output that is spectrally insensitive over the wavelength regions
of interest for OFPM calibrations. The low-reflectance surface of the ECPR allows it to be used
for both coUimated beam and optical fiber/connector measurements. The ECPR is used with a
measurement system composed of laser diodes, fibers, connectors, fiber splitters, monitors, and
lenses to calibrate OFPMs. This measurement system can accommodate most commonly used
connector and fiber types.
The following sections of this paper will provide more detailed discussions of the measurement
systems presently used in the OFPM calibrations at NIST. Some aspects ofthese measurement
systems and measurement techniques are continually being improved and/or modified to
accommodate changing measurement requirements, e.g., adding different laser diodes, improving
the transfer standards and calibration software, etc.
2. Laboratory Standard
In this section we describe the laboratory standard which is used for OFPM calibrations. The
laboratory standard for the NIST optical fiber power measurements is a commercially available,
electrically calibrated pyroelectric radiometer which is calibrated optically against the LOCR. The
ECPR pyroelectric sensor is made of lithium tantalate that is covered with a gold-black coating on
one side. The gold-black coating (approximately 1 |im thick) has been evaporated and then
deposited under specific temperature and pressure conditions onto the lithium tantalate surface
[9]. When deposited in this manner, the gold forms small, interwoven strands which act to trap
incident light and, thus, make the gold surface appear black. Gold black is approximately 99 %absorbent [ 1 0] in the visible and near-infrared regions.
2

Pyroelectric sensors produce an electrical voltage proportional to instantaneous temperature
changes [9] and, as a result, the laser energy incident onto the detector must be modulated in
order to use this type of detector to measure CW radiation. The particular detector we use has a
chopper wheel which is placed in front of the pyroelectric sensor and is used to 'chop' the beam
into pulses at a rate of 1 5 Hz. Because pyroelectric materials are also piezoelectric, vibration
sources must be minimized.
The ECPR is frequently used as a laboratory standard in many optical fiber power calibration
laboratories because (1) it is sensitive to low power radiation, (2) it is relatively spectrally flat, and
(3) it has a low surface reflectance in the 600 nm to 1600 nm wavelength region. This particular
type ofECPR is used in the 10 to 1000 ^iW power range which is the range of primary
importance in optical fiber power calibrations. Below 10 ^iW the output becomes too noisy to
use reliably and above 1000 |xW it becomes nonlinear. On the negative side, the ECPR has some
disadvantages: (1) nonuniformity of response across the detector surface and (2) fragile nature of
the sensor and gold-black coating.
Before the ECPR is used as a laboratory standard, it is first calibrated against the LOCR (direct
substitution) at wavelengths of 633, 1319, and 1550 nm using the system shown in Figure 1. Both
the LOCR and ECPR are placed on a motion-controlled stage. Various filters are used to 'clean'
the laser beam by removing high-order components. Power is stabilized to achieve high-accuracy
measurements. An optical chopper is placed in the beam when using the ECPR; the chopper is
removed when using the LOCR. The LOCR was designed to accurately measure the
electromagnetic radiation produced by CW (continuous wave) laser sources in the milliwatt
power range. The LOCR was constructed to accommodate the unique characteristics of laser
radiation (e.g., nonuniform intensity profiles, temporal and spatial coherence) and can be used
over a wide wavelength range. The LOCR's standard uncertainty is 0.02 % at a power of 1 mW.The results of several calibrations are given in Table 1 . The details of the ECPR calibration
against the LOCR are described in a separate document [11]. To verify the ECPR spectral
flatness, we calibrate it at several laser wavelengths against the national primary standard, the
LOCR.
The ECPR has an analog voltage output port, but due to the limited resolution of the digital-to-
analog converter, this output lacks the accuracy ofboth the display and the BCD outputs;
consequently, to obtain the best ECPR measurement results, either the display reading or the
BCD output can be used. For the NIST ECPR calibration, the BCD output is used and is sent to
a BCD-to-analog voltage converter. The analog voUage from the converter is then measured
with a digital voltmeter.
3

Figure 1 . Measurement configuration for ECPR calibration.
Table 1. Calibration factors for ECPR#618 referenced to LOCR.
Date Source wavel.
(nm)
Calibration
factor
Standard combined
uncertainty/%
11/98 633 0.9978 0.16
11/98 1319 0.9945 0.16
11/98 1550 0.9946 0.16
One ofthe major error sources for the ECPR is the variation of response of the detector for
radiation (at constant power) striking different spots of the detector surface. Figure 2 shows a
contour map, generated fi"om a spatial uniformity scan that is performed on a NIST ECPR using a
beam 2.0 mm (±0. 1 mm) in diameter (at 1/e^ intensity points) at a wavelength of 1557 nm and
using 0.2 mm beam steps. This scan was accomplished using a uniformity measurement system,
designed and developed at NIST for characterizing spatial response of optical detectors [12].
4

Relative responsivity (%)
-2.00 -1.00 0.00 1.00 2.00
X— Axis Position (mm)
Figure 2. Contour map ofthe entire dataset, 0.1 % contour line spacing.
The uncertainty due to the nonuniformity ofthe ECPR sensor can be minimized by always using
approximately the same size beam for both the LOCK measurements and for the optical power
meter calibration measurements. Also, the laser beam is always centered on the sensor surface
and the chopper wheel aperture. To assure that a beam of a similar size (during coUimated beam
measurements) is always used, we employ a laser beam-profile instrument to measure beam size at
the detector location.
The quality-assurance procedure for checking the ECPR before a routine calibration is described
in Section 3.2.
5

3. Optical Fiber Power Meter Calibrations
In this section we describe the measurement equation and the OFPM measurement. We also
discuss Measurement Assurance Program (MAP) comparisons ofOFPMs.
3.1 Measurement Equation
Upon completion of the OFPM calibration, the customer is given a calibration report that lists the
resulting calibration factor(s). The calibration factor is obtained by dividing device under test
(DUT) net display reading by the incident power. Thus, ifthe display readings of the DUT are
divided by the calibration factor, then, on the average, the resulting values will agree with the
NIST national standards. The calibration factor, is given below:
Fc=(Pdut*V,)/(Ps*V^, (1)
where Pd^ is the test power meter reading in units of optical power (nW), voltage
or current,
Ps is the ECPR reading in units of nW,V, is the monitor reading in units ofV with the ECPR in place,
V2 is the monitor reading in units ofV with the DUT in place.
Each of the variables in the eq (1) represents a signal with a background reading subtracted. The
calibration factor in this paper is the inverse ofthe correction factor described in reference [13].
Also, the correction factor obtained from our nonlinearity measurements [14] is used to 'correct'
a calibration factor determined at a power of 100 |iW.
3.2 Calibrations Using Fixed Laser Wavelengths
Figure 3 shows the measurement system configuration used for coUimated beam and optical
fiber/connector measurements during the calibration ofOFPMs. The ECPR is used for these
calibrations. The system contains several laser source plates, a connector converter stage (for
connectorized measurements), lens assembly (for collimated beam measurements), and a
positioning stage for comparing the ECPR and the test meter being calibrated.
An enlarged view of a laser source plate is shown in Figure 4. All system optical fibers are single-
mode, whereas the customer's fiber may be either single-mode or multimode. Each laser source
plate contains a laser diode whose output is transmitted through a fiber to a fiber splitter from
which about 1 % of the energy travels through a fiber to a monitor detector. The remaining 99 %of the energy is transmitted through another fiber to the meter being calibrated. Loose fibers
throughout the system are wrapped on spools 5 cm in diameter to minimize transient microbend
6

losses. Also, in this regard, all fibers are securely fixed so that they cannot move during the
measurements. All the lasers (except for 1550 nm) are of Fabry-Perot types and have several
longitudinal (spectral) modes (see Appendix A). The coherence length of each of these lasers is
approximately a few centimeters. The 1550 nm laser is a distributed feedback (DFB) laser with a
coherence length of a few hundred meters. The lasers' wavelengths are checked periodically
(twice a year). Some ofthe lasers have been used for over 10 years and have demonstrated high
stability over that period.
Digital
Voltmeter
Temperature
Controller
Laser Powei
Siq)ply
Sample
(}St
Rotatable
Mounting
Platform
850 nmKPlate
Positioning
Rail
Data Acquisiti(H} &Analysis System
1550 nmPlate
NISTECPRchopper
User's fiber/connector
or collimated beam
BCD/GPBConverter
I
NIST Standard
(ECPR)
User Test
Meter
Figure 3. Measurement system.
7

Fibato
connector
converter
plate
Figure 4. Laser source plate.
As shown in Figure 4 (as well as in Figure 3) a U-shaped collimator fixture is positioned in the
propagation path following each diode laser. This fixture contains two lenses that provide a
coUimated beam for the ECPR chopper wheel to access. When the chopper wheel is inserted into
the space provided by this fixture, a chopped beam is then incident on the detectors (i.e., the
monitor and the ECPR). The same chopper is used when the ECPR is calibrated against the
LOCR. A 'sample-and-hold' current-to-voltage converter is used to monitor the output, and
provide an equivalency between powers in CW and chopped beams (the difference between CWand chopped signals contributes to the uncertainty of a measurement). This converter utilizes a
capacitor that stores the peak voltage reading fi-om the chopped signal until the digital voltmeter
takes a reading. Each time the ECPR is used for measurements in this system, the chopper wheel
is inserted into the collimator fixture opening and is removed when not using the ECPR. The
misalignment ofthe chopper is included in the uncertainty calculation.
For collimated beam measurements, a lens at the end ofthe fiber path provides a collimated beam
to the ECPR and test meter. Note: when using the collimated beam, the calibration factor mayvary if the power meter under test has nonuniform spatial responsivity and/or a window that
exhibits transmittance variations fi^om coherent interference of multiple reflections. These effects
may increase the measurement variation that depends on specific properties of the meter under
test. For connectorized measurements, the customer's fiber is connected to the measurement
system, which accepts a popular FC/PC (physical contact) optical fiber connector. Ifthe
customer's fiber connector is different fi^om FC/PC type, we use a hybrid jumper cable.
8

The first step in a calibration measurement is the determination of power in either the coUimated
beam or fi^om the end of a fiber, whichever is appropriate for a particular situation. For this
measurement, either the ECPR is placed in the path ofthe collimated beam or else the customer's
fiber is connected to the ECPR using appropriate adapters. In either case, both the ECPRreadings and the monitor detector vohages, V, in eq (1) are recorded. Twenty pairs of
measurements are taken over 30 s (we wait 30 s before taking the measurements for the ECPRreadings to stabilize). Then the ECPR is moved and replaced by the test meter. For
connectorized fiber measurements, the fiber connector is moved fi^om the ECPR to the test meter.
The test meter readings and the monitor detector voltages, in eq (1) are then recorded. Ten or
twenty pairs of measurements are taken. Finally, the ECPR is placed back into the beam path (or
reconnected to the fiber), and, again, the ECPR and monitor detector readings are recorded.
Twenty pairs of measurements are taken. The flow chart ofthe measurement is shown in
Appendix B. The absolute power incident onto the test meter is established by the average ECPRpower readings. Power changes (e.g., due to diode laser instability) are taken into account by the
monitor detector readings. Thus, this method relies on the short-term stability of the power
splitting between the monitor and a customer's fiber, not on its actual value. The 'before' and
'after' ECPR/monitor detector measurements help confirm the stability of power splitting. If the
ratio change exceeds a threshold of 0.25 %, then the measurements are repeated since it indicates
something in the system has not stabilized. This difference is used to calculate the uncertainty of
the calibrations. To check the performance of the sample-and-hold circuit and the stability of the
laser sources, two measurements are taken, with and without the chopper. Ifthe difference of
these two signals exceeds a threshold of 0.25 %, then the operator will redo the measurements.
This difference is found for a quality-control check only and is not used for the uncertainty
calculations. Usually, six runs are performed on a test meter; for quality control two sets of three
runs are performed on different days.
We provide quality assurance for the laboratory standard by using a check standard. Before each
routine calibration, the check standard (a dedicated power meter, e.g., HP 8152A with a Gesensor 8 152 IB #155) is placed in the measurement system shown in Figure 3. The calibration is
performed with a dedicated fiber and the results are stored in a history file. The calibration factor
of each particular run is compared with the value obtained in the past. Table 2 shows the results
ofmeasurements performed on the NIST check standard.
A sample copy of a calibration report is provided in Appendix C.
9
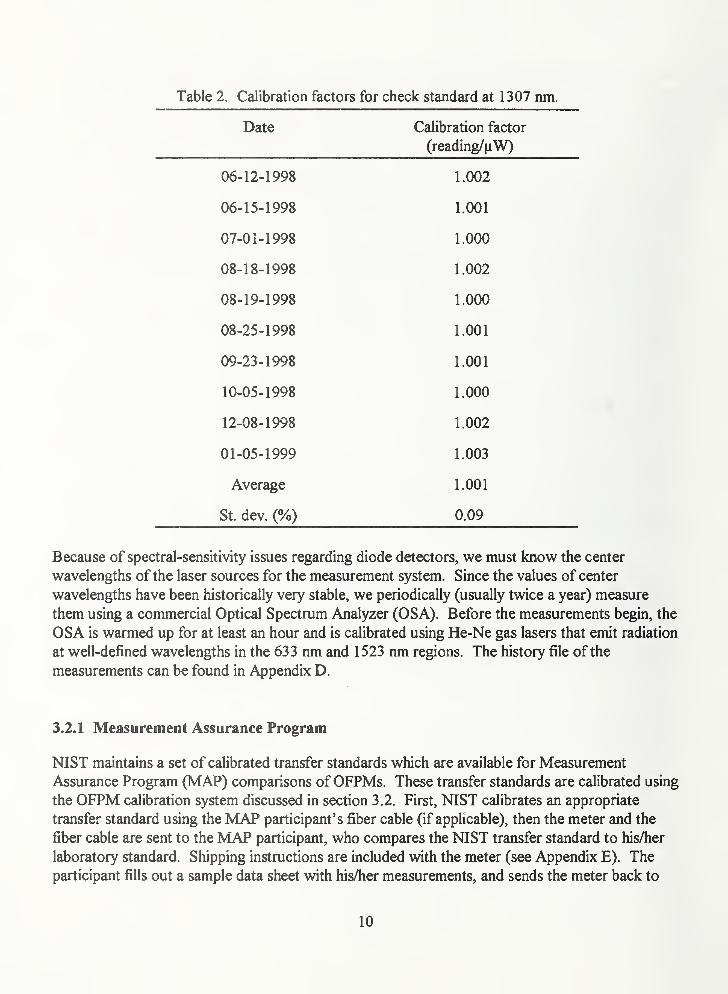
Table 2. Calibration factors for check standard at 1307 nm.
Date Calibration factor
(reading/^iW)
06-12-1998 1.002
06-15-1998 1.001
07-01-1998 1.000
08-18-1998 1.002
08-19-1998 1.000
08-25-1998 1.001
09-23-1998 1.001
10-05-1998 1.000
12-08-1998 1.002
01-05-1999 1.003
Average 1.001
St. dev. (%) 0.09
Because of spectral-sensitivity issues regarding diode detectors, we must know the center
wavelengths of the laser sources for the measurement system. Since the values of center
wavelengths have been historically very stable, we periodically (usually twice a year) measure
them using a commercial Optical Spectrum Analyzer (OSA). Before the measurements begin, the
OSA is warmed up for at least an hour and is calibrated using He-Ne gas lasers that emit radiation
at well-defined wavelengths in the 633 nm and 1523 nm regions. The history file of the
measurements can be found in Appendix D.
3.2.1 Measurement Assurance Program
NIST maintains a set of calibrated transfer standards which are available for Measurement
Assurance Program (MAP) comparisons ofOFPMs. These transfer standards are calibrated using
the OFPM calibration system discussed in section 3.2. First, NIST calibrates an appropriate
transfer standard using the MAP participant's fiber cable (if applicable), then the meter and the
fiber cable are sent to the MAP participant, who compares the NIST transfer standard to his/her
laboratory standard. Shipping instructions are included with the meter (see Appendix E). The
participant fills out a sample data sheet with his/her measurements, and sends the meter back to
10

NIST with the data sheet (see Appendix F). The results of the two sets ofNIST measurements
are averaged. Then, participant's resuhs are compared to the NIST average. If the difference
between two sets of data is larger than the uncertainty of the measurement (approximately 0 .5 %),
the measurements are repeated. The MAP Calibration Report then summarizes the results of this
comparison including an assessment ofthe associated uncertainties.
3.3 Calibrations Using Variable Wavelengths from Tunable Laser Diodes
NIST provides services for OFPM calibrations at fixed wavelengths using both coUimated beam
and fiber/connector configurations. However, most users have laser sources whose center
wavelengths differ fi-om those used by NIST. To apply NIST's calibration results to the test
meter, the meter user must know both the spectral responsivity of the detector and the source
wavelength. If the user's source wavelength is different fi"om the wavelength used by NISTduring the calibration, the calibration results must be adjusted appropriately. Therefore, it is
important to either calibrate the OFPM at the user's laser source wavelength, or provide the user
with a spectral responsivity information for the detector used in the OFPM [15].
In this section, we describe a measurement system developed by NIST to calibrate OFPMs at
adjustable wavelengths using either coUimated-beam or connectorized-fiber configurations. This
calibration system uses power-stabilized tunable laser diodes which operate in the three fiber
optics windows of 850 (±15) nm, 1300 (±30) nm, and 1550 (±30) nm. The lasers include optical
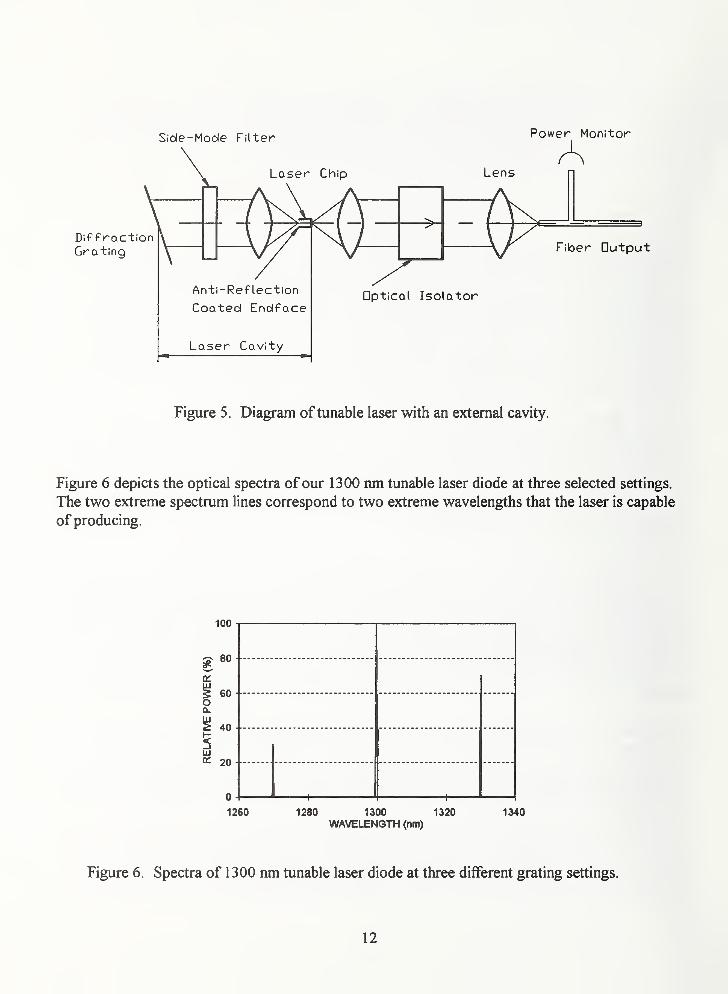
isolators to decrease feed back reflections and improve stability (see Figure 5). This system is
similar to the system described in Section 3.1.
3.3.1 Tunable Laser Diode
To minimize potential measurement errors associated with source wavelength and detector
spectral responsivity, we have installed tunable laser sources in the measurement system. The
gain medium ofthe tunable laser is a conventional laser diode but the internal Fabry-Perot
resonator is disabled by an antireflection coating on one of the facets. An external cavity is
created by adding an external diffraction grating that acts both as a mirror and a wavelength-
selective element.
The output power, single-mode operation, and wavelength stability depend strongly on
temperature stability. CoUimating lenses, shown in Figure 5, collect the divergent laser beam.
Since the beam diverges as much as 45°, the lenses must have a numerical aperture (NA) of 0.4
and have surfaces whose wavefi^ont aberrations are less than A/4, where X is the wavelength ofthe
laser radiation.
The lasers use optical isolators to decrease backreflections, which deteriorate the laser power
stability. We have also added a radio-fi^equency source (10 ^W in power and 10 MHz in
fi-equency) to the DC drive current to decrease source coherence and further reduce effects of
backreflection.
11
Laser Cavity
Figure 5. Diagram of tunable laser with an external cavity.
Figure 6 depicts the optical spectra of our 1300 nm tunable laser diode at three selected settings.
The two extreme spectrum lines correspond to two extreme wavelengths that the laser is capable
of producing.
100
OL
^ 60 •
OQ.
^ 40
3UJCC 20
0 \ <——I M 1——'
1
1260 1280 1300 1320 1340WAVELENGTH (nm)
Figure 6. Spectra of 1300 nm tunable laser diode at three different grating settings.
12

Monitor
Collimator
Figure 7. Tunable laser diode stage.
3.3.2 Measurement System
Since this system is similar to the measurement system that uses fixed-wavelength laser diodes, wewill not describe this system in detail (see Section 3.1 and Figure 3). An enlarged view of a laser
source plate is shown in Figure 7. All the optical fibers in the system are single-mode. Each plate
contains a laser diode whose output is transmitted to a fiber splitter fi-om which about 5 % of the
power is diverted to a monitor and about 1 % of the power to the calibrated OSA.
The remaining power is transmitted through a fiber to the meter being calibrated. All fibers are
securely fixed so that they will not move during the measurements. A U-shaped collimator is
positioned in the propagation path following each diode laser. This collimator contains two
lenses, which provide a coUimated beam for the ECPR chopper wheel. When the chopper wheel
is inserted into the space provided by this fixture, a chopped beam is then incident onto the
detectors (the monitor and the ECPR). To illustrate its capabilities. Figure 8 depicts measured
responsivity of a typical germanium detector in the 1550 nm region using the NIST tunable laser
system.
13

1
0.95
0.9
^ 0.85
wI 0.8
Q.Wy 0.75
0.7
0.65
1520 1530 1540 1550 1560 1570
WAVELENGTH (nm)
Figure 8. Sample Ge detector responsivity curve using 1550 nm tunable laser diode.
3.4 Fiber Connector Issues
In several optical fiber connector studies [2-4], we showed that the OFPM responsivity can vary
dramatically when using various types of connectors or even connectors of the same type but
from different vendors. We investigated the magnitude of this connector-induced variation by
calibrating several types ofOFPMs at wavelengths of 850, 1310, and 1550 nm. In these
measurements we varied the connector type and connector vendor, and observed the resulting
offsets in calibration results.
When optical fiber power is measured, radiation is transmitted to an OFPM through a fiber attached
to a detector by a fiber connector and adapter. The proximity ofa fiber connector to the detector and
its associated window provide an opportunity for reflections to introduce offsets in the power
readings. Even though the measurements using a fiber connector are generally repeatable, changing
connectors can skew the measurements results. We selected six common connector types (FC/PC,
FC/APC, ST, biconic, SC, and SMA) from four vendors chosen randomly. Calibrations were
performed on four types of power meters and at wavelengths of 850, 1310, and 1550 nm.
We found significant measurement offsets resulting from the use ofvarious connectors and a
variability within a single connector type obtained from different vendors. Thus, possible errors
could likely occur when changing types of connectors or connector vendors on fibers connected
to OFPMs. For accurate calibration measurements, meter owners should be aware of the
14

connector effects. A laboratory standard such as a thermal device, whose output is insensitive to
the connector types, is a useful tool when determining effects due to various connectors. The
connector adapter used with the connector is an integral part of the measurement.
The magnitude ofthe connector-induced offset is wavelength-dependent. The offset is small if a
connector has low reflectivity or if the power meter sensor is angled. Also, antireflection coatings
can help minimize this effect. It is very important to calibrate an OFPM with the same type of
connector used in the actual measurement.
4. Uncertainty Assessment
In this section we will assess the uncertainty for the optical fiber power measurement system. The
uncertainty estimates for the NIST optical fiber power measurements are described and combined
using the referenced guidelines [16]. To establish the uncertainty limits, the uncertainty sources
are separated into Type A, whose magnitudes are obtained statistically from a series of
measurements, and Type B, whose magnitudes are determined by subjective judgement.
The Type A uncertainty components are assumed to be independent and, consequently, the
standard deviation, for each component is
S. =
^
NN-1
(2)
where the x values represent the individual measurements and N is the number ofx values used
for a particular Type A component. The standard deviation ofthe mean is S/N'^\ and the total
standard deviation of the mean is [S(Sr^/N)]'^\ where the summation is carried out for all Type Acomponents.
All the Type B components are assumed to be independent and have rectangular or uniform
distributions (that is, each has an equal probability of being within the region, ±6^, and zero
probability of being outside that region). Ifthe distribution is rectangular, the standard deviation,
Og, for each Type B component is equal to 6/3'''' and the total 'standard deviation' is (SOg^)'"'',
where the summation is performed over all Type B components.
The combined uncertainty is determined by combining the Type A and Type B standard deviations
in quadrature; the expanded uncertainty is obtained by multiplying this resuh by a coverage factor
of 2. The expanded uncertainty, U, is then
15

Yo'^y^ (3)
r ^ r N
The number of decimal places used in reporting the mean values of the calibration factor are
determined by expressing the expanded NIST uncertainty to two significant digits.
In Tables 5 through 7, we describe the OFPM calibration uncertainty using Type A and Type Bcomponents. Items a-f (for Type B components) do not change in the uncertainty assessment,
while item g depends on specific calibration conditions.
Type A:
a. Laser power stability: During the calibration of an OFPM, fluctuations in the splitting ratio of
power going to the test detector (or ECPR) and the monitor detector can cause a possible error.
Also, since the monitor detector and the ECPR have different time constants, a rapidly fluctuating
laser diode source can cause an uncertainty in the system ratio measurement. The power stability
uncertainty is estimated by observing the 'before' and 'after' (calibration) ECPR readings relative
to the monitor output. The difference is recorded and used for the uncertainty calculation. The
laser stability standard uncertainty is equal to the difference in the two system ratios. The
standard uncertainty changes for each particular calibration.
b. Repeatability: This is an uncertainty due to the scatter of data points around the measurement
average obtained from the series of calibration runs (usually six) on the OFPM being calibrated.
TypeB:a. Ancillary electronics: This uncertainty is due to the combined effect of possible errors in the
electronic equipment used in the electrical and laser measurements (the standard uncertainty is
0.01 %), and a misalignment of the ECPR chopper (the standard uncertainty is 0.04 %). The
values for standard uncertainties are obtained from reference [9] and manufacturers' manuals [17-
18]. These values are listed in Tables 3 through 5. The combined standard uncertainty is equal to
0.04 %.
b. LOCR: This uncertainty consists oftwo primary components: window transmittance and
cavity absorptivity. The window transmittance is measured at several location on the windowbefore and after the calibration. The cavity absorptivity uncertainty is due to radiation which
scatters or reflects from the LOCR and, consequently, does not contribute to heating the cavity.
The cavity is constructed to minimize this effect as well. The standard combined uncertainty is
equal to 0.02 % as described in reference [11].
c. ECPR linearity: This uncertainty is due to the different powers during the calibration ofthe
ECPR against LOCR and actual calibration of a power meter against the ECPR. The magnitude
U = 2^
16

of this uncertainty is based on an evaluation of past results in Appendix G that gives the largest
difference in calibration factors between calibrations at 0.5 and 1.0 mW. The difference is 0.06
%. Thus, the standard uncertainty is 0.06/(2/3) = 0.02 %.
d. ECPR spectral responsivity: This uncertainty is due to the ECPR being somewhat wavelength
sensitive. The ECPR is calibrated against the LOCR at wavelengths of 633, 1319, and 1 550 nm,
but it is used at other wavelengths: 672, 786, 852, 986, 1307, and 1550 nm. Measurements
showed small spectral effects between 1319 and 1550 nm for the ECPR (see Table 1). The
maximum calibration factor difference is 0.33 % between 633 nm and 1319 nm. We use a linear
interpolation for the ECPR calibration factors at 672, 786, 852 and 986 nm. The standard
uncertainty in this region is 0.33/(2/3) = 0. 10 %. In the wavelength region between 1319 and
1550 nm, the standard uncertainty is less than 0.01 % (see Table 1).
e. ECPR uniformity: In addition to the calibration uncertainties listed above, the ECPR has a
nonuniform spatial response that can cause a possible error in measurements. The magnitude of
this is estimated by performing spatial uniformity scans (see Appendix H). We assume that due to
misalignments of a laser beam in the radius of 0.5 mm, the maximum spread is 0. 13 %. The
standard uncertainty is 0. 1 3/(2/3) = 0.04 %.
f Connector: This uncertainty is due to effects caused by a fiber connector on the ECPR. The
ECPR is calibrated against the LOCR using a coUimated beam, but is used with fiber connectors
to calibrate customers' power meters. We compared our ECPR with several pyroelectric trap
detectors at various wavelengths using both a coUimated beam and a FC/PC fiber connector.
Four measurements were performed. The largest difference between the coUimated beam and
connectorized measurements is 0.34 %. The standard uncertainty is 0.34/(2/3) = 0. 10 %. Note:
this approach does not 'protect' from 'the-worst case scenario' — interchanging different types of
connectors, power meters and connectors from different manufacturers at random. We assume
that the power meter owner utilizes the same fiber cable, connectors and connector adapters used
by NIST during the calibration of the power meter.
g. Test meter wavelength effect: This uncertainty is due to the drift in the source wavelength. The
magnitude of this effect is proportional to the wavelength uncertainty times the spectral response
gradient of the test detector at the wavelength being used. This uncertainty can be quite large if
the spectral response curve is changing rapidly (e.g., Ge detectors in the 1550 nm region). NISTkeeps a history file on all OFPM system laser wavelengths. The wavelength uncertainty value for
a specific test meter is found by assuming that the standard uncertainty of the OSA is 0. 13 nmincluding the instrument drift. A typical spectral responsivity curve (see Table 3) for the test
meter is used. Typical spectral responsivity slopes (%/nm) are given in Table 3.
17
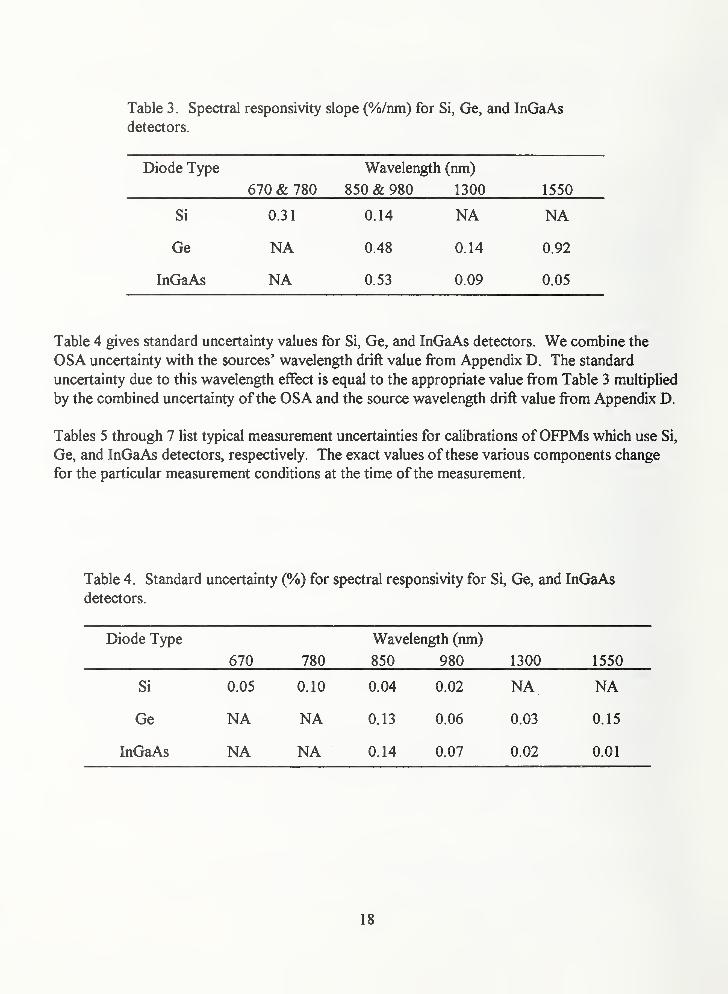
Table 3. Spectral responsivity slope (%/nm) for Si, Ge, and InGaAs
detectors.
Diode Type Wavelength (nm)
670 & 780 850 & 980 1300 1550
Si 0.31 0.14 NA NA
Ge NA 0.48 0.14 0.92
InGaAs NA 0.53 0.09 0.05
Table 4 gives standard uncertainty values for Si, Ge, and InGaAs detectors. We combine the
OSA uncertainty with the sources' wavelength drift value from Appendix D. The standard
uncertainty due to this wavelength effect is equal to the appropriate value from Table 3 multiplied
by the combined uncertainty of the OSA and the source wavelength drift value from Appendix D.
Tables 5 through 7 list typical measurement uncertainties for calibrations ofOFPMs which use Si,
Ge, and InGaAs detectors, respectively. The exact values ofthese various components change
for the particular measurement conditions at the time ofthe measurement.
Table 4. Standard uncertainty (%) for spectral responsivity for Si, Ge, and InGaAs
detectors.
Diode Type
670 780
Wavelength (nm)
850 980 1300 1550
Si 0.05 0.10 0.04 0.02 NA NA
Ge NA NA 0.13 0.06 0.03 0.15
InGaAs NA NA 0.14 0.07 0.02 0.01
18

Table 5. Typical measurement uncertainties for a Si detector at 850 nm.*
Source Standard uncertainty (type)
(%)
Electronics 0.04 (B)
LOCK 0.02 (B)
ECPR linearity 0.02 (B)
ECPR spectral responsivity
@ 850 nm 0.10(B)
ECPR uniformity 0.04 (B)
Connector 0. 10 (B)
Laser power stability 0.06 (A)
Test meter spectral responsivity
0 04
Repeatability (N = 6)
@ 850 nm 0.12/V"6(A)
Combined uncertainty
@ 850 nm 0.178
Expanded uncertainty (k = 2)
@ 850 nm 0.36
* For other wavelengths, the appropriate test meter spectral responsivity (Table 4) is
substituted.
** For the collimated beam measurements, the connector-related uncertainty is equal to
zero.
19

Table 6. Typical measurement uncertainties for a Ge detector at 1300 nm.
Source Standard uncertainty (type)
(0/.
Electronics 0.04(B)
LOCK ^ 0.02(B)
ECPR linearity 0.02(B)
ECPR spectral responsivity
@ 1300 nm 0.01 (B)
ECPR uniformity 0.04(B)
Connector** 0.10(B)
Laser power stability 0.04 (A)
Test meter spectral responsivity
@ 1300nm 0.03(B)
Repeatability (N = 6)
@ 1300nm 0.07/V6(A)
Combined uncertainty
@ 1300nm 0.132
Expanded uncertainty (k = 2)
@ 1300nm 0.26
* For other wavelengths, use appropriate the ECPR spectral responsivity uncertainty (item
d, p. 17) and appropriate test meter spectral responsivity (Table 4).
** For the coUimated beam measurements, the connector-related uncertainty is equal to
zero.
20

Table 7. Typical measurement uncertainties for an InGaAs detector at 1550 nm.*
Source Standard uncertainty (type)
Electronics 0.04 (B)
LOCK 0.02 (B)
ECPR linearity 0.02(B)
ECPR spectral responsivity
@ 1300 & 1550 nm 0.01(B)
ECPR uniformity 0.04 (B)
Connector** 0.10(B)
Laser power stability 0.06 (A)
Test meter spectral responsivity
@ 1550nm 0.01(B)
Repeatability (N = 6)
@ 1550 nm 0.22//6(A)
Combined uncertainty
@ 1550nm 0.161
Expanded uncertainty (k = 2)
@ 1550nm 0.32
* For other wavelengths, use appropriate the ECPR spectral responsivity uncertainty (item
d, p. 17) and appropriate test meter spectral responsivity (Table 4).
** For the coUimated beam measurements, the connector-related uncertainty is equal to
zero.
21

5. Future Work
Even though the ECPR is the laboratory standard at this time, improved pyroelectric and quantum
detectors are now being developed and may eventually replace the current instrument. The
wavelength uncertainty could be decreased by introducing laser-stabilizing Bragg gratings that
lock the laser diode output wavelength to the Bragg wavelength of the fiber grating. At the
present time, the measurement system can accommodate most commonly used connector types.
Because of the constantly changing measurement requirements (new wavelengths, power levels
and connector types), we have to upgrade our capabilities fi"om time to time. There is an effort to
modernize the existing calibration software as well.
This work was supported in part by the Calibration Coordination Group (CCG) ofthe
Department ofDefense and NIST's Calibration Services Development Fund. Kent Rochford,
Steven Mechels, and Jack Wang ofNIST reviewed the manuscript, John Lehman ofNISTprovided useful insights on optical fiber power meters' spectral-responsivity measurements and
transfer standards; the authors thank them for their valuable comments.
6. References
[1] Laser power and energy, in Natl. Inst. Stand. Technol. Spec. Publ. 250, 98-103, 1998.
[2] Gallawa, R. L.; Li, X. Calibration of optical fiber power meters: The effect of connectors.
Appl. Opt. 26(7): 1170-1174, April 1, 1987.
[3] Vayshenker, I.; Li, X.; Keenan, D.; Scott, T.R. Errors due to connectors in optical fiber
power meters. Natl. Inst. Stand. Technol. Spec. Publ. 905, 49-52, 1996.
[4] Vayshenker, I.; Li, X.; Keenan, D.; Scott, T.R. FO connector types affect power
measurements. Test Meas. World, 23-25; February 1997.
[5] Cambridge Research and Instrumentation, Inc., 21 Erie Street, Cambridge, MA 02139.
[6] Foukal, P. v.; Hoyt C; Kochling H.; Miller P. Cryogenic absolute radiometers as laboratory
irradiance standards, remote sensing detectors, and pyroheliometers. Appl. Opt. 29(7): 988-
993; 1990.
[7] Johnson, B. C; Kumar, A.R.; Zhang, Z. M.; Livigni, D.J.; Jones, R.D.; Scott, T. R. Heat
transfer analysis and modeling of a cryogenic laser radiometer. J. Thermophys. Heat Trans.
12(4): 575-581, October-December 1998.
22

[8] Livigni, D.J.; Cromer, C.L.; Scott, T.R.; Johnson, B.C.; Zhang, Z.M. Thermal
characterization of a cryogenic radiometer and comparison with a laser calorimeter.
Metrologia 35(6), 819-827; 1998.
[9] Hamilton, C.A.; Day, G.W.; Phelan, R.J. Jr. An electrically calibrated pyroelectric radiometer
system. Nat. Bur. Stand.(U.S.) Tech. Note 678; March 1976.
[10] Wolfe, W.L.; Zissis, G.J., eds. The Infrared Handbook. Washington, DC: Environmental
Research Inst, of Michigan, 7-79; 1985.
[11] Livigni, D.J. High accuracy laser power calibration service. To be published as Natl. Inst.
Stand. Technol. Spec. Publ. 250-55.
[12] Livigni, D.J.; Li, X. Spatial uniformity of optical detector responsivity. Proc, National.
Conference of Standards Laboratories Workshop & Symp., Session 5A, 337-352; July-
August 1994.
[13] International Standard: Calibration of fibre optic power meters. CEUJEC 1315; 1995.
[14] Vayshenker, I.; Yang, S.; Li, X.; Scott, T.R.; Cromer, C.L. Optical fiber power meter
nonlinearity calibrations at NIST. To be published as Natl. Inst. Stand. Technol. Spec.
Publ. 250-56, 2000.
[15] Vayshenker, I.; Li, X.; Scott, T.R. Optical power meter calibration using tunable laser
diodes. Proc, National Conference of Standards Laboratories Workshop & Symp., Session
5A, 362-372; July-August 1994.
[16] Taylor B.N.; Kuyatt, C.E. Guidelines for evaluating and expressing the uncertainty ofNISTmeasurement resuhs. Natl. Inst. Stand. Technol. Tech. Note 1297; September 1994.
[17] Hewlett-Packard 3457 muhimeter operating manual. 1-11; 1986.
[18] Laser Precision Corp. RS-5900 electrically calibrated pyroelectric radiometer instruction
manual, 33-34; 1982.
23

Appendix A. Laser Diode Optical Spectra
100
° 80
-*—>
C/)
c(D
CD>
a:
60
40
20
0
1290
1. D / 4 —
1
1295 1300 1305 1310Wavelength (nm)
1315
Figure A-1. Optical spectra of a typical laser diode used in the OFPM calibration system.
24

Appendix B. Measurement Flow Chart
START"
SYSTEM COMMON,MAIN VARIABLES
mmALIZE GPIB CARD
coNncuRATing
nescRipnoN
SELECT TEST MErTER
FROM THE LIBRARY
MEASURE MONITOR'S AND ECPR'S
BACKGROUND
MEASURE FIRST SYSTEM RATIO
KOWnjR VS. ECPR USING CHOPPER
MEASURE TEST ^ETER
BACKGROUND
CAUBRATE TEST >eTER VS.
MONITOR <CW>
MEASURE SECOND SYSTEM RATIO
KIWTDR VS. ECPR USING CKIPPER
' YES
CALCULATE TEST METERCAUBRATIDN FACTDR
PRINT DATA SHEETFDR CALIBRATION REPORT
25

Appendix C. Sample of a Calibration Report
U.S. DEPARTMENT OF COMMERCENATIONAL INSTITUTE OF STANDARDS AND TECHNOLOGY
ELECTRONICS & ELECTRICAL ENGINEERING LABORATORYBoulder, Colorado 80303
REPORT OF CALIBRATION for
OPTICAL POWER METERMeter's Manufacturer
Model NumberSerial Numberwith Sensor
Model Number and Serial Number
Submitted by:
Company NameAddress
Calibration SummaryThe test optical power meter and the associated sensor was calibrated at wavelengths of 851.9, 1307.0,
and 1549.6 nm (with a 0.13 nm standard uncertainty) by comparing it to a calibrated laboratory standard
(see Figure 1). The NIST laboratory standard was an electrically calibrated pyroelectric radiometer
(ECPR) which had previously been calibrated against the NIST Laser Optimized Cryogenic Radiometer
(LOCK) system. The single-mode fiber with FC/PC connectors was supplied by the test meter owner.
Before the measurements began, the instruments were allowed to reach equilibrium with the laboratory
environment and the zero setting was adjusted as specified by the manufacturer.
Table 1. Calibration results (Power: 100
Detector/
fiber type
Source
wavelength
(nm)
Meter
setting
(nm)
Calibration
factor
(reading/jiW)
Expanded
uncertainty
(k = 2)
(%)
Si/SM 851.9 851.9 0.9986 0.34
Ge/SM 1307.0 1307.0 0.9994 0.28
Ge/SM 1549.6 1549.6 0.9989 0.41
Folder No. & NISTID: 26100 & 815000
Date of Report: November 19, 1999
Reference: P.O. No. 100000 10/28/99 1 of 6
26

Meter's Manufacturer
Model Number
Serial Number
with Sensor
Model Number and Serial Number
The laboratory temperature during these measurements was 22°C (± 2°C) and the relative humidity was
11 % (± 3.5 %). The wavelength selection was set to the value listed in Table 1. The test meter
calibration factor was obtained by dividing its net display reading by the incident power.
The resuhs of this calibration are summarized in Table 1 . If the display readings of the test meter are
divided by the calibration factor in Table 1, then, on the average, the resulting values will agree v^th the
NIST national reference standards.
EHgital
Voltmeter
Temperature
Controller
Laser PowerSupply
Sample
^^mt
Rotatable
Mounting
Platform Positioning
Rail
Data Acquisition &Analysis System
1550 mnPlate
mm.
NISTECPRchopper
User's fiber/connector
or collimated beam
BCD/GPIBConverter
INIST Standard
(ECPR)
User Test
Meter
Figure 1 . Measurement system.
Folder No. & NISTID: 26100 & 815000
Date ofReport: November 19, 1999
Reference: P.O. No. 100000 10/28/99 2 of 6
27

Meter's Manufacturer
Model NumberSerial Number
with Sensor
Model Number and Serial Number
Uncertainty Assessment
The uncertainty estimates for the NIST laser energy measurements are described and combined using the
referenced guidelines in NIST Technical Note 1297. To establish the uncertainty limits, the uncertainty
sources are separated into Type A, whose magnitudes are obtained statistically from a series of
measurements and Type B, whose magnitudes are determined by subjective judgement.
The Type A uncertainty components are assumed to be independent and, consequently, the standard
deviation, S,, for each component is
S. =N (1)
^ N-l
where the Xj values represent the individual measurements and N is the number of Xj values used for a
particular Type A component. The standard deviation of the mean is S/N'^\ and the total standard
deviation of the mean is [E(Sr^/N)]'''\ where the summation is carried out for all Type A components.
All the Type B components are assumed to be independent and have rectangular or uniform distributions
(that is, each has an equal probability of being within the region, ±6^, and zero probability ofbeing
outside that region). Ifthe distribution is rectangular, the standard deviation o„ for each Type Bcomponent is equal to 6/3'"^ and the total "standard deviation" is (So,^)'''', where the summation is
performed over all Type B components.
The combined uncertainty is determined by combining the Type A and Type B standard deviations in
quadrature; the expanded uncertainty is obtained by multiplying this result by a factor of 2. The expanded
uncertainty, U, is then
U = 2S,^
> s r N
The values used to calculate the NIST expanded uncertainty (shown in Table 1) are listed in Tables 2 and
3. The number of decimal places used in reporting the mean values of the calibration factor listed in
Table 1 were determined by expressing the expanded NIST uncertainty to two significant digits.
Folder No. &NISTID: 26100 & 815000
Date of Report: November 19, 1999
Reference: P.O. No. 100000 10/28/99 3 of 6
28

Meter's Manufacturer
Model NumberSerial Number
with Sensor
Model Number and Serial Number
Table 2. NIST measurement uncertainties for Si detector at 850 nm.
Source Standard uncertainty (type)
Electronics 0.04 (B)
LOCK 0.02 (B)
Laboratory standard linearity 0.02 (B)
Laboratory standard spectral responsivity
@ 850 nm 0.10(B)
Laboratory standard uniformity 0.04 (B)
Connector 0.10(B)
Laser power stability 0.06 (A)
Test meter spectral responsivity
@ 850 nm 0.04 (B)
Repeatability (N = 6)
@ 850 nm 0.05//6 (A)
Combined uncertainty
@ 850 nm 0.17
Expanded uncertainty (k = 2)
@ 850 nm 0.34
Folder No. &NISTID:Date of Report:
Reference:
26100 & 815000
November 19, 1999
P.O. No. 100000 10/28/99
29
4 of 6

Meter's Manufacturer
Model NumberSerial Number
with Sensor
Model Number and Serial Number
Table 3. NIST measurement uncertainties for Ge detector at 1300 and 1550 nm.
Source Standard uncertainty (type)
(%)
Electronics 0.04(B)
LOCK 0.02(B)
Laboratory standard linearity 0.02 (B)
Laboratory standard spectral responsivity
@ 1300 and 1550 nm 0.01(B)
Laboratory standard uniformity 0.04(B)
Connector 0.10(B)
Laser power stability 0.06 (A)
Test meter spectral responsivity
@ 1300 nm 0.03 (B)
@ 1550nm 0.15(B)
Repeatability (N = 6)
@ 1300nm . 0.07//6(A)
@ 1550 nm ' 0.12//6(A)
Combined uncertainty
@ 1300nm 0.139
@ 1550 nm 0.206
Expanded uncertainty (k = 2)
@ 1300 nm 0.28
@ 1550nm ' 0.41
Folder No. & NISTID: 26100 & 815000
Date ofReport: November 19, 1999
Reference: P.O. No. 100000 10/28/99
30

Meter's Manufacturer
Model Number
Serial Numberwith Sensor
Model Number and Serial Number
For the Director, Report Reviewed By:
National Institute of Standards
and Technology
Thomas R. Scott, Group Leader Christopher L. Cromer, Project Leader
Sources and Detectors Group Sources and Detectors Group
Optoelectronics Division Optoelectronics Division
Report Prepared/Calibrated By:
Igor Vayshenker, Electronics Engineer
Sources and Detectors Group
Optoelectronics Division
Folder No. &NISTID:Date ofReport:
Reference:
26100 & 815000
November 19, 1999
P.O. No. 100000 10/28/99
31
6 of 6

Appendix D. Wavelength History
This appendix describes the wavelength (in vacuum) history file for the lasers used in the optical
fiber power measurement system. All the measurements were taken with a calibrated optical
spectrum analyzer (OSA). Wavelength uncertainty is found by combining the OSA uncertainty
with the standard deviation of measured wavelength variation.
Table D-1 . Wavelength History File for the OFPM System's Lasers
Date Wavelength (nm)
11/92 672.3 786.3 841.0 NA NA NA 1306.7 1549.7
05/93 672.3 785.9 NA 852.1 NA NA NA 1549.6
02/94 672.3 785.5 840.9 852.3 NA NA 1307.2 1549.5
10/96 672.3 786.2 840.7 852.1 NA NA 1307.0 1549.7
07/97 672.2 785.8 840.6 851.9 NA 1304.2 1307.1 1549.4
02/98 672.1 786.1 840.4 851.6 NA 1304.3 1306.9 1549.6
08/98 672.1 785.6 840.5 851.8 NA 1304.3 1307.0 1549.6
11/98 672.2 786.2 840.6 851.8 NA 1304.3 1306.8 1549.6
03/99 672.3 786.1 840.6 851.7 986.0 NA 1307.0 1549.6
Average (nm) 672.2 786.0 840.6 851.9 986.0 1304.3 1307.0 1549.6
St. deviation
a,(nm)
0.09 0.30 0.21 0.24 NA 0.05 0.17 0.10
Wavelength
uncertainty
(0.125^+0,2)'/^
0.15 0.33 0.24 0.27 NA 0.14 0.21 0.16
32

Appendix £. Sample Results and Shipping Instructions for MAP
This appendix describes MAP preliminary results and shipping instructions.
The following results are preliminary for the MAP power meter S/N 2946G04047 that was
cahbrated at 851.9, 1307.0, and 1549.6 nm using customer supplied single-mode fiber with FCconnectors at both ends. The meter was set to 851.9, 1307.0, and 1549.6 nm. Both Si detector
(#255) and Ge detector (#133) were used. Si detector was used with laser wavelength of 85 1 .9 nm;
Ge detector was used with laser wavelengths of 1307.0 and 1549.6 nm. Time constant for Channel
A was set to 200 ms for both detectors. The offset was set to 0 dB. No lens was used.
Preliminary calibration factors using customer supplied fiber are as follows:
1.008 for 851.9 nm laser source using Si detector.
1.018 for 1307.0 nm laser source using Ge detector.
1.004 for 1549.6 nm laser source using Ge detector.
If the display or GPEB readings of the MAP meter are divided by these calibration factors, then the
resulting values will coincide with the NIST national standard. Please, fill out 'Sample Data Sheet'
for each of the wavelengths used and include any pertinent information for your standard.
More data will be collected after the instrument returns to NIST. We will submit a formal calibration
report at that stage.
SHIPPING INSTRUCTIONS
1 . When you receive our transfer standard locate and read the enclosed operating instructions.
2. After completing the measurements, please, send the transfer standard and your measurement
data to NIST (be sure to include the appropriate fiber cable(s), adapters, dust covers, etc.).
3. Ship to the following address:
National Institute of Standards and Technology
Attn: Igor Vayshenker/MS 815.01 (Rm. 3082C)
325 BroadwayBoulder, CO 80303
4. Before shipping back to NIST, securely pack the instrument. Disconnect all the plug-in
cables before shipping.
5. Insure the package for $10,000.
33

u
o
s
00
-"^ ^
•o "5
i .S^
CO
5 C 4i
c &0 <u^ Cr, ^ C3
u, GO
4) "O
g i
(U
lit
00 ;S
C (KJ ^a. •
'
c3 § 00a, £ .c
«j 2> u
.s§ 13 00
.& ^ .S
P-I «4> (U
00 On
34

Appendix G. ECPR Linearity Measurements
Table G-1. ECPR #483 calibrations against the
LOCR at different powers.
Average
power
(mW)
Calibration
factor
(reading/|iW)
N Standard
deviation
(%)
1.002 0.9887 4 0.01
0.502 0.9881 4 0.02
0.101 0.9886 5 0.13
The largest difference in calibration factors is between calibrations at 0.5 and 1.0 mW. The
difference is 0.061 %. The standard uncertainty is 0.061/(2/3) = 0.02 %.
35

Appendix H. ECPR Uniformity Scans
ECPR uniformity measurements performed by D. Livigni on ECPR #618 at a wavelength of 1557
nm.
Statistics for 2 mm beam with uniform centering error within ±0.5 mm of true center:
The standard deviation is 0.03 %.
The spread (between minimum and maximum) is 0. 13 %.
Figure 1 . Surface plot of the entire dataset.
Figure 2. Surface plot around the detector's center.
36

THE SP 250 SERIES ON NIST MEASUREMENT SERVICES*
SP 250-1 Spectral Radiance Calibrations
PB871 79883
SP 250-2 Far Ultraviolet Detector Standards
PB87227609
SP 250-3 Radiometric Standards in the Vacuum Ultraviolet
PB87227625
SP 250-4 Fricke Dosimetry in High-Energy Electron BeamsPB881 10374
SP 250-5 Alpha-Particle Calibrations
PB881 68620
SP 250-6 Regular Spectral Transmittance
PB881 08550
SP 250-7 Radiance Temperature Calibrations
PB881 23674
SP 250-8 Spectral Reflectance
PB881 09905
SP 250-9 Calibration of Beta-Particle-Emitting Ophthalmic
Applicators
PB881 08535
SP 250-10 Radioactivity Calibrations with the "4-n" GammaIonization Chamber and Other Radioactivity
Calibration Capabilities
PB881 23708
SP 250-1 1 Dosimetry for High Dose Applications
PB88201587
SP 250-12 Neutron Personnel Dosimetry
PB87227617
SP 250-13 Activation Foil Irradiation with Californium
Fission Sources
PB882 17443
SP 250-14 Activation Foil Irradiation by Reactor Cavity
Fission Sources
PB88217435
SP 250-1 5 Photometric Calibrations
PB881 53747
SP 250-1 6 Calibration of X-Ray and Gamma-RayMeasuring Instruments
PB88211826
SP 250-1 7 The NBS Photodetector Spectral ResponseCalibration Transfer ProgramPB88201595
SP 250-1 8 Neutron Source Strength Calibrations
PB882 11818
SP 250-19 Calibration of Gamma-Ray-EmittingBrachytherapy Sources
PB891 93858
SP 250-20 Spectral Irradiance Calibrations
PB881 23781
SP 250-21 Calibration of Beta-Particle Radiation
Instrumentation
PB88201579
SP 250-22 Platinum Resistance Thermometer Calibrations
PB881 38367
SP 250-23 Liquid-in-Glass Thermometer Calibration Service
PB891 28888
SP 250-24 Standard Cell Calibrations
PB881 23690
SP 250-25 Calibration Service for Inductive
Voltage Dividers
SP 250-26 NBS Phase Angle Calibration Services
PB88225636
SP 250-27 AC-DC Difference Calibrations
PB892222616
SP 250-28 Solid-state DC Voltage Standard Calibrations
PB881 68703
SP 250-29 Traceable Frequency Calibrations
PB881 68364
SP 250-30 GOES Satellite Time Code Dissemination:
Description and Operation
PB881 68760
SP 250-31 Mass Calibrations
PB891 53894
SP 250-32 A Calibration Service for 30 MHz Attenuation
and Phase Shift
PB88238324
SP 250-33 A Calibration Service for Voltage Transformers
and High-Voltage Capacitors
PB882252903
SP 250-34 High Vacuum Standard and Its UsePB891 93841
SP 250-35 The Calibration of Thermocouplesand Thermocouple Materials
PB89209340
SP 250-36
SP 250-37
SP 250-38
SP 250-39
SP 250-40 Absorbed-Dose Calibration of Ionization Chambers
A Calibration Service for Current Transformers
PB91216770
Photometric Calibrations
PB971 48472
NIST Leak Calibration Service
PB921 49772
NIST Pressure Calibration Service
PB94 164043
in a Co Gamma-Ray BeamSN003-003-03034-1 $2.00
SP 250-41
SP 250-42
SP 250-43
SP 250-44
Spectroradiometric Detector Measurements:
Part I- Ultraviolet Detectors and
Part II - Visible to Near-Infrared Detectors
SN003-003-03550-5 $9.50
Sprectroradiometric Detector Measurements:
Part III—Infrared Detectors
SN003-003-03582-3 S5.25
Radiance Temperature Calibrations
SN003-003-03511-4 $10.00
Radiation Processing Dosimetry Calibration
Services and Measurement Assurance Program
SN003-003-03513-1
* Entries containing a stock number (SN003-003-) and price can be purchased from the Superintendent of Documents, U.S. GovernmentPrinting Office, Washington, DC 20402-9325. GPO will accept checks, money orders, VISA, and MasterCard. For more infomation, or to place
an order, call (202) 512-1800. Be sure to cite the stock number on all orders.
Entries containing PB numbers can be purchased from the National Technical Information Service, Springfield, VA 22161 . NTIS will acceptAmerican Express in addition to the payment methods listed for GPO. For more information call (703)487-4650; to place an order call
(800) 553-6487. Fax: (703) 321-8547. Be sure to cite the PB number on all orders.
Entries without stock or PB numbers are in preparation.

THE SP 250 SERIES ON NIST MEASUREMENT SERVICES* -Continued
SP 250-45 Radiation Processing Dosimetry Calibration
Services: Manual of Calibration Procedures
SN003-003-03514-9 $4.00
SP 250-46 NIST Multifunction Calibration SystemSN003-003-03515-7 $2.75
SP 250-47 NIST Calibration Service for Capacitance
Standards at Low Frequencies
SN003-003-03549-1 $7.00
SP 250-48
SP 250-49
Spectral Reflectance
SN003-003-03545-9 $14.00
NIST Calibration Services for Gas Flow
Meters; Piston Prover and Bell Prover
Gas Flow Facilities
SN003-003-03560-2 $6.00
SP 250-51 Calibration Service of Optoelectronic
Frequency Response at 1319 nm for
Combined Photodiode/rf Power SensorTransfer Standards
SN003-003-03623-4
SP 250-52 Error Analysis and Calibration Uncertainty of
Capacitance Standards at NIST
SP 250-53 Calibration Service for Spectral Responsivity of
Laser and Optical-Fiber Power Meters at
Wavelengths Between 0.4 \x.m and 1.8 nmSN003-003-03624-2
SP 250-54 Optical Fiber Power Meter Calibrations at NIST
SP 250-56 Optical Fiber Power Meter Nonlinearity Calibrations
at NIST
* Entries containing a stock number (SN003-003-) and price can be purchased from the Superintendent of Documents, U.S. GovernmentPrinting Office, Washington, DC 20402-9325. GPO will accept checks, money orders, VISA, and MasterCard. For more infomation, or to placean order, call (202) 512-1800. Be sure to cite the stock number on all orders.
Entries containing PB numbers can be purchased from the National Technical Information Service, Springfield, VA 22161. NTIS will acceptAmerican Express in addition to the payment methods listed for GPO. For more information call (703)487-4650; to place an order call
(800) 553-6487. Fax: (703) 321-8547. Be sure to cite the PB number on all orders.
Entries without stock or PB numbers are in preparation.


Technical Publications
Periodical
Journal of Research of the National Institute of Standards and Technology—Reports NIST research anddevelopment in those disciplines of the physical and engineering sciences in which the Institute is active.
These include physics, chemistry, engineering, mathematics, and computer sciences. Papers cover a broad
range of subjects, with major emphasis on measurement methodology and the basic technology underlying
standardization. Also included from time to time are survey articles on topics closely related to the Institute's
technical and scientific programs. Issued six times a year.
Nonperiodicals
Monographs—Major contributions to the technical literature on various subjects related to the Institute's
scientific and technical activities.
Handbooks—Recommended codes of engineering and industrial practice (including safety codes) developed
in cooperation with interested industries, professional organizations, and regulatory bodies.
Special Publications—Include proceedings of conferences sponsored by NIST NIST annual reports, and
other special publications appropriate to this grouping such as wall charts, pocket cards, and bibliographies.
National Standard Reference Data Series—Provides quantitative data on the physical and chemical
properties of materials, compiled from the world's literature and critically evaluated. Developed under a
worldwide program coordinated by NIST under the authority of the National Standard Data Act (Public Law90-396). NOTE: The Journal of Physical and Chemical Reference Data (JPCRD) is published bi-monthly for
NIST by the American Chemical Society (ACS) and the American Institute of Physics (AlP). Subscriptions,
reprints, and supplements are available from ACS, 1155 Sixteenth St., NW, Washington, DC 20056.
Building Science Series—Disseminates technical information developed at the Institute on building
materials, components, systems, and whole structures. The series presents research results, test methods,
and performance criteria related to the structural and environmental functions and the durability and safety
characteristics of building elements and systems.
Technical Notes—Studies or reports which are complete in themselves but restrictive in their treatment of a
subject. Analogous to monographs but not so comprehensive in scope or definitive in treatment of the
subject area. Often serve as a vehicle for final reports of work performed at NIST under the sponsorship of
other government agencies.
Voluntary Product Standards—Developed under procedures published by the Department of Commerce in
Part 10, Title 15, of the Code of Federal Regulations. The standards establish nationally recognized
requirements for products, and provide all concerned interests with a basis for common understanding of the
characteristics of the products. NIST administers this program in support of the efforts of private-sector
standardizing organizations.
Order the following NIST publications—FIPS and NISTIRs—from the National Technical
Information Service, Springfield, VA 22161.
Federal Information Processing Standards Publications (FIPS PUB)—Publications in this series collectively
constitute the Federal Information Processing Standards Register. The Register serves as the official source
of information in the Federal Government regarding standards issued by NIST pursuant to the Federal
Property and Administrative Services Act of 1949 as amended. Public Law 89-306 (79 Stat. 1127), and as
implemented by Executive Order 11717 (38 FR 12315, dated May 11, 1973) and Part 6 of Title 15 CFR(Code of Federal Regulations).
NIST Interagency Reports (NISTIR)—A special series of interim or final reports on work performed by NIST
for outside sponsors (both government and nongovernment). In general, initial distribution is handled by the
sponsor; public distribution is by the National Technical Information Service, Springfield, VA 22161, in paper
copy or microfiche form.

0)u0)
if51^ CD
O CO
c o
E I« «
0) —. o I
=3^
00CMCOCO
I
COo
o 3 OC -D OO o
ro 00 CO
ooCO
<DO)
W CL
CQ £
O Q.