optical fibre communications and sensing system
TRANSCRIPT

Edith Cowan University Edith Cowan University
Research Online Research Online
ECU Publications 2011
1-1-2011
Optical Fibre Communications and Sensing System Experiments Optical Fibre Communications and Sensing System Experiments
for Undergraduate Photonics Laboratories for Undergraduate Photonics Laboratories
Graham Wild Edith Cowan University
Geoffrey Swan Edith Cowan University
Follow this and additional works at: https://ro.ecu.edu.au/ecuworks2011
Part of the Education Commons, and the Electromagnetics and Photonics Commons
10.1117/12.903224 This is an Author's Accepted Manuscript of: Wild, G. , & Swan, G. I. (2011). Optical Fibre Communications and Sensing System Experiments for Undergraduate Photonics Laboratories. Paper presented at the SPIE Smart Nano-Micro Materials and Devices. Melbourne, Australia. Proc. SPIE 8204. 82042Q. Available here This Conference Proceeding is posted at Research Online. https://ro.ecu.edu.au/ecuworks2011/809
Optical Fibre Communications and Sensing System Experiments for Undergraduate Photonics Laboratories
Graham Wild*, Geoff I. Swan
Photonics Research Lab., Edith Cowan Univ., 270 Joondalup Dr., Joondalup, WA Australia 6027
ABSTRACT
Experiments in photonics tend to be reserved for postgraduate laboratories, where suitable equipment and resources are available. Simple optical fibre experiments may be included in some undergraduate programs, possibly utilising polymer optical fibres with LEDs and phototransistors, or with the use of bulk optical components and glass optical fibre elements. However, real optical fibre communication systems and optical fibre sensing systems utilise more complex devices, such as optical fibre Bragg gratings. With the availability of optical components in the 850nm wavelength range, a variety of practical systems can be realised using industry standard components. We show how to mitigate a large portion of the cost associated with the implementation of experiments utilising these 850nm components. The limiting factor associated with the implementation of 1550nm based systems is the cost associated with spectral measurements in this wavelength range. Given a bench top optical spectrum analyser costs $10,000s; this is not something that can be made available to students in undergraduate laboratories in bulk. The solution was to make use of the new low cost USB based spectrometers, available from a number of manufacturers. In combination with devices such as couplers, circulators, isolators, wavelength division multiplexing filters, and Bragg gratings, all operating in the 850nm, a number of different sensing and communications systems can be realised.
Keywords: Education, Experimental Course, Physics Education, Undergraduate Laboratory
1. INTRODUCTION Photonics experiments investigating optical fibre communication and sensing systems tend to be reserved for postgraduate students, where suitable premium research grade equipment and resources are available [1-2]. Simple optical fibre experiments may be included in some undergraduate programs [3]. However, these tend to focus on basic aspects, such as properties of fibres. As such, they typically utilise polymer optical fibres with simple LEDs and phototransistors [4]. Alternatively, undergraduate experiments will use bulk optical components to couple with some basic glass optical fibre elements, such as grin lens collimators and 3dB couplers [5]. The problem associated with these methods to demonstrate photonics in undergraduate laboratories is that real optical fibre communication systems and optical fibre sensing systems utilise very different hardware. These systems also make use of more complex properties, such as wavelength selective filters based on optical fibre Bragg gratings [6]. These devices are common to both commercial optical fibre communication systems and commercial optical fibre sensing systems.
Following the successful implementation of secondary research student projects in photonics [7], and the expansion of the undergraduate laboratory facilities in optics and photonics at Edith Cowan University, the question of how to incorporate experiments relative to state of the art research within the Photonics Research Laboratory was posed. Discussions with the Photonics Laboratory in The School of Physics at The University of New South Whale (UNSW) [8] showed that the two options implemented there would not be feasible.
The first of these was to utilise bulk optics. This required the use of a large number of grin lenses, combined with beam splitting cubes for signal splitting and combining, and free space intensity filters to investigate Wavelength Division Multiplexing (WDM). The reason this was deemed impractical was because a single setup was utilised at UNSW for the postgraduate students, which was not to be touched in terms of alignment etc. For an undergraduate laboratory, which can see hundreds of students in a week across several units, leaving systems setup is prohibitive, due to space limitations. Alternatively, the time required to setup and take apart such a system would also be prohibitive. Also, the number of micrometre precision multi-axis stage would also be costly.
*[email protected]; phone 61 8 6304 5780; fax 61 8 6304 5811; se.ecu.edu.au
Smart Nano-Micro Materials and Devices, edited by Saulius Juodkazis, Min Gu, Proc. of SPIE Vol. 8204, 82042Q · © 2011 SPIE · CCC code: 0277-786X/11/$18 · doi: 10.1117/12.903224
Proc. of SPIE Vol. 8204 82042Q-1

The second method discussed was a significant improvement over the bulk optics approach. This involved the use of discrete optical fibre components, where devices, such as WDM, are embedded within protective packages. Also, the coupling of components does not require the use of grin lenses, as industry standard connectors are utilised. The implemented system utilised passive 1550nm and 1310nm components, such as dual window couplers, circulators, isolators, and 1550nm/1310nm WDM filters. In addition, active components were also used, 1550nm and 1310nm laser diodes, and InGaAs photoreceivers (sensitive to both wavelengths). The sources could then be used to transmit different signals from two function generators, to demonstrate the WDM on a digital storage oscilloscope. In addition to this, an Agilent 56400 Optical Spectrum Analyser (OSA) was used for spectral measurements, to visualise the two wavelengths, separately and together, both with and without utilising the WDM filters. The primary advantage of this method is the relevance of these wavelengths to modern optical fibre communications and sensing systems. This has the associated advantage that the relevant components are then abundant and relatively inexpensive. However, the visualisation needed for optical fibre communications and sensing systems, in terms of spectral measurements with the OSA, is very cost prohibitive. This is due to the requirement of an array of detectors sensitive to wavelengths from 600nm to 1700nm. For example, the OSA utilised above costs approximately $60,000 AUD new from Agilent. This effectively eliminates the use of an OSA as teaching and learning tool within an undergraduate laboratory, where multiple setups would be required, given the number of students.
The idea of utilising off the shelf optical fibre components, standard to optical fibre communications and sensing systems is very appealing from a teaching and learning perspective. This gives students hands on practical experience with modern equipment used in research, and in industry, preparing them for whichever pathway they follow in their photonics careers. However, the question remained ‘how to overcome the cost associated with spectral measurements using the OSA?’ Since the prohibitive cost was the use of a detector sensitive to 1550nm, the solution was simple, go to the tried and true, not to forget low-cost, silicon. This brings us to the USB based spectrometers and spectrophotometers, which are becoming widespread for use in research and teaching [9]. These are low cost devices, on the order of $1000, due to the fact that they are based on simple technology, using a diffraction element and a linear silicon CMOS array. The problem here is that the upper wavelength that can be detected by silicon is around 1000nm. So the proposed solution brings with it another problem, specifically 1550nm and 1310nm cannot be utilised. However, the solution to this problem was simple; in fact it was simply a matter of taking a step back in ‘time’ relative to optical fibre technology. Prior to the use of the 1550nm band in optical fibre technology was the 1310nm band, and prior to this was the 850nm band [10]. This was due to the development of detectors and sources over time, to the higher wavelength bands, with lower attenuation within optical fibres (shown in Figure 1), and high channel count, giving increased data transmission. That is, 850nm, which is within the spectral response of silicon, is associated with much older optical fibre technology, including active (lasers and LEDs) and passive (couplers etc) components. The secondary advantage of this is that the active components are inherently cheaper, due to the semiconductor materials utilised within them.
Figure 1. Attenuation of Light within an optical fibre, in dB per kilometre, as a function of wavelength. The local
minima corresponding to 850nm, 1310nm, and 1550nm can be clearly seen. The 3 peaks separating the minima, due to the OH- ions in older fibres, are not as significant in modern fibres.
Proc. of SPIE Vol. 8204 82042Q-2

To provide a modern and relevant optical fibre communication and sensing based photonics experiments, the solution of what type of system to utilise in the teaching and learning of undergraduate students in a photonics laboratory is then to utilise low cost USB based spectrometers, with off-the-shelf 850nm and 635nm optical fibre components. These components enable several experiments to be realised. What follows is a case study of experiments that can be conducted with these components.
2. EQUIPMENT 2.1 Spectrometer
The Ocean Optics Red Tide Spectrometer is a small low-cost general purpose instrument [9]. The internal optical bench is fixed during manufacturing, with no moving parts to wear or break. The spectrometer has a wavelength range of 350nm to 1000nm, with a 650 active pixel detector, giving 650 data points in one full spectrum, that is, one data point per nanometer. The spectrometer is a true plug and play USB device, with the onboard memory including wavelength calibration and linearity information for use by the SpectraSuite operating software. Figure 2 shows the simple internal structure of the spectrometer, and the associated light path through the optical bench.
Figure 2. Inside the USB spectrometer. 1) Fibre input, 2) slit, 3) filter, 4) collimating mirror, 5) grating, 6) focusing
mirror, 7) lens, 8) detector, 9) order sorting filter, and 10) detector window [9]
2.2 Active Components
The use of 850nm gives a variety of sources which can be utilised and investigated. For example, standard Fabry-Perot fibre coupled laser diodes can be compared with 850nm distributed feedback lasers, and 850nm vertical cavity surface emitting lasers. This will give students an understanding of the different spectral properties based on the internal modes. Also, these relatively narrow band 850nm laser sources can be compared with broadband 850nm light emitting diodes, to show the contrast in spectral output.
A similar experimental investigation of light sources at around 635nm can also be performed. Some helium-neon lasers can be easily coupled to optical fibres, without the use of grin lenses and precision stages, with adapter plates that screw on to the end. The spectral output of the helium-neon gas laser can then compared to a 635nm lasers diode.
A variety of different detectors can be used for both 850nm and 635nm, including Gallium Arsenide, Germanium, and Silicon. It would therefore be possible to compare the difference between these photodiodes in terms of the relative photocurrent generated at these wavelengths, and other properties. Basic photodiodes can be used in conjunction with some electronic circuit design, to construct a transimpedance amplifier. Alternatively, photoreceivers with built in transimpedance can be used, depending on the level of the students.
Proc. of SPIE Vol. 8204 82042Q-3

2.3 Passive Components
To realise a large number of simple experiments, only a relatively small number of passive components are required. These include:
• 3dB coupler/splitter,
• Isolator,
• Circulator,
• WDM filter, and
• FBG.
The 3dB coupler/splitter can be used to either combine two signals together, or split a signal into two equal halves. An isolator is essentially and optical diode, enabling light to flow in one direction, but not the other. A circulator is signal directing device, typically composed of three ports, that directs a signal into port 1 to port 2, while directing a signal into port 2 to port 3. The WDM filter essentially acts like the coupler to combine signal of different wavelengths, but without the associate 3dB loss; however, the filter splits the signals based on wavelength, rather than power. Finally, the FBG is an interference based stop band filter, reflecting a narrow bandwidth and passing all others.
3. FUNDAMENTAL EXPERIMENTS The fundamental aspect associated with the use of bulk optics with optical fibres in a photonics laboratory, is based on utilising grin lenses to launch light into optical fibres. This typically uses light from a helium-neon laser, and students will be taught to strip and cleave the fibre tip to make sure light can be easily launched into the. From here, aspects like the numerical aperture and angle of acceptance can be investigated.
However, most components today, active and passive, are directly coupled to optical fibres. Hence, while the skill associated with launching light into a fibre using bulk optics can be used to teach some fundamental aspects of optical fibres, it is less relevant to the practical hands on skills and experience that is essential to students who move into photonics careers. As such, teaching fundamentals based on industry standards will be more useful.
Fundamental aspects that can then be taught includes working with the various standard connectors utilised in industry, such as FC, SC, and ST, and the types of finish, PC, UPC, and APC, and adapters to connect between them, the properties of the active components, to show the spectral properties of the different sources (show in Figure 3), and the properties of the individually passive components.
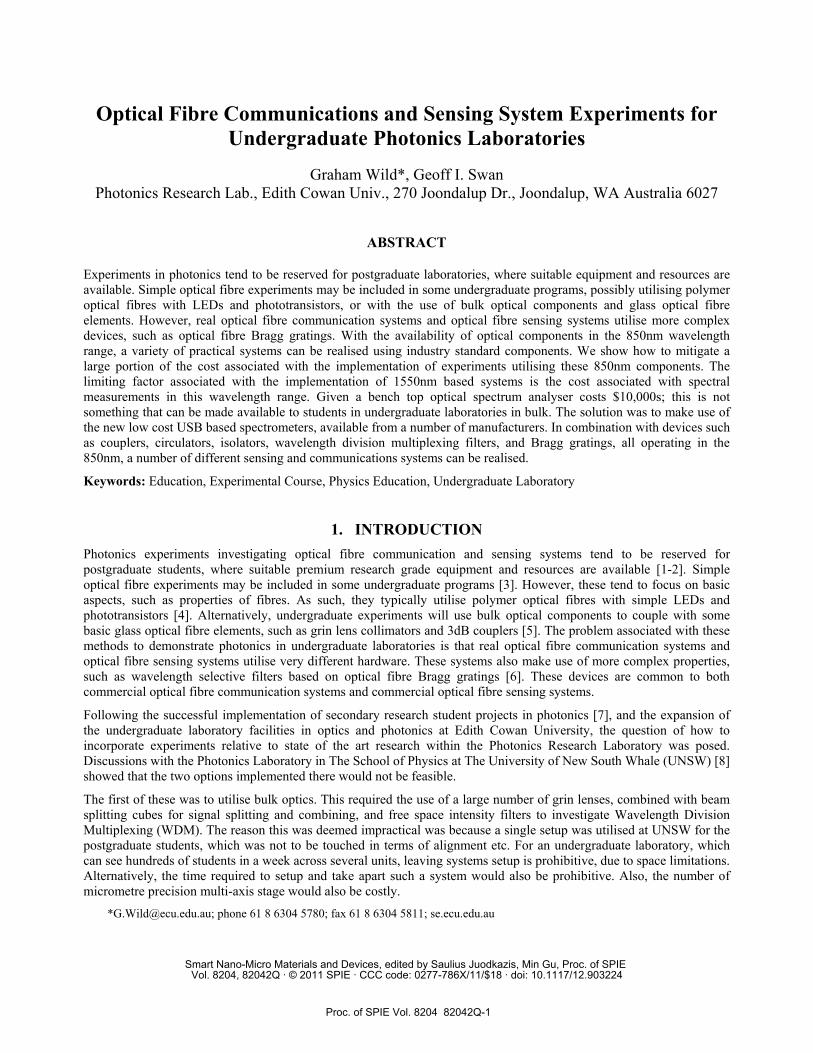
The experiments to investigate the properties of the passive component could utilise either the spectrometer as the detector, or a single photodiode based measurement. The properties of the three basic components can be easily investigated. The 3db splitting of the coupler can be show by using one of the sources at port 1, and measuring the output at the other three ports, as shown in Figure 4. The properties of the isolator can be shown by placing it between the light source and the spectrometer. Figure 5 shows that the isolator can be used in both the forward direction, demonstrating transmission, and in the reverse direction, demonstrating isolation. Finally, the properties of the circulator can be similarly demonstrated, by connecting the source to each of the ports, then measuring the output at the other two ports, as shown in Figure 6.
Figure 3. The setup used for spectral measurements of the 850nm LED and the 635nm laser diode.
Proc. of SPIE Vol. 8204 82042Q-4
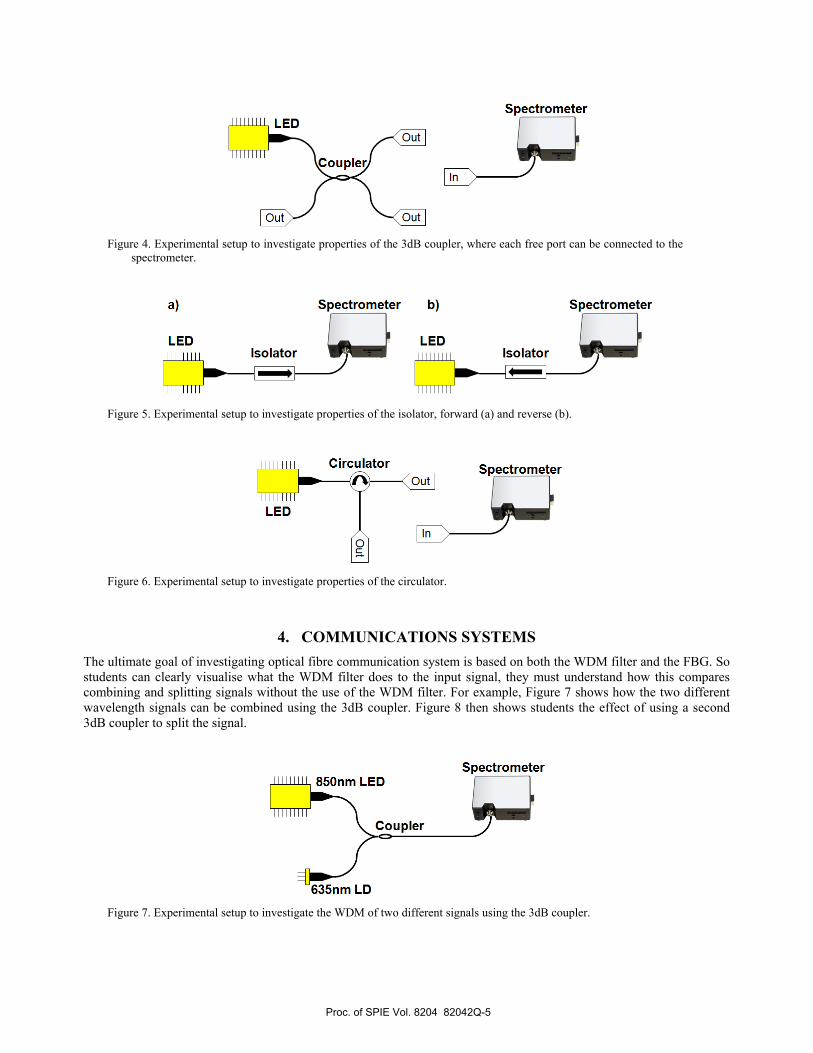
Figure 4. Experimental setup to investigate properties of the 3dB coupler, where each free port can be connected to the
spectrometer.
Figure 5. Experimental setup to investigate properties of the isolator, forward (a) and reverse (b).
Figure 6. Experimental setup to investigate properties of the circulator.
4. COMMUNICATIONS SYSTEMS The ultimate goal of investigating optical fibre communication system is based on both the WDM filter and the FBG. So students can clearly visualise what the WDM filter does to the input signal, they must understand how this compares combining and splitting signals without the use of the WDM filter. For example, Figure 7 shows how the two different wavelength signals can be combined using the 3dB coupler. Figure 8 then shows students the effect of using a second 3dB coupler to split the signal.
Figure 7. Experimental setup to investigate the WDM of two different signals using the 3dB coupler.
Proc. of SPIE Vol. 8204 82042Q-5

Figure 8. Experimental setup to investigate WDM signal splitting with a second 3dB coupler.
The optical circuit in Figure 8 will demonstrate that the splitter once again divides the optical power, but for both wavelengths simultaneously. That is, the original independent signals are not separable using the splitter. In contrast, Figure 9 shows the splitting of the two signals using the WDM filter. Here the two wavelengths will be separate as expected. This can be taken one step further, and digital or analogue signals could be applied to the two sources, and then two photoreceivers could be used to detect these signals, and displayed on an oscilloscope. Splitting with the 3dB coupler will show that the two signals are almost identical, while the two signals would be split using the WDM filter.
Figure 9. Experimental setup to investigate signal splitting with the WDM filter.
Finally, the stop band properties of the FBG can be investigated. This includes looking at both the narrow band signal reflected from FBG, and the remaining signal reflected, shown in Figure 10. This simple optical circuit, using the FBG and circulator, also represents an optical add drop multiplexer, another component used in communications systems.
Figure 10. Experimental setup to investigate the transmission and reflection properties of the FBG.
5. SENSING SYSTEMS Although optical fibre sensors utilise a large number of techniques, the most iconic of these is the optical fibre interferometer. With the addition of some optical fibre collimators, it would be possible to implement a Michelson
Proc. of SPIE Vol. 8204 82042Q-6

interferometer, or using two couplers, it would be possible to construct a Mach Zehnder interferometer. However, the use of the spectrometer, and the FBG as a filter for communications purposes, means that it would be far simpler to implement a sensing system utilising the FBG as the sensor. FBG are commonly used as sensors, and find applications in many diverse areas.
The simplest application to demonstrate in a laboratory is a temperature sensor. A typical laboratory setup for temperature sensor calibration can be utilised. Here the temperature sensor is conventional submerged in a body of ice water (at 0oC), which is then heated on a hotplate until it boils (100oC). For the FBG sensors, the fibre can be easily submerged in water, and the available pigtail can connect down to the circulator (port 2), which is also connected to the 850nm LED (port 1), and the USB spectrometer (port 3). This setup is shown in Figure 11.
Figure 11. The setup used to demonstrate the principle of optical fibre Bragg grating based sensing.
The low resolution of the USB spectrophotometer is a major limitation for the implantation of sensing, although a slightly larger investment can give resolutions as low as 0.02nm. However, the use of FBGs as sensors is not limited to pure spectral measurements, there are in fact a number of different filtering methods that can be used to convert the spectral shift of the FBG into an optical power change [11]. Power detection [12], where a laser is tuned to one of the 3dB points of the FBG would require a tunable laser at 850nm, so this would be prohibitive. The linear edge filter detection method would be the most cost effective [13], as it only requires the use of two identical FBGs and one or two photodetector.
Figure 12 shows different linear edge filter detection system configurations that could be utilised. Both of the FBGs used are narrowband filters. The reflected signal from the sensing FBG is passed through the matched FBG, and if they have the same central wavelength, then the transmitted signal will be minimal. If the central wavelength of the sensing FBG is shifted, then the transmitted signal will increase in intensity until they are completely mismatched. The best of these requires the use of two photodetectors, shown in Figure 12 (a). The two photodetectors enables relative power measurements to be taken; that is, the total power reflected from the sensing FBG is detected by the left receiver, and the sensing signal is detected by the right receiver. This enables optical power fluctuations to be compensated for. If all components suggested in the previous experimental are available, then this configuration would be possible. However, simpler configurations can be realised, as only the sensing signal (the filtered signal through the matched FBG) is essential. As a result, the next best option would only require a circulator and a single receiver to be used, as in Figure 12 (b). Alternatively, if the circulator is not available then an even simpler optical circuit can be constructed using only a coupler and a single receiver, shown in Figure 12 (c).
6. DISCUSSION The cost mitigation from the expensive optical spectrum analyser, sensitive from 600nm to 1700nm, to the short wavelength components, represents a significant improvement. While the 1550nm and 1310nm passive components are significantly cheaper (a 1550nm circulator can be purchased for approximately $600, while an 850nm circulator cost $1600), this significantly outweighs the expense of the OSA relative to the USB spectrometer. That is, a single OSA with 10 sets of 1550nm/1310nm components utilised in the above experiments would cost approximately the same as 10 sets of 850nm/635nm components, but with a USB spectrometer for each kit (Based on prices from Thorlabs [14] and other
Proc. of SPIE Vol. 8204 82042Q-7

smaller manufacturers). By using the shorter wavelength components, teaching and learning objectives are not adversely affected, except that students are not exposed to the use of a commercial OSA, which would typically be reserved for use in a research laboratory anyway.
Figure 12. Configurations for intensity based interrogation of a fibre Bragg grating sensor. a) The typical reference
calibration approach, b) a simplified approach with a single receiver, and c) using a coupler instead of a circulator.
The number of experiments that can be realised with this simple list of components is significant. A number of significant objectives can be achieved in terms of both optical fibre communication and sensing systems. An even greater number of experiments could be realised by incorporating the above experiments into a traditional undergraduate bulk optics laboratory. The issue with this is the complexity of collimating between free space optics and fibre optics is reintroduced, and the elegant simplicity of the above experiments is lost. However, in some situations, like for third year laboratories, or for undergraduate projects, this complexity may be suitable. An ideal example of this is the proposed systems for fibre to the node combined with free space to the home, where collimation is the issue to be addressed.
Another advantage of the approach taken with this work is the simplicity of the experimental setup. The use of standard components with industry standard connectors means that even students below the undergraduate level will be able to perform most, if not all, of the experiments detailed above. As such, the experimental programme could be utilised for both science enrichment with secondary school students, and for general education outreach in photonics. With the successful implementation of the experiments, they will be incorporated into a number of science enrichment and educational outreach programmes at Edith Cowan University. This includes the Siemens Summer Science Experience, where high performing students participate in several days of experimental activities across various disciplines on-campus, in addition to other similar programmes (Lab Rats) and activities such as open days.
7. CONCLUSION In conclusion, we have discussed the difficulty in implementing optical fibre based communication systems and sensing systems in undergraduate photonics laboratories. Specifically, the current undergraduate standard of utilising bulk optics with helium-neon lasers, or polymer optical fibres does not realistically reflect the current industry standards. However, the cost associated with implementing spectral measurements at 1550nm and 1310nm is prohibitive. In order to utilise standard components, the solution presented in this work is to utilise to a silicon CCD based USB spectrometer, and components at 635nm and 850nm. All of the standard optical fibre components can be investigated at these wavelengths, in addition to basic aspects of optical fibre communication systems, and optical fibre sensing systems.
Proc. of SPIE Vol. 8204 82042Q-8

ACKNOWLEDGMENTS
This work is part of an SPIE Education Outreach Grant. This grant is to be used to apply the above optical fibre communication and sensing systems experiments for educational outreach to young people both on and off campus. As such, the authors wish to acknowledge the support of SPIE.
REFERENCES
[1] Won, R., “Committed to optics,” Nature Photonics 3, 320-322 (2009). [2] Johnstone, W., Culshaw, B., Walsh, D., Moodie, D., Mauchline, I., “Photonics Laboratory Experiments for
Modern Technology-Based Courses,” Proc IEEE 88(1), 41-54 (2000). [3] Cheville, R.A., McGovern, A., Bull, K.S., “The Light Applications in Science and Engineering Research
Collaborative Undergraduate Laboratory for Teaching (LASER CULT)-Relevant Experiential Learning in Photonics,” IEEE Transactions on Education 48(2), 254-263 (2005).
[4] Ribeiro, R.M., “Development of Plastic Optical Fibers in Brazil: Passive Devices For Telecom, Sensing, and Engineering Education,” Proc. International POF Technical Conference, 157-161 (2000).
[5] Anderson, B.L., et al, “Photonics Laboratory with Emphasis on Technical Diversity,” IEEE Transactions on Education 41(3), 194-202 (1998).
[6] Othonos, A. and Kalli, K., [Fiber Bragg Gratings], Artech House (1999). [7] Hinckley, S., Wild, G., “Student Research Projects in Engineering: Optical Fibre Bragg Grating Sensor
Applications,” Proc. 2011 AAEE Conference (2011). [8] McMillan, P., Private Communications, School of Physics UNSW (2008). [9] Ocean Optics USB650 Red Tide Spectrometer, www.oceanoptics.com/products/usb650.asp. [10] Palais, J.C., [Fiber Optic Communications], Prentice Hall (1998). [11] Lee, B. and Jeong, Y., “Interrogation Techniques for Fiber Grating Sensors and the Theory of Fiber Gratings,”
Fiber Optic Sensors, Yu, F. T. S. and Yin, S., Eds, Marcel Dekker, 295–381 (2002). [12] Webb, D.J., et al., “Miniature fiber optic ultrasonic probe,” Proc. SPIE 2839, 76–80 (1996). [13] Perez, I., Cui, H.L., and Udd, E., “Acoustic emission detection using fiber Bragg gratings,” Proc SPIE 4328,
209–215 (2001). [14] Thorlabs, www.thorlabs.com.
Proc. of SPIE Vol. 8204 82042Q-9