optical probing of neuronal circuits with calcium indicators · optical probing of neuronal...
TRANSCRIPT
Optical probing of neuronal circuits withcalcium indicatorsZita A. Peterlin, James Kozloski, Bu-Qing Mao, Areti Tsiola, and Rafael Yuste*
Department of Biological Sciences, Columbia University, New York, NY 10027
Communicated by Torsten N. Wiesel, The Rockefeller University, New York, NY, January 28, 2000 (received for review November 26, 1999)
An experimental difficulty in unraveling circuits in the mammaliannervous system is the identification of postsynaptic targets of agiven neuron. Besides ultrastructural reconstructions, simulta-neous recordings from pairs of cells in brain slices have been usedto identify connected neurons. We describe in this paper a tech-nique using calcium imaging that allows rapid identification ofpotential postsynaptic targets. This method consists of stimulatingone neuron (‘‘trigger’’) while imaging a population of cells todetect which other neurons (‘‘followers’’) are activated by thetrigger. By using bulk-loading of calcium indicators in slices ofmouse visual cortex, we demonstrate that neurons that displaysomatic calcium transients time-locked to the spikes of a triggerneuron can be monosynaptically connected to it. This techniquecould be applied to reconstruct and assay circuits in the centralnervous system.
An essential part of neurobiology is the characterization ofcircuits. Although knowledge of circuit diagrams is neces-
sary to understand properly any computation (1), in mostnervous systems the detailed circuits remain mysterious, evenwhen the nature of the computation is clear (2). A directapproach to deciphering circuits is their reconstruction withelectron microscopy. This reconstruction has been achieved onlyin the nervous system of Caenorhabditis elegans, which consistsof 302 neurons with a stereotyped connectivity from animal toanimal (3). For most preparations, however, electron micro-scopic reconstructions of entire circuits are impractical becauseof the high number of neurons present and the laboriousness ofthe serial reconstruction (4–6).
Another approach to identify circuits is to perform intracel-lular recordings from connected cells. This has been doneextensively in invertebrate studies (7). In vertebrate prepara-tions, dual recordings of randomly chosen neurons in brain sliceshave been combined with anatomical reconstructions to identifysynaptic contacts (8–10). This approach, however, suffers fromthe problem that the probability that randomly chosen neuronsare connected is low. This and the large number of neuronalclasses make testing of possible connections and sequentialexamination of circuits impractical.
In this paper, we describe a method to identify potentialpostsynaptic targets of a given neuron in brain slices. Webulk-load calcium indicators into populations of neurons andthen image somatic calcium transients to detect the neurons thatproduce action potentials (APs) time-locked to a stimulated cell.We demonstrate the usefulness of this technique by findingmonosynaptically connected neurons in layer 5 from the mousevisual cortex.
MethodsSlice Preparation and Staining. Slices were made from visual cortexof postnatal day (P)12–P23 C57BLy6 mice. Animals were anes-thetized with 120 mg/kg ketaminey10 mg/kg xylazine and de-capitated. The brain quickly was removed and placed into coldartificial cerebrospinal f luid (ACSF; 126 mM NaCly3 mMKCly26 mM NaHCO3y1 mM NaH2PO4y1 mM CaCl2y3 mMMgSO4y10 mM dextrose, bubbled with 95% O2y5% CO2).Coronal slices, 300–400 mm thick, were cut with a Vibratome
(Technical Products International, St. Louis) and were incu-bated at 35°C for 30 min in a submerged slice chamber. Sliceswere then incubated at room temperature ('25°C) for 2–12 h.
For staining, slices were transferred to a small vial with acarbogen line. We used a double-incubation protocol (11, 12): (i)an initial incubation with 2–5 ml of a 1 mM fura-2 acetoxymethylester (AM) (Molecular Probes) in 100% DMSO solution for 2min, and (ii) a second incubation in 3 ml of 10 mM fura-2 AMin ACSF for 60 min. Both incubations were done in the dark. Inour experience, these DMSO incubations do not have a delete-rious effect on the health of the neurons, because normal restingpotentials and activity from DMSO-treated slices can routinelybe recorded for several hours after the procedure.
Imaging. After loading, slices were placed in a submerged re-cording chamber on an upright microscope (BX50WI; Olympus,New Hyde Park, NY). Experiments were done at room temper-ature. Fluorescent images were taken with a cooled charge-coupled device camera (Micromax; Princeton Instruments,Trenton, NJ) equipped with a frame-transfer chip (EEV 512;Kodak) or with a hexagonal photodiode array with 464 pixels(PDA; Universal Imaging, Media, PA). To maximize the numberof imaged neurons, we used a 203y0.5 numerical apertureobjective (Olympus). Camera acquisition was 10–40 msec perframe, and each pixel was digitized at 12 bits. Images wereacquired, stored, and analyzed with a Macintosh 7100 computer(Apple Computers) and IPLAB software (Signal Analytics, Vi-enna, VA). Signals from the photodiodes were amplified, sam-pled at 1.6 kHz, and analyzed with NEUROPLEX (UniversalImaging). For some experiments (Fig. 5), we used a silicon-intensified tube camera (C-2400; Hamamatsu, Middlesex, NJ)connected to a frame-grabbing board in a Macintosh 7600.Frames were acquired at '33 msec per frame, digitized at 8 bits,and analyzed with NIH IMAGE (National Institutes of Health).
We used a 380-nm excitation filter, a 395-nm dichroic mirror,and a 510-nm emission filter (Chroma Technology, Brattleboro,VT). We also collected images at the isosbestic excitation of 365nm to assess the approximate intracellular Ca21 concentrationand therefore monitor the health of the cells. We also used the365-nm images to estimate fura-2 concentrations, by using thefluorescence of the patched cell (with 50 mM fura-2) as acalibration, after correcting for background fluorescence andfocus.
Electrophysiology. Whole-cell patch clamp recordings were per-formed by using 3- to 7-MV pipettes filled with 110–150 mMpotassium gluconate or methylsulfonatey0–20 mM KCly4–10
Abbreviations: ACSF, artificial cerebrospinal fluid; Pn, postnatal day n; AP, action potential;EPSP, excitatory postsynaptic potential; DIC, differential interference contrast; AM, ace-toxymethyl ester.
*To whom reprint requests should be addressed at: Department of Biological Sciences,Columbia University, 1002 Fairchild Building, Box 2435, New York, NY 10027. E-mail:[email protected].
The publication costs of this article were defrayed in part by page charge payment. Thisarticle must therefore be hereby marked “advertisement” in accordance with 18 U.S.C.§1734 solely to indicate this fact.
PNAS u March 28, 2000 u vol. 97 u no. 7 u 3619–3624
NEU
ROBI
OLO
GY
mM NaCly10 mM Hepesy0–5 mM MgATPy0.05 mM fura-2pentapotassium salt (Molecular Probes). A GV seal was formedin voltage-clamp and whole-cell recordings were developed withaccess resistances between 10 and 20 MV. The amplifier (Axo-patch 2D; Axon Instruments, Foster City, CA) was then switchedto current clamp, and the neuron was stimulated by depolarizingcurrent steps. When necessary, current was injected to keep theresting potential at approximately 265 mV. The potential wasdigitized, stored, and analyzed with SUPERSCOPE (GW Instru-ments, Somerville, MA). Dual recordings were done with anAxopatch 200B (Axon Instruments) and a BVC-700 amplifier(Dagan Instruments, Minneapolis), and data were digitized withan analogydigital board (Instrutech, Mineola, NY) and con-trolled from a Macintosh 7600 running IGOR (WaveMetrics,Lake Oswego, OR).
Single-Cell Reconstruction. Neurons were filled with patch pipettescontaining 1% biocytin. After fixation in 4% paraformaldehyde,slices were rinsed in PBS and incubated in 10% methanoly3%H2O2 for 30 min. Slices were rinsed and incubated in a horse-radish peroxidase-conjugated avidin–biotin complex (Peroxi-dase Elite ABC Kit; Vector Laboratories) prepared in 0.75%Triton X-100 for 3 h at room temperature. Slices were thenrinsed and reacted with a 2.5 mgyml diaminobenzidine solutionin Tris buffer for 20 min. Biocytin-injected neurons were re-vealed by the diaminobenzidine precipitate. Before final dehy-dration, slices were counterstained with nuclear yellow fordemarcation of cortical layers.
Analysis. Changes in fluorescence were analyzed with a custom-written program. We defined the fluorescence change over timeas DFyF 5 [(F0 2 B0) 2 (F1 2 B1)]y(F0 2 B0), expressed inpercent, where F1 and B1 are fluorescence in the somata andbackground fluorescence, respectively, at any given time point,and F0 and B0 are fluorescence in the somata and backgroundfluorescence at the beginning of the experiment. To maximizethe detection of followers, we tailored the imaging and analysisprotocols to the kinetics of AP signals. Thus, with the cooledcharge-coupled device camera, we used relatively slow acquisi-tion rates ('40 msec per frame) to image the decay phase of thecalcium transient (Fig. 3). We analyzed those movies by makinga DFyF movie and adjusting the look-up table so that the pixelsrecording calcium increases appeared black over a light back-ground. This enabled the on-line (,3 min) visual detection ofany imaged neuron that produced a calcium transient larger than0.5% DFyF. In most recordings, the signal-to-noise ratio was .3.
ResultsLoading Neurons in Mature Cortical Slices with Fura 2-AM. To char-acterize the cortical microcircuitry present in brain slices, wesought to devise an experiment where the activity of a neuronalpopulation could be imaged while preserving single-cell resolu-tion in the data. In such an experiment, under ideal conditions,the stimulation of one neuron would activate its postsynaptictargets and thus reveal the cells that were connected to it. Giventhe complexity of the cortex, where different classes of cellspresumably are carrying out specific circuit functions, we rea-soned that the single-cell resolution should be an essentialfeature of this technique.
Voltage-sensitive dyes have been used in invertebrate prepa-rations for reconstruction of circuit activity and connectivity (13,14). Nevertheless, we found that their application in brain slicesresulted in preferential staining of the neuropil and in smallsignals (15). As an alternative, we explored using calciumindicators, building on our previous work that showed thatoptical monitoring of the activity of neuronal populations isfeasible by bulk-labeling brain slices with calcium indicators (12,16, 17). In fact, calcium channels in the neuronal plasma
membrane (18, 19) mediate somatic calcium transients associ-ated with APs (17, 20). Therefore, because calcium imagingmakes possible the optical detection of APs in populations ofneurons (17), it should enable the identification of neurons thatproduce an AP in response to stimulation of another neuron.
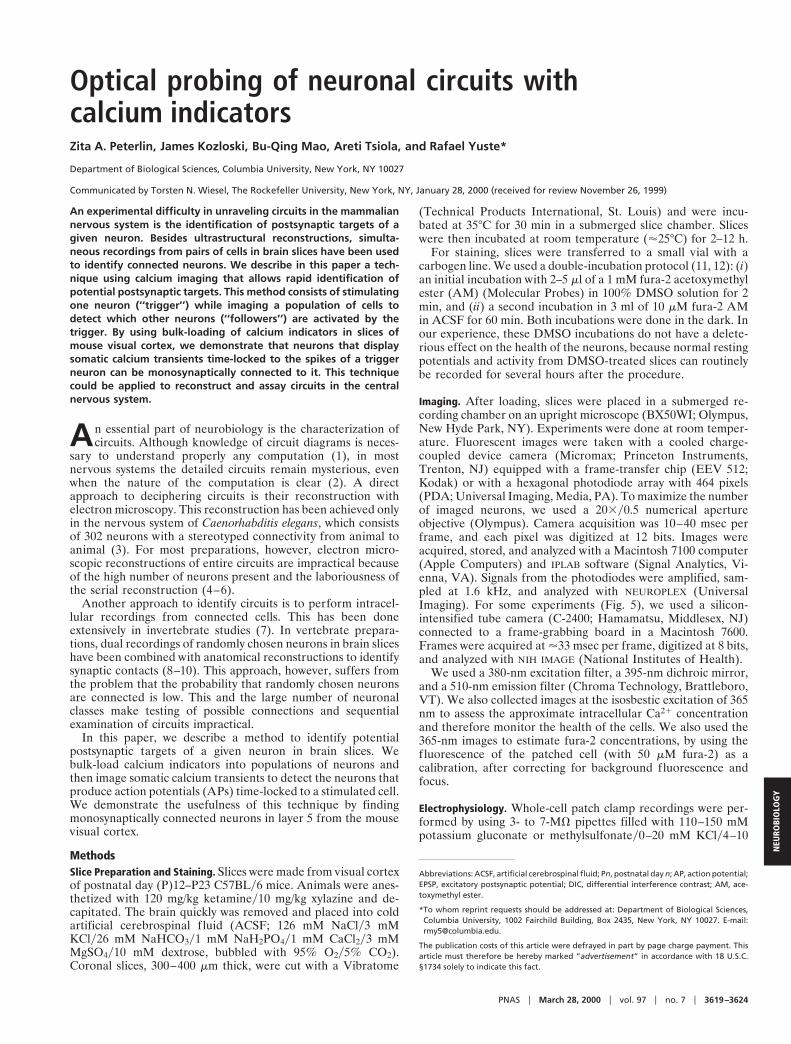
We previously found that diluted solutions of AM forms ofcalcium indicators stain populations of cells in developing cortex(rats and mice ,P7), but that the staining became poorer inolder animals (16). We recently developed a double-incubationprotocol, with concentrated DMSO solutions of fura-2 AMapplied for brief periods of time, that can label a large proportionof the neurons in juvenile (P10–P30) neocortical slices (refs. 11and 12; Fig. 1). With this protocol, we estimate that most neuronswere loaded with '50 mM fura-2 (see Methods). The loading didnot seem to be cell type-specific, because when differentialinterference contrast (DIC) images were used to classify f luo-rescently labeled cells, both pyramidal and nonpyramidal neu-rons appeared to load equally (Fig. 1 A and B). We estimated thatthe percentage of cells loaded with fura-2 AM ranged from'60% to 100%. This proportion changed from slice to slice, butfollowed a trend of smaller percentages of loaded cells in olderanimals (Fig. 1C).
Detecting Activation of Follower Cells After Stimulation of a TriggerCell. After establishing that the labeling of neurons with fura-2AM was reliable, we imaged the somata of dozens to hundredsof loaded cells during whole-cell stimulation of a particularneuron (the ‘‘trigger’’ cell). We carried out this work in mousevisual cortex and chose large pyramidal neurons in layer 5 astrigger cells. We included 50 mM fura-2 pentapotassium salt inthe patch pipette to image the trigger.
We stimulated the trigger neuron to fire a train of APs byinjecting pulses of depolarizing current (Fig. 2A). Each APproduced a calcium transient in the soma of the neuron withpeak amplitudes of 1–5% DFyF, time-to-peak of &10 msec, anddecays that lasted for several seconds (Fig. 2B). Depolarizingpulses that did not reach threshold did not result in any detect-able somatic calcium accumulations. Because the onset of thecalcium transient occurred within ,1 msec from the peak of theAP, by using a photodiode array with high temporal resolution
Fig. 1. Loading mature cortical slices with fura-2 AM. DIC (A) and fluores-cence (B) images of the lower layers of a visual cortex slice from a P10 mousewith the pial surface to the bottom right. The slice was loaded with fura-2 AM.Somata and apical dendrites from many neurons are fluorescent, and pyra-midal and nonpyramidal neurons label equally. (Scale bar 5 20 mm.) (C)Percentage of loaded neurons as a function of the age of the animal. Eachpoint represents one brain slice. Loading is close to 100% at P10, but it declinesto '70% of the neurons at P20. The line represents the best linear fit.
3620 u www.pnas.org Peterlin et al.

(0.6 msec), we could accurately follow the occurrence of each APin the patched cell.
In our initial experiments, we found that stimulation of thetrigger cell with a train of APs produced time-locked increasesof the intracellular Ca21 concentration in other neurons (‘‘fol-lowers’’; Fig. 2C). Because of the similarity in amplitude andkinetics of the responses in the follower cells to those elicited bya single AP in the trigger cell, we reasoned that they were alsoproduced by single APs and that the follower neurons werebrought to AP threshold by the stimulation of the trigger cell.The latency of the trigger’s AP to the onset of calcium accu-mulation of the follower cells was, in most instances, ,5 msec.Taking into account delays in axonal propagation, synaptictransmission, and time for excitatory postsynaptic potentials(EPSPs) to reach threshold, this suggested that followers weremonosynaptically connected to the trigger.
Optimization of the Technique with Mg21-Free ACSF. After theseresults, we explored regimes where followers were easilydetected. Because the light intensities necessary to measuresignals with the photodiode array caused bleaching of the dye,we switched to camera imaging, at the expense of a slowertemporal resolution (33 msec per frame for silicone-intensifiedtube analysis; 10–40 msec per frame for charge-coupled devicecamera). We tested different stimulation protocols. In agree-ment with the small size of single-axon cortical EPSPs (10, 21,22), we never detected followers after a single AP of thetrigger. Nevertheless, with trains of APs, activation of follow-ers happened readily, suggesting that temporal summation ofEPSPs was bringing the follower to threshold. To take advan-tage of synaptic facilitation, we used stimulations of 10 spikesat 40 Hz. Shorter trains (5 spikes), to avoid synaptic depres-sion, did not increase the yield of the experiment. Becausefollower neurons were not necessarily in the same focal planeas the trigger cell, we routinely screened neurons at differentfocal planes.
We experimented with methods of enhancing synaptic releaseand of making postsynaptic cells more excitable. To decreasesynaptic failures and produce larger action potential-inducedcalcium signals, we used 3 mM Ca21 in our ACSF, whichmodestly increased the number of followers detected. At thesame time, we noticed a marked increase in followers withMg21-free ACSF to unblock NMDA receptors, although thismanipulation increased the spontaneous activity present in theslice. In 115 trials using 2-sec imaging periods, 221 cells wereactive 362 times during the recording. Of those events, 108occurred in the 840-msec period before the stimulus, 111 oc-curred during the 240-msec stimulation train, and 143 eventsoccurred in the 840-msec period after the stimulus. Thus, inMg21-free ACSF, the probability per unit time of detecting acalcium transient was increased 4.3-fold by the stimulation of thetrigger cell (5.2 3 1023 to 2.2 3 1022 activations per cell per sec;P , 0.0005, Student’s t test). We concluded that neurons thatproduced calcium transients time-locked to the stimulus werelikely to be activated by the trigger cell.
Repeated Activation and Spatial Distribution of Follower Cells. Theprevious results suggested that, in Mg21-free ACSF, followerswith time-locked responses to the trigger were probably con-nected to it. Nevertheless, some neurons could also producespontaneous calcium transients time-locked to the stimulus. Wereasoned, however, that spontaneous time-locked events wereunlikely to occur in more than one trial. By using the probabilityof spontaneous activation, we estimated that the activation of anaverage neuron by chance during the stimulus period in twoconsecutive trials was 1.5 3 1026. Therefore, we inquiredwhether there were follower neurons that were activated in morethan one trial and were thus likely to be connected to the trigger.
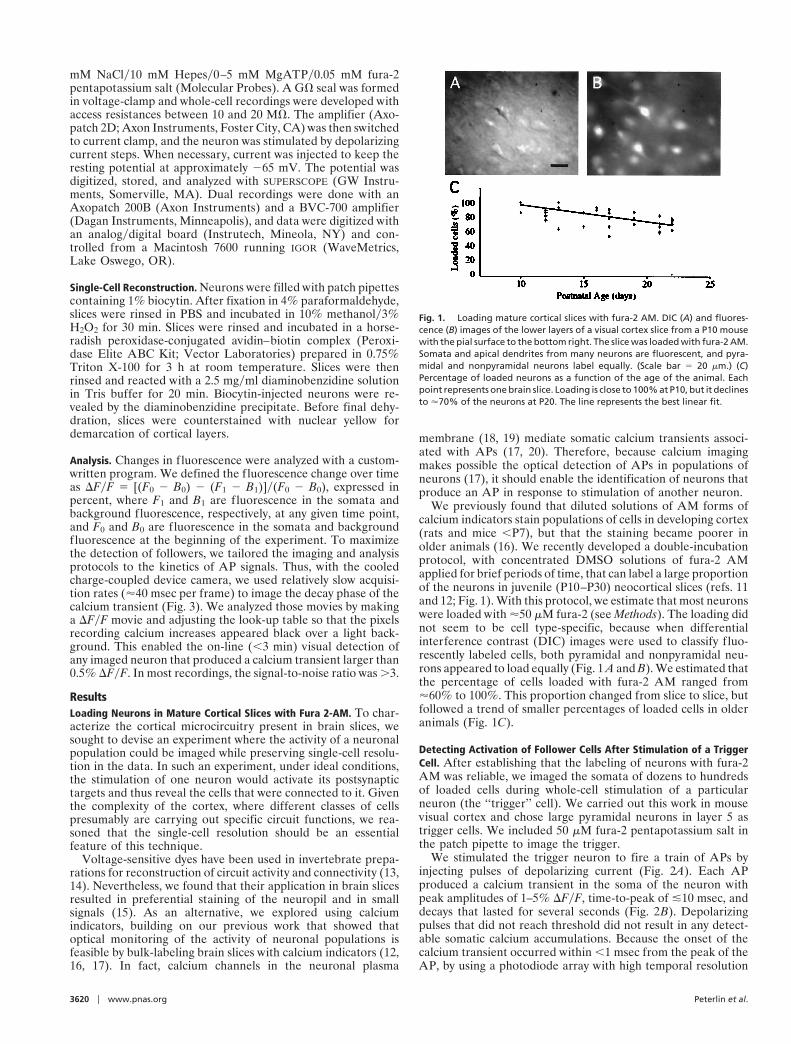
From 90 detected followers, we found that 17 cells weretime-locked to the trigger in more than one trial (14y17 inconsecutive trials; Fig. 3). We concluded that these neurons wereprobably connected to the trigger. This, however, does not implythat followers that did not repeat are not connected to the triggercell. Interestingly, followers that were activated repeatedly werenot activated in all trials (Fig. 3 C and D; see Electrophysiologicaland Anatomical Confirmation of Contacts).
We also wondered what was the laminar distribution of thefollowers (Fig. 3E). By using 380- 3 380-mm fields of viewcentered on the trigger cell in layer 5, we detected followers inlayer 5 (92%) and layer 6 (8%). The position of the followersactivated more than once was similar to the total population ofthe followers (Fig. 3E, open circles). No followers were found inlayer 4, although most of layer 4 and upper layer 6 were imagedin every experiment. Followers were located at distances rangingfrom 26 to 273 mm from the trigger (117 6 6 mm; n 5 80). We
Fig. 2. Follower neuron time-locked to the stimulation of a trigger cell. (A)Whole-cell recording of neuron 1 (trigger). In response to five depolarizingcurrent pulses (3 nA; 5 msec), the neuron fires five APs. (B) Simultaneousfluorescence measurements with a photodiode of the somatic region ofneuron 1 show discrete calcium accumulations that correspond to the five APs.The sign of the fluorescence signals in all figures has been inverted. ADU,analog-digital voltage units. (C) Simultaneous fluorescence measurements ofneuron 2 (follower), showing an intracellular calcium concentration ([Ca21]i)transient phase-locked with the fourth AP of neuron 1. The onset of thecalcium signal in neuron 2 occurs coincident (,0.6 msec) with the peak ofthe AP in neuron 1. Neuron 2 has subsequent [Ca21]i increases. The exper-iment was carried out in a P18 mouse cortical slice under ACSF with 2 mMCa21y1 mM Mg21.
Peterlin et al. PNAS u March 28, 2000 u vol. 97 u no. 7 u 3621
NEU
ROBI
OLO
GY
did not detect clear clustering or asymmetry of their positions,although the exact location of the chosen trigger within layer 5changed from experiment to experiment. By using DIC, wesought to classify somatic morphologies and to inquire whetherfollowers belonged to a specific cell class. In 15 cases in whichDIC images were optimal, followers had nonpyramidal (n 5 3)or pyramidal (n 5 12) cell bodies.
Electrophysiological and Anatomical Confirmation of Contacts. Wenext inquired whether synaptic connections existed between
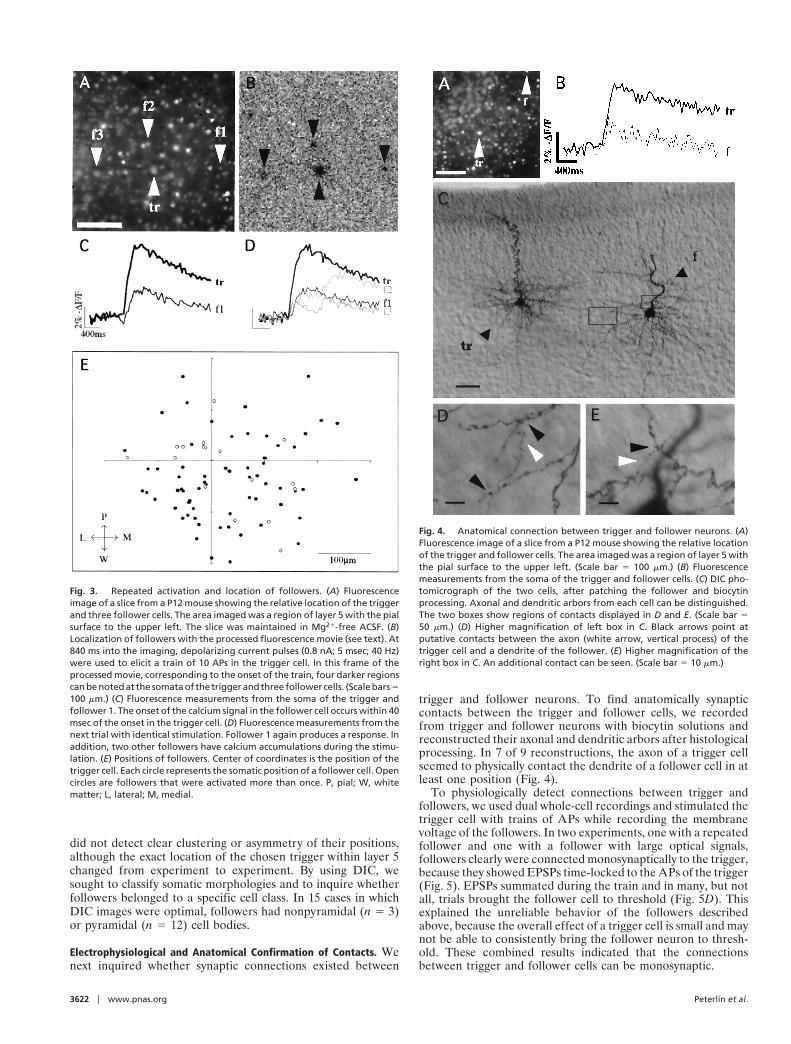
trigger and follower neurons. To find anatomically synapticcontacts between the trigger and follower cells, we recordedfrom trigger and follower neurons with biocytin solutions andreconstructed their axonal and dendritic arbors after histologicalprocessing. In 7 of 9 reconstructions, the axon of a trigger cellseemed to physically contact the dendrite of a follower cell in atleast one position (Fig. 4).
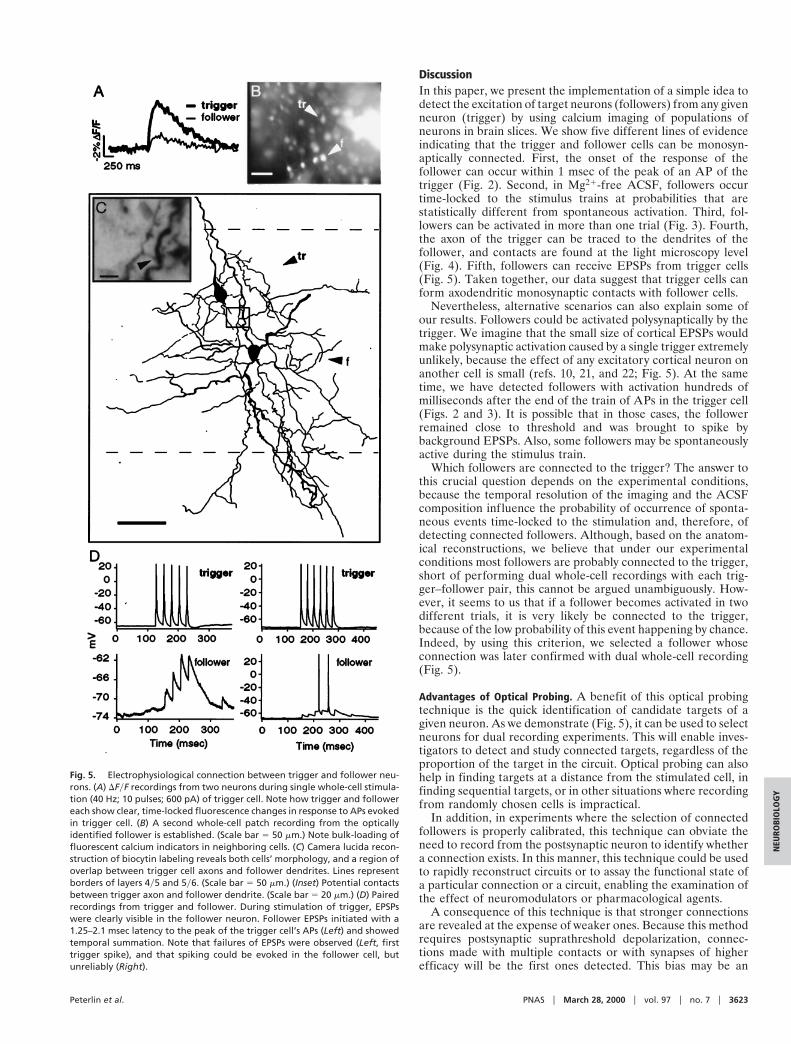
To physiologically detect connections between trigger andfollowers, we used dual whole-cell recordings and stimulated thetrigger cell with trains of APs while recording the membranevoltage of the followers. In two experiments, one with a repeatedfollower and one with a follower with large optical signals,followers clearly were connected monosynaptically to the trigger,because they showed EPSPs time-locked to the APs of the trigger(Fig. 5). EPSPs summated during the train and in many, but notall, trials brought the follower cell to threshold (Fig. 5D). Thisexplained the unreliable behavior of the followers describedabove, because the overall effect of a trigger cell is small and maynot be able to consistently bring the follower neuron to thresh-old. These combined results indicated that the connectionsbetween trigger and follower cells can be monosynaptic.
Fig. 3. Repeated activation and location of followers. (A) Fluorescenceimage of a slice from a P12 mouse showing the relative location of the triggerand three follower cells. The area imaged was a region of layer 5 with the pialsurface to the upper left. The slice was maintained in Mg21-free ACSF. (B)Localization of followers with the processed fluorescence movie (see text). At840 ms into the imaging, depolarizing current pulses (0.8 nA; 5 msec; 40 Hz)were used to elicit a train of 10 APs in the trigger cell. In this frame of theprocessed movie, corresponding to the onset of the train, four darker regionscan be noted at the somata of the trigger and three follower cells. (Scale bars 5100 mm.) (C) Fluorescence measurements from the soma of the trigger andfollower 1. The onset of the calcium signal in the follower cell occurs within 40msec of the onset in the trigger cell. (D) Fluorescence measurements from thenext trial with identical stimulation. Follower 1 again produces a response. Inaddition, two other followers have calcium accumulations during the stimu-lation. (E) Positions of followers. Center of coordinates is the position of thetrigger cell. Each circle represents the somatic position of a follower cell. Opencircles are followers that were activated more than once. P, pial; W, whitematter; L, lateral; M, medial.
Fig. 4. Anatomical connection between trigger and follower neurons. (A)Fluorescence image of a slice from a P12 mouse showing the relative locationof the trigger and follower cells. The area imaged was a region of layer 5 withthe pial surface to the upper left. (Scale bar 5 100 mm.) (B) Fluorescencemeasurements from the soma of the trigger and follower cells. (C) DIC pho-tomicrograph of the two cells, after patching the follower and biocytinprocessing. Axonal and dendritic arbors from each cell can be distinguished.The two boxes show regions of contacts displayed in D and E. (Scale bar 550 mm.) (D) Higher magnification of left box in C. Black arrows point atputative contacts between the axon (white arrow, vertical process) of thetrigger cell and a dendrite of the follower. (E) Higher magnification of theright box in C. An additional contact can be seen. (Scale bar 5 10 mm.)
3622 u www.pnas.org Peterlin et al.
DiscussionIn this paper, we present the implementation of a simple idea todetect the excitation of target neurons (followers) from any givenneuron (trigger) by using calcium imaging of populations ofneurons in brain slices. We show five different lines of evidenceindicating that the trigger and follower cells can be monosyn-aptically connected. First, the onset of the response of thefollower can occur within 1 msec of the peak of an AP of thetrigger (Fig. 2). Second, in Mg21-free ACSF, followers occurtime-locked to the stimulus trains at probabilities that arestatistically different from spontaneous activation. Third, fol-lowers can be activated in more than one trial (Fig. 3). Fourth,the axon of the trigger can be traced to the dendrites of thefollower, and contacts are found at the light microscopy level(Fig. 4). Fifth, followers can receive EPSPs from trigger cells(Fig. 5). Taken together, our data suggest that trigger cells canform axodendritic monosynaptic contacts with follower cells.
Nevertheless, alternative scenarios can also explain some ofour results. Followers could be activated polysynaptically by thetrigger. We imagine that the small size of cortical EPSPs wouldmake polysynaptic activation caused by a single trigger extremelyunlikely, because the effect of any excitatory cortical neuron onanother cell is small (refs. 10, 21, and 22; Fig. 5). At the sametime, we have detected followers with activation hundreds ofmilliseconds after the end of the train of APs in the trigger cell(Figs. 2 and 3). It is possible that in those cases, the followerremained close to threshold and was brought to spike bybackground EPSPs. Also, some followers may be spontaneouslyactive during the stimulus train.
Which followers are connected to the trigger? The answer tothis crucial question depends on the experimental conditions,because the temporal resolution of the imaging and the ACSFcomposition influence the probability of occurrence of sponta-neous events time-locked to the stimulation and, therefore, ofdetecting connected followers. Although, based on the anatom-ical reconstructions, we believe that under our experimentalconditions most followers are probably connected to the trigger,short of performing dual whole-cell recordings with each trig-ger–follower pair, this cannot be argued unambiguously. How-ever, it seems to us that if a follower becomes activated in twodifferent trials, it is very likely be connected to the trigger,because of the low probability of this event happening by chance.Indeed, by using this criterion, we selected a follower whoseconnection was later confirmed with dual whole-cell recording(Fig. 5).
Advantages of Optical Probing. A benefit of this optical probingtechnique is the quick identification of candidate targets of agiven neuron. As we demonstrate (Fig. 5), it can be used to selectneurons for dual recording experiments. This will enable inves-tigators to detect and study connected targets, regardless of theproportion of the target in the circuit. Optical probing can alsohelp in finding targets at a distance from the stimulated cell, infinding sequential targets, or in other situations where recordingfrom randomly chosen cells is impractical.
In addition, in experiments where the selection of connectedfollowers is properly calibrated, this technique can obviate theneed to record from the postsynaptic neuron to identify whethera connection exists. In this manner, this technique could be usedto rapidly reconstruct circuits or to assay the functional state ofa particular connection or a circuit, enabling the examination ofthe effect of neuromodulators or pharmacological agents.
A consequence of this technique is that stronger connectionsare revealed at the expense of weaker ones. Because this methodrequires postsynaptic suprathreshold depolarization, connec-tions made with multiple contacts or with synapses of higherefficacy will be the first ones detected. This bias may be an
Fig. 5. Electrophysiological connection between trigger and follower neu-rons. (A) DFyF recordings from two neurons during single whole-cell stimula-tion (40 Hz; 10 pulses; 600 pA) of trigger cell. Note how trigger and followereach show clear, time-locked fluorescence changes in response to APs evokedin trigger cell. (B) A second whole-cell patch recording from the opticallyidentified follower is established. (Scale bar 5 50 mm.) Note bulk-loading offluorescent calcium indicators in neighboring cells. (C) Camera lucida recon-struction of biocytin labeling reveals both cells’ morphology, and a region ofoverlap between trigger cell axons and follower dendrites. Lines representborders of layers 4y5 and 5y6. (Scale bar 5 50 mm.) (Inset) Potential contactsbetween trigger axon and follower dendrite. (Scale bar 5 20 mm.) (D) Pairedrecordings from trigger and follower. During stimulation of trigger, EPSPswere clearly visible in the follower neuron. Follower EPSPs initiated with a1.25–2.1 msec latency to the peak of the trigger cell’s APs (Left) and showedtemporal summation. Note that failures of EPSPs were observed (Left, firsttrigger spike), and that spiking could be evoked in the follower cell, butunreliably (Right).
Peterlin et al. PNAS u March 28, 2000 u vol. 97 u no. 7 u 3623
NEU
ROBI
OLO
GY

advantage in areas with distributed connections, because it willselect for connections that are more effective in driving thecircuit.
Another advantage of this technique is that the strength andreliability of individual synaptic connections can be tested inparallel. Thus, studies can be done simultaneously in multiplepostsynaptic neurons, stimulating the trigger with protocols toinduce potentiation or depression in target cells, or to examinewhether particular temporal patterns of activity excite specifictypes of followers.
A final advantage of this technique is that it does not requirecomplex equipment. As we show in Fig. 5, because of the largeamplitude of the optical signals, APs can be detected in neuronalpopulations with silicon-intensified tube cameras and 8-bit digi-tization boards.
Modifications of the Technique and Future Directions. One limitationof this approach is that it only reveals excitatory connections.Nevertheless, it could be used under high-background sponta-neous activity, induced pharmacologically as described above. Inthis case, stimulation of an inhibitory trigger could produce atime-locked inhibition of the APs of followers. Also, Cl2 indi-
cators could enable direct imaging of inhibitory connections(23). A second limitation with this approach is that it reveals onlysuprathreshold targets, although the excitability of the slice caneasily be manipulated to turn initially subthreshold events intosuprathreshold ones and to reveal a larger selection of targets.
An exciting prospect of this technique is its use with geneti-cally encodable activity-sensitive indicators, like calmodulin–green fluorescent protein indicators (24, 25) or potassium-channel green fluorescent protein constructs (26). Besidespossible improvements in signal-to-noise ratio and possiblemeasurements of EPSPs, genetic indicators could be expressedspecifically, enabling the piecemeal analysis of circuits. Also,animals expressing these indicators in cortical neurons couldenable in vivo experiments with two-photon microscopy (27) andcould allow detection of long-distance targets. In an ideal case,optical probing could also be combined with computerizedphotostimulation (28, 29) of individual trigger neurons to makepossible a fast and systematic reconstruction of circuits.
We thank K. Holthoff, A. Majewska, and E. Macagno for comments. TheNational Eye Institute (grant EY11787) funded this work. This paper isdedicated to the memory of R. Perez Torres.
1. Marr, D. (1982) Vision (Freeman, New York), pp. 23–27.2. Heiligenberg, W. (1991) Neural Nets in Electric Fish (MIT Press, Cambridge,
MA).3. White, J. G., Southgate, E., Thomson, J. N. & Brenner, S. (1986) Philos. Trans.
R. Soc. London B 314, 1–340.4. Freund, T. F., Martin, K. A., Somogyi, P. & Whitteridge, D. (1985) J. Comp.
Neurol. 242, 275–291.5. McGuire, B. A., Gilbert, C. D., Rivlin, P. K. & Wiesel, T. N. (1991) J. Comp.
Neurol. 305, 370–392.6. Czeiger, D. & White, E. L. (1993) J. Comp. Neurol. 330, 502–513.7. Marder, E. & Calabrese, R. L. (1996) Physiol. Rev. 76, 687–717.8. Gulyas, A. I., Miles, R., Sik, A., Toth, K., Tamamaki, N. & Freund, T. F. (1993)
Nature (London) 366, 683–687.9. Buhl, E. H., Halasy, K. & Somogyi, P. (1994) Nature (London) 368, 823–828.
10. Deuchars, J., West, D. C. & Thomson, A. (1994) J. Physiol. 478, 423–435.11. Schwartz, T., Rabinowitz, D., Unni, V. K., Kumar, V. S., Smetters, D. K., Tsiola,
A. & Yuste, R. (1998) Neuron 20, 1271–1283.12. Yuste, R. (1999) in Imaging Neurons: A Laboratory Manual, eds. Yuste, R.,
Lanni, F. & Konnerth, A. (Cold Spring Harbor Lab. Press, Plainview, NY),34.1–34.9.
13. Cohen, L. B. & Lesher, S. (1986) in Optical Methods in Cell Physiology, eds. DeWeer, P. & Salzberg, B. M. (Wiley Interscience, New York), pp. 72–99.
14. Cacciatore, T. W., Brodfuehrer, P. D., Gonzalez, J. E., Jiang, T., Adams, S. R.,Tsien, R. Y., Kristan, W. B. & Kleinfeld, D. (1999) Neuron 23, 449–459.
15. Yuste, R., Tank, D. W. & Kleinfeld, D. (1997) Cereb. Cortex 7, 546–558.16. Yuste, R. & Katz, L. C. (1991) Neuron 6, 333–344.17. Smetters, D., Majewska, A. & Yuste, R (1999) Methods 18, 215–221.18. Yuste, R., Gutnick, M. J., Saar, D., Delaney, K. D. & Tank, D. W. (1994)
Neuron 13, 23–43.19. Johnston, D., Magee, J. C., Colbert, C. M. & Christie, B. R. (1996) Annu. Rev.
Neurosci. 19, 165–186.20. Helmchen, F., Imoto, K. & Sakmann, B. (1996) Biophys. J. 70, 1069–1081. R. Y.21. Mason, A., Nicoll, A. & Stratford, K. (1991) J. Neurosci. 11, 72–84.22. Markram, H. & Tsodyks, M. (1996) Nature (London) 382, 807–810.23. Inglefield, J. R. & Schwartz-Bloom, R. D. (1999) Methods 18, 197–203.24. Romoser, V. A., Hinkle, P. M. & Persechini, A. (1997) J. Biol. Chem. 272,
13270–13274.25. Miyawaki, A., Llopis, J., Heim, R., McCaffery, J. M., Adams, J. A., Ikura, M.
& Tsien, R. Y. (1997) Nature (London) 388, 882–887.26. Siegel, M. S. & Isacoff, E. Y. (1997) Neuron 19, 735–741.27. Denk, W., Delaney, K. R., Gelperin, A., Kleinfeld, D., Strowbridge, B. W.,
Tank, D. W. & Yuste, R. (1994) J. Neurosci. Methods 54, 151–162.28. Farber, I. C. & Grinvald, A. (1983) Science 222, 1025–1027.29. Callaway, E. M. & Katz, L. C. (1993) Proc. Natl. Acad. Sci. USA 90, 7661–7665.
3624 u www.pnas.org Peterlin et al.