optical rs image interpretation - iit bombayavikb/gnr401/rs/rs_401_lecture_8.pdf · geology using...
TRANSCRIPT

OPTICAL RS IMAGE INTERPRETATION Lecture 8
1GNR401 Dr. A. Bhattacharya

Visible – Middle Infrared Image Bands
GNR401 Dr. A. Bhattacharya
2
Data
Processing
Interpretation
Recognition, Classification, Knowledge
Information – data in a useable form
VisualAI (Machine learning)

Interpretation
GNR401 Dr. A. Bhattacharya
3
Major issues:•Scale•Perspective•Wavelengths

Interpretation : Visual Interpretation
GNR401 Dr. A. Bhattacharya
4
Key image characteristics used in visual image interpretationsShapeSizePatternTone or hueTextureShadowsSiteAssociationResolution
Interpretation : Shape
GNR401 Dr. A. Bhattacharya
5
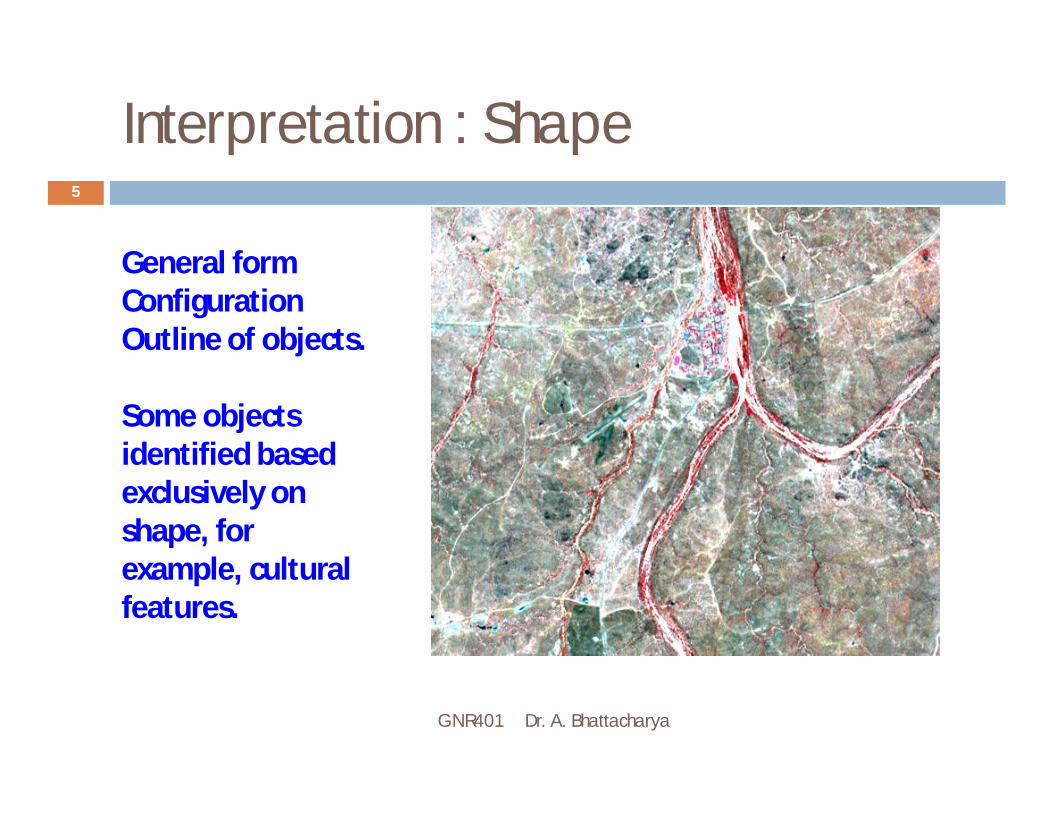
General form ConfigurationOutline of objects.
Some objects identified based exclusively on shape, for example, cultural features.

Interpretation : Shadows
GNR401 Dr. A. Bhattacharya
6
Offer a profile view, hence easier to interpret (natural way of looking)
However, objects in the shadows are dark, hence not seen clearly

Interpretation : Shadows
GNR401 Dr. A. Bhattacharya
7
Interpretation : Pattern
GNR401 Dr. A. Bhattacharya
8
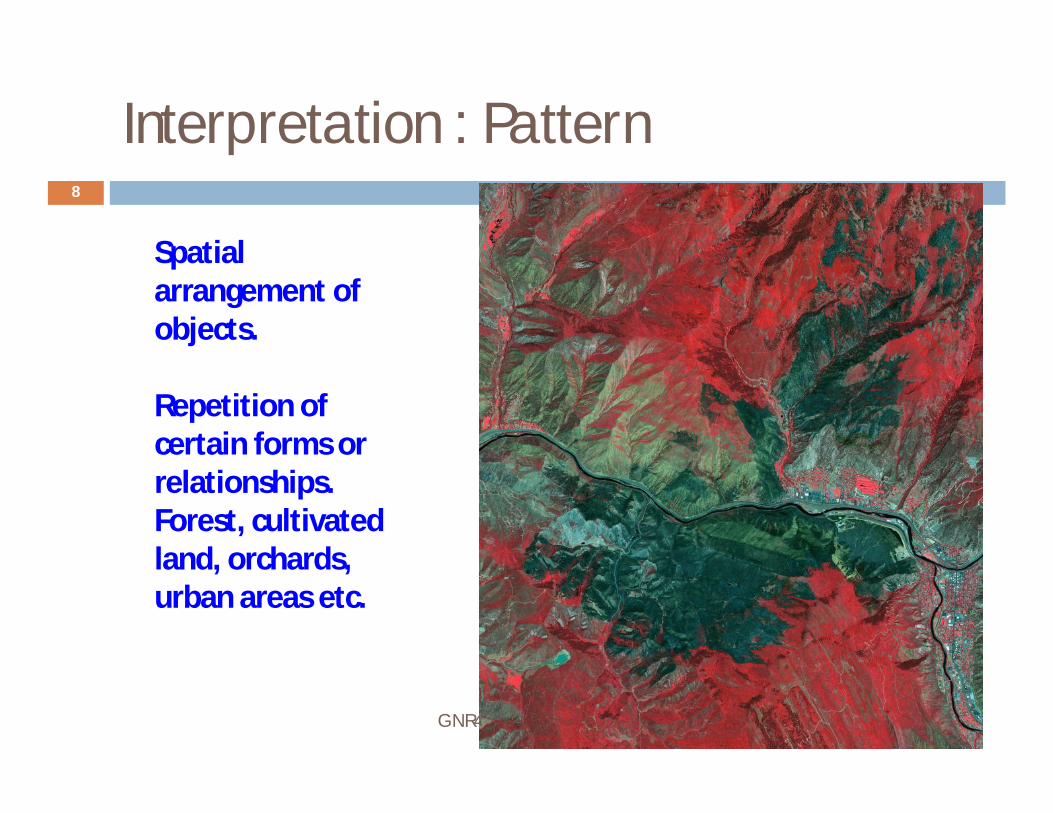
Spatial arrangement of objects.
Repetition of certain forms or relationships.Forest, cultivated land, orchards, urban areas etc.

Color model : RGB
GNR401 Dr. A. Bhattacharya
9
The RGB color model The RGB color model is additive in the sense that the
three light beams are added together, and their light spectra add, wavelength for wavelength, to make the final color's spectrum

Color model : CMY
GNR401 Dr. A. Bhattacharya
10
The CMY color model The CMY color model is a subtractive because it
describes what kind of inks need to be applied so the light reflected from the substrate and through the inks produces a given color.

Color model : HSV
GNR401 Dr. A. Bhattacharya
11
HSV is the most common cylindrical-coordinate representations of points in an RGB color model, which rearrange the geometry of RGB in an attempt to be more intuitive and perceptually relevant than the Cartesian (cube) representation.
Color model : HSV
GNR401 Dr. A. Bhattacharya
12
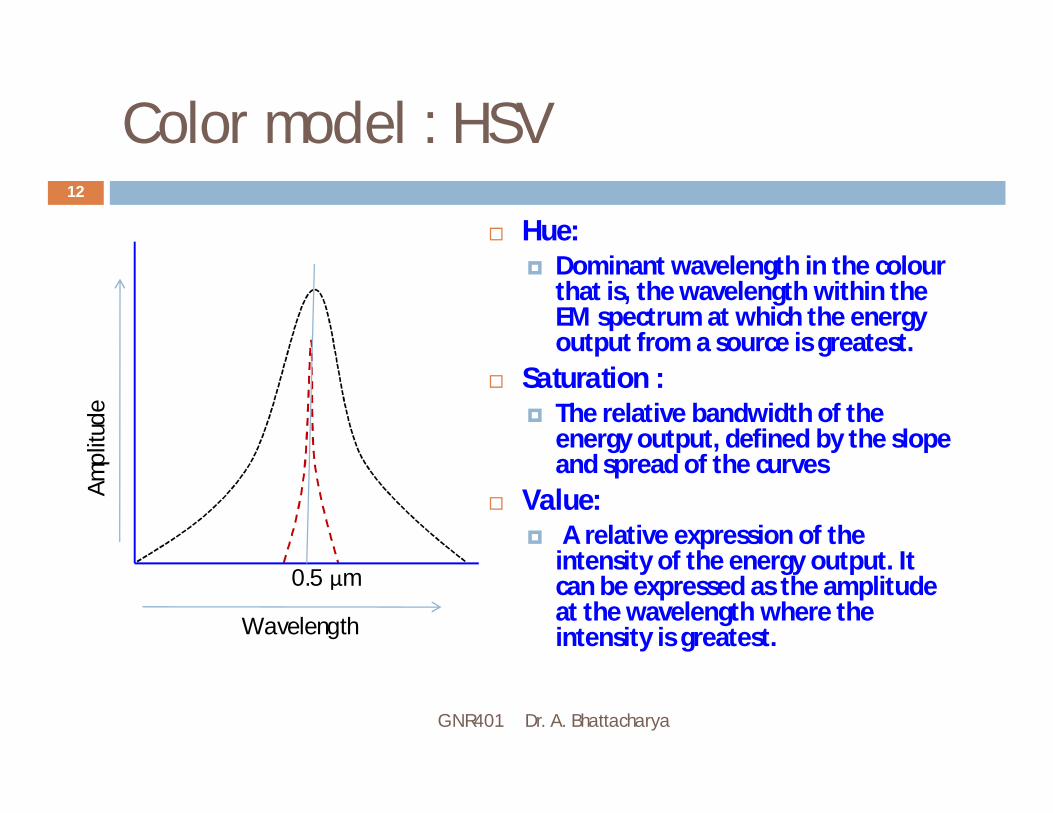
Hue: Dominant wavelength in the colour
that is, the wavelength within the EM spectrum at which the energy output from a source is greatest.
Saturation : The relative bandwidth of the
energy output, defined by the slope and spread of the curves
Value: A relative expression of the
intensity of the energy output. It can be expressed as the amplitude at the wavelength where the intensity is greatest.Wavelength
Am
plitu
de
0.5 μm

Interpretation : Tone or Hue, Saturation, and Brightness (Value)
GNR401 Dr. A. Bhattacharya
13
Critical properties that are dependent on the spectral reflectance characteristics,
Hence indicate physical and chemical properties of objects Change in tone indicates a change in shape (geometrical configuration), or in physical/chemical compositionWithout tonal (or hue, saturation and brightness) variations, one can neither discern patterns, nor shape nor size nor texture
GNR401 Dr. A. Bhattacharya
14
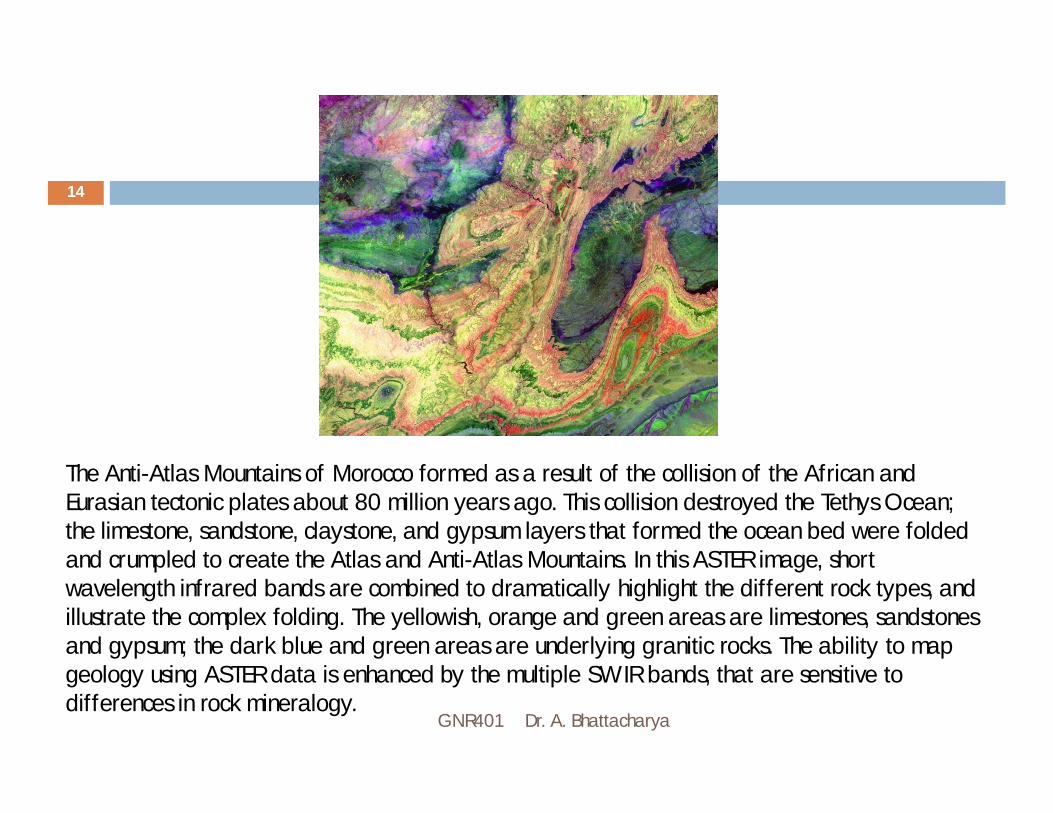
The Anti-Atlas Mountains of Morocco formed as a result of the collision of the African and Eurasian tectonic plates about 80 million years ago. This collision destroyed the Tethys Ocean; the limestone, sandstone, claystone, and gypsum layers that formed the ocean bed were folded and crumpled to create the Atlas and Anti-Atlas Mountains. In this ASTER image, short wavelength infrared bands are combined to dramatically highlight the different rock types, and illustrate the complex folding. The yellowish, orange and green areas are limestones, sandstones and gypsum; the dark blue and green areas are underlying granitic rocks. The ability to map geology using ASTER data is enhanced by the multiple SWIR bands, that are sensitive to differences in rock mineralogy.

Interpretation : Pattern
GNR401 Dr. A. Bhattacharya
15

GNR401 Dr. A. Bhattacharya
16
ASTER image in the German state of North Rhine Westphalia covers an area of 30 by 36 km, and was acquired on August 26, 2000. On the right side of the image are 3 enormous opencast coal mines. The Hambach opencast coal mine has recently been brought to full output capacity

GNR401 Dr. A. Bhattacharya
17
These images from 1986 and 2001 are for an area of tropical dry forest lying east of Santa Cruz de la Sierra, Bolivia. Since the mid-1980s, the resettlement of people from the Altiplano (the Andean high plains) and a large agricultural development effort (the Tierras Baja project) has lead to this area's deforestation. Soybean production began in earnest in the early 1970s following a substantial increase in the crop's world price. The pie or radial patterned fields are part of the San Javier resettlement scheme. At the center of each unit is a small community that includes a church, bar/café, school, and soccer field. The rectangular, light colored areas are fields of soybeans cultivated for export, mostly funded by foreign loans. The dark strips running through the fields are windbreaks, which are advantageous because the soils in this area are fine and prone to wind erosion. Each image covers an area of 17.6 x 35 km. The 1986 Landsat image was acquired on August 4, 1986, and the ASTER image on August 11, 2001. The image is centered at 17.8 degrees south latitude, 63 degrees west longitude.

GNR401 Dr. A. Bhattacharya
18
Santa Cruz de la Sierra, Bolivia

GNR401 Dr. A. Bhattacharya
19This May 19, 2000 sub-scene of the US-Mexico border in California, covers an area of 24 by 30 km. The combination of visible and near infrared bands displays vegetation in red. The border town of Mexicali-Calexico spans the border in the middle of the image; El Centro, California is in the upper left. The dramatic difference in land use patterns between the US and Mexico is highlighted by the lush, regularly gridded agricultural fields of the US, and the more barren fields of Mexico. The Imperial Valley of California is one of the major fruit and vegetable producers for the US, watered by canals fed from the Colorado River. The image is centered at 32.7 degrees north latitude, 115.5 degrees west longitude
Mexicali-Calexico

GNR401 Dr. A. Bhattacharya
20

Interpreting Optical Remote Sensing Images
GNR401 Dr. A. Bhattacharya
21
Four main types of information contained in an optical image are often utilized for image interpretation: Radiometric Information (i.e. brightness, intensity,
tone) Spectral Information (i.e. colour, hue) Textural Information Geometric and Contextual Information.

Interpreting Optical Remote Sensing Images
GNR401 Dr. A. Bhattacharya
22
Panchromatic Images A panchromatic image consists of only one band. It
is usually displayed as a grey scale image, i.e. the displayed brightness of a particular pixel is proportional to the pixel digital number which is related to the intensity of solar radiation reflected by the targets in the pixel and detected by the detector. Thus, a panchromatic image may be similarly interpreted as a black-and-white aerial photograph of the area. The Radiometric Information is the main information type utilized in the interpretation.

SPOT Panchromatic
GNR401 Dr. A. Bhattacharya
23
A panchromatic image extracted from a SPOT panchromatic scene at a ground resolution of 10 m. The ground coverage is about 6.5 km (width) by 5.5 km (height). The urban area at the bottom left and a clearing near the top of the image have high reflected intensity, while the vegetated areas on the right part of the image are generally dark. Roads and blocks of buildings in the urban area are visible. A river flowing through the vegetated area, cutting across the top right corner of the image can be seen. The river appears bright due to sediments while the sea at the bottom edge of the image appears dark.

SPOT Multi-spectral
GNR401 Dr. A. Bhattacharya
24
Multispectral Images A multispectral consists of several bands of
data. For visual display, each band of the image may be displayed one band at a time as a grey scale image, or in combination of three bands at a time as a colour composite image.
Interpretation of a multispectral colourcomposite image will require the knowledge of the spectral reflectance signature of the targets in the scene. In this case, the spectral information content of the image is utilized in the interpretation.
The following three images show the three bands of a multispectral image extracted from a SPOT multispectral scene at a ground resolution of 20 m. The area covered is the same as that shown in the above panchromatic image. Note that both the
XSI (Green) and XS2 (Red) bands look almost identical to the panchromatic image.
In contrast, the vegetated areas now appear bright in the XS3 (Near Infrared) band due to high reflectance of leaves in the near infrared wavelength region. Several shades of grey can be identified for the vegetated areas, corresponding to different types of vegetation. Water mass (both the river and the sea) appear dark in the XS3 (near IR) band.
XS1 (Green)
XS2 (Red)
XS3 (Near IR)

Colour composites
GNR401 Dr. A. Bhattacharya
25
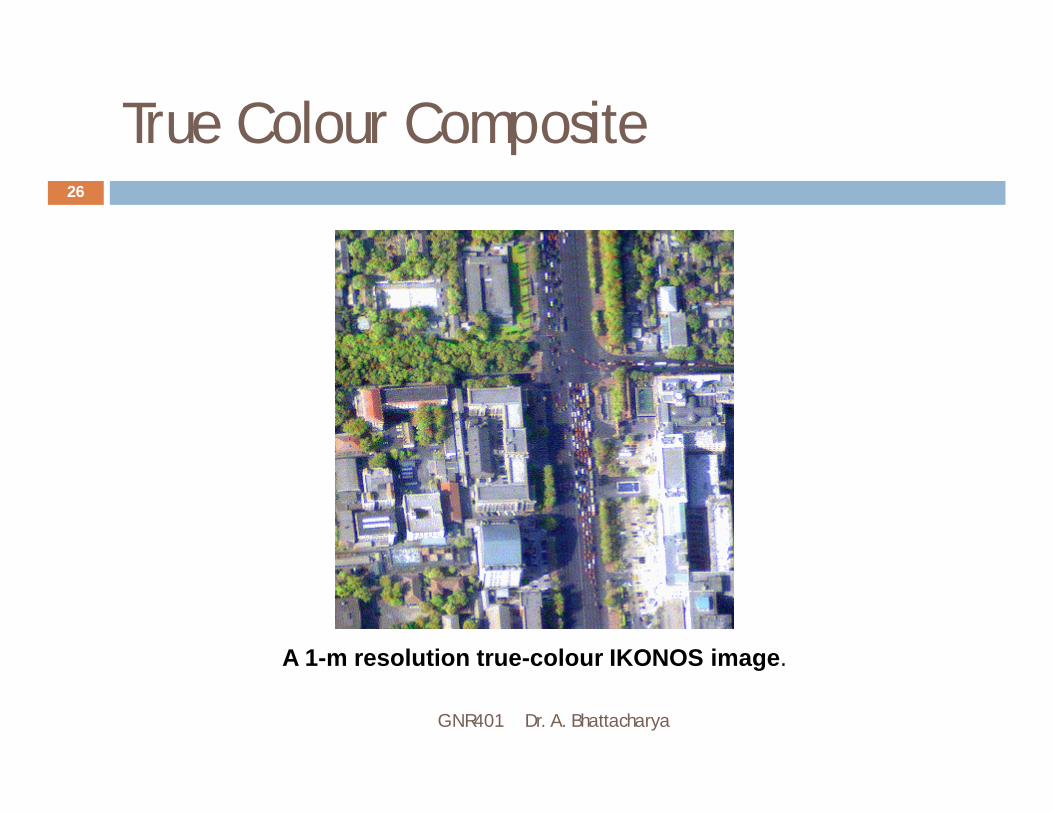
True Colour Composites If a multispectral image consists of the three visual
primary colour bands (Red, Green, Blue), the three bands may be combined to produce a "true colour" image. For example, the bands 3 (red band), 2 (green band) and 1 (blue band) of a Landsat TM image or an IKONOS multispectral image can be assigned respectively to the R, G, and B colours for display. In this way, the colours of the resulting colour composite image resemble closely what would be observed by the human eyes.
True Colour Composite
GNR401 Dr. A. Bhattacharya
26
A 1-m resolution true-colour IKONOS image.

Colour composites
GNR401 Dr. A. Bhattacharya
27
False Colour Composites (FCC) Colour assignment for any band of a multispectral image can be done in an
entirely arbitrary manner. The colour of a target in the displayed image does not have any resemblance to its actual colour. The resulting product is known as a false colour composite image. There are many possible schemes of producing false colour composite images. However, some scheme may be more suitable for detecting certain objects in the image.
A very common false colour composite scheme for displaying a SPOT multispectral image is shown below:
R = XS3 (NIR band)G = XS2 (red band)B = XS1 (green band)
This false colour composite scheme allows vegetation to be detected readily in the image. In this type of false colour composite images, vegetation appears in different shades of red depending on the types and conditions of the vegetation, since it has a high reflectance in the NIR band as in the graph of spectral reflectance signature

False Colour Composite
GNR401 Dr. A. Bhattacharya
28
False colour composite multispectral SPOT image:
Red: XS3; Green: XS2; Blue: XS1
False Colour Composite
GNR401 Dr. A. Bhattacharya
29
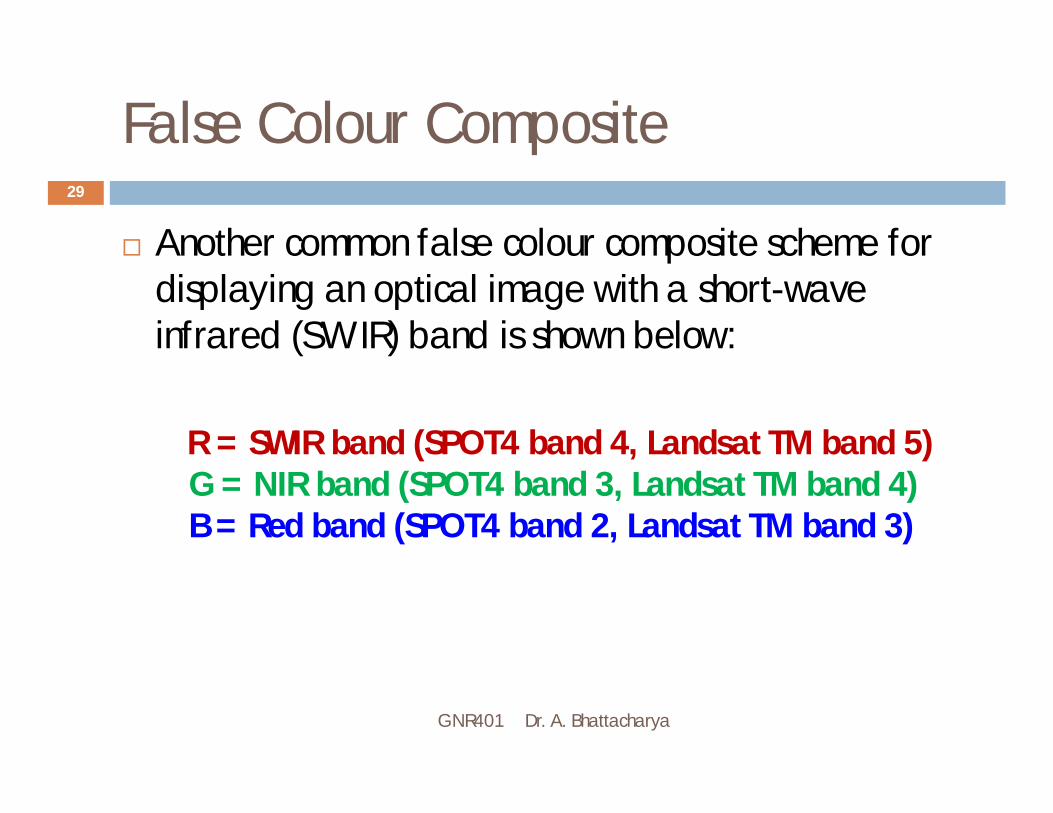
Another common false colour composite scheme for displaying an optical image with a short-wave infrared (SWIR) band is shown below:
R = SWIR band (SPOT4 band 4, Landsat TM band 5)G = NIR band (SPOT4 band 3, Landsat TM band 4)B = Red band (SPOT4 band 2, Landsat TM band 3)
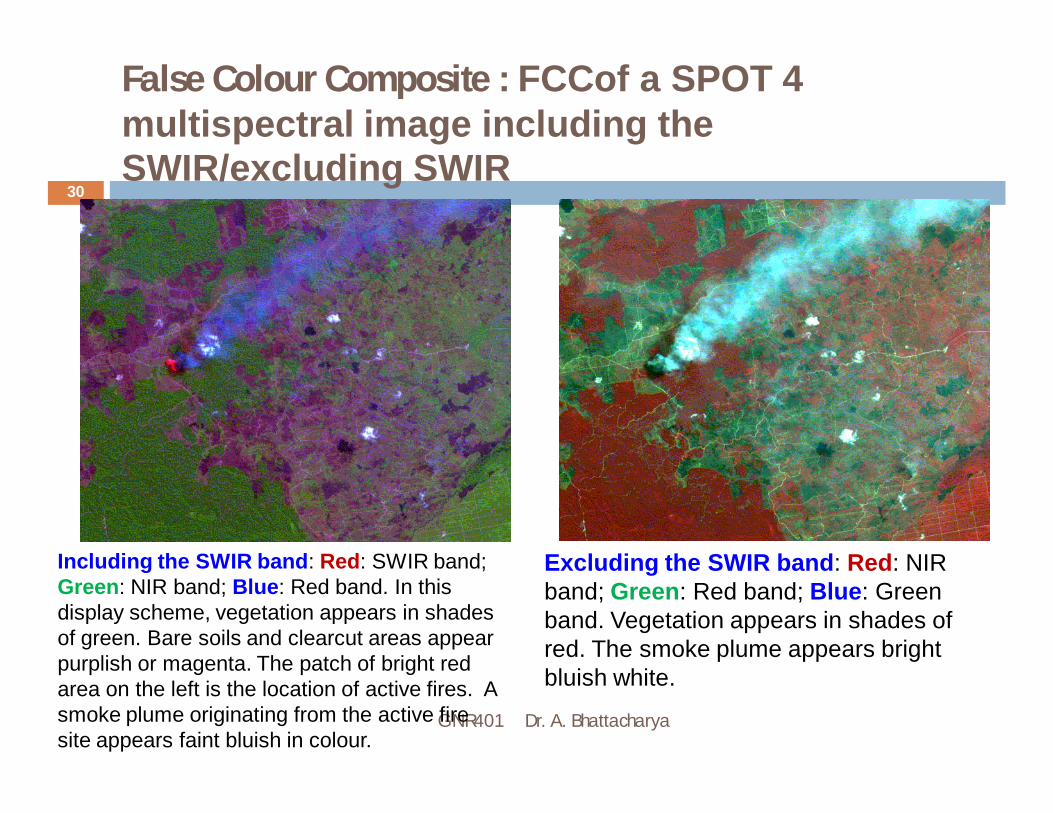
False Colour Composite : FCCof a SPOT 4 multispectral image including the SWIR/excluding SWIR
GNR401 Dr. A. Bhattacharya
30
Including the SWIR band: Red: SWIR band; Green: NIR band; Blue: Red band. In this display scheme, vegetation appears in shades of green. Bare soils and clearcut areas appear purplish or magenta. The patch of bright red area on the left is the location of active fires. A smoke plume originating from the active fire site appears faint bluish in colour.
Excluding the SWIR band: Red: NIR band; Green: Red band; Blue: Green band. Vegetation appears in shades of red. The smoke plume appears bright bluish white.

Natural Colour Composites (NCC)
GNR401 Dr. A. Bhattacharya
31
For optical images lacking one or more of the three visual primary colour bands (i.e. red, green and blue), the spectral bands (some of which may not be in the visible region) may be combined in such a way that the appearance of the displayed image resembles a visible colour photograph, i.e. vegetation in green, water in blue, soil in brown or grey, etc.
Many people refer to this composite as a "true colour" composite. However, this term is misleading since in many instances the colours are only simulated to look similar to the "true" colours of the targets. The term "natural colour" is preferred.

Natural Colour Composites (NCC)
GNR401 Dr. A. Bhattacharya
32
The SPOT HRV multispectral sensor does not have a blue band. The three bands, XS1, XS2 and XS3 correspond to the green, red, and NIR bands respectively. But a reasonably good natural colour composite can be produced by the following combination of the spectral bands:
R = XS2G = (3 XS1 + XS3)/4B = (3 XS1 - XS3)/4

Natural Colour Composites (NCC)
GNR401 Dr. A. Bhattacharya
33
Natural colour composite multispectral SPOT image:Red: XS2
Green: 0.75 XS2 + 0.25 XS3Blue: 0.75 XS2 - 0.25 XS3

Band Ratio
GNR401 Dr. A. Bhattacharya
34
A simple but very useful combination for multispectral imagery is the ratio of one spectral band to another
In an individual spectral band, identical surface materials can have different brightness values from place to place because illumination varies with slope angle, slope direction (aspect), and shadowing by adjacent features

GNR401 Dr. A. Bhattacharya
35

Band Ratio
GNR401 Dr. A. Bhattacharya
36
These illumination effects have about the same magnitude regardless of wavelength, they tend to cancel out when one band is divided by another
A band ratio image therefore emphasizes the inherent properties of the surface materials.
In a grayscale display of a ratio image, the darkest and lightest tones identify areas with the greatest difference in reflectance for the two spectral bands.

Band Ratio
GNR401 Dr. A. Bhattacharya
37
Areas with similar reflectance appear in intermediate gray tones
Different band ratio combinations emphasize particular types of surface materials. The ratio of near-infrared (Landsat TM4) to red (Landsat TM3) is widely used as a vegetation index
Green vegetation exhibits a large and unique difference in reflectance in these two bands, appearing bright in the near-infrared and dark in the red band.

Band Ratio
GNR401 Dr. A. Bhattacharya
38
In a Landsat TM4/Landsat TM3 ratio image the areas with a full plant canopy appear very bright, and the ratio value decreases as the proportion of plant cover to soil background decreases
Using the commonly available multispectral bands, useful ratio values generally range from 0.4 to 15.0.

Band Ratio
GNR401 Dr. A. Bhattacharya
39
Other examples : red (Landsat TM3) / blue (Landsat TM1) Highlight
reddish coloured iron oxides minerals
Infrared red (Landsat TM5) / Middle infrared (Landsat TM7) clay minerals along with the carbonate minerals that makes limestone and dolomite

Normalized Difference Vegetation Index (NDVI)
GNR401 Dr. A. Bhattacharya
40
Simple band ratio images have several disadvantages.
Sensor noise (which is usually specific to particular bands) is accentuated by the ratio calculation
The ratio result includes the fractional values (A /B is less than 1 when A < B) and values greater than1 (for A > B). If these values are scaled to the 8-bit data range (0 to 255) by multiplying by a constant scale factor, the lower range (for A < B) is compressed and the upper range is expanded.

Normalized Difference Vegetation Index (NDVI)
GNR401 Dr. A. Bhattacharya
41
The normalized difference index is a variant form of ratio calculation that alleviates these problems
The difference between corresponding values in two spectral bands (B-A) is “normalized” by dividing by their sum (B+A)
As with a simple band ratio, brightness variations due to topography are largely eliminated. Output values can vary from -1 to +1, so the data range is symmetrical around 0 (B = A).

Normalized Difference Vegetation Index (NDVI)
GNR401 Dr. A. Bhattacharya
42
The Normalized Difference Vegetation Index (NDVI) is a widely used index for green vegetation cover. It assigns the near-infrared channel to B and the red channel to A
Higher values for NDVI (brighter tones) indicate a greater proportion of ground cover by green vegetation.

Normalized Difference Vegetation Index (NDVI)
GNR401 Dr. A. Bhattacharya
43
NDVI is calculated from the visible and near-infrared light reflected by vegetation. Healthy vegetation (left) absorbs most of the visible light that hits it, and reflects a large portion of the near-infrared light. Unhealthy or sparse vegetation (right) reflects more visible light and less near-infrared light. The numbers on the figure above are representative of actual values.
NDVI (SPOT)
GNR401 Dr. A. Bhattacharya
44
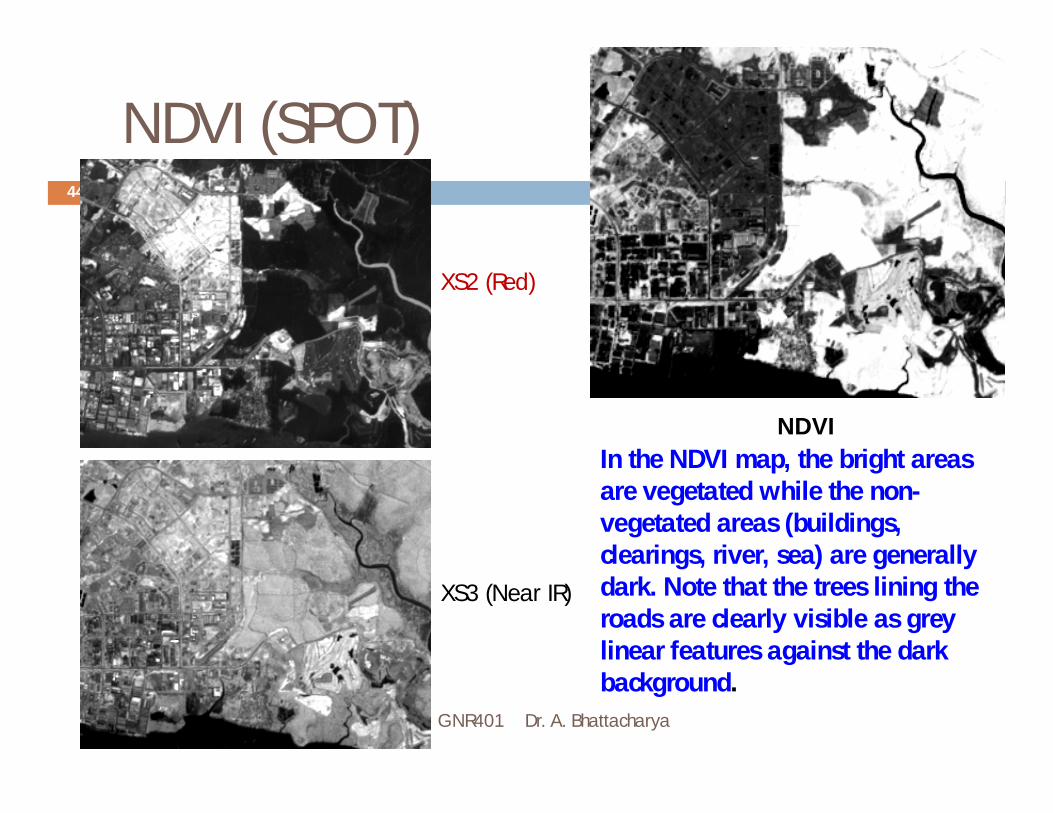
NDVIIn the NDVI map, the bright areas are vegetated while the non-vegetated areas (buildings, clearings, river, sea) are generally dark. Note that the trees lining the roads are clearly visible as grey linear features against the dark background.
XS2 (Red)
XS3 (Near IR)

Color Composite with NDVI
GNR401 Dr. A. Bhattacharya
45
The NDVI band may also be combined with other bands of the multispectral image to form a colour composite image which helps to discriminate different types of vegetation
R = XS3 (Near IR band)G = (XS3 - XS2)/(XS3 + XS2) (NDVI band)B = XS1 (green band)
NDVI Colour Composite of the SPOTRed: XS3; Green: NDVI; Blue: XS1.
At least three types of vegetation can be discriminated in this colour composite image: green, bright yellow and golden yellow areas. The green areas consist of dense trees with closed canopy. The bright yellow areas are covered with shrubs or less dense trees. The golden yellow areas are covered with grass. The non vegetated areas appear in dark blue and magenta.