optimal allocation and sizing of distributed generation ... · the artificial bee colony (abc)...
TRANSCRIPT

International Research Journal of Engineering and Technology (IRJET) e-ISSN: 2395 -0056
Volume: 03 Issue: 02 | Feb-2016 www.irjet.net p-ISSN: 2395-0072
© 2016, IRJET | Impact Factor value: 4.45 | ISO 9001:2008 Certified Journal | Page 1244
Optimal Allocation and Sizing of Distributed Generation using Artificial
Bee Colony Algorithm
Savya Sajeevan1 and N.Padmavathy2 1M.E, PSE (II Year), G.K.M College of Engineering and Technology, Chennai, India
2Assistant Professor, G.K.M College of Engineering and Technology, Chennai, India
---------------------------------------------------------------------------------------------------------------------------------------------------
Abstract-This project presents a new optimization approach that employs an artificial bee colony (ABC) algorithm to determine the optimal DG-unit’s size and location in order to minimize the total system real power loss and improve the voltage profile. The ABC algorithm is a new metaheuristic, population-based optimization technique inspired by the intelligent foraging behavior of the honeybee swarm. To reveal the validity of the ABC algorithm, sample radial distribution feeder systems are examined with different test cases.
Furthermore, the results obtained by the proposed ABC algorithm are compared with those attained via other methods. The outcomes verify that the ABC algorithm is efficient, robust, and capable of handling mixed integer nonlinear optimization problems. The ABC algorithm has only two parameters to be tuned. Therefore, the updating of the two parameters towards the most effective values has a higher likelihood of success than in other competing metaheuristic methods. IEEE 34 bus system is the test system taken for checking the reliability of the proposed algorithm and the results are checked in ETAP 12.6 and MATLAB.
Key words —Artificial bee colony (ABC), distributed generation (DG), metaheuristic optimization algorithm, power losses reduction, voltage profile improvement
1. INTRODUCTION
Utilities are continuously planning the expansion of their electrical networks in order to face the load growth and to properly supply their consumers. The traditional solution is the construction of new substations or the expansion of those already existent. The key objective of any electricity utility company in the current deregulating environment is to maximize the quality of services by providing acceptable level of voltage and reliability, also at the same time reduce the electricity cost for customers with lowering the investment, operation and maintenance costs. These goals together with the rising demands of customers have led to the increased growth of distributed generation (DG).
Distributed Generation (DG) system is defined as an electric power source of limited size (generally few kW to few MW) and connected directly to the distribution level at substation or distribution feeder; or at customer level. DG may employ either renewable or non-renewable energy to produce electricity with minimum emissions. There are many DG technologies including photovoltaic, wind turbine, fuel cells, small and micro-sized turbine packages, internal combustion engine generators, and reciprocating engine generators, several of these have only been developed in the last few decades.
Distribution systems are usually radial in nature
for the operational simplicity. Radial distribution systems (RDSs) are fed at only one point which is the substation. The substation receives power from centralized generating stations through the interconnected transmission network. The end users of electricity receive electrical power from the substation through RDS which is a passive network. Hence, the power flow in RDS is unidirectional. High R/X ratios in distribution lines result in large 0voltage drops, low voltage stabilities and high power losses.
Due to uncertainty of system loads on different feeders, which vary from time to time, the operation and control of distribution systems is more complex particularly in the areas where load density is high. Because of the dynamic nature of loads, total system load is more than its generation capacity that makes relieving of load on the feeders not possible and hence voltage profile of the system will not be improved to the required level. In order to meet required level of load demand, DG units are integrated in distribution network to improve voltage profile, to provide reliable and uninterrupted power supply and also to achieve economic benefits such as minimum power loss, energy efficiency and load leveling. Such embedded generations in a distribution system are called dispersed generations or distributed generations.
Main reasons for the increasingly widespread usage of distributed generation can be summed up as follows
International Research Journal of Engineering and Technology (IRJET) e-ISSN: 2395 -0056
Volume: 03 Issue: 02 | Feb-2016 www.irjet.net p-ISSN: 2395-0072
© 2016, IRJET | Impact Factor value: 4.45 | ISO 9001:2008 Certified Journal | Page 1245
It is easier to find sites for small generators Latest technology has made available plants
ranging in capacities from 10 KW to 15 MW DG units are closer to customers so that
Transmission and Distribution (T&D) costs are ignored or reduced
It reduces the power loss and improves the voltage profile
It provides high reliability and power quality improvement
This project aims at minimizing the total real power
loss in radial distribution system by optimal allocation and sizing of distributed generation (DG) using Artificial Bee Colony Algorithm (ABC). The ABC algorithm is a new metaheuristic, population-based optimization technique inspired by the intelligent foraging behavior of the honeybee swarm. This technique was implemented in IEEE 34 bus radial distribution system for optimal allocation and sizing of distributed generation and the same is recorded in this project.
2. LOAD FLOW STUDY
The objectives of load flow study are:
Power flow analysis is very important in planning stages of new networks or addition to existing ones like adding new generator sites, meeting increased load demand and locating new transmission sites.
The load flow solution gives the nodal voltages and phase angles and hence the power injection.
at all the buses and power flows through interconnecting power channels.
It is helpful in determining the best location as well as optimal capacity of proposed generating station, substation and new lines. System transmission loss minimizes. Economic system operation with respect to fuel cost to generate all the power needed. The line flows can be known which helps in avoiding line overloading.
Step 1) Assume a suitable solution for all buses except slack bus. Assume Vp=1+j0.0 for p= 1, 2….n
Step 2) Convergence criterion is set to ∈ that means if the largest of absolute of the residues exceed ∈ the process repeated else terminated. Step 3) Iteration count is set to K=0 Step 4) Bus count is set to p=1
Step 5) Say p is slack bus .If yes skip to step 10. Step 6) Real and Reactive powers 𝑃𝑝 𝑎𝑛𝑑 𝑄𝑝 are calculated respectively using equations
Step 7) Calculate
. Step 8) Check for bus to be generator bus, if yes compare the reactive power Qp with the upper and lower limits. if 𝑄𝑔𝑒𝑛> 𝑄𝑚𝑎𝑥 set , 𝑄𝑔𝑒𝑛= 𝑄𝑚𝑎𝑥
else if 𝑄𝑔𝑒𝑛< 𝑄𝑚𝑖𝑛 set, 𝑄𝑔𝑒𝑛= 𝑄𝑚𝑖𝑛 else if the value is within the limit ,the value is retained. If the limits are not violated voltage residue is evaluated as
and then go to step 10. Step 9) Evaluate
Step 10) Bus count is incremented by 1, i. e p=p+1 and check if all buses have been accounted else, go to step 5. Step 11) Determine the largest of the absolute value of residue. If the largest of absolute value of the residue is less than ∈ then go to step 16 Step 12) Jacobian matrix elements are evaluated. Step 13) Voltage increments are calculated Step 14) Calculate new bus voltages and phase angle
Step 15) Advance iteration count is K =K+1, then go to step 4
Step 16) Finally bus and line powers are evaluated and results printed.

International Research Journal of Engineering and Technology (IRJET) e-ISSN: 2395 -0056
Volume: 03 Issue: 02 | Feb-2016 www.irjet.net p-ISSN: 2395-0072
© 2016, IRJET | Impact Factor value: 4.45 | ISO 9001:2008 Certified Journal | Page 1246
3. ABC ALGORITHM
The artificial bee colony (ABC) algorithm is a
new meta-heuristic optimization approach, introduced in 2005 by Karaboga. Initially, it was proposed for unconstrained optimization problems. Then, an extended version of the ABC algorithm was offered to handle constrained optimization problems. The ABC algorithm is a new meta-heuristic, population-based optimization technique inspired by the intelligent foraging behavior of the honeybee swarm.
The colony of artificial bees consists of three
groups of bees: employed, onlookers, and scout bees. The employed bees are those which randomly search for food-source positions (solutions.) Then, by dancing, they share the information of that food source, that is., nectar amounts (solutions’ qualities), with the bees waiting in the dance area of the hive. Onlookers are those bees waiting in the hive’s dance area. The duration of a dance is proportional to the nectar content (fitness value) of the food source currently being exploited by the employed bee. Hence, onlooker bees watch various dances before choosing a food source position according to the probability proportional to the quality of that food source. Consequently, a good food-source position (solution) attracts more bees than a bad one. Onlookers and scout bees, once they discover a new food-source position (solution), may change their status to become employed bees. Furthermore, when the food-source position (solution) has been visited (tested) fully, the employed bee associated with it abandons it, and may once more become a scout or onlooker bee.
In a robust search process, exploration and exploitation processes must be carried out simultaneously. In the ABC algorithm, onlookers and employed bees perform the exploration process in the search space; while on the other hand, scouts control the exploration process. Inspired by the aforementioned intelligent foraging behavior of the honey bee, the ABC algorithm was introduced. One half of the colony size of the ABC algorithm represents the number of employed bees, and the second half stands for the number of onlooker bees.
For every food-source’s position, only one
employed bee is assigned. The number of trials for the food source to be called “exhausted” is controlled by the limit value of the ABC algorithm’s parameter. The ABC algorithm creates a randomly distributed initial population of solutions (i=1,2,.....,Eb) , where i signifies the size of population and Eb is the number of employed bees. Each solution xi is a D-dimensional vector, where D is the number of parameters to be optimized.
The position of a food-source, in the ABC algorithm, represents a possible solution to the optimization problem, and the nectar amount of a food source corresponds to the quality (fitness value) of the associated solution. After initialization, the population of the positions (solutions) is subjected to repeated cycles of the search processes for the employed, onlooker, and scout bees (cycle=1,2,...,MCN) , where MCN is the maximum cycle number of the search process.
Then, an employed bee modifies the position
(solution) in her memory depending on the local information (visual information) and tests the nectar amount (fitness value) of the new position (modified solution.) If the nectar amount of the new one is higher than that of the previous one, the bee memorizes the new position and forgets the old one. Otherwise, she keeps the position of the previous one in her memory. After all employed bees have completed the search process; they share the nectar information of the food sources and their position information with the onlooker bees waiting in the dance area. An onlooker bee evaluates the nectar information taken from all employed bees and chooses a food source with a probability related to its nectar amount. The same procedure of position modification and selection criterion used by the employed bees is applied to onlooker bees.
The probability for selecting a food-source pi by
onlooker bees is calculated as follows:
where fitness i is the fitness value of a solution , and Eb is the total number of food-source positions (solutions) or, in other words, half of the colony size. Furthermore, if a solution does not improve for a specified number of times (limit), the employed bee associated with this solution abandons it, and she becomes a scout bee and searches for a new random food-source position. Once the new position is determined, another ABC algorithm cycle (MCN) starts. The same procedures are repeated until the stopping criteria are met.
3.1 Control parameter of ABC Colony Size (CS): It represents the total number
of bees present. One half of the colony size represents the number of employed bees and the second half stands for the number of the onlooker bees.

International Research Journal of Engineering and Technology (IRJET) e-ISSN: 2395 -0056
Volume: 03 Issue: 02 | Feb-2016 www.irjet.net p-ISSN: 2395-0072
© 2016, IRJET | Impact Factor value: 4.45 | ISO 9001:2008 Certified Journal | Page 1247
Limit Value: It represents the number of trials for a food-source position (solution) to be abandoned.
Maximum Cycle Number (MCN): The maximum number of times the search process has to be repeated.
4. FLOW CHART OF ABC ALGORITHM
Fig 1 Flow chart of ABC
5. PROBLEM FORMULATION
The objective function is to minimize the total system real power loss
n = Number of buses. Pi = Real power flows Qi = Reactive power flows Vi = Bus voltage at bus i r = Resistance of line x = Reactance of line
Parameters of ABC Colony size, CS = 20 Limit Value = 100 Maximum Cycle Number =1200
6. STUDY OF TEST SYSTEM
The simulation is done on IEEE 34 bus test system.
Fig 2 . 34 bus test system
Number of
-Buses = 34 -Source = 1 -Loads = 33 Rating of Load = 1568 kW & 743 kVAr Source = 69KV

International Research Journal of Engineering and Technology (IRJET) e-ISSN: 2395 -0056
Volume: 03 Issue: 02 | Feb-2016 www.irjet.net p-ISSN: 2395-0072
© 2016, IRJET | Impact Factor value: 4.45 | ISO 9001:2008 Certified Journal | Page 1248
Table 1. Line data
Table 2. Bus data
BUS ID BUS ID R (Ω) X (Ω)
34 1 0.0013368 0.0013343
1 2 0.0013368 0.0013343
2 3 0.0013368 0.0013343
3 4 0.0027995 0.0014855
3 5 0.0013368 0.0013343
5 6 0.0013368 0.0013343
6 7 0.00193 0.0014115
7 8 0.00193 0.0014115
8 9 0.0027995 0.0014855
8 10 0.00193 0.0014115
9 11 0.0027995 0.0014855
10 12 0.00193 0.0014115
10 13 0.0027995 0.0014855
11 14 0.0027995 0.0014855
12 15 0.00193 0.0014115
15 16 0.00193 0.0014115
16 17 0.00193 0.0014115
16 18 0.0027995 0.0014855
17 19 0.00193 0.0014115
19 20 0.003064467 0.006580539
19 21 0.00193 0.0014115
20 22 0.0013368 0.0013343
21 23 0.00193 0.0014115
21 24 0.0027995 0.0014855
23 25 0.00193 0.0014115
23 26 0.00193 0.0014115
25 27 0.00193 0.0014115
26 28 0.00193 0.0014115
27 29 0.00193 0.0014115
27 30 0.00193 0.0014115
28 31 0.00193 0.0014115
29 32 0.0019217 0.0014212
31 33 0.00193 0.0014115
Sl.NO BUS ID P load (KW)
Q load (KW)
1 1 45 21.794
2 2 44 23.749
3 3 13.35 6.84
4 4 19 6.45
5 8 4.181 1.665
6 9 22.606 11.581
7 11 89.76 48.447
8 14 67.044 34.718
9 10 33.226 16.28
10 13 22.835 11.572
11 12 16.38 7.463
12 15 49.41 21.786
13 16 4.5 2.18
15 18 22.361 11.18
16 19 7.44 2.327
18 22 1.549 0.84
19 21 16.02 8.207
20 24 1.8 0.87
21 23 96.707 24.238
22 26 61.6 33.247
23 28 398 200
24 31 26.841 13.4
25 33 250 0
26 25 128 78.041
27 27 0.005 300
28 29 13.455 6.63
29 32 12.516 6.273
30 30 19.981 9.902
International Research Journal of Engineering and Technology (IRJET) e-ISSN: 2395 -0056
Volume: 03 Issue: 02 | Feb-2016 www.irjet.net p-ISSN: 2395-0072
© 2016, IRJET | Impact Factor value: 4.45 | ISO 9001:2008 Certified Journal | Page 1249
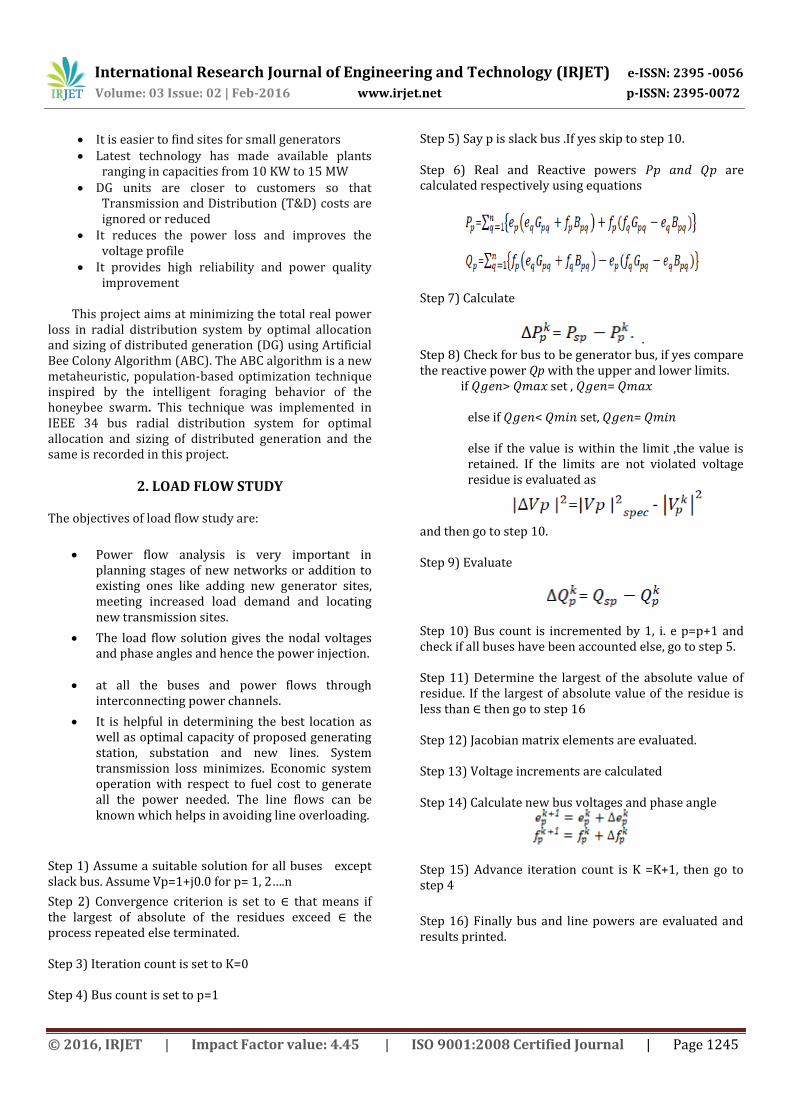
7. MATLAB RESULT
The Coding is done for 34 bus test system and the size and location of the DG units are found out.
DG1 connected to BUS 28 DG2 Connected to Bus 5 Real Power Loss = 0.00013 MW Reactive Power Loss = 0.00011MVar DG Size1= 0.700000MW DG Size2 = 0.100000MW
Table 3 MATLAB Result
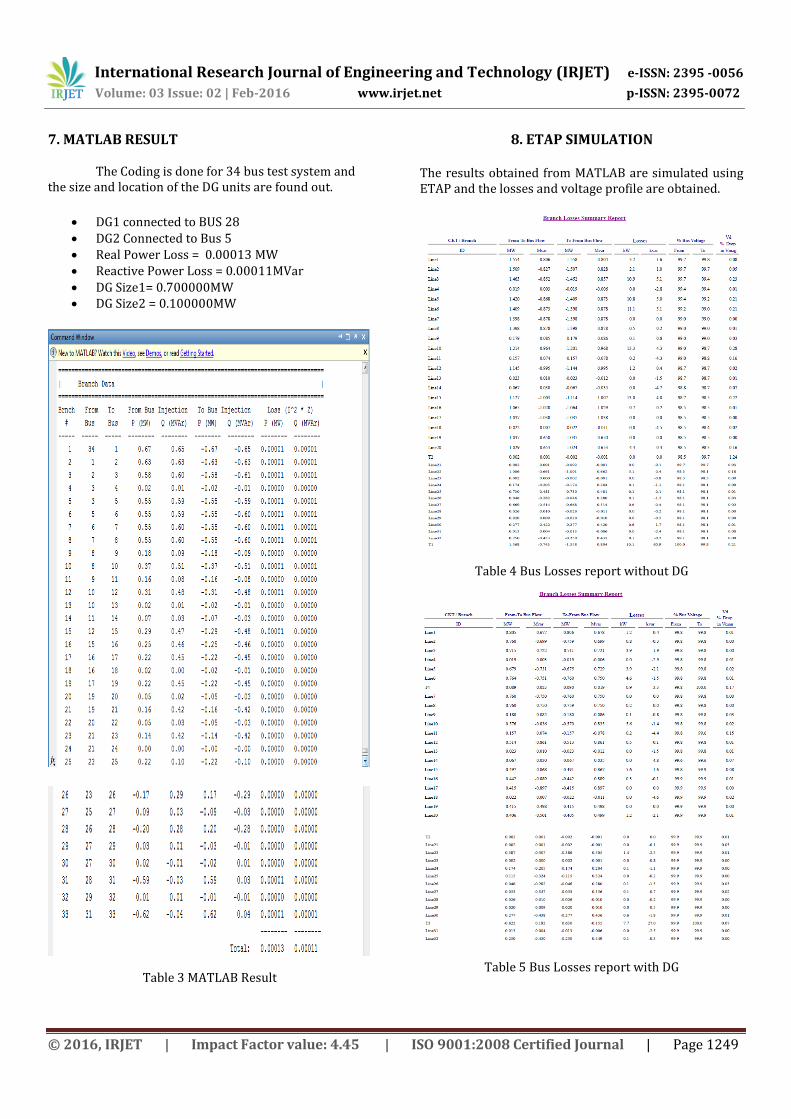
8. ETAP SIMULATION The results obtained from MATLAB are simulated using ETAP and the losses and voltage profile are obtained.
Table 4 Bus Losses report without DG
Table 5 Bus Losses report with DG

International Research Journal of Engineering and Technology (IRJET) e-ISSN: 2395 -0056
Volume: 03 Issue: 02 | Feb-2016 www.irjet.net p-ISSN: 2395-0072
© 2016, IRJET | Impact Factor value: 4.45 | ISO 9001:2008 Certified Journal | Page 1250
9. RESULTS AND DISCUSSIONS
Bus No
Voltage Profile in Normal Condition
Voltage Profile After Adding DG
1 99.7 99.8
3 99.43 99.8
5 99.21 99.81
7 99 99.8
9 98.71 99.79
11 98.71 99.63
13 98.47 99.83
15 98.45 99.92
17 98.44 99.93
18 98.36 99.91
19 98.7 99.93
20 98.3 99.92
21 98.3 99.92
22 99.67 99.89
23 98.72 99.91
24 98.3 99.92
25 98.12 99.91
27 98.14 99.93
28 98.09 99.93
29 98.14 99.93
31 98.14 99
33 97 99.94
Table 6 Voltage profile before and after placement of DG
Chart 1. Schematic comparison of voltage profile
Table 7 Power loss before and after placement of DG
Chart 2. Schematic comparison of power loss
Bus No Power loss in Normal Condition
Power loss After Adding
DG
1 3.2 1.2
2 2.1 0.8
3 10.9 3.9
5 10.8 3.9
6 11.1 4.6
8 0.5 0.2
10 13.3 5.6
12 1.2 0.5
15 13.0 5.6
16 0.7 0.3
20 4.4 1.2
22 5.1 0.4
23 0.0 0.0
24 0.1 0.1
25 0.1 0.0
26 0.1 0.1
27 0.6 0.1
28 0.0 0.0
29 0.0 0.0
30 0.6 0.6
31 0.0 0.0
32 0.1 0.1

International Research Journal of Engineering and Technology (IRJET) e-ISSN: 2395 -0056
Volume: 03 Issue: 02 | Feb-2016 www.irjet.net p-ISSN: 2395-0072
© 2016, IRJET | Impact Factor value: 4.45 | ISO 9001:2008 Certified Journal | Page 1251
Table 8 Comparison of total power loss
Chart 3 Schematic Comparison of total power loss
10. CONCLUSION
The DG is placed in the distribution system using Artificial Bee Colony Algorithm. The voltage profile of the system is improved and the real power losses are reduced. The result is verified using two software ETAP 12.6.0 and Matlab. ETAP is a real time software, hence the losses are more as it includes the losses of transformers and the equipments connected to the distribution system.
REFERENCE [1] A. D. T. Le, M. A. Kashem, M. Negnevitsky, and G.
Ledwich, (2007) “Optimal distributed generation parameters for reducing losses with economic consideration,” in Proc. IEEE Power Eng. Soc. Gen. Meeting, pp. 1–8.
[2] A. D. T. le, M. A. Kashem, M. Negnevitsky, and G.
Ledwich, (2005) “Maximising voltage support in distribution systems by distributed generation,” in Proc. IEEE TENCON Conf., pp. 1–6.
[3] Ahmed Al Ameri and Cristian Nichita,(2015)
“Fast Estimation Method for Selection of Optimal Distributed Generation Size Using Kalman Filter and Graph Theory”, International Conference on Modelling and Simulation
[4] B. A. de Souza and J. M. C. de
Albuquerque,(2006) “Optimal placement of distributed generators networks using evolutionary programming,” in Proc. Transm. Distrib. Conf. Expo.: Latin Amer., pp. 1–6.
[5] B. Basturk and D. Karaboga,(2006) “An artificial
bee colony (ABC) algorithm for numeric function optimization,” in Proc. IEEE Swarm Intell. Symp., Indianapolis, IN, May 12–14
[6] C. L. T. Borges and D. M. Falcao,(2003) “Impact
of distributed generation allocation and sizing on reliability, losses and voltage profile,” in Proc. IEEE Power Tech Conf., Bologna, Italy, vol. 2, pp. 1–5.
[7] D. Karaboga and B. Basturk, (2007) “Artificial
Bee Colony (ABC) Optimization Algorithm for Solving Constrained Optimization Problems”. Berlin, Germany: Springer-Verlag, vol. LNAI 4529, pp. 789–798.
[8] D. Ranamuka, A. P. Agalgaonkar, and K. M.
Muttaqi,(2014) Online Voltage Control in Distribution Systems With Multiple Voltage Regulating Devices” 4 IEEE transactions on sustainable energy, vol. 5, no. 2, april
[9] F. S. Abu-Mouti and M. E. El-Hawary, (2007) “A
new and fast power flow solution algorithm for radial distribution feeders including distributed generations,” in Proc. IEEE Int. Conf. Syst., Man, Cybern., pp. 2668–2673.
[10] J.J. Jamian, M.M. Aman, M.W. Mustafa and G.B.
Jasmon,(2015) Optimum Multi DG units Placement and Sizing Based on Voltage Stability Index and PSO”, IEEE transctions
, [11] M. A. Kashem, A. D. T. Le, M. Negnevitsky, and G.
Ledwich,(2006) “Distributed generation for minimization of power losses in distribution systems,” in Proc. IEEE Power Eng. Soc. Gen. Meetin, pp. 1–8.
[12] M.Jegadeesan 1, V.Keerthana (2014)“Optimal
Sizing and Placement of Distributed Generation in Radial Distribution Feeder Using Analytical Approach”, International Journal of Innovative Research in Science, Engineering and Technology, March 2014
[13] M. Mardaneh and G. B. Gharehpetian, (2004)
“Siting and sizing of DG units using GA and OPF
Real power loss (KW)
Reactive power loss (KVar)
Before placement of DG
88.5 61.0
After Placement of DG
42.7 9.5
International Research Journal of Engineering and Technology (IRJET) e-ISSN: 2395 -0056
Volume: 03 Issue: 02 | Feb-2016 www.irjet.net p-ISSN: 2395-0072
© 2016, IRJET | Impact Factor value: 4.45 | ISO 9001:2008 Certified Journal | Page 1252
based technique,” in Proc. IEEE Region 10 TENCON Conf., Nov. 21–24, vol. 3, pp. 331–334.
[14] Mahdi El-Arini and Ahmed Fathy, (2015)“An
Efficient and reliable method for optimal allocating of the distributed generation based on optimal teaching learning algorithm” WSEAS transactions on power system, Volume 10.
[15] Partha Kayal* and Chandan Kumar Chanda (2013)”A simple and fast approach for allocation and size evaluation of distributed generation”, International Journal of Energy and environmental Engineering, 2013
[16] V. Veera Nagireddy, D. V. Ashok Kumar, K.
Venkata Reddy (2014) “Optimal Placement and Sizing of Multiple Distributed Generation using Combined Differential Evaluation - HPSO Method” International Journal of Engineering and Advanced Technology, ISSN: 2249 – 8958, Volume-4 Issue-1, October
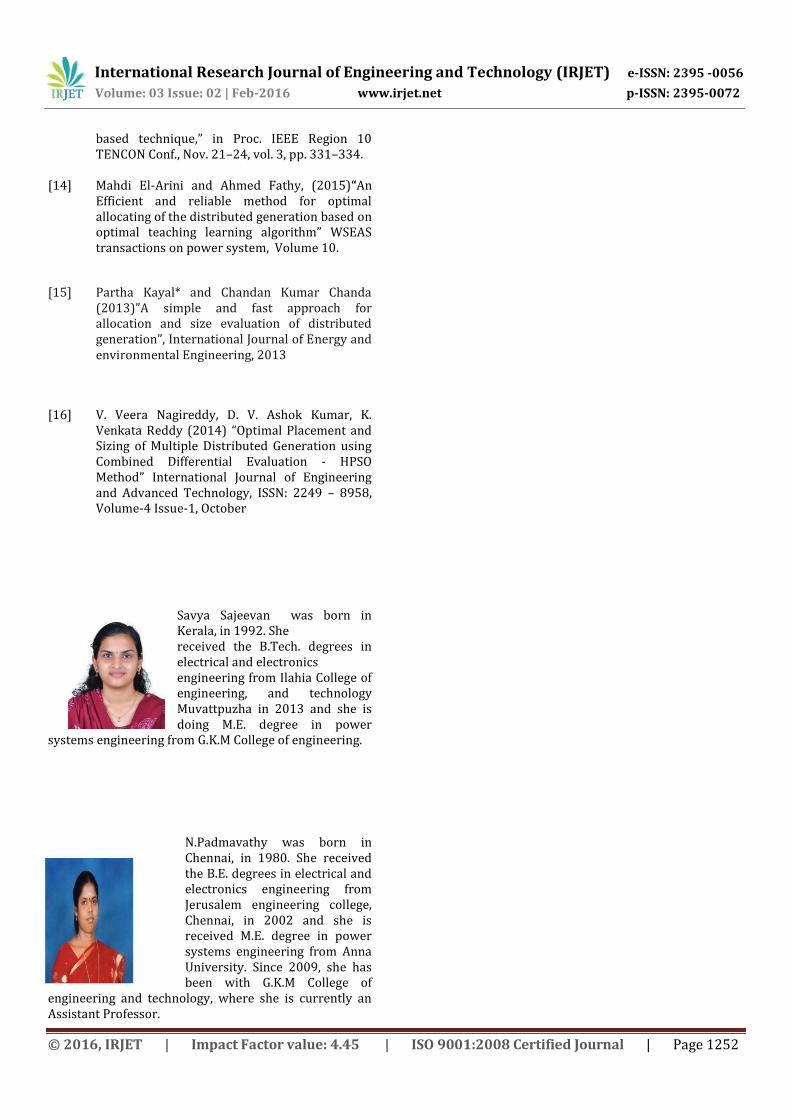
Savya Sajeevan was born in Kerala, in 1992. She received the B.Tech. degrees in electrical and electronics engineering from Ilahia College of engineering, and technology Muvattpuzha in 2013 and she is doing M.E. degree in power
systems engineering from G.K.M College of engineering.
N.Padmavathy was born in Chennai, in 1980. She received the B.E. degrees in electrical and electronics engineering from Jerusalem engineering college, Chennai, in 2002 and she is received M.E. degree in power systems engineering from Anna University. Since 2009, she has been with G.K.M College of
engineering and technology, where she is currently an Assistant Professor.