optimal egg incubation temperature, and the effects of
TRANSCRIPT

Optimal egg incubation temperature, and the effects of diet on growth of hatchling Eastern
Indigo snakes (Drymarchon couperi) during a captive head-start program
by
Michael Patrick Wines
A thesis submitted to the Graduate Faculty of
Auburn University
in partial fulfillment of the
requirements for the Degree of
Master of Science
Auburn, Alabama
Keywords: Drymarchon couperi, egg incubation temperature, diet diversity
Copyright 2014
Approved by
Craig Guyer, Professor of Biology
Michael Wooten, Assistant Chair, Professor of Biology
Debbie Folkerts, Assistant Professor of Biology

ABSTRACT
Optimal husbandry techniques are desirable for any headstart program, but frequently are
unknown for rare species. In this thesis I determine the optimal incubation temperature and
optimal diet diversity for eastern indigo snakes (Drymarchon couperi) grown in a laboratory
setting. Optimal incubation temperature was estimated by determining the relationships between
temperature and two variables dependent on temperature: shell dimpling, a surrogate for death
from fungal infection; and deviation of an egg from an ovoid shape, a surrogate for death from
developmental anomalies. Based on these relationships I determined the optimal incubation
temperature to be 25 °C for D. couperi eggs. Additionally, I used incubation data to assess the
effect of temperature on duration of incubation and size of hatchlings. Because Drymarchon
couperi has few relevant data describing hatchling diets necessary to achieve optimal growth, I
examined growth rates of captive snakes fed known diets. Feeding data were examined over a
two-year period for 130 hatchling Drymarchon couperi. These snakes exhibited a negative linear
relationship between total mass eaten and growth rate when fed less than 1711 g over their first
21 months and displayed constant growth for individuals exceeding 1711 g over that time period.
Similarly, growth rate increased linearly with increasing diet diversity up to a moderately diverse
diet, followed by constant growth for higher levels of diet diversity. Of the two components of
diet diversity, number of genera consumed, and evenness of diet items consumed, diet evenness
played the stronger role in explaining variance in hatchling growth. These patterns document that
my goal of satiating the snakes was achieved for some individuals but not others and that diets in

iii
which total grams consumed is distributed equivalently among the genera that a snake is willing
to consume yields the fastest growth rates for that individual.

iv
ACKNOWLEDGMENTS
I consider myself lucky to have attended Auburn University for graduate school. I need to
thank my advisor, Craig Guyer, for his guidance, support, generosity, and unending patience. I
appreciate Debbie Folkerts and Mike Wooten’s help on my committee. Jim Godwin (and the
Natural Heritage Program) gave me the job that led to graduate school. He taught me all about
field work in the process. Marie Rush and Val Johnson did a heck of a job with those
cantankerous little snakes. Each one of my lab mates has taught me volumes. They also helped
with this thesis. Here is a list of those saintly people in no particular order: C. Romagosa, J.
Deitloff, S. Graham, D. Steen, S. Goetz, M. Miller, J. (Pabstquatch) Stiles, S. Stiles, B. Folt, C.
Murray, J. Chivers, J. Goessling, and D. Laurencio. There are also some honorary lab mates that
helped. They are: D. Alix, L. Dombro, J. Jenkins, H. Tripp, C. Sanspree, L. Adams, and E.
Wheeler. I want to thank a few other fine Auburn professors that helped along the way: Bob
Gitzen, John Roberts, and Sharon Hermann. I also need to thank Brad Lock from Zoo Atlanta
(and his crew) as well as Fred Antonio of the Orianne Society (and his crew) for their data
collection and excellent snake care and advice. Dirk Stevenson caught all our snakes’ mamas and
wrote the paper I referenced many times while writing this thesis.
I also need to thank the organizations that contributed to the project: U.S. Fish and
Wildlife, The Alabama Natural Heritage Program, Alabama Department of Conservation and
Natural Resources, Georgia Department of Natural Resources, Zoo Atlanta, The Orianne
Society, and the U.S. Forest Service.

v
TABLE OF CONTENTS
Abstract ......................................................................................................................................... ii
Acknowledgments........................................................................................................................ iv
List of Tables ............................................................................................................................... vi
Chapter 1 ..................................................................................................................................... 1
Chapter 2 ..................................................................................................................................... 4
Legend Chapter 2 ........................................................................................................................ 10
Chapter 3 ................................................................................................................................... 15
Legend Chapter 3 ........................................................................................................................ 23
Chapter 4 ……………………………………………………………………………………….28
Cumulative Literature Cited ..................................................................................................... 29

vi
LIST OF FIGURES
Figure 1 ....................................................................................................................................... 12
Figure 2 ....................................................................................................................................... 12
Figure 3 ....................................................................................................................................... 13
Figure 4 ...................................................................................................................................... 14
Figure 5 ...................................................................................................................................... 25
Figure 6 ...................................................................................................................................... 25
Figure 7 ...................................................................................................................................... 26
Figure 8 ....................................................................................................................................... 26
Figure 9 ....................................................................................................................................... 27
Figure 10 ..................................................................................................................................... 27

CHAPTER I
INTRODUCTION
Species reintroductions are becoming an important and common tool in the management
and conservation of imperiled wildlife (Fischer and Lindenmayer 2000; Bell et al. 2005;
Kingsbury and Attum 2009; Stiles et al. 2013). There is some controversy as to whether
reintroduction plans are worth the effort, with some stating that in situ conservation is the most
effective strategy and non-governmental supported strategies are ineffective (Pedrono 2011).
Others note that ex situ conservation may be effective as a method of last resort (Rahbek 1993).
In a study by Fischer and Lindenmayer, 27% of reintroduction programs failed, while 47% of
reintroduction programs had no published results. Only 26% of reintroduction programs were
deemed successful, which leads to questioning of the methods involved (Fischer and
Lindenmayer 2000; Bell et al. 2005). Clearly, reintroduction programs need to be effectively
designed and managed with the goal to learn rapidly from mistakes (Clark and Westrum 1989).
Many reintroduction plans include a headstart program. The goal of such programs is to
raise individuals to an appropriate size for best survival upon release (Kingsbury and Attum
2009). There is often scant husbandry information published for imperiled species. Husbandry
methods may not be the same for closely related species. For example, several endangered black
footed ferrets died soon after receiving canine distemper vaccinations that had no lethal effects
on closely related species (Carpenter et al. 1976).
The eastern indigo snake (Drymarchon couperi) was listed as Threatened by the U.S.
Fish and Wildlife Service in 1978. A recovery plan was approved in 1982 (USFWS 1982). While
the recovery plan was being generated, a captive propagation program was established by Dr.

2
Dan Speake within the Alabama Cooperative Wildlife Research Unit at Auburn University. This
project ran from 1976 to 1987 and its major objective was to restock areas from which the snake
was extirpated as well as supplement existing populations (Speake et al. 1987). 318 snakes were
released in 20 locations over a ten-year period, with 9 release sites in Alabama (Speake et al.
1987).
Starting in 2006 and concluding in 2008 the Alabama Department of Conservation and
Natural Resources (ADCNR) and Auburn University performed a two-year feasibility study with
support from a State Wildlife Grant. A major goal of this project was to determine whether any
populations existed in the state, especially at the release sites from the previous project. The
search found no evidence of D. couperi in Alabama. The evidence of extirpation of this species
from Alabama led to a new reintroduction project for the eastern indigo snake that is the focus of
this thesis.
A reintroduction plan is a type of repatriation specifically replacing a species to an area
from which it has been extirpated. Typically, such plans follow eight steps: 1) establish goals for
success; 2) establish release site; 3) identify appropriate release life stage; 4) identify source
population; 5) obtain transplants; 6) release transplants; 7) sustain the effort; 8). monitor the site
(Kingsbury and Attum 2009). In the specific case of D. couperi establishment of a reproducing
population at a repatriation site was the primary goal and the Conecuh National Forest in
Alabama was selected as the release site. Many partners joined in supportive effort to reach this
goal, including the Alabama Department of Conservation and Natural Resources, Auburn
University Environmental Institute, Auburn University College of Science and Mathematics, The
Orianne Society, Zoo Atlanta, U. S. Fish and Wildlife Service, and the Georgia Department of
Natural Resources.

3
The appropriate life stage for release was determined as approximately 21 months of age
because those individuals were of sufficient size to surgically implant radio transmitters for
monitoring at the release site and could be released during spring, allowing a complete season of
activity for these snakes to establish home ranges. Until that age the snakes were to be
headstarted, with the goal of achieving maximum hatching success and growth, features that
should improve the overall success of the project and minimize project costs.
The source populations chosen were stable populations in Georgia. Gravid females from
these populations were to be brought to Auburn University for oviposition. Once oviposition
occurred, the females were to be returned to the sites from which they were caught. The eggs
were then to be incubated and hatched, with hatchlings being raised in captivity until they
reached an acceptable size for release. Preliminary demographic models suggested that 300
snakes released in this fashion would be sufficient to establish a reproductive population.
This thesis focuses on egg incubation, hatching, and care of the snakes prior to release.
Several head-start programs for snakes have been implemented with varying success (Kingsbury
and Attum 2009). Though D. couperi was part of previous reintroduction plan, little published
data exists on the optimal care for the species in captivity. Therefore, I address the following
questions in an attempt to fill in the unknown gaps of husbandry knowledge: 1) What is the
optimal incubation temperature for D. couperi eggs? 2) Does diet diversity have an effect on the
growth of captive eastern indigo snakes?

4
CHAPTER II
Optimal incubation temperature for Drymarchon couperi eggs
ABSTRACT
Accumulated data were used to estimate the optimal incubation temperature of Eastern
Indigo Snake eggs. By determining the relationships between temperature and two variables
dependent on temperature, (shell dimpling, a surrogate for death from fungal infection, and
deviation of an egg from an ovoid shape, a surrogate for death from developmental anomalies), I
determined the optimal incubation temperature to be 25 °C for D. couperi eggs. Additionally, I
used these data to estimate expected incubation duration (97 d) and hatchling size (40 g).
INTRODUCTION
Eastern Indigo Snakes (Drymarchon couperi) historically ranged throughout Florida, into
southern Georgia and Alabama (Godwin 2011). The last documented occurrence in Alabama
was in 1954 (Neill 1954). Already a rare snake, D. couperi disappeared from Alabama due to
habitat fragmentation and loss, which resulted from fire suppression on managed lands and
conversion of forested lands to agriculture and urban uses (Hart 2002, Guyer and Bailey 1993).
Other factors leading to extirpation from Alabama included excessive collecting for the pet
industry, gassing of Gopher Tortoise burrows, and vehicular mortalities (Hart 2002). Because
similar problems were observed throughout the geographic range of D. couperi, this species was
federally listed as Threatened in 1978 under the Endangered Species Act (US Fish and Wildlife
Service 1982). As part of the recovery program for this species, the Conecuh National Forest in
Alabama was selected as a site to demonstrate the feasibility of using headstarted animals to
repopulate an area with these snakes.

5
If headstarting is to be an effective part of conservation efforts for D. couperi, knowledge
of proper husbandry of eggs and hatchlings will be required. Much information about husbandry
is well known within the community of herpetologists who raise indigo snakes, but many key
features of husbandry have not been subjected to statistical analysis. One key husbandry variable
is incubation temperature. Temperature is known to affect reptile eggs in many ways including
altering the duration of incubation, body size at hatching, post-incubation survival (Van Damme
et al. 1992), and hatchling behavior (Burger 1990). Hatching success is strongly influenced by
temperature during incubation (Köhler et al. 2005). For example, all Chinese softshell turtle eggs
(Pelodiscus sinensis) can survive and hatch when incubated between temperatures 23 and 34°C.
All embryos die below 18 and above 37°C. Within this range of temperatures 28°C is optimal
because this temperature minimizes death from fungal infections associated with cooler
temperatures and late-stage mortality associated with higher temperatures (Choo et al. 1987 and
Köhler et al. 2005). Similar patterns of mortality, leading to an optimal incubation temperature
are expected of other egg-laying reptiles.
Here, I use accumulated data to estimate the optimal incubation temperature of Eastern
Indigo Snake eggs. This is done by determining the relationships between temperature and two
variables dependent on temperature: shell dimpling, a surrogate for death from fungal infection,
and deviation of an egg from an ovoid shape (Figure 1), a surrogate for death from
developmental anomalies. The interaction of these factors is used to determine optimal
incubation temperature for D. couperi eggs. Additionally, I use these data to assess the effect of
incubation temperature on incubation duration and hatchling size.
METHODS

6
Twenty-two adult, gravid, female eastern indigo snakes were caught over a four-year
period (2008-2011) on private and public lands in southeastern Georgia. The snakes were
captured during early January to late March, when males seek mating opportunities and females
bask at the entrances of gopher tortoise burrows that are used as winter refugia (Hyslop et al.
2014). Females were then transported to a live animal facility at Auburn University where they
were retained until they laid eggs within nest boxes containing a substrate of sand and sphagnum
moss. Once the eggs were laid the adult females were returned to their point of capture and
released.
Freshly laid eggs were rinsed with water, individually measured [weight (nearest 0.1 g),
length (nearest mm), and width (nearest mm)], marked for identification (pencil) and placed in
an incubator. Each incubator contained an individual clutch. The incubators consisted of plastic
tubs measuring 30 cm long, 20 cm wide, and 20 cm deep, placed on heat tape that was controlled
by a thermostat placed inside each tub. The thermostat was set to turn on when the temperature
of the tub’s interior reached 24 °C and to turn off when the interior temperature reached 26 °C.
The tubs were lined with cotton cloth that was soaked in water and squeezed until damp. Eggs
were placed on a bottom layer of cloth and were covered with a top layer of damp cloth lining
the lid. This maintained a high constant humidity within and among clutches. Once daily, each
incubator was opened, the cotton cloth was pulled back, and clutch temperature (measured with
an infrared thermometer) was recorded from the surface of the eggs. These temperatures were
used to characterize the temperatures experienced by each clutch, which differed from the
setpoints used by the thermistor to regulate heat.

7
Each egg in each clutch was inspected daily and two shape variables were recorded. Shell
shape was categorized as either dimpled (distinct concavity of shell; Figure 1B) or smooth (shell
smooth, lacking depressions; Figure 1A). Egg shape was categorized as either distended (distinct
ventral outpocketing of shell; Figure 1C) or undistended (shell ovoid in shape; Figure 1A).
Pipping date was recorded for each egg and indicated the end of incubation. At hatching each
snake was measured for total length (nearest mm) and mass (nearest 0.1 g).
Ordinary least squares regression was used to examine the effect of clutch temperature
(independent variable) on duration of incubation and size at hatching (dependent variables).
Logistic regression was used to examine the relationship between clutch temperature
(independent variable) and either shell shape or egg shape (dependent variables). Based on
information in Köhler et al. (2005), shell shape was expected to be negatively correlated with
temperature and egg shape deviation was expected to be positively associated with temperature.
The intersection of these logistic regressions was used to infer the optimal incubation
temperature.
RESULTS AND DISCUSSION
Twenty-one clutches with a total of 181 eggs were laid. From these, 155 snakes were
hatched. A total of 78 to 141 days elapsed between clutch deposition and hatching. Temperature
during this time period ranged from 20.6 to 27.8 °C and the mean duration of incubation within a
clutch was strongly correlated with mean clutch temperature (Figure 2). My data expand the
range of known incubation times and the majority of incubation times were longer than the 90-
100 days listed by AZA Snake TAG (2011) as being typical of Eastern Indigo Snakes.

8
Additionally, the regression characterizing the relationship between mean incubation temperature
and incubation time predicted much faster mean incubation times (80-90 days) if eggs are
incubated at the 25.5-26.6 °C temperatures listed by AZA Snake TAG (2011). Therefore, either
the regression that I report is specific to conditions at Auburn, or that regression improves our
ability to determine expected incubation times beyond the general values presented by the AZA
document. Given that effects of temperature on physiological reactions are relatively constant for
ectotherms, regardless of physical setting, I infer that my results provide improved predictors of
incubation duration.
Hatchling snakes ranged from 320 to 582 mm in total length and 22.5 to 70.1 g. These
values are consistent with the 432-610 mm values reported by AZA Snake TAG (2011) for
hatchlings. Mean body mass of hatchlings did not correlate with mean clutch temperature during
incubation (Figure 3). Studies of other reptiles typically find a smaller hatchling mass for eggs
incubated at higher temperatures (e.g. Van Damme et al. 1992). However, my data suggest no
such effect and, therefore, no consequence of incubation duration or temperature on hatchling
fitness for traits associated with size at birth. Therefore, the mean hatchling size of 465 mm total
length and 42.4 g serve as expected hatchling size regardless of incubation temperature.
Temperature had a positive logistic correlation with shell shape and a negative logistic
correlation with egg shape (Figure 4). The optimal mean temperature for incubation of Eastern
Indigo Snake eggs, indicated by the crossing of these two regressions, was 25 °C. This
temperature falls slightly below the incubation temperatures recommended by AZA Snake TAG
(2011). But, my regression of incubation duration on mean clutch temperature predicts an
incubation duration of 97 days, a value within the typical range identified by AZA Snake Tag
(2011).
9
Recent phylogenetic studies place Drymarchon in close phylogenetic proximity to
Coluber (Pyron et al. 2013, Conant et al. 1998), a genus for which information on optimal clutch
temperature and duration of incubation are comparatively well studied. Optimal incubation
temperature for Eastern Coachwhips (Coluber flagellum) ranges from 25-30°C (Köhler et al.
2005), a range centered on temperatures that are warmer than that for Drymarchon couperi, and
incubation duration is 43-79 days in C. flagellum (Köhler et al. 2005, Wright and Wright 1957),
a much shorter duration than observed for Drymarchon. Thus, Eastern Indigo Snakes appear to
require cooler nest temperatures than Coluber, and require longer incubation periods because of
those cooler nests. Because Eastern Indigo Snakes lay eggs earlier (April-May) than do Eastern
Coachwhips (June-July; Fitch 1970, Wright and Wright 1957), hatchling emergence of these
large sympatric snakes is similar (late August-early September; Fitch 1970, Wright and Wright
1957, AZA Snake TAG 2011).

10
LEGEND
Figure 1. Shapes of Eastern Indigo Snakes (Drymarchon couperi). A) Normal egg with smooth
shell and ovoid shape; B) abnormal egg with dimpled shell and ovoid shape; C) abnormal egg
with smooth shell and distended shape.
Figure 2. Linear regression of incubation duration (d) on mean incubation temperature (°C).
Regression equation is y = -16.3x + 507.5 (p < 0.00001, R2=0.90).
Figure 3. Linear regression of hatchling weight (g) on mean incubation temperature (°C).
Regression equation is y = -2.5x + 100.98 (p = 0.26, R2=0.07).
Figure 4. Logistic regression of shell shape (left abscissa; no dimpling or dimpled) and egg shape
(right abscissa; ovoid or distended) on mean incubation temperature (°C). Regression equations
are left y = -13.9lnx + 45.2 (p < 0.0001, R2= 0.62) and right y = 0.5x
2 - 26.4x + 318.8 (p <
0.0001, R2= 0.86).

11
Fig. 1A
Fig. 1B

12
Fig. 1C

13
Fig. 2
Fig. 3
80
85
90
95
100
105
110
115
120
125
23.5 24 24.5 25 25.5 26
MEA
N IN
CU
BA
TIO
N D
UR
ATI
ON
(D
AY
S)
MEAN INCUBATION TEMPERATURE (°C)
0
10
20
30
40
50
60
23.5 24 24.5 25 25.5 26
MEA
N H
ATC
HLI
NG
WEI
GH
T (G
)
MEAN INCUBATION TEMPERATURE °C

14
Fig. 4
0
1
0
1
23.5 24 24.5 25 25.5 26
EGG
SH
AP
E
SHEL
L SH
AP
E
MEAN INCUBATION TEMPERATURE °C

15
CHAPTER III
Effects of diet diversity on growth of Eastern Indigo snakes (Drymarchon couperi) in a headstart
program
ABSTRACT
Optimal husbandry techniques are desirable for any headstart program. Because
Drymarchon couperi has few relevant data describing hatchling diets necessary to achieve
optimal growth, I examined growth rates of captive snakes fed known diets. Feeding data were
examined for 130 hatchling Drymarchon couperi snakes. These snakes exhibited a linear decline
in growth rate when fed less than 1711 g over their first 21 months and displayed constant
growth for individuals exceeding 1711 g over that time period. Similarly, growth rate increased
linearly with increasing diet diversity up to a moderately diverse diet, followed by constant
growth for higher levels of diet diversity. Of the two components of diet diversity, number of
genera consumed, and evenness of diet items consumed, diet evenness played the stronger role in
explaining variance in hatchling growth. These patterns document that the goal of satiating the
snakes was achieved for some individuals but not others and that diets in which total grams
consumed is distributed equivalently among the genera that a snake is willing to consume yields
the fastest growth rate for that individual.
INTRODUCTION
The Eastern Indigo Snake (Drymarchon couperi) is a large oviparous colubrid with a
historic range associated with the longleaf pine forests of the southeastern United States. It is an
active, diurnal, wide-ranging forager with a generalist diet (Mount 1975; Köhler 2005; Stevenson

16
et al. 2010). Due to over collecting for the pet industry, mortality caused by gassing of gopher
tortoise burrows, and habitat loss and degradation, the Eastern Indigo Snake was listed as
Threatened by the U.S. Fish and Wildlife Service in 1978 (USFWS 1982, Speake 1993). The
recovery plan for D. couperi, accepted in 1982, outlined steps for protection, recovery, and
eventual removal of the species from federal protection. Part of the plan included reestablishing
extirpated populations where possible (Speake et al. 1982; Speake 1993; Hyslop 2014).
Species reintroductions are becoming an important and common tool in the management
and conservation of imperiled wildlife (Fischer and Lindenmayer 2000; Bell et al. 2005;
Kingsbury and Attum 2009; Stiles et al. 2013). However, only 26% of reintroduction programs
are deemed successful, 47% had no published results, and 27% of them fail, which leads to
questioning of the methods involved (Fischer and Lindenmayer 2000; Bell et al. 2005).
Reintroduction programs need to be effectively designed and managed with a goal to learn
rapidly from mistakes (Clark and Westrum 1989).
Many reintroduction plans include a headstart program. The goal of a headstart program
is to raise individuals to a size that improves their survival when they are released (Kingsbury
and Attum 2009). Unfortunately, published husbandry information documenting how to raise
imperiled species efficiently is lacking in most cases. Additionally, such information, if available
for a closely related species, may be misinformative. For example, several endangered black
footed ferrets died soon after receiving canine distemper vaccinations that had no such
deleterious effects on closely related species (Carpenter et al. 1976).
Individuals that can convert food resources rapidly into growth generally are considered
to be superior competitors (Gill 1978; Krebs 1978). In the case of D. couperi, survival is
positively correlated with body size, with adults experiencing the highest annual survival

17
(Hyslop et al. 2014; Stiles et al 2013). Even yearling D. couperi are thought to have greater
survival than hatchlings (Smith 1987; Stiles 2013). Based on these observations, headstart
programs associated with repatriation projects should strive to maximize growth of headstarted
individuals. This should maximize project success while minimizing costs.
In this study I evaluate factors associated with optimal growth of hatchling Eastern
Indigo Snakes. Many factors are thought to affect snake growth including incubation temperature
(Köhler 2005) and maternal effects (Bronikowski 2000). However, diet volume is the primary
variable affecting growth of captive snakes and diet diversity remains a widely described feature
of snake diet, but an understudied factor in understanding patterns of growth. Since Drymarchon
couperi is a diet generalist as adults (Stevenson et al. 2010), I test whether diet diversity plays a
role in explaining patterns of growth of hatchlings.
METHODS
Husbandry
Adult gravid female Eastern Indigo Snakes (Drymarchon couperi; n = 22) were caught
over a four-year period (2008-2011) from several locations in Georgia during late winter and
early spring. These females were then transported to a rearing facility at Auburn University
where they were housed until oviposition occurred. After oviposition the female snakes were
given a health check by the project veterinarian and released to their point of capture.
Twenty-one clutches were laid, totaling 181 eggs that were incubated in 30 cm long by
20 cm wide by 20 cm deep plastic tubs placed on thermal tape that was controlled by a
thermostat. Cotton cloth was soaked in water, hand squeezed until damp, and placed below and

18
above the eggs. This substrate allowed eggs to be incubated at a high constant humidity. Eggs
were incubated at temperatures that ranged from 20.6 to 27.8 °C until they hatched (n = 155) or
were removed because they were not viable.
After hatching the neonates were reared for 21 months at Auburn University (AU; n = 22;
2008 clutches), the Orianne Society for Indigo Conservation (OS; n = 38; 2011 clutches), or Zoo
Atlanta (ZA; n = 70; 2009-2010 clutches). At all three sites the goal was to feed each snake to
satiation. A total of 37 prey genera were offered, with prey items differing among sites. AU
offered the most diverse diet and OS offering the least diverse diet. However, the total prey mass
consumed by snakes did not differ among sites (F = 0.05; d.f. = 2; p = 0.95). Each prey item
eaten was identified to species and its mass recorded. Snakes varied in willingness to eat. For
those that were reluctant feeders, a variety of prey was offered until one was consumed.
Typically, such individuals were fed the same prey until they showed a willingness to expand the
diet. Other individuals accepted a variety of prey throughout captivity. Snake weights were
recorded at hatching and at scheduled times that varied among sites, but that yielded 10 to 14
measurements per snake distributed uniformly over the 21 months of captivity.
Statistical analysis
Size data were fit to a logistic growth model (Schoener and Schoener 1978; Andrews et
al. 1983) with time as the independent variable and mass as the dependent variable. This model
is defined by two parameters, asymptotic largest size and characteristic growth function. The
latter determines the shape of the logistic curve, with small values generating flat curves and
large values generating steep curves. Thus, the characteristic growth function is comparable to

19
growth rate when growth is non-linear. This variable was calculated for each individual snake
and was used to test for differences in growth among individuals.
My primary interest was to examine the effect of diet diversity on growth rate. Overall
diet diversity was calculated with the Shannon-Weiner index based on the number of genera and
total grams of each genus consumed. I also examined the effect of diet richness (number of
genera consumed) and evenness (modified Shannon-Weiner index) on growth rate. However, it
is possible that the effect of these variables was confounded by the total amount of food
consumed. Because our goal was to feed each snake to satiation, although snakes varied in their
willingness to eat, some individuals probably failed to achieve maximum growth while others
did. Therefore I used ordinary least squares regression and piece-wise regression to describe the
effect of total grams eaten on growth rate. The model with the smallest mean square error was
chosen as the best model. I then examined the effect of total grams eaten on diet diversity,
evenness, and richness using ordinary least squares regression. Variables uncorrelated with total
grams eaten were then correlated with growth rate. Ordinary least squares and piece-wise
regression models were evaluated, with the model yielding the smallest mean square error being
selected as best. For variables that correlated with total grams eaten, multiple regression was
used to evaluate the effect of the variable of interest on growth rate while controlling for the
effect of total grams eaten.
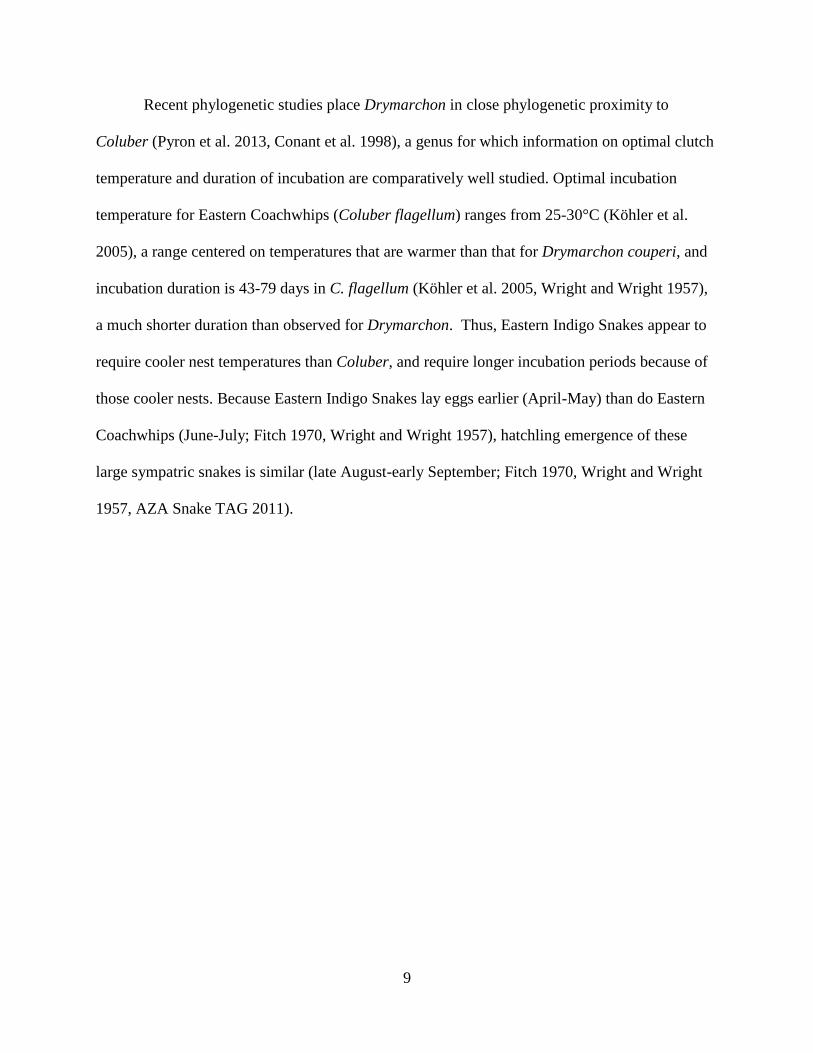
RESULTS
A total of 155 hatchling snakes were available for this study, 25 of which were excluded
because they failed to survive or because they exhibited developmental anomalies. Total prey
mass consumed was a significant predictor of growth rate, with piece-wise regression providing
a better fit (Figure 5; F = 38.7; d.f. = 2; p < 0.0001; R2 = 0.38) than ordinary least squares

20
regression. The cut-point was 1711g, with a positive linear relationship below this value and no
significant slope above this value.
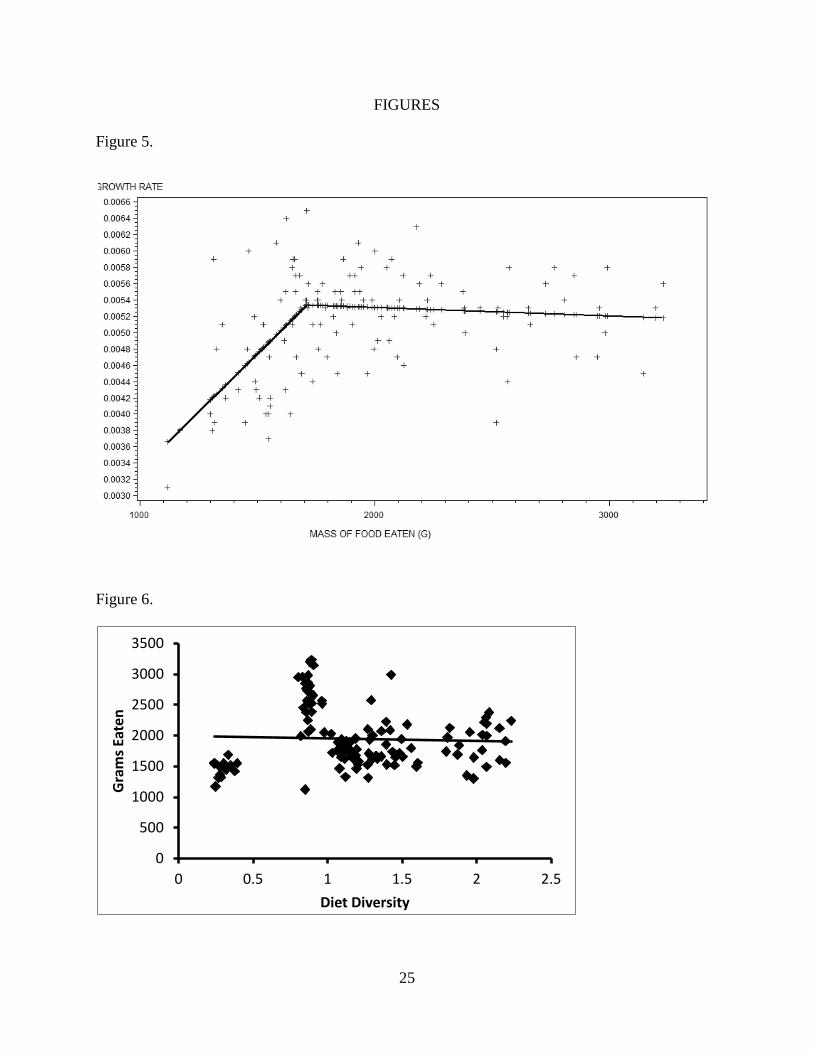
Neither diet diversity (Figure 6; F = 0.46; d.f. = 1; p = 0.5; R2
= 0.004) nor diet richness
(Figure 7; F = 4.09; d.f. = 1; p = 0.04; R2
= 0.025) correlated with total grams eaten in a
biologically significant way. If diet richness had a significantly positive slope I would have run
diet richness and grams eaten through a multiple regression model to find their individual
significance. However a significantly negative slope was determined to not be biologically
significant (Figure 7; y=-20.6x+2092.2). Therefore, I examined the effects of richness and
diversity variables directly on growth rate. Diet diversity was correlated with growth rate, with a
split regression generating a better fit (Figure 8; F = 38.7; d.f. = 2; p < 0.0001; R2
= 0.38) than
ordinary least squares regression. The cutpoint was a diet diversity of 1.2. Below this value
growth rate was positively correlated with diversity; above this value diet diversity had no effect
on growth. Diet richness was uncorrelated with growth rate for both linear regression (F = 0.46;
d.f. = 1; p = 0.5; R2
= 0.004) and piece-wise regression (F = 0.38; d.f. = 1; p = 0.54; R2 = .005).
Diet evenness was significantly correlated with total grams eaten (Figure 9; F = 19.26; d.f
= 1, p < 0.0001, R2
= 0.14) and growth rate (Figure 10; F = 34.83; d.f. = 1, p < 0.0001, R2
=
0.22). When evaluated within a multiple regression model, the combined effect of diet evenness
and total grams eaten explained a significant amount of the variation in growth rate (F = 18.57;
d.f. = 2; p < 0.0001; R2 = 0.22). Within that model diet evenness had a strong linear relationship
with growth rate (t = 4.98; d.f. = 1; p < .0001) when the effect of total grams eaten was
controlled statistically. Total grams eaten had a weak linear relationship with growth rate (t =
1.42; d.f. = 1; p = 0.16) when the effect of diet evenness was controlled statistically.

21
DISCUSSION
My results document that some snakes were fed to satiation and others were not
(Figure 5). Though my goal was to feed every snake to satiation, some individuals were more
accepting of prey than others. This could be due to prey offered (mostly mice, but always
including at least two other genera) being inconsistent with wild diets. Wild diets for juveniles
are made up mainly of snakes (86%) but also have some small mammals and anurans (7%;
Stevenson 2010). I was unable to find a supply of small snakes and, therefore, concentrated prey
on readily available frozen mice, supplemented with available additional small vertebrates
(mainly fishes, anurans, and quail chick). Those captive individuals that were reluctant to feed
paid a consequence in lower growth rates, which can lead to a lower survival in the wild and in
captivity. However, those individuals that consumed 1711 grams or more of food in the first 21
months appeared to be satiated as evidenced by their relatively constant high growth rate
regardless of additional intake.
My results add diet diversity to the list of factors known to affect growth in snakes. The
diet diversity index for Drymarchon couperi should be 1.2 or greater to achieve maximum
growth. Below this value growth rate is reduced as diet diversity decreases; above this value
growth rate is not affected by increasing diversity. Unfortunately, this cutpoint value of diversity
is a complex index that can be achieved by a variety of combinations of diet richness and
evenness (Jost 2006). To place this value in more practical terms, I converted it to the effective
number of genera, yielding a value of 3.3. This represents the diet richness at maximum evenness
that produces the observed cutpoint diversity of 1.2 generated by my piece-wise regression.
Therefore, my results indicate that feeding hatchling Eastern Indigo Snakes to satiation with at
least three genera of prey consumed at equal total masses for each prey genus will yield

22
maximum growth rates. Although hatchling snakes were offered principally small mammals, a
relatively rare prey for wild snakes (Stevenson 2010), maximal growth rates apparently still can
be achieved in a laboratory setting as long as snakes are induced to accept at least two additional
prey types and those prey can be offered at relatively high frequency. Alternatively, an
exceptionally rich diet will be necessary to achieve maximum growth.
Drymarchon couperi eggs are laid in April to May and hatch in August. Many snake
species with overlapping geographic ranges hatch or are born at the same time and at a weight
small enough to form a prey base for D. couperi (Köhler 2005, Mount 1975). These snakes
include members of several genera Agkistrodon, Crotalus, Coluber, Pantherophis, and
Thamnophis. Indigo snakes have not been shown to grow faster than other snakes. Since they are
larger at hatching than other snake species, due to a longer time of incubation, the smaller snakes
make convenient prey items. Anurans, being one fourth of their wild diet can be plentiful in
August as well, having recently transformed from tadpoles (Stevenson et al. 2010). Rodent
weanlings would make for good prey items as well, though would not be as plentiful. Most
nesting birds are too large by August to make for a viable prey item. A constant diet of mammals
in the lab may imprint the snakes for a particular food item that is not readily available in the
wild, also supporting a diverse diet for survival success.

23
LEGEND
Figure 5.
Split regression of hatchling growth rate on total mass eaten (g) during first 21 months of
growth. A cutpoint of 1711 g was recovered, yielding a region below this point with a significant
slope (F = 23.24; d.f. = 2; p < 0.0001; R2
= 0.27) and a region above this point with no
significant slope.
Figure 6.
Linear regression of grams consumed on diet diversity. No significant slope was recovered (F =
0.46; d.f. = 1; p = 0.5; R2 = 0.004).
Figure 7.
Linear regression of grams consumed on genera eaten (diet richness). Regression equation is y=-
20.6x+2092.2 (F = 4.09; d.f. = 1; p = 0.04; R2
= 0.02).
Figure 8.
Split linear regression of growth rate on diet diversity. A cutpoint of 1.2 was recovered, yielding
a region below this point with a significant slope (F = 38.7; d.f. = 2; p < 0.0001; R2
= 0.38) and a
region above this point with no significant slope.
Figure 9.
Linear regression of grams consumed on diet evenness. Regression equation is y=0.0018x +
0.0039 (F = 19.26; d.f = 1, p < 0.0001, R2
= 0.14).

24
Figure 10.
Linear regression of growth rate compared to diet evenness. Regression equation is [add it] (F =
34.83; d.f. = 1, p < 0.0001, R2
= 0.22).
25
FIGURES
Figure 5.
Figure 6.
0
500
1000
1500
2000
2500
3000
3500
0 0.5 1 1.5 2 2.5
Gra
ms
Eate
n
Diet Diversity

26
Figure 7.
Figure 8.
0
500
1000
1500
2000
2500
3000
3500
0 5 10 15 20
Gra
ms
Eate
n
Genera Eaten (Richness)

27
Figure 9.
Figure 10.
0
500
1000
1500
2000
2500
3000
3500
0 0.2 0.4 0.6 0.8 1 1.2
Gra
ms
Eate
n
Diet Evenness
0
0.001
0.002
0.003
0.004
0.005
0.006
0.007
0 0.2 0.4 0.6 0.8 1 1.2
Gro
wth
Rat
e
Diet Evenness

28
CHAPTER IV
CONCLUSIONS
Optimal husbandry techniques are desirable for any headstart program. Drymarchon couperi
had scant published husbandry data before the completion of this project. Egg incubation and
feeding techniques were examined over a four-year period on 130 Drymarchon couperi
hatchlings from 181 eggs. The following results were determined for future husbandry methods
to optimize egg incubation and snake growth.
1) The optimal mean temperature for incubation of Drymarchon couperi eggs is 25°C. On
average eggs will hatch in 97 days with the least chance of detrimental change to shell
shape and egg shape at that temperature.
2) Diet diversity has a positive linear effect on growth of Drymarchon couperi at low levels
of diet diversity (<1.2) but no effect on growth at higher levels of diversity. Growth is
optimized when snakes are fed an even diet of three or more genera. A diverse diet, like
that of wild snakes, is desirable, especially if evenness is also high. When raised in
captivity feeding 1711 total grams of prey consumed over the first 21 months of growth
is optimal. Any more food does not result in a higher rate of growth. Any less food
results in less growth.

29
CUMULATIVE LITERATURE CITED
Andrews, R. M., Rand, A. S., & Guerrero, S. 1983. Seasonal and spatial variation in the annual
cycle of a tropical lizard. Advances in Herpetology and Evolutionary Biology, Essays in
Honor of Ernest E. Williams, 441-454.
Bell, C. D., Parsons, J., Austin, T. J., Broderick, A. C., Ebanks-Petrie, G., & Godley, B. J. 2005.
Some of them came home: the Cayman Turtle Farm headstarting project for the green
turtle Chelonia mydas. Oryx, 39-2, 137-148.
Bronikowski, A. M. 2000. Experimental evidence for the adaptive evolution of growth rate in the
garter snake Thamnophis elegans. Evolution, 54-5, 1760-1767.
Burger, J. 1990. Effects of incubation temperature on behavior of young black racers (Coluber
constrictor) and kingsnakes (Lampropeltis getulus). Journal of Herpetology, Vol. 24, No.
2, 158-163.
Carpenter, J. W., Appel, M. J., Erickson, R. C., & Novilla, M. N. 1976. Fatal vaccine-induced
canine distemper virus infection in black-footed ferrets. Journal of the American
Veterinary Medical Association, Vol. 169, No. 9, 961.
Choo, B.L., & Chou, L.M. 1987. Effect of temperature on the incubation period and hatchability
of Trionyx sinensis Wiegmann eggs. Journal of Herpetology Vol. 21, 230-232.
Clark, T. W., & Westrum, R. 1989. High-performance teams in wildlife conservation: a species
reintroduction and recovery example. Environmental Management, Vol. 13, No. 6, 663-
670.
Conant, R., & Collins, J. 1998. Peterson Field Guide - Reptiles and Amphibians of
Eastern/Central North America, 3rd
edition. Boston, MA. Houghton Mifflin Company,
350.

30
Fischer, J., & Lindenmayer, D. B. 2000. An assessment of the published results of animal
relocations. Biological Conservation, Vol. 96, 1-11.
Gill, D. E. 1978. On selection at high population density. Ecology, 1289-1291.
Hyslop, N. L., Myers, J. M. Cooper, R. J. & Stevenson, D. J. 2014. Effects of body size and sex
of Drymarchon couperi (Eastern Indigo Snake) on habitat use, movements, and home
range size in Georgia. Journal of Wildlife Management, Vol. 78, 101-111.
IUCN. 1996. IUCN/SSC guidelines for re-introductions. 41st Meeting of the IUCN Council,
Gland Switzerland, May 1995.
Jost, L. 2006. Entropy and diversity. Oikos, Vol. 113, No. 2, 363-375.
Krebs, C. J. 1978. Ecology: the experimental analysis of distribution and abundance (2nd
Edition). New York: Harper & Row Publishers, 207-210.
Köhler, G. 2005. Incubation of reptile eggs. Malabar, FL. Krieger Publishing Company. 32-33.
Mount, R. 1975. The Reptiles & Amphibians of Alabama. Auburn, AL. Auburn Printing
Company. 182-183.
Schoener, T. W., & Schoener, A. 1978. Estimating and interpreting body-size growth in some
Anolis lizards. Copeia No. 3, 390-405.
Smith, C. 1987. Ecology of juvenile and gravid Eastern Indigo snakes in north Florida. MS
Thesis, Auburn University.
Speake, D. W., Diemer, J. & McGlincy, J. 1982. Eastern Indigo snake recovery plan. U.S.
Fish and Wildlife Service, Atlanta, Georgia, USA.
Speake, D.W., McGlincy, J.A., & Colvin, T.A. 1987. Ecology and management of the Eastern
Indigo Snake in Georgia: A progress report. 64-73. In Odom & Landers. Proc. Rare and

31
Endangered Wildlife Symposium, Georgia Dept. of Natural Resources, Game and Fish
Div. Tech. Bull., WL 4.
Speake, D.W. 1993. Indigo snake recovery plan revision U.S. Fish and Wildlife Service, Atlanta,
Georgia. 27.
Stevenson, D.J., Bolt, M.R., Smith, D.J., Enge, K.M., Hyslop, N.L., Norton, T.M., & Dyer, K.J.
2010. Prey records for the Eastern Indigo Snake (Drymarchon couperi). Southeastern
Naturalist. Vol. 9, No. 1, 1-18.
U.S. Fish and Wildlife Service. 1982. Eastern Indigo Snake Recovery Plan. U.S. Fish and
Wildlife Service, Atlanta, Georgia. 23.