optimal security hardening using multi-objective ...cs656/reading/2007acmccs.pdf · optimal...
TRANSCRIPT

Optimal Security Hardening Using Multi-objectiveOptimization on Attack Tree Models of Networks
Rinku Dewri, Nayot Poolsappasit, Indrajit Ray and Darrell WhitleyDepartment of Computer Science
Colorado State UniversityFort Collins, CO 80523, USA
{rinku,nayot,indrajit,whitley}@cs.colostate.edu
ABSTRACTResearchers have previously looked into the problem of de-termining if a given set of security hardening measures caneffectively make a networked system secure. Many of themalso addressed the problem of minimizing the total cost ofimplementing these hardening measures, given costs for in-dividual measures. However, system administrators are of-ten faced with a more challenging problem since they haveto work within a fixed budget which may be less than theminimum cost of system hardening. Their problem is howto select a subset of security hardening measures so as tobe within the budget and yet minimize the residual damageto the system caused by not plugging all required securityholes. In this work, we develop a systematic approach tosolve this problem by formulating it as a multi-objective op-timization problem on an attack tree model of the systemand then use an evolutionary algorithm to solve it.
Categories and Subject DescriptorsC.2.3 [Computer-Communication Network]: NetworkOperations—Network management ; C.2.0 [Computer-Communication Network]: General—Security and protec-tion
General TermsSecurity
KeywordsSecurity management, Attack trees, Multi-objective opti-mization
1. INTRODUCTIONNetwork-based computer systems form an integral part of
any information technology infrastructure today. The dif-ferent levels of connectivity between these systems directlyfacilitate the circulation of information within an organiza-tion, thereby reducing invaluable wait time and increasing
Permission to make digital or hard copies of all or part of this work forpersonal or classroom use is granted without fee provided that copies arenot made or distributed for profit or commercial advantage and that copiesbear this notice and the full citation on the first page. To copy otherwise, torepublish, to post on servers or to redistribute to lists, requires prior specificpermission and/or a fee.CCS’07, October 29–November 2, 2007, Alexandria, Virginia, USA.Copyright 2007 ACM 978-1-59593-703-2/07/0011 ...$5.00.
the overall throughput. As an organization’s operationalcapacity becomes more and more dependent on networkedcomputing systems, the need to maintain accessibility to theresources associated with such systems has become a neces-sity. Any weakness or vulnerability that could result in thebreakdown of the network has direct consequence on theamount of yield manageable by the organization. This, inturn, requires the organization to not only consider the ad-vantages of utilizing a networked system, but also considerthe costs associated with managing the system.
With cost-effectiveness occurring as a major factor in de-ciding the extent to which an organization would secure itsnetwork, it is not sufficient to detect the presence or absenceof a vulnerability and implement a security measure to rec-tify it. Further analysis is required to understand the con-tribution of the vulnerabilities towards any possible damageto the organization’s assets. Often, vulnerabilities are notexploited in isolation, but rather used in groups to compro-mise a system. Similarly, security policies can have a cover-age for multiple vulnerabilities. Thus, cost-effective securitymanagement requires researchers to evaluate the differentscenarios that can lead to the damage of a secured asset,and then come up with an optimal set of security policies todefend such assets.
Researchers have proposed building security models fornetworked systems using paradigms like attack graphs [1,11, 15, 18, 20] and attack trees [6, 13, 16, 17], and thenfinding attack paths in these models to determine scenariosthat could lead to damage. However, determining possibleattack paths, although useful, does not help the system ad-ministrators much. They are more interested in determiningthe best possible way of defending their network in terms ofan enumerated set of hardening options [14]. Moreover, thesystem administrator has to work within a given set of bud-get constraints which may preclude her from implementingall possible hardening measures or even measures that coverall the weak spots. Thus, the system administrator needs tofind a trade-off between the cost of implementing a subset ofsecurity hardening measures and the damage that can po-tentially happen to the system if certain weak spots are leftunpatched. In addition, the system administrator may alsowant to determine optimal robust solutions. These are setsof security hardening measures that have the property thateven if some of the measures within a set fail, the system isstill not compromised.
We believe that the problem should be addressed in amore systematic manner, utilizing the different tools of op-timization at hand. A decision maker would possibly make a

better choice by successively exploring the different levels ofoptimization possible, rather than accepting a solution froman “off-the-shelf” optimizer. Towards this end, the currentwork makes four major contributions. First, we refine andformalize the notion of attack trees so as to encode the con-tribution of different security conditions leading to systemcompromise. Next, we develop a model to quantify the po-tential damage that can occur in a system from the attacksmodeled by the system attack tree. We also quantify thesecurity control cost incurred to implement a set of securityhardening measures. Third, we model the system adminis-trator’s decision problem as three successively refined opti-mization problems on the attack tree model of the system.We progressively transform one problem into the next tocater to more cost-benefit information as may be requiredby the decision maker. Last but not the least, we discussour thoughts and observations regarding the solutions, inparticular the robust solutions identified by our optimiza-tion process, with a belief that such discussion will help thesystem administrator decide what methodology to adopt.
The rest of the paper is organized as follows. We discusssome of the previous works related to determining optimumsecurity hardening measures in Section 2. Section 3 givessome background information on multi-objective optimiza-tion. In Section 4 we describe a simple network that weuse to illustrate our problem formulation and solution. Theattack tree model formalism and the cost model are pre-sented in Sections 5 and 6 respectively. The three optimiza-tion problems and the evolutionary algorithm used to solvethem are presented in Section 7 with results and discussionfollowing in Section 8. Finally we conclude in Section 9.
2. RELATED WORKNetwork vulnerability management has been previously
addressed in a variety of ways. Noel et al. use exploit de-pendency graphs [14] to compute minimum cost-hardeningmeasures. Given a set of initial conditions in the graph,they compute boolean assignments to these conditions, en-forced by some hardening measure, so as to minimize thetotal cost of those measures. As pointed out in their work,these initial conditions are the only type of network securityconditions under our strict control. Hardening measures ap-plied to internal nodes can potentially be bypassed by anattacker by adopting a different attack path. Jha et al. [11]on the other hand do not consider any cost for the hard-ening measures. Rather, their approach involve finding theminimal set of atomic attacks critical for reaching the goaland then finding the minimal set of security measures thatcover the minimal set of atomic attacks.
Such analysis is meant for providing solutions that guaran-tee complete network safety. However, the hardening mea-sures provided may still not be feasible within the finan-cial or other business constraints of an organization. Undersuch circumstances, a decision maker must perform a cost-benefit analysis to understand the trade-off between hard-ening costs and network safety. Furthermore, a minimumcost hardening measure set only means that the root goalis safe, and some residual damage may still remain in thenetwork. Owing to these real-world concerns, network vul-nerability management should not always be considered asa single-objective optimization problem.
A multi-objective formulation of the problem is presentedby Gupta et al. [10]. They consider a generic set of security
policies capable of covering one or more generic vulnerabili-ties. A security policy can also introduce possible vulnerabil-ities, thereby resulting in some residual vulnerabilities evenafter the application of security policies. The multi-objectiveproblem then is to minimize the cost of implementing thesecurity policies, as well as the weighted residual vulnera-bilities. However, the authors finally scalarize the two ob-jectives into a single objective using relative weights for theobjectives.
3. BACKGROUND ON MULTI-OBJECTIVEOPTIMIZATION
In real world scenarios, often a problem is formulated tocater to several criteria or design objectives, and a decisionchoice to optimize these objectives is sought for. An op-timum design problem must then be solved with multipleobjectives and constraints taken into consideration. Thistype of decision making problems falls under the broad cat-egory of multi-criteria, multi-objective, or vector optimiza-tion problem.
Multi-objective optimization differs from single-objectiveones in the cardinality of the optimal set of solutions. Single-objective optimization techniques are aimed towards findingthe global optima. In case of multi-objective optimization,there is no such concept of a single optimum solution. Thisis due to the fact that a solution that optimizes one of theobjectives may not have the desired effect on the others. Asa result, it is not always possible to determine an optimumthat corresponds in the same way to all the objectives un-der consideration. Decision making under such situationsthus require some domain expertise to choose from multipletrade-off solutions depending on the feasibility of implemen-tation.
Due to the conflicting nature of the objective functions,a simple objective value comparison cannot be performedto compare two feasible solutions to a multi-objective prob-lem. Most multi-objective algorithms thus use the conceptof dominance to compare feasible solutions.
Definition 1. Dominance and Pareto-optimal setIn a minimization problem with M objectives, a feasible
solution vector ~x is said to dominate another feasible solu-tion vector ~y if
1. ∀i ∈ {1, 2, . . . ,M} fi(~x) ≤ fi(~y) and2. ∃j ∈ {1, 2, . . . ,M} fj(~x) < fj(~y)~y is then said be dominated by ~x. If the two conditions do
not hold, ~x and ~y are said to be non-dominated w.r.t. eachother. The set of all non-dominated solutions obtained overthe entire feasible region constitutes the Pareto-optimal set.
The surface generated by the Pareto-optimal solutions in theobjective space is called the Pareto-front or Pareto-surface.
For a security optimization problem like ours, concentrat-ing on the minimization of hardening measure costs and thenetwork damage, the dominance concept plays a crucial rolein evaluating solutions. A solution which reduces one of theobjectives would most likely increase the other. Dominancebased comparison would identify solutions with such trade-off properties in the two objectives.
Evolutionary algorithms for multi-objective optimization(EMO) have been extensively studied and applied to a widespectrum of real-world problems. An EMO works with apopulation of trial solutions, trying to converge on to the

Pareto-optimal set by filtering out the infeasible or domi-nated ones. A number of algorithms have been proposed inthis context [5, 7]. We employ the Non-dominated SortingGenetic Algorithm-II (NSGA-II) [8] for the multi-objectiveoptimization in this study. NSGA-II has gained wide pop-ularity in the multi-objective optimization community be-cause of its efficiency in terms of the convergence and diver-sity of solutions obtained.
4. A SIMPLE NETWORK MODELTo illustrate our methodology, we consider the hypothet-
ical network as shown in Fig. 1. The setup consists of fourhosts. A firewall is installed with a preset policy to ensurethat only the FTP and SMTP servers are allowed to connectto the external network. In addition, FTP and SSH are theonly two services an external user can use to communicatewith these servers. We assume that an external user wantsto compromise the Data Server which is located inside thefirewall. The firewall has a strong set of policies setup toprotect access to the internal hosts. There are six differentattack scenarios possible to achieve the ultimate goal froma given set of initial vulnerabilities and network topology aslisted in Table 1 and 2.
Figure 1: Example network model.
Host Vulnerability CVE#
FTP Server Ftp .rhost attack 1999-0547196.216.0.10 Ftp Buffer overflow 2001-0755
Ssh Buffer overflow 2006-2421SMTP Server Ftp .rhost attack 1999-0547196.216.0.1Terminal LICQ remote-2-user 2001-0439
196.216.0.3 “at” heap corruption 2002-0004Data Server LICQ remote-2-user 2001-0439196.216.0.2 suid Buffer overflow 2001-1180
Table 1: Initial vulnerability per host in examplenetwork.
To compromise the Data Server, an attacker can exploitthe FTP and SMTP Servers using the ftp/.rhost attack.Both servers are running ftp server versions that are vul-nerable to these exploits. In addition, their rhost directoriesare not properly write-protected. The consequence of theftp/.rhost exploit is that it establishes a trust relation be-tween the host and attacker machines, and introduces an
Host Host Port
*.*.*.* 196.216.0.1 21,25*.*.*.* 196.216.0.10 21,22
196.216.0.1 196.216.0.2 ANY196.216.0.1 196.216.0.3 ANY196.216.0.3 196.216.0.2 ANY196.216.0.10 196.216.0.2 ANY
Table 2: Connectivity in example network.
authentication bypassing vulnerability in the victim. An at-tacker can then log in to these servers with user access priv-ilege. From this point, the attacker can use the connectionto the Data Server to compromise it. The attacker may alsocompromise the SMTP Server, or choose to compromise theTerminal machine in order to delay an attack. The Ter-minal machine can be compromised via the chain of LICQremote to user attack and the local buffer overflow attack onthe “at” daemon. Finally, the attacker from either the FTPserver, SMTP server, or the Terminal machine can use theconnectivity to the Data Server to compromise it throughthe chain of LICQ exploit and “suid” local buffer overflowattack. Such attack scenarios, as in our example networkmodel, are represented using an attack tree, discussed in de-tails in the next section.
5. ATTACK TREE MODELGiven the complexity of today’s network infrastructure,
materializing a threat usually requires the combination ofmultiple attacks using different vulnerabilities. Represent-ing different scenarios under which an asset can be damagedthus becomes important for preventive analysis. Such repre-sentations not only provide a picture of the possible ways tocompromise a system, but can also help determine a mini-mal set of preventive actions. Given the normal operationalstate of a network, including the vulnerabilities present, anattack can possibly open up avenues to launch another at-tack, thereby taking the attacker a step closer to its goal.A certain state of the network in terms of access privilegesor machine connectivity can be a prerequisite to be able toexploit a vulnerability. Once the vulnerability is exploited,the state of the network can change enabling the attacker tolaunch the next attack in the sequence. Such a pre-thoughtsequence of attacks gives rise to an attack scenario.
It is worth noting that such a notion of a progressive at-tack induces a transitive relationship between the vulnera-bilities present in the network and can be exploited whiledeciding on the security measures. Attack graph [1, 11, 14,18] and attack tree [16, 17] representations have been pro-posed in network vulnerability management to demonstratesuch cause-consequence relationships. The nodes in thesedata structures usually represent a certain network state ofinterest to an attacker, with edges connecting them to indi-cate the cause-consequence relationship. Although differentattack scenarios are easily perceived in attack graphs, theycan potentially suffer from a state space explosion problem.Ammann et al. [1] identified this problem and propose analternative formulation, with the assumption of monotonic-ity. The monotonicity property states that the consequenceof an attack is always preserved once achieved. Such anassumption can greatly reduce the number of nodes in theattack graph, although at the expense of further analysis re-
quired to determine the viable attack scenarios. An exploit-dependency graph can be extracted from their representationto indicate the various conjunctive and disjunctive relation-ships between different nodes. For the purpose of this study,we adopt the attack tree representation since it presents amuch clearer picture of the different hierarchies present be-tween attacker sub-goals. An attack tree uses explicit con-junctive and disjunctive branch decomposition to reduce thevisualization complexity of a sequence of operations. Therepresentation also helps us calculate the cost factors we areinterested in efficiently.
Different properties of the network effectuate different waysfor an attacker to compromise a system. We first define anattribute-template that lets us generically categorize thesenetwork properties for further analysis.
Definition 2. Attribute-TemplateAn attribute-template is a generic property of the hardware
or software configuration of a network which includes, butnot limited to, the following:
• system vulnerabilities (which are often reported in vul-nerability databases such as BugTraq, CERT/CC, orNetCat).
• network configuration such as open port, unsafe fire-wall configuration, etc.
• system configuration such as data accessibility, unsafedefault configuration, or read-write permission in filestructures.
• access privilege such as user account, guest account, orroot account.
• connectivity.
An attribute-template lets us categorize most of the atomicproperties of the network that might be of some use toan attacker. For example, “running SSH1 v1.2.23 on FTPServer” can be considered as an instance of the system vul-nerabilities template. Similarly, “user access on Terminal”isan instance of the access privilege template. Such templatesalso let us specify the properties in propositional logic. Wedefine an attribute with such a concept in mind.
Definition 3. AttributeAn attribute is a propositional instance of an attribute-
template. It can take either a true or false value.
The success or failure of an attacker reaching its goal de-pends mostly on what truth values the attributes in a net-work take. Its also lays the foundations for a security man-ager to analyze the effects of falsifying some of the attributesusing some security policies. We formally define an attacktree model based on such attributes. Since we consider anattribute as an atomic property of a network, taking eithera true or false value, most of the definitions are written inpropositional logic involving these attributes.
Definition 4. AttackLet S be a set of attributes. We define Att to be a mapping
Att : S×S → {true, false} and Att(sc, sp) = truth value ofsp.a = Att(sc, sp) is an attack if sc 6= sp ∧ a ≡ sc ↔ sp.
sc and sp are then respectively called a precondition and
postcondition of the attack, denoted by pre(a) and post(a)respectively.Att(sc, sp) is a φ–attack if ∃non-empty S′ ⊂ S|[sc 6= sp ∧
Att(sc, sp) ≡Vi
si ∧ sc ↔ sp] where si ∈ S′.
An attack relates the truth values of two different attributesso as to embed a cause-consequence relationship between thetwo. For example, for the attributes sc =“vulnerable to sshdBOF on machine A” and sp =“root access privilege on ma-chine A”, Att(sc, sp) is an attack – the sshd buffer overflowattack. We would like to clarify here that the bi-conditionallogical connective “↔” between sc and sp does not implythat sp can be set to true only by using Att(sc, sp); ratherit means that given the sshd BOF attack, the only way tomake sp true is by having sc true. In fact, Att(“vulnerableto local BOF on setuid daemon on machine A”,sp) is alsoa potential attack. The φ–attack is included to accountfor attributes whose truth values do not have any directrelationship. However, an indirect relationship can be es-tablished collectively. For example, the attributes sc1 =“running SSH1 v1.2.25 on machine A” and sc2 = “connec-tivity(machine B, machine A)”cannot individually influencethe truth value of sc, but can collectively make sc true, giventhey are individually true. In such a case, Att(sc1 , sc) andAtt(sc2 , sc) are φ–attacks.
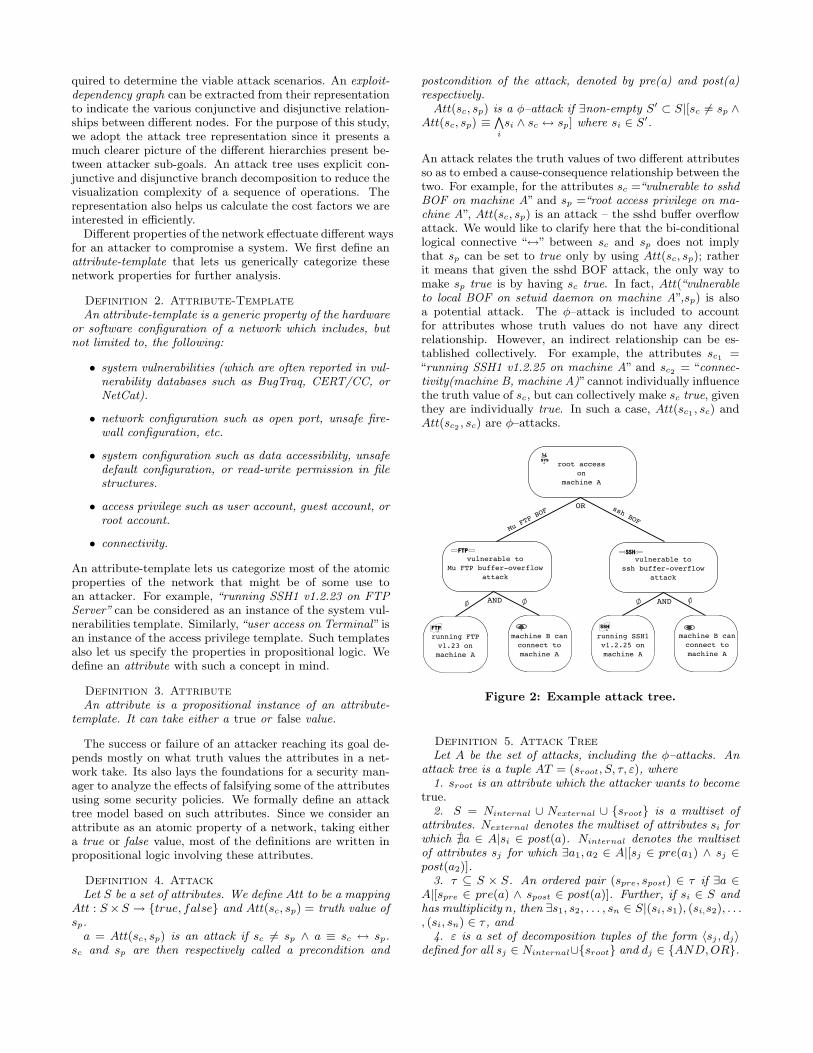
Figure 2: Example attack tree.
Definition 5. Attack TreeLet A be the set of attacks, including the φ–attacks. An
attack tree is a tuple AT = (sroot, S, τ, ε), where1. sroot is an attribute which the attacker wants to become
true.2. S = Ninternal ∪ Nexternal ∪ {sroot} is a multiset of
attributes. Nexternal denotes the multiset of attributes si forwhich @a ∈ A|si ∈ post(a). Ninternal denotes the multisetof attributes sj for which ∃a1, a2 ∈ A|[sj ∈ pre(a1) ∧ sj ∈post(a2)].
3. τ ⊆ S × S. An ordered pair (spre, spost) ∈ τ if ∃a ∈A|[spre ∈ pre(a) ∧ spost ∈ post(a)]. Further, if si ∈ S andhas multiplicity n, then ∃s1, s2, . . . , sn ∈ S|(si, s1), (si,s2), . . ., (si, sn) ∈ τ , and
4. ε is a set of decomposition tuples of the form 〈sj , dj〉defined for all sj ∈ Ninternal∪{sroot} and dj ∈ {AND,OR}.

Figure 3: Attack tree of example network model.
dj is AND whenVi
[si ∧ (si, sj) ∈ τ ] ↔ sj is true, and OR
whenWi
[si ∧ (si, sj) ∈ τ ]↔ sj is true.
Fig. 2 shows an example attack tree, with the attribute “rootaccess on machine A” as sroot. The multiset S forms thenodes of the tree. The multiset Nexternal specify the leafnodes of the tree. These nodes reflect the initial vulnerabil-ities present in a network and are prone to exploits. Since,an attribute can be a precondition for more than one at-tack, it might have to be duplicated, hence forming a mul-tiset. The attribute “machine B can connect to machine A”in the example is one such attribute. The set of orderedpairs, τ , reflect the edges in the tree. The existence of anedge between two nodes imply that there is a direct or indi-rect relationship between their truth values, signified by thedecomposition at each node. The AND decomposition at anode requires all child nodes to have a truth value of true forit to be true. The OR decomposition at a node requires onlyone child node to have a truth value of true for it to be true.Using these decompositions, the truth value of an attributesj ∈ Ninternal∪{sroot} can be evaluated after assigning a setof truth values to the attributes si ∈ Nexternal. Fig. 3 showsthe attack tree for our example network model. It depictsa clear picture of the different attack scenarios possible, asoutlined in the previous section. We use an in-house tool togenerate this attack tree.
6. COST MODELIn order to defend against the attacks possible, a secu-
rity manager (decision maker) can choose to implement avariety of safeguard technologies, each of which comes withdifferent costs and coverage. For example, to defend againstthe ftp/.rhost exploit, one might choose to apply a securitypatch, disable the FTP service, or simply tighten the writeprotection on the .rhost directory. Each choice of action canhave a different cost. Besides, some measures have multiple
coverage, but with higher costs. A security manager has tomake a decision and choose to implement a subset of thesepolicies in order to maximize the resource utilization. How-ever, given the number of permutations possible in choosingthis subset (2n for n policies), this decision is not a trivialtask.
Security planing begins with risk assessment which de-termines threats, loss expectancy, potential safeguards andinstallation costs. Many researchers have studied risk as-sessment schemes, including the National Institute of Stan-dards and Technology (NIST) [19]. For simplicity, the secu-rity manager can choose to evaluate the risks by consider-ing a relative magnitude of loss and hardening costs [2, 12,19]. However, relative-cost approaches do not provide suf-ficient information to prioritize security measures especiallywhen the organization faces resource constraints. We adaptButler’s multi-attribute risk assessment framework [3, 4] todevelop quantitative risk assessments for our security op-timization. Butler’s framework enables an aggregated rep-resentation of the various factors dominating the businessmodel of an organization.
First we define the notion of a security control in the con-text of the attack tree definition.
Definition 6. Security ControlGiven an attack tree (sroot, S, τ, ε), the mapping SC :
Nexternal → {true, false} is a security control if ∃si ∈Nexternal|SC(si) = false.
In other words, a security control is a preventive measureto falsify one or more attributes in the attack tree, so as tostop an attacker from reaching its goal. Further, in the pres-ence of multiple security controls SCk, the truth value of anattribute si ∈ Nexternal is taken as
Vk
SCk(si). Given a secu-
rity control SC, the set of all si ∈ Nexternal|SC(si) = falseis called the coverage of SC. Hence, for a given set of se-curity controls we can define the coverage matrix specifying

the coverage of each control. For a given set of m securitycontrols, we use the boolean vector ~T = (T1,T2, . . . , Tm) toindicate if a security control is chosen by a security manager.Note that the choice of this vector indirectly specifies whichattributes in the attack tree would be false to begin with.
6.1 Evaluating Potential DamageThe potential damage, Pj , represents a unit-less damage
value that an organization may have to incur in the eventthat an attribute sj becomes true. Based on Butler’s frame-work, we propose four steps to calculate the potential dam-age for an attribute sj .
Step1: Identify potential consequences of having a true valuefor the attribute, induced by some attack. In our case,we have identified five outcomes – lost revenue (mone-tary), non-productive downtime (time), damage recov-ery (monetary), public embarrassment (severity) andlaw penalty (severity) – denoted by x1j , x2j , x3j , x4j
and x5j .
Step2: Estimate the expected number of attack occurrence,Freqj , resulting in the consequences. A security man-ager can estimate the expected number of attack fromthe organization-based historical data or public histor-ical data.1
Step3: Assess a single value function, Vij(xij), for each pos-sible consequence. The purpose of this function is tonormalize different unit measures so that the valuescan be summed together under a single standard scale.
Vij(xij) =xij
Maxj
xij× 100 , 1 ≤ i ≤ 5 (1)
Step4: Assign a preference weight factor, Wi, to each pos-sible consequence. A security manager can rank eachoutcome on a scale of 1 to 100. The outcome with themost concern would receive 100 points. The managerranks the other attributes relative to the first. Finally,the ranks are normalized and set as Wi.
The potential damage for the attribute can then be calcu-lated from the following equation.
Pj = Freqj ×5Xi=1
WiVij(xij) (2)
When using an attack tree, a better quantitative repre-sentation of the cost is obtained by considering the resid-ual damage once a set of security policies are implemented.Hence, we augment each attribute in the attack tree with avalue signifying the amount of potential damage residing inthe subtree rooted at the attribute and the attribute itself.
Definition 7. Augmented-Attack TreeLet AT = (sroot, S, τ, ε) be an attack tree. An augmented-
attack tree ATaug = AT |〈I, V 〉 is obtained by associating atuple 〈Ii, Vi〉 to each si ∈ S, where
1. Ii is an indicator variable for the attribute si, where
Ii =
(0 , if si is false
1 , if si is true
2. Vi is a value associated with the attribute si.1Also known as an incident report published annually inmany sites such as CERT/CC or SANS.ORG.
In this work, all attributes si ∈ Nexternal are given a zerovalue. The value associated with sj ∈ Ninternal ∪ {sroot} isthen computed recursively as follows.
Vj =
8><>:PVk
k|(sk,sj)∈τ+ IjPj , if dj is AND
Max Vkk|(sk,sj)∈τ
+ IjPj , if dj is OR(3)
Ideally, Pj is same for all identical attributes in the multi-set. We took a “panic approach” in calculating the value ateach node, meaning that given multiple subtrees are rootedat an attribute with an OR decomposition, we choose themaximum value. We do so because an attacker’s capabilitiesand preferences cannot be known in advance. The residualdamage of the augmented tree is then defined as follows.
Definition 8. Residual DamageGiven an augmented-attack tree (sroot, S, τ, ε)|〈I, V 〉 and
a vector ~T = (Ti), Ti ∈ {0, 1}; 1 ≤ i ≤ m, the residualdamage is defined as the value associated with sroot, i.e.,
RD(~T ) = Vroot
6.2 Evaluating Security CostSimilar to the potential damage, the security manager first
lists possible security costs for the implementation of a secu-rity control, assigns the weight factor on them, and computesthe normalized value. The only difference is that there is noexpected number of occurrence needed in the evaluation ofsecurity cost. In this study, we have identified five differ-ent costs of implementing a security control – installationcost (monetary), operation cost (monetary), system down-time (time), incompatibility cost (scale), and training cost(monetary). The overall cost Cj , for the security controlSCj , is then computed in a similar manner as for potentialdamage, with an expected frequency of 1. The total secu-rity cost for a set of security controls implemented is thendefined as follows.
Definition 9. Total Security Control CostGiven a set of m security controls, each having a cost
Ci; 1 ≤ i ≤ m, and a vector ~T = (Ti), Ti ∈ {0, 1}; 1 ≤i ≤ m, the total security control cost is defined as
SCC(~T ) =
mXi=1
(TiCi)
7. PROBLEM FORMULATIONThe two objectives we consider in this study are the total
security control cost and the residual damage in the attacktree of our example network model. For the attack treeshown in Fig. 3, we identified 19 different security controlspossible by patching or disabling of different services, as wellas by changing file access permissions. With about half amillion choices available (219), an enumerated search wouldnot be an efficient approach to find the optima. The securitycontrols are listed in Table 3. We also tried to maintain somerelative order of importance between the different services,as in a real-world scenario, when computing the potentialdamage and security control costs.

Security Control Action Security Control Action
SC1/SC2 Disable/Patch suid @ 196.216.0.2 SC11 Chmod home directory @ 196.216.0.1SC3/SC4 Disable/Patch LICQ @ 196.216.0.2 SC12/SC13 Disable/Patch Ftp @ 196.216.0.10SC5 Disable “at” @ 196.216.0.3 SC14/SC15 Disable/Patch SSH @ 196.216.0.10
SC6/SC7 Disable/Patch LICQ @ 196.216.0.3 SC16 Disconnect Internet @ 196.216.0.10SC8 Disable Rsh @ 196.216.0.1 SC17 Disable Rsh @ 196.216.0.10SC9 Disable Ftp @ 196.216.0.1 SC18 Patch FTP/.rhost @ 196.216.0.10SC10 Disconnect Internet @ 196.216.0.1 SC19 Chmod home directory @ 196.216.0.10
Table 3: Security controls for example network model.
Problem 1. The Single-objective Optimization ProblemGiven an augmented-attack tree (sroot, S, τ, ε)|〈I, V 〉 and
m security controls, find a vector ~T ∗ = (T ∗i ), T ∗i ∈ {0, 1}; 1 ≤i ≤ m, which minimizes the function
αRD(~T ) + βSCC(~T )
where, α and β are preference weights for the residual dam-age and the total cost of security control respectively, 0 ≤α, β ≤ 1 and α+ β = 1.
The single-objective problem is the most likely approach tobe taken by a decision maker. Given only two objectives, apreference based approach might seem to provide a solutionin accordance with general intuition. However, as we find inthe case of our example network model, the quality of thesolution obtained can be quite sensitive to the assignmentof the weights. To demonstrate this affect, we run multipleinstances of the problem using different combination of val-ues for α and β. α is varied in the range of [0, 1] in steps of0.05. β is always set to 1− α.
Problem 2. The Multi-objective Optimization ProblemGiven an augmented-attack tree (sroot, S, τ, ε)|〈I, V 〉 and
m security controls, find a vector ~T ∗ = (T ∗i ), T ∗i ∈ {0, 1}; 1 ≤i ≤ m, which minimizes the total security control cost andthe residual damage.
The next level of sophistication is added by formulatingthe minimization as a multi-objective optimization problem.The multi-objective approach alleviates the requirement tospecify any weight parameters and hence a better global pic-ture of the solutions can be obtained.
Problem 3. The Multi-objective Robust OptimizationProblem
Let ~T = (Ti) be a boolean vector. A perturbed assignment
of radius r, ~Tr, is obtained by inverting the value of at mostr elements of the vector ~T . The robust optimization problemcan then be defined as follows.
Given an augmented-attack tree (sroot, S, τ, ε)|〈I, V 〉 and
m security controls, find a vector ~T ∗ = (T ∗i ), T ∗i ∈ {0, 1}; 1 ≤i ≤ m, which minimizes the total security control cost andthe residual damage, satisfying the constraint
max~Tr
RD( ~Tr)−RD(~T ) ≤ D
where, D is the maximum perturbation allowed in the resid-ual damage.
The third problem is formulated to further strengthen thedecision process by determining robust solutions to the prob-lem. Robust solutions are less sensitive to failures in security
controls and hence subside any repeated requirements to re-evaluate solutions in the event of a security control failure.
We use a simple genetic algorithm (SGA) [9] to solve Prob-lem 1. NSGA-II is used to solve Problem 2 and 3.
NSGA-II for security optimizationNSGA-II starts with a population P0 of N randomly gen-erated security control vectors ~T . For each trial solution,the total security control cost is calculated using Def. 9. Tocompute the residual damage, the attributes covered by asecurity control vector in the attack tree are decided usingTable 3 and set to false. The truth values for the remainingattributes in Nexternal are set to true. A DFS traversal ofthe tree is then used to determine the truth values of theinternal nodes using the decomposition at each node. Thisenables us to compute the value Vroot for the root node –the residual damage – using Eq. 3.
A generation index t = 0, 1, . . . , GenMAX keeps track ofthe number of iterations of NSGA-II. Each generation of thealgorithm then proceeds as follows. An offspring populationQt is first created from the parent population Pt by applyingthe usual genetic operations of selection, crossover and mu-tation [9]. The residual damage and total security controlcost corresponding to each solution in the child populationare also computed.
Figure 4: One generation of NSGA-II.
The parent and offspring populations are combined toform a population Rt = Pt∪Qt of size 2N . A non-dominatedsorting is applied to Rt to rank each solution based on thenumber of solutions that dominate it. A rank k solutionindicates that there are k other solutions of different ranksthat dominate it. For Problem 3, the solutions which vi-olate the robustness constraint, i.e. an infeasible solution,
are given unique ranks higher than the highest feasible so-lution rank. The ranking starts in ascending order from theinfeasible solution with least constraint violation.
The population Pt+1 is generated by selecting N solutionsfrom Rt. The preference of a solution is decided based on itsrank: lower the rank, higher the preference. However, sincenot all solutions from Rt can be accommodated in Pt+1, achoice is likely to be made when the number of solutions ofthe currently considered rank is more than the remainingpositions in Pt+1. Instead of making an arbitrary choice,NSGA-II uses an explicit diversity-preservation mechanism.The mechanism, based on a crowding distance metric [8],gives more preference to a solution with a lesser density ofsolutions surrounding it, thereby enforcing diversity in thepopulation. The NSGA-II crowding distance metric for asolution is the sum of the average side-lengths of the cuboidgenerated by its neighboring solutions in objective space.Fig. 4 depicts a single generation of the algorithm.
The algorithm parameters are set as follows: populationsize = 100, number of generations = 250, crossover proba-bility = 0.9, and mutation probability = 0.1. We ran eachinstance of the algorithms five times to check for any sen-sitivity of the solutions obtained from different initial pop-ulations. Since the solutions always converged to the sameoptima, we dismiss the presence of such sensitivity.
8. RESULTS AND DISCUSSIONWe first present the sensitivity results of NSGA-II and
SGA to their parameters. Increasing the population sizefrom 100 to 500 gives us a faster convergence rate, althoughthe solutions reported still remains the same. The effectof changing the crossover probability in the range of 0.7 to0.9 does not lead to any significant change of the solutionsobtained. Similar results were observed when changing themutation probability from 0.1 to 0.01. The solutions also donot change when the number of generations is changed from250 to 500. Since we did not observe any significant changein the solutions by varying the algorithm parameters, thefollowing results are presented as obtained by setting theparameters as chosen in the previous section.
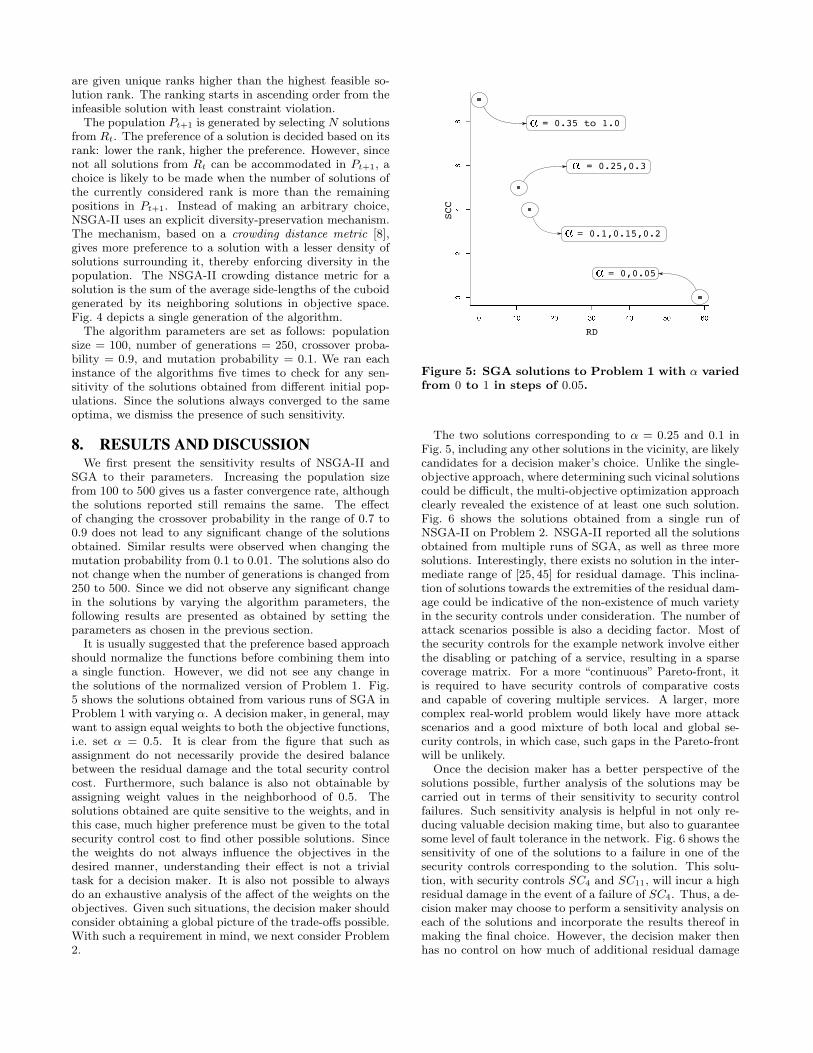
It is usually suggested that the preference based approachshould normalize the functions before combining them intoa single function. However, we did not see any change inthe solutions of the normalized version of Problem 1. Fig.5 shows the solutions obtained from various runs of SGA inProblem 1 with varying α. A decision maker, in general, maywant to assign equal weights to both the objective functions,i.e. set α = 0.5. It is clear from the figure that such asassignment do not necessarily provide the desired balancebetween the residual damage and the total security controlcost. Furthermore, such balance is also not obtainable byassigning weight values in the neighborhood of 0.5. Thesolutions obtained are quite sensitive to the weights, and inthis case, much higher preference must be given to the totalsecurity control cost to find other possible solutions. Sincethe weights do not always influence the objectives in thedesired manner, understanding their effect is not a trivialtask for a decision maker. It is also not possible to alwaysdo an exhaustive analysis of the affect of the weights on theobjectives. Given such situations, the decision maker shouldconsider obtaining a global picture of the trade-offs possible.With such a requirement in mind, we next consider Problem2.
Figure 5: SGA solutions to Problem 1 with α variedfrom 0 to 1 in steps of 0.05.
The two solutions corresponding to α = 0.25 and 0.1 inFig. 5, including any other solutions in the vicinity, are likelycandidates for a decision maker’s choice. Unlike the single-objective approach, where determining such vicinal solutionscould be difficult, the multi-objective optimization approachclearly revealed the existence of at least one such solution.Fig. 6 shows the solutions obtained from a single run ofNSGA-II on Problem 2. NSGA-II reported all the solutionsobtained from multiple runs of SGA, as well as three moresolutions. Interestingly, there exists no solution in the inter-mediate range of [25, 45] for residual damage. This inclina-tion of solutions towards the extremities of the residual dam-age could be indicative of the non-existence of much varietyin the security controls under consideration. The number ofattack scenarios possible is also a deciding factor. Most ofthe security controls for the example network involve eitherthe disabling or patching of a service, resulting in a sparsecoverage matrix. For a more “continuous” Pareto-front, itis required to have security controls of comparative costsand capable of covering multiple services. A larger, morecomplex real-world problem would likely have more attackscenarios and a good mixture of both local and global se-curity controls, in which case, such gaps in the Pareto-frontwill be unlikely.
Once the decision maker has a better perspective of thesolutions possible, further analysis of the solutions may becarried out in terms of their sensitivity to security controlfailures. Such sensitivity analysis is helpful in not only re-ducing valuable decision making time, but also to guaranteesome level of fault tolerance in the network. Fig. 6 shows thesensitivity of one of the solutions to a failure in one of thesecurity controls corresponding to the solution. This solu-tion, with security controls SC4 and SC11, will incur a highresidual damage in the event of a failure of SC4. Thus, a de-cision maker may choose to perform a sensitivity analysis oneach of the solutions and incorporate the results thereof inmaking the final choice. However, the decision maker thenhas no control on how much of additional residual damage
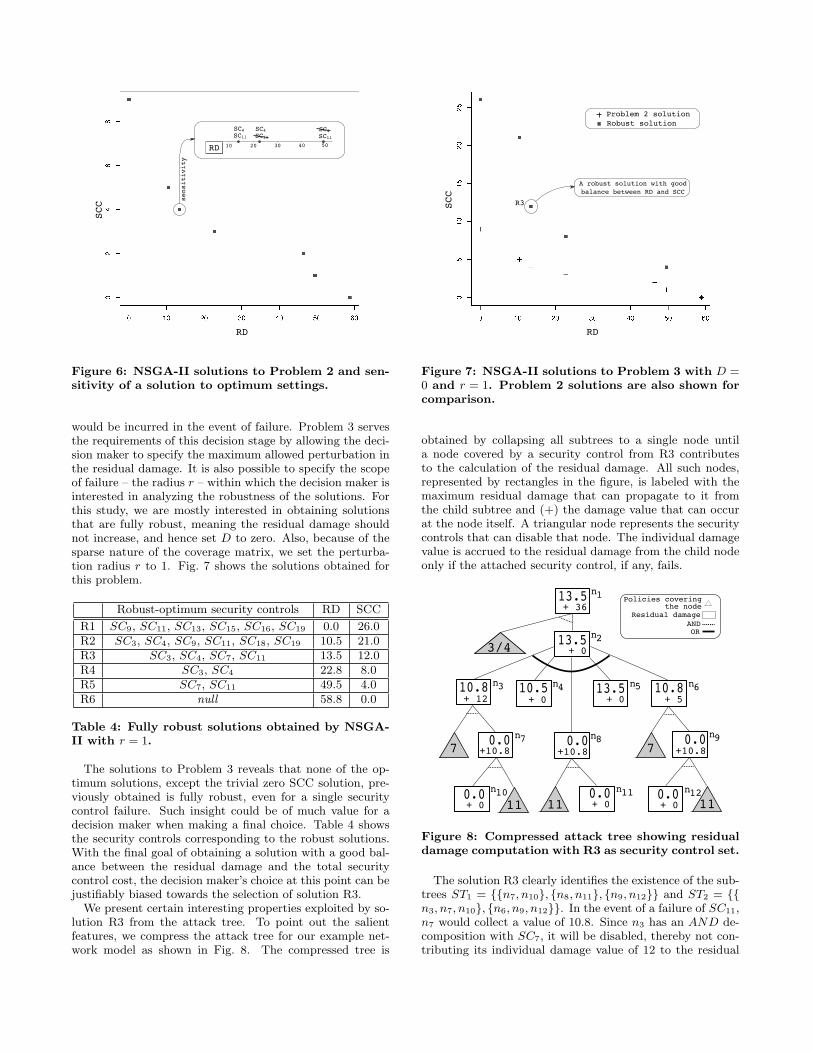
Figure 6: NSGA-II solutions to Problem 2 and sen-sitivity of a solution to optimum settings.
would be incurred in the event of failure. Problem 3 servesthe requirements of this decision stage by allowing the deci-sion maker to specify the maximum allowed perturbation inthe residual damage. It is also possible to specify the scopeof failure – the radius r – within which the decision maker isinterested in analyzing the robustness of the solutions. Forthis study, we are mostly interested in obtaining solutionsthat are fully robust, meaning the residual damage shouldnot increase, and hence set D to zero. Also, because of thesparse nature of the coverage matrix, we set the perturba-tion radius r to 1. Fig. 7 shows the solutions obtained forthis problem.
Robust-optimum security controls RD SCC
R1 SC9, SC11, SC13, SC15, SC16, SC19 0.0 26.0R2 SC3, SC4, SC9, SC11, SC18, SC19 10.5 21.0R3 SC3, SC4, SC7, SC11 13.5 12.0R4 SC3, SC4 22.8 8.0R5 SC7, SC11 49.5 4.0R6 null 58.8 0.0
Table 4: Fully robust solutions obtained by NSGA-II with r = 1.
The solutions to Problem 3 reveals that none of the op-timum solutions, except the trivial zero SCC solution, pre-viously obtained is fully robust, even for a single securitycontrol failure. Such insight could be of much value for adecision maker when making a final choice. Table 4 showsthe security controls corresponding to the robust solutions.With the final goal of obtaining a solution with a good bal-ance between the residual damage and the total securitycontrol cost, the decision maker’s choice at this point can bejustifiably biased towards the selection of solution R3.
We present certain interesting properties exploited by so-lution R3 from the attack tree. To point out the salientfeatures, we compress the attack tree for our example net-work model as shown in Fig. 8. The compressed tree is
Figure 7: NSGA-II solutions to Problem 3 with D =0 and r = 1. Problem 2 solutions are also shown forcomparison.
obtained by collapsing all subtrees to a single node untila node covered by a security control from R3 contributesto the calculation of the residual damage. All such nodes,represented by rectangles in the figure, is labeled with themaximum residual damage that can propagate to it fromthe child subtree and (+) the damage value that can occurat the node itself. A triangular node represents the securitycontrols that can disable that node. The individual damagevalue is accrued to the residual damage from the child nodeonly if the attached security control, if any, fails.
Figure 8: Compressed attack tree showing residualdamage computation with R3 as security control set.
The solution R3 clearly identifies the existence of the sub-trees ST1 = {{n7, n10}, {n8, n11}, {n9, n12}} and ST2 = {{n3, n7, n10}, {n6, n9, n12}}. In the event of a failure of SC11,n7 would collect a value of 10.8. Since n3 has an AND de-composition with SC7, it will be disabled, thereby not con-tributing its individual damage value of 12 to the residual

damage at that node (10.8). On the other hand, if SC7 fails,SC11 will disable n7 which in turn will disable n3. In fact,in this case the residual damage at n3 would be zero. Simi-larly, n6 and n8 also never propagates a residual damage ofmore than 10.8 to its parent node. Consequently, n2 neverpropagates a value more than 13.5. The individual cost of36 at n1 is never added to this residual damage value of 13.5from n2 since, owing to the AND decomposition, n1 is al-ways falsified by security controls SC3 and SC4, only oneof which is assumed to fail at a time. The solution wiselyapplies security controls covering multiple attack scenarios,and at multiple points in those scenarios to keep the damageto a minimum.
9. CONCLUSION AND FUTURE WORKIn this paper, we addressed the system administrator’s
dilemma, namely, how to select, when needed, a subset ofsecurity hardening measures from a given set so that thetotal cost of implementing these measures is not only mini-mized but also within budget and, at the same time, the costof residual damage is also minimized. One important con-tribution of our approach is the use of an attack tree modelof the network to drive the solution. By using an attack treein the problem we were able to better guide the optimiza-tion process by providing the knowledge about the attributesthat make an attack possible. Further, a systematic analysisenabled us to approach the problem in a modular fashion,providing added information to a decision maker to form aconcrete opinion about the quality of the different trade-offsolutions possible.
The cost model that we adopt in this paper is somewhatsimplistic. We assume that, from a cost of implementationperspective, the security measures are independent of eachother when in real life they may not be so. In addition, wehave assumed that the system administrator’s decision is inno way influenced by an understanding of the cost to breakthe system. Furthermore, the possible decomposition of anattack tree to divide the problem into sub-problems is an in-teresting alternative to explore. Finally, there is a dynamicaspect to the system administrator’s dilemma. During runtime the system administrator may need to revise her de-cision based on emerging security conditions. In future weplan to refine our model to incorporate these scenarios.
10. ACKNOWLEDGMENTSThis work was partially supported by the U.S. Air Force
Office of Scientific Research under contract FA9550-07-1-0042. The views and conclusions contained in this documentare those of the authors and should not be interpreted asrepresenting official policies, either expressed or implied, ofthe U.S. Air Force or other federal government agencies.
11. REFERENCES[1] Ammann, P., Wijesekera, D., and Kaushik, S.
Scalable, Graph-Based Network VulnerabilityAnalysis. In Proceedings of the Ninth Conference onComputer and Communications Security(Washington, DC, USA, 2002), pp. 217–224.
[2] Berger, B. Data-centric Quantitative ComputerSecurity Risk Assessment. Information SecurityReading Room, SANS (2003).
[3] Butler, S. Security Attribute Evaluation Method: ACost-benefit Approach. In ICSE 2002: Proceedings of
the 24rd International Conference on SoftwareEngineering (Orlando, FL, USA, 2002), pp. 232–240.
[4] Butler, S., and Fischbeck, P. Multi-attribute RiskAssessment. In Proceedings of SREIS02 in conjunctionof 10th IEEE International Requirements EngineeringConference (Raleigh, NC, USA, 2002).
[5] Coello, C. A. C. An Updated Survey of GA-basedMultiobjective Optimization Techniques. ACMComputing Surveys 32, 2 (2000), 109–143.
[6] Dawkins, J., Campbell, C., and Hale, J. ModelingNetwork Attacks: Extending the Attack TreeParadigm. In Proceedings of the Workshop onStatistical Machine Learning Techniques in ComputerIntrusion Detection (Baltimore, MD, USA, 2002),Johns Hopkins University.
[7] Deb, K. Multi-objective Optimization UsingEvolutionary Algorithms. John Wiley & Sons Inc.,2001.
[8] Deb, K., Pratap, A., Agarwal, S., andMeyarivan, T. A Fast and Elitist MultiobjectiveGenetic Algorithm: NSGA–II. IEEE Transactions onEvolutionary Computation 6, 2 (2002), 182–197.
[9] Goldberg, D. E. Genetic Algorithms in Search,Optimization, and Machine Learning. Addison-Wesley,1989.
[10] Gupta, M., Rees, J., Chaturvedi, A., and Chi, J.Matching Information Security Vulnerabilities toOrganizational Security Policies: A Genetic AlgorithmApproach. Decision Support Systems 41, 3 (2006),592–603.
[11] Jha, S., Sheyner, O., and Wing, J. M. Two FormalAnalysis of Attack Graphs. In Proceedings of the 15thIEEE Computer Security Foundations Workshop(Cape Breton, Nova Scotia, Canada, 2002), pp. 49–63.
[12] Lee, W. Toward Cost-sensitive Modeling for IntrusionDetection and Response. Journal of ComputerSecurity 10, 1 (2002), 5–22.
[13] Moore, A., Ellison, R., and Linger, R. AttackModeling for Information Survivability. Technical NoteCMU/SEI-2001-TN-001, Carnegie Melon University /Software Engineering Institute, March 2001.
[14] Noel, S., Jajodia, S., O’Berry, B., and Jacobs,M. Efficient Minimum-cost Network Hardening viaExploit Dependency Graphs. In Proceedings of the19th Annual Computer Security ApplicationsConference (Las Vegas, NV, USA, 2003), pp. 86–95.
[15] Phillips, C., and Swiler, L. A Graph-BasedSystem for Network-Vulnerability Analysis. InProceedings of the 1998 New Security ParadigmsWorkshop (Chicago, IL, USA, 1998), pp. 71–79.
[16] Ray, I., and Poolsappasit, N. Using Attack Treesto Identify Malicious Attacks from AuthorizedInsiders. In ESORICS 2005 (Milan, Italy, 2005),pp. 231–246.
[17] Schneier, B. Attack Trees. Dr. Dobb’s Journal(1999).
[18] Sheyner, O., Haines, J., Jha, S., Lippmann, R.,and Wing, J. M. Automated Generation andAnalysis of Attack Graphs. In SP 2002: Proceedings ofthe IEEE Symposium on Security and Privacy(Oakland, CA, USA, 2002), pp. 273–284.
[19] Stoneburner, G., Goguen, A., and Feringa, A.Risk Management Guide for Information TechnologySystems. NIST Special Publication 800–30 (2002).
[20] Swiler, L., Phillips, C., Ellis, D., andChakerian, S. Computer-Attack Graph GenerationTool. In Proceedings of the DARPA InformationSurvivability Conference and Exposition II (Anaheim,CA, USA, 2001), pp. 307–321.