optimisation of all-optical network testbed
TRANSCRIPT
Optimisation of All-Optical Network Testbed
Hongqing Zeng1, 2, Alex Vukovic1, Heng Hua1, J. Michel Savoie1 and Changcheng Huang2
1 – Communications Research Centre Canada, 3701 Carling Ave., Ottawa, Ontario, Canada K2H 8S22 – Advanced Optical Network Laboratory, Dept. of Systems and Computer Engineering,
Carleton University, 1125 Colonel By Drive, Ottawa, Ontario, Canada K1S 5B6
ABSTRACT
The capacity and high flexibility potentials of transparentoptical networks have already been realized in practice.By keeping the signal in the optical domain, the opticalnetwork is limited by performance degrading physicaleffects. Link budget design has to take into account bothnoise and distortion related impairments.
A simulation environment is used to analyse wavelengthdivision multiplexing (WDM) transmission links forestablishing an all-optical network (AON) testbed forcarrying out research and development activities. Theprimary focus of numerical modelling was thecharacterisation of signal degradation levels, link powerbudget and end-to-end physical connection for a typicalmetro environment. The simulation outcome was appliedto support the selection of optical components (laser,Mux/Demux, receiver, EDFA, fibre type, attenuators etc.)as well as overall performance of WDM systemcharacterised by bit-error rate (BER). Finally, results ofnumerical analyses are used to assess the feasibility ofconnecting two optical research facilities within a 30 kmdistance.
KEY WORDSWavelength division multiplexing (WDM), physical layer,numerical optimisation, quality of service (QoS), signalimpairments, bit-error rate (BER).
1. INTRODUCTION
Deployment of wavelength division multiplexing (WDM)technology enabled capacity and flexibility potentials oftransparent optical networks to be realised in practice. Intransparent optical networks, signals are mainly kept inthe optical domain while passing through switching,attenuation, multiplexing, demultiplexing, routing andoptical amplification stages. Due to minimised opto-electronic conversion in such networks, all-opticalnetwork (AON) is a prime example of cost-efficient wayof managing bits [1]. However, while transparent AONsoffer numerous advantages, they are also subject to someconstraints. The most important is maintaining the highquality of transmitted signals to guarantee the overallquality of service (QoS) for network users, i.e. guaranteea low bit error ratio (BER). Consequently, the design andoptimisation of all-optical networks have to take intoaccount both noise (amplified spontaneous emission,receiver noise, laser noise, interferometric crosstalk etc.)and distortion (chromatic dispersion, polarisation mode
dispersion, non-linearity, crosstalk etc.) relatedimpairments [2].
A research project involving the investigation of thefeasibility of an all-optical, end-to-end metro WDMnetwork testbed is presented in this paper. The simulationenvironment is used to analyse the WDM physical layertransmission links for the testbed. The primary focus ofnumerical modelling was the characterisation of signaldegradation levels, link budget and end-to-end physicalconnection in typical metro environment. The simulationoutcome and optimisation were applied to support theselection of key optical components (laser, Mux/Demux,receiver, optical amplifier, fibre type, attenuator etc.) aswell as overall performance of WDM systemcharacterised by bit-error rate (BER). Finally, results ofnumerical analyses are used to assess the feasibility ofconnecting two optical research facilities within a 30 kmdistance.
This paper is organised into sections. The designspecification of the testbed is listed based on requiredoverall functionality (Section 2), numerical simulationand optimisation of system parameters and componentparameters (Section 3). In the last part of this paper, weanalyse the numerical results, discuss their applicabilityand make conclusions regarding the potential real networkapplication (Section 4). Future prospective work is alsooutlined.
2. SYSTEM SPECIFICATION
The testbed planning required the all-optical network(AON) functionality to be implemented involving keybuilding blocks for an all-optical end-to-end WDMnetwork [3], [4]. These key building blocks includephotonic cross-connect (PXC) [5], optical add/dropmodule (OADM), multiplexer (MUX), de-multiplexer(DeMUX), transmitter, receiver, and optical amplifier [6].The testbed network requirements are as follows:
- Transmission distance: 10 – 100 km, typical for metroWDM application,
- 4 bi-directional channels at 2.5 Gbps/channel,- 200 GHz channel spacing,- AON functionality in place (signal transmission,
transport, photonic switching with add/drop channel,end-to-end transmissions, amplification, system controland signal reception),
- No signal regeneration along the transmission stage,- Overall system performance: BER≤10-12, i.e. Q≥7.5 dB.
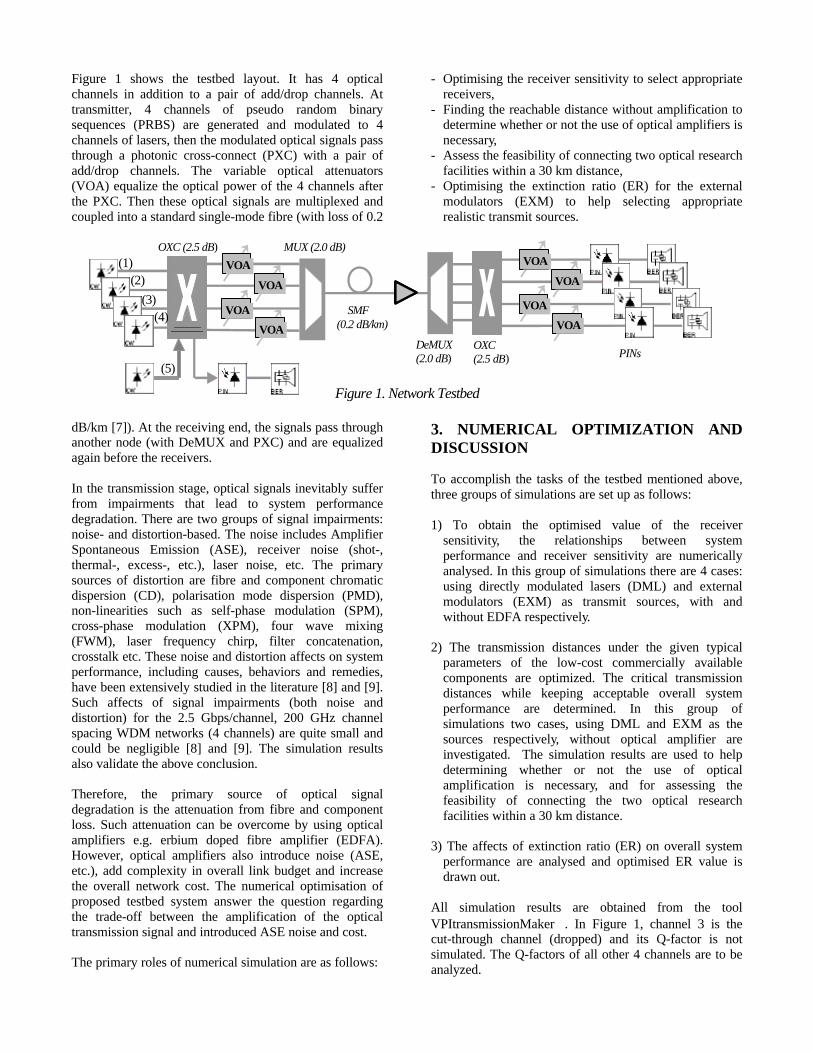
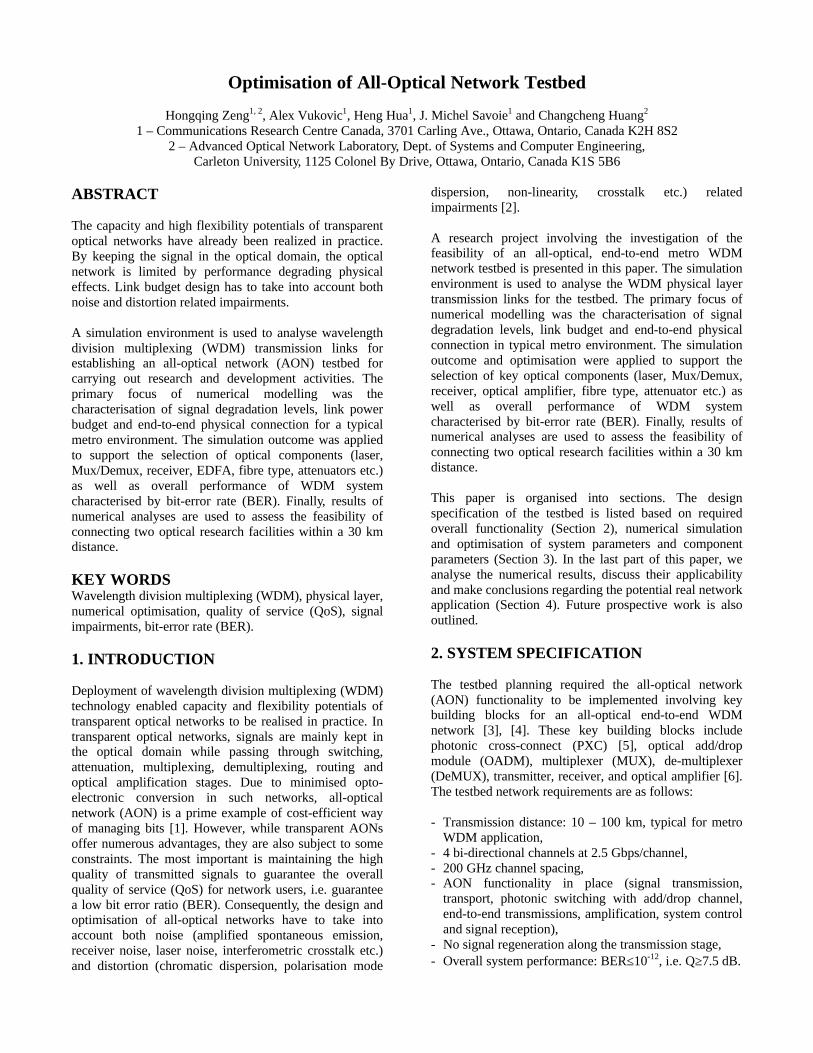
Figure 1 shows the testbed layout. It has 4 opticalchannels in addition to a pair of add/drop channels. Attransmitter, 4 channels of pseudo random binarysequences (PRBS) are generated and modulated to 4channels of lasers, then the modulated optical signals passthrough a photonic cross-connect (PXC) with a pair ofadd/drop channels. The variable optical attenuators(VOA) equalize the optical power of the 4 channels afterthe PXC. Then these optical signals are multiplexed andcoupled into a standard single-mode fibre (with loss of 0.2
dB/km [7]). At the receiving end, the signals pass throughanother node (with DeMUX and PXC) and are equalizedagain before the receivers.
In the transmission stage, optical signals inevitably sufferfrom impairments that lead to system performancedegradation. There are two groups of signal impairments:noise- and distortion-based. The noise includes AmplifierSpontaneous Emission (ASE), receiver noise (shot-,thermal-, excess-, etc.), laser noise, etc. The primarysources of distortion are fibre and component chromaticdispersion (CD), polarisation mode dispersion (PMD),non-linearities such as self-phase modulation (SPM),cross-phase modulation (XPM), four wave mixing(FWM), laser frequency chirp, filter concatenation,crosstalk etc. These noise and distortion affects on systemperformance, including causes, behaviors and remedies,have been extensively studied in the literature [8] and [9].Such affects of signal impairments (both noise anddistortion) for the 2.5 Gbps/channel, 200 GHz channelspacing WDM networks (4 channels) are quite small andcould be negligible [8] and [9]. The simulation resultsalso validate the above conclusion.
Therefore, the primary source of optical signaldegradation is the attenuation from fibre and componentloss. Such attenuation can be overcome by using opticalamplifiers e.g. erbium doped fibre amplifier (EDFA).However, optical amplifiers also introduce noise (ASE,etc.), add complexity in overall link budget and increasethe overall network cost. The numerical optimisation ofproposed testbed system answer the question regardingthe trade-off between the amplification of the opticaltransmission signal and introduced ASE noise and cost.
The primary roles of numerical simulation are as follows:
- Optimising the receiver sensitivity to select appropriatereceivers,
- Finding the reachable distance without amplification todetermine whether or not the use of optical amplifiers isnecessary,
- Assess the feasibility of connecting two optical researchfacilities within a 30 km distance,
- Optimising the extinction ratio (ER) for the externalmodulators (EXM) to help selecting appropriaterealistic transmit sources.
3. NUMERICAL OPTIMIZATION ANDDISCUSSION
To accomplish the tasks of the testbed mentioned above,three groups of simulations are set up as follows:
1) To obtain the optimised value of the receiversensitivity, the relationships between systemperformance and receiver sensitivity are numericallyanalysed. In this group of simulations there are 4 cases:using directly modulated lasers (DML) and externalmodulators (EXM) as transmit sources, with andwithout EDFA respectively.
2) The transmission distances under the given typicalparameters of the low-cost commercially availablecomponents are optimized. The critical transmissiondistances while keeping acceptable overall systemperformance are determined. In this group ofsimulations two cases, using DML and EXM as thesources respectively, without optical amplifier areinvestigated. The simulation results are used to helpdetermining whether or not the use of opticalamplification is necessary, and for assessing thefeasibility of connecting the two optical researchfacilities within a 30 km distance.
3) The affects of extinction ratio (ER) on overall systemperformance are analysed and optimised ER value isdrawn out.
All simulation results are obtained from the toolVPItransmissionMaker. In Figure 1, channel 3 is thecut-through channel (dropped) and its Q-factor is notsimulated. The Q-factors of all other 4 channels are to beanalyzed.
VOA
VOA
VOA
VOA
VOA
VOA
VOA
VOA
(1)(2)
(3)(4)
(5)
OXC (2.5 dB) MUX (2.0 dB)
SMF(0.2 dB/km)
OXC(2.5 dB)
DeMUX(2.0 dB) PINs
Figure 1. Network Testbed
3.1 Receiver
In this group of simulations the appropriate receiversensitivity is selected for the given distance (35km) andrequired system performance (Q ≥ 7.5dΒ). Figure 2 showsthe relationship between Q-factors and receiversensitivities using DML and EXM (with and withoutamplifiers respectively) as transmit sources.
Figure 2(a) shows that when a DML is used as transmitsource and with receiver sensitivity of –18 dB, fibrelength of 35 km, the Q-factor is about 8 dB (worstchannel). Case (b) uses a DML with an EDFA (10 dBgain) and better performance is expected because of theoptical amplification. Case (c) uses an EXM and generallyan external modulator has better performance than adirectly modulated laser, thus (c) has better behaviourthan (a). Finally (d) uses an EXM and an EDFA (10dBgain) so that it has the best system performance.Therefore among the 4 cases in this group of simulations,(a) is the worst case. The simulation results in Figure 2also validate the above analyses. If we can find a receiversensitivity that is good enough for case (a) then it shouldbe OK for all the other cases. Therefore from the resultswe know that receivers with sensitivity higher than –17dB are good enough for connecting the two opticalresearch facilities within a 30 km distance.
With a 10 dB gain EDFA, in cases (b) and (d), thetransmission distance is expected to be extended by 50kmbased on a fibre loss of 0.2 dB/km [7]. But the simulationsshow that with an EDFA (10 dB gain) and a 50 km longerfibre length, the Q-factor is slightly lower than theoriginal cases (a) and (c) respectively. The primary reasonis due to the ASE noise introduced by optical amplifier.
3.2 Critical transmission distance
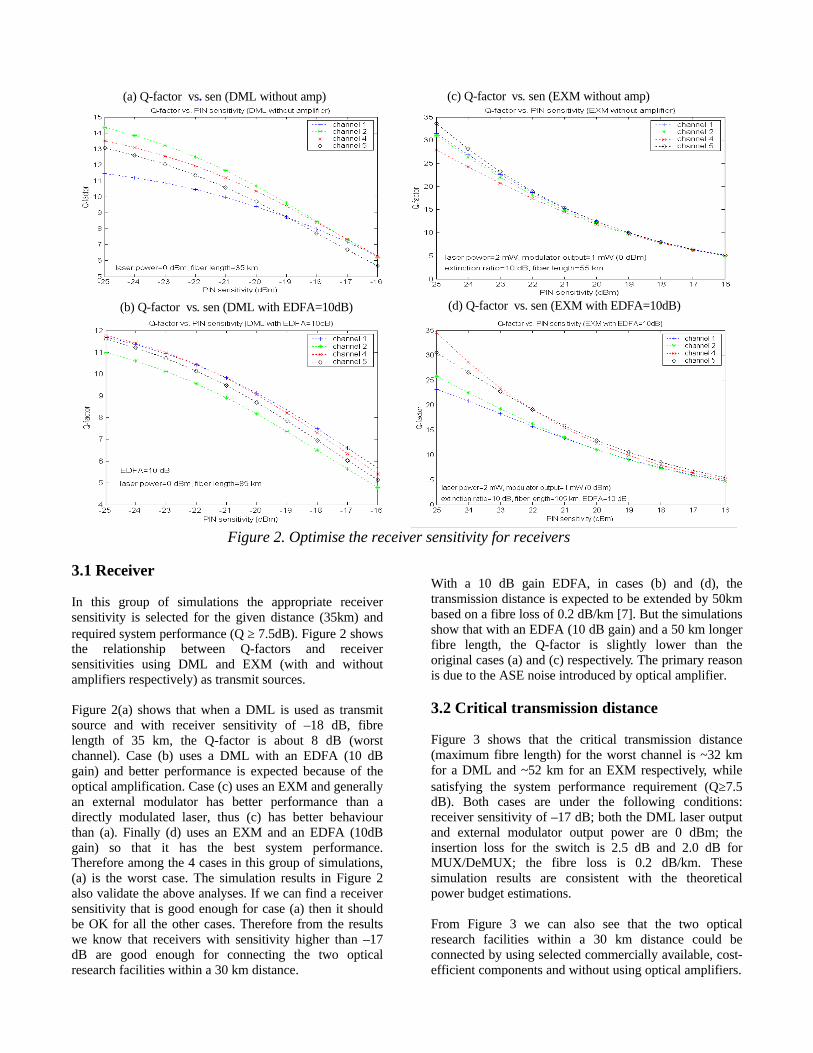
Figure 3 shows that the critical transmission distance(maximum fibre length) for the worst channel is ~32 kmfor a DML and ~52 km for an EXM respectively, whilesatisfying the system performance requirement (Q≥7.5dB). Both cases are under the following conditions:receiver sensitivity of –17 dB; both the DML laser outputand external modulator output power are 0 dBm; theinsertion loss for the switch is 2.5 dB and 2.0 dB forMUX/DeMUX; the fibre loss is 0.2 dB/km. Thesesimulation results are consistent with the theoreticalpower budget estimations.
From Figure 3 we can also see that the two opticalresearch facilities within a 30 km distance could beconnected by using selected commercially available, cost-efficient components and without using optical amplifiers.
(a) Q-factor vs. sen (DML without amp) (c) Q-factor vs. sen (EXM without amp)
(b) Q-factor vs. sen (DML with EDFA=10dB) (d) Q-factor vs. sen (EXM with EDFA=10dB)
Figure 2. Optimise the receiver sensitivity for receivers

3.3 Extinction ratio of external modulators
The affects of extinction ratio on the system performanceare investigated. From Figure 4 we find the systemperformance is improved (Q-factors increase) along withthe increase of the extinction ratio (ER) of externalmodulators. In both cases (a) and (b) the Q-factorsincrease almost linearly when the ER ≤ 10 dB. However,when the ER exceeds a certain value (12 dB) the Q-factors increase very slowly. That means the systemperformance cannot be improved by increasing the ERunlimitedly. Therefore, considering the cost for increasingthe ER, we find that an ER of 10 dB is the optimisedvalue for our particular application.
Similar to Figures 2(b) and (d), in Figure 4(b) with a 10dB gain EDFA the transmission distance is expected to beextended by 50 km based on a fibre loss of 0.2 dB/km [7]
while getting the same Q-factor. But the simulation resultin Figure 4(b) shows that with a 50 km longer fibre lengththe Q factor is slightly lower than the original case inFigure 4(a). The primary reason is due to the ASE noiseintroduced by the EDFA.
4. CONCLUSIONS
An all-optical research network testbed for carrying outresearch and development activities is proposed and somekey signal impairments are analysed. The numericaloptimisation of the key parameters of the realistic devicesare also obtained and used for helping select commercialnetwork components. From the simulation results, theoptimised receiver sensitivity is –17 dB for the requiredoverall system performance (Q≥7.5 dB). The optimisedextinction ratio for external modulators is 10 dB;increasing the ER above this value cannot improve thesystem performance efficiently. The reachable
(a) Q-factor vs. fiber length (DML without amp) (b) Q-factor vs. fiber length (EXM without amp)
Figure 3. Critical transmission distance: Q-factor vs. fiber length
(b) Q-factor vs. ER (EXM with EDFA=10 dB)(a) Q-factor vs. ER (EXM without amp)
Figure 4. Relationship between Q-factor and ER (EXM)

transmission distances without optical amplification are~32 km for directly modulated lasers and ~52 km forexternal modulators respectively. Thus it is possible toconnect the two optical research facilities within a 30 kmdistance without optical amplification.
Future prospective work might consist of upgrading thetestbed with increasing the channel data rate to 10 and 40Gbps, adding more channels, and reducing channelspacing (e.g. 100 GHz). Furthermore, after theverification and validation of the testbed, a set ofexperiments and research activities will be scheduledusing the testbed.
ACKNOWLEDGEMENTS
The authors would like to acknowledge the assistance andsupport of VPIsystems.
REFERENCE
[1] A. A. M. Saleh and J. M. Simmons, ArchitecturalPrinciples of Optical Regional and Metropolitan AccessNetworks, Journal Lightwave Technology, Vol. 17, Dec.1999, 2431-2448[2] A. Vukovic, J. M. Savoie, H. Hua, Dynamic OpticalNetworks – Importance of performance monitoring, CITOTech Talk Workshop on “Control for Optical Networks –Optimizing the Opto-electronics Boundaries”, Ottawa,Dec. 2002[3] Alex Vukovic, All-Optical Network Demonstrator,Next Generation Optical Communication OPRAWorkshop, Ottawa, April 2002[4] J. Michel Savoie, Broadband & Optical Networks(RBON), CRC report, 2002[5] A. Vukovic, J. M. Savoie, H. Hua, Switching in All-Optical Networks, IEEE Bandwidth ManagementWorkshop, Niagara – on the lake, June 2003[6] Alan E. Willner, et al, Key Building Blocks for All-Optical Networks, IEICE Trans. Communication, Vol.E83-B, No. 10 Oct. 2000[7] EXFO, Understanding, Measuring and ControllingOptical Loss, Wave Review, Vol. 9, No. 1, Jan. 2003[8] N. Antoniades, et al, Engineering the performance ofDWDM metro networks, Proc. NFOEC’00, vol. 1,Denver, CO, 2000, 204-211[9] Neophytos Antoniades, et al, PerformanceEngineering and Topological Design of Metro WDMOptical Networks Using Computer Simulation, IEEEJournal on Selected Areas in Communications, Vol. 20,No. 1, Jan. 2002, 149-165[10] Douglas Marquis, Bossnet: An All-Optical LongHaul Networking Testbed, Lasers and Electro-OpticsSociety 2000 Annual Meeting, Vol. 1, 2000, 29 -30[11] N. M. Froberg, et al, The NGI ONRAMP Test Bed:Reconfigurable WDM Technology for next GenerationRegional Access Networks, Journal of LightwaveTechnology, Vol. 18, No.12, Dec. 2000, 1697-1708[12] Ioannis Tomkos, et al, Metro Network Utilizing 10-
Gb/s Directly Modulated Laser and Negative DispersionFiber, IEEE Photonics Technology Letters, Vol. 14, No. 3,March 2002, 408-410