optimisation of biomass, exopolysaccharide and ... · nilai, 71800, nilai, ... 21 aims microbiology...
TRANSCRIPT

AIMS Microbiology, 5(1): 19–38.
DOI: 10.3934/microbiol.2019.1.19
Received: 10 November 2018
Accepted: 16 January 2019
Published: 22 January 2019
http://www.aimspress.com/journal/microbiology
Research article
Optimisation of biomass, exopolysaccharide and intracellular
polysaccharide production from the mycelium of an identified
Ganoderma lucidum strain QRS 5120 using response surface
methodology
Sugenendran Supramani1, Rahayu Ahmad
2, Zul Ilham
3, Mohamad Suffian Mohamad
Annuar3, Anita Klaus
4 and Wan Abd Al Qadr Imad Wan-Mohtar
1,*
1 Functional Omics and Bioprocess Development Laboratory, Institute of Biological Sciences,
Faculty of Science, University of Malaya, 50603, Kuala Lumpur, Malaysia 2
Halal Action Laboratory, Kolej Permata Insan, University Sains Islam Malaysia, Bandar Baru
Nilai, 71800, Nilai, Negeri Sembilan, Malaysia 3
Institute of Biological Sciences, Faculty of Science, University of Malaya, 50603, Kuala Lumpur,
Malaysia 4
Institute for Food Technology and Biochemistry, Faculty of Agriculture, University of Belgrade,
Nemanjina 6, 11080 Belgrade, Serbia
* Correspondence: Email: [email protected]; Tel: +0379674128.
Abstract: Wild-cultivated medicinal mushroom Ganoderma lucidum was morphologically identified
and sequenced using phylogenetic software. In submerged-liquid fermentation (SLF), biomass,
exopolysaccharide (EPS) and intracellular polysaccharide (IPS) production of the identified
G. lucidum was optimised based on initial pH, starting glucose concentration and agitation rate
parameters using response surface methodology (RSM). Molecularly, the G. lucidum strain QRS
5120 generated 637 base pairs, which was commensurate with related Ganoderma species. In RSM,
by applying central composite design (CCD), a polynomial model was fitted to the experimental data
and was found to be significant in all parameters investigated. The strongest effect (p < 0.0001) was
observed for initial pH for biomass, EPS and IPS production, while agitation showed a significant

20
AIMS Microbiology Volume 5, Issue 1, 19–38.
value (p < 0.005) for biomass. By applying the optimized conditions, the model was validated and
generated 5.12 g/L of biomass (initial pH 4.01, 32.09 g/L of glucose and 102 rpm), 2.49 g/L EPS
(initial pH 4, 24.25 g/L of glucose and 110 rpm) and 1.52 g/L of IPS (and initial pH 4, 40.43 g/L of
glucose, 103 rpm) in 500 mL shake flask fermentation. The optimized parameters can be upscaled
for efficient biomass, EPS and IPS production using G. lucidum.
Keywords: Ganoderma lucidum; response surface methodology; submerged-liquid fermentation;
exopolysaccharide; intracellular polysaccharide
1. Introduction
Ganoderma lucidum is a mushroom traditionally used in Chinese medicine for the prevention
and treatment of human disease. Studies on G. lucidum and its products have reported beneficial
biological, health-preserving and therapeutic effects [1–5]. Fungal polysaccharide has been shown to
possess antioxidant, anti-inflammatory, antibacterial, antifungal and antiviral activities [4,6–10], and
can be obtained via solid substrate fermentation (SSF) or submerged-liquid fermentation (SLF).
However, owing to the inherent nature of the solid substrate in SSF, fungal growth occurs through
mycelial colonization of the substrate bed [11]. Furthermore, poor mass transfer and heterogeneity
issues within solid matrix render polysaccharide production in SSF a highly time-consuming method.
SLF has been shown to be superior to SSF in this respect [11,12].
In SLF, a suspended biomass grows as a cluster of mycelia that eventually stabilize to form
pellets [13] in the form of densely branched hyphae forming a compact ovoid shape. Fungal
polysaccharide exists in two forms, exopolysaccharide (EPS) and intracellular polysaccharide (IPS).
EPS is secreted outside the mycelium whereas IPS is produced inside the mycelium [10,14].
Generally, total polysaccharide content produced by the mushroom thus comprises both EPS and IPS.
Many factors affect the cultivation of biomass and polysaccharide production in SLF, including pH,
agitation speed, oxygen transfer rate (OTR), glucose concentration and temperature [15,16].
Hence, to enhance the cultivation of biomass and polysaccharide production in SLF, where the
key parameters interact with each other in a complex manner, response surface methodology (RSM)
represents the most effective solution compared with the one-factor-at-a-time (OFAAT) method [15].
In this study, RSM was used to study the interaction and correlation between the set of experimental
variables and obtained results, and to subsequently establish the optimised conditions. The medicinal
mushroom G. lucidum was subjected to morphological and molecular analyses prior to liquid
fermentation. Next, a preliminary study was conducted using the OFAAT method to obtain baseline
data and the working ranges of the selected SLF parameters, prior to the optimisation of biomass,
exopolysaccharide (EPS) and intracellular polysaccharide (IPS) production. The selected parameters
were initial pH, glucose concentration and agitation rate.
21
AIMS Microbiology Volume 5, Issue 1, 19–38.
2. Materials and methods
2.1. Molecular characterisation
2.1.1. Mushroom mycelium
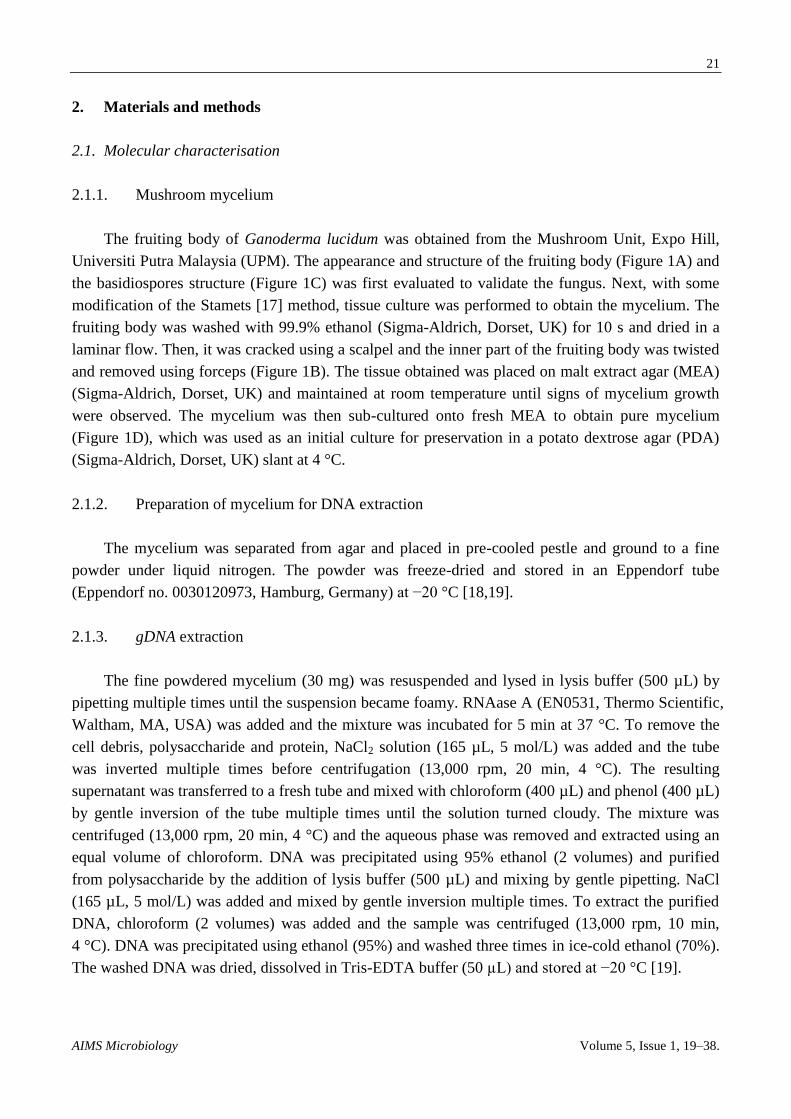
The fruiting body of Ganoderma lucidum was obtained from the Mushroom Unit, Expo Hill,
Universiti Putra Malaysia (UPM). The appearance and structure of the fruiting body (Figure 1A) and
the basidiospores structure (Figure 1C) was first evaluated to validate the fungus. Next, with some
modification of the Stamets [17] method, tissue culture was performed to obtain the mycelium. The
fruiting body was washed with 99.9% ethanol (Sigma-Aldrich, Dorset, UK) for 10 s and dried in a
laminar flow. Then, it was cracked using a scalpel and the inner part of the fruiting body was twisted
and removed using forceps (Figure 1B). The tissue obtained was placed on malt extract agar (MEA)
(Sigma-Aldrich, Dorset, UK) and maintained at room temperature until signs of mycelium growth
were observed. The mycelium was then sub-cultured onto fresh MEA to obtain pure mycelium
(Figure 1D), which was used as an initial culture for preservation in a potato dextrose agar (PDA)
(Sigma-Aldrich, Dorset, UK) slant at 4 °C.
2.1.2. Preparation of mycelium for DNA extraction
The mycelium was separated from agar and placed in pre-cooled pestle and ground to a fine
powder under liquid nitrogen. The powder was freeze-dried and stored in an Eppendorf tube
(Eppendorf no. 0030120973, Hamburg, Germany) at −20 °C [18,19].
2.1.3. gDNA extraction
The fine powdered mycelium (30 mg) was resuspended and lysed in lysis buffer (500 µL) by
pipetting multiple times until the suspension became foamy. RNAase A (EN0531, Thermo Scientific,
Waltham, MA, USA) was added and the mixture was incubated for 5 min at 37 °C. To remove the
cell debris, polysaccharide and protein, NaCl2 solution (165 µL, 5 mol/L) was added and the tube
was inverted multiple times before centrifugation (13,000 rpm, 20 min, 4 °C). The resulting
supernatant was transferred to a fresh tube and mixed with chloroform (400 µL) and phenol (400 µL)
by gentle inversion of the tube multiple times until the solution turned cloudy. The mixture was
centrifuged (13,000 rpm, 20 min, 4 °C) and the aqueous phase was removed and extracted using an
equal volume of chloroform. DNA was precipitated using 95% ethanol (2 volumes) and purified
from polysaccharide by the addition of lysis buffer (500 µL) and mixing by gentle pipetting. NaCl
(165 µL, 5 mol/L) was added and mixed by gentle inversion multiple times. To extract the purified
DNA, chloroform (2 volumes) was added and the sample was centrifuged (13,000 rpm, 10 min,
4 °C). DNA was precipitated using ethanol (95%) and washed three times in ice-cold ethanol (70%).
The washed DNA was dried, dissolved in Tris-EDTA buffer (50 µL) and stored at −20 °C [19].

22
AIMS Microbiology Volume 5, Issue 1, 19–38.
Figure 1. Different stages of Ganoderma lucidum QRS 5120 (A) obtained from Expo Hill, Mushroom Unit, University Putra Malaysia. (B)
sliced fruiting body of Ganoderma lcuidum QRS 5120. (C) Basidiospores of Ganoderma lucidum QRS 5120 (Bar = 10 µm). (D) mycelium
of Ganoderma lucidum QRS 5120 (Day 7). (E) pellets formation in submerged fermentation at day 7 (Bar = 0.05 cm).
23
AIMS Microbiology Volume 5, Issue 1, 19–38.
2.1.4. PCR amplification
DNA dissolved in TE buffer (Thermo Fisher no. 12090015, Invitrogen, Waltham, MA, USA)
was brought to room temperature slowly from −20 °C. Using universal primers (ITS1 and ITS4), the
fungal ITS gene was amplified. First, the solution (500 µL) was added to PCR tubes (Eppendorf no.
0030124332, Hamburg, Germany). Then, 0.5 pmol of ITS1 and ITS4 was added following by
deoxynucleotide triphosphates (dNTPs, 200 M each) (Promega no. U1511, Madison, OH, USA),
0.5 U DNA polymerase (Promega no. D1501, Madison, OH, USA), supplied PCR buffer
(ThermoFisher no. 14966123, Platinum II Green PCR Buffer) and water. PCR was performed as
follow: 1 cycle (98 °C for 2 min) for initial denaturation; 25 cycles (98 °C for 15 secs; 60 °C for
30 secs; 72 °C for 30 sec) for annealing and extension, and 1 cycle (72 °C for 10 min) for final
extension of the amplified DNA (Eppendorf Mastercycler gradient, Hamburg, Germany) [20].
2.1.5. PCR-amplified product purification and sequencing
The PCR products were purified and directly sequenced using a 16-capillary 3100 Genetic
Analyser (Applied Biosystem, Foster City, CA, USA). A BigDye® Terminator v3.1 Cycle
Sequencing Kit (Applied Biosystems, Foster City, CA, USA) was used according to the
manufacturer’s protocol.
2.1.6. Data analysis
The obtained gDNA sequence was entered into BLAST. The NCBI Nucleotide Collection (nr/nt)
database was selected and the query was submitted. Sequences producing significant alignment were
identified, and the top 10 hit blast was selected for Multiple Sequencing Alignment (MSA) using
Clustal Omega [21].
2.1.7. Phylogenetic analysis
Using the neighbouring-joining (NJ) in Molecular Evolutionary Genetic Analysis (MEGA-X),
the evolutionary distance (Knuc) of identical fungal species was calculated and a phylogenetic tree
was generated. The species with closest Knuc were considered the same species [21].
2.2. Submerged-liquid fermentation
G. lucidum QRS 5120 was subjected to batch fermentation in a 500-mL Erlenmeyer flask using
the optimal media compositions and growth parameters (Table 1).

24
AIMS Microbiology Volume 5, Issue 1, 19–38.
Table 1. Experimental range and levels of the independent variables.
Independent variables Range and levels
−1 0 1
Initial pH 4 5 6
Glucose (g/L) 10 30 50
Agitation (rpm) 90 100 110
2.2.1. Optimisation of media (initial pH, glucose and agitation) using RSM
Based on the preliminary studies, initial pH was shown to have a high significance for the
responses (mycelial biomass, EPS production and IPS production) [data not shown]. The media
composition of seed culture in the shake flask were constant at (g/L): yeast extract 1 (Oxoid
no. LP0021, Dardilly, France), KH2PO4 0.5 (Bendosen Laboratory Chemicals no. C0637, Bendosen,
Norway), K2HPO4 0.5 (Bendosen Laboratory Chemicals no. C0680-2296192, Bendosen, Norway),
MgSO4 0.5 (Bendosen Laboratory Chemicals no. C0481, Bendosen, Norway), and NH4Cl2 4
(Bendosen Laboratory Chemicals no. C0055, Bendosen, Norway), unless otherwise stated [21]. To
optimise the mycelium biomass, EPS and IPS production, CCD was used. The levels and range of
the variables for this study are shown in Table 1. The lowest level of variables was initial pH 4;
starting glucose concentration = 10 g/L; agitation rate = 90 rpm and the highest level of variables
were initial pH 6; starting glucose concentration = 50 g/L; agitation rate = 110 rpm.
To analyse the impact of factors and their interaction, an empirical model was established based
on a second-order quadratic model for the responses, as shown in Eq 1:
Y = + ∑
+ ∑
+ ∑ ∑
(1)
where Y is the predicted response, is the constant coefficient, is the linear coefficient, is the
interaction coefficient, is the quadratic coefficient and are the coded values.
2.3. Analytical methods
2.3.1. Mycelium biomass
After the tenth day of fermentation, a 50 mL of sample was filtered using a Buchner funnel
filter and the mycelial biomass (Figure 1E) was washed three times with distilled water. The filtered
mycelial was dried in a food dehydrator at 35 °C to a constant weight. The mycelial biomass was
calculated by subtracting the weight of pre-dried filter paper before filtering from the weight of filter
paper with mycelial biomass. To obtain the concentration of mycelial biomass, the value obtained
from the subtraction was multiplied by the dilution factor [12].
25
AIMS Microbiology Volume 5, Issue 1, 19–38.
2.3.2. Exopolysaccharide (EPS)
The supernatant obtained from filtering the mycelial biomass (Section 2.3.1) was mixed with
ethanol (95%; 4 volumes), stirred and maintained at 4 °C overnight. The mixture was then
transferred to a pre-weighed 50 mL Falcon tube and centrifuged (10,000 rpm, 15 min). The
supernatant was discarded upon centrifuging and the pellet was placed in a food dehydrator at the
lowest temperature until a constant weight was achieved. Next, the EPS yield was estimated by
multiplying the dilution factor by the EPS weight [12].
2.3.3. Intracellular polysaccharide (IPS)
After weighing, the filtered mycelial biomass (Section 2.3.1) was mixed with distilled water
(10 volumes). Then, the mixture was sterilised (121 °C, 30 min, 15 psi) in an autoclave and the
mixture was filtered to obtain the supernatant, mixed with ethanol (95%; 4 volumes), stirred and
maintained at 4 °C overnight. Next, the mixture was transferred to a pre-weighed 50 mL Falcon tube
and centrifuged (10,000 rpm, 15 min). The supernatant was discarded, and the pellet was placed in a
food dehydrator at the lowest temperature until a constant weight was achieved. The IPS yield was
estimated by multiplying the dilution factor by the IPS weight [14].
3. Results and discussion
3.1. Molecular characterisation
3.1.1. Gel electrophoresis
Molecular identification of a wild fungal sample is important to determine the species of the
sample [22]. Thus, molecular identification was performed on wild G. lucidum. The base pairs of
wild G. lucidum were estimated using agarose gel electrophoresis under UV light (Figure 2). The
marker (Lane 1) represented the standard curve, and the base pairs of QRS 5120 were estimated to
be 637 bp.

26
AIMS Microbiology Volume 5, Issue 1, 19–38.
Figure 2. Agarose gel electrophoresis of DNA isolated from Ganoderma lucidum
mycelium. Lane 1 corresponds to 10 kb marker. Lane 2 corresponds to negative control
(−ve), Lane 3 corresponds to positive control (+ve) and Lane 4 corresponds to the sample
(QRS_5120).
3.1.2. Phylogenetic tree
Upon sequencing of the product, it was aligned with the top-10 related species as retrieved from
NCBI BLAST. Based on the BLAST reference databases, QRS 5120 was found to be 99% similar to
Ganoderma sp. Detailed phylogenetic analyses (Figure 3) showed the evolutionary distance (Knuc)
values. Clade A showed that G. lucidum QRS 5120 was closely related to G. lucidum isolate 39s
compared with G. lucidum isolate 49s.

27
AIMS Microbiology Volume 5, Issue 1, 19–38.
Figure 3. Phylogenetic tree of Ganoderma lucidum strain QRS_5120 with evolutionary distance. Bar = 0.00020.
28
AIMS Microbiology Volume 5, Issue 1, 19–38.
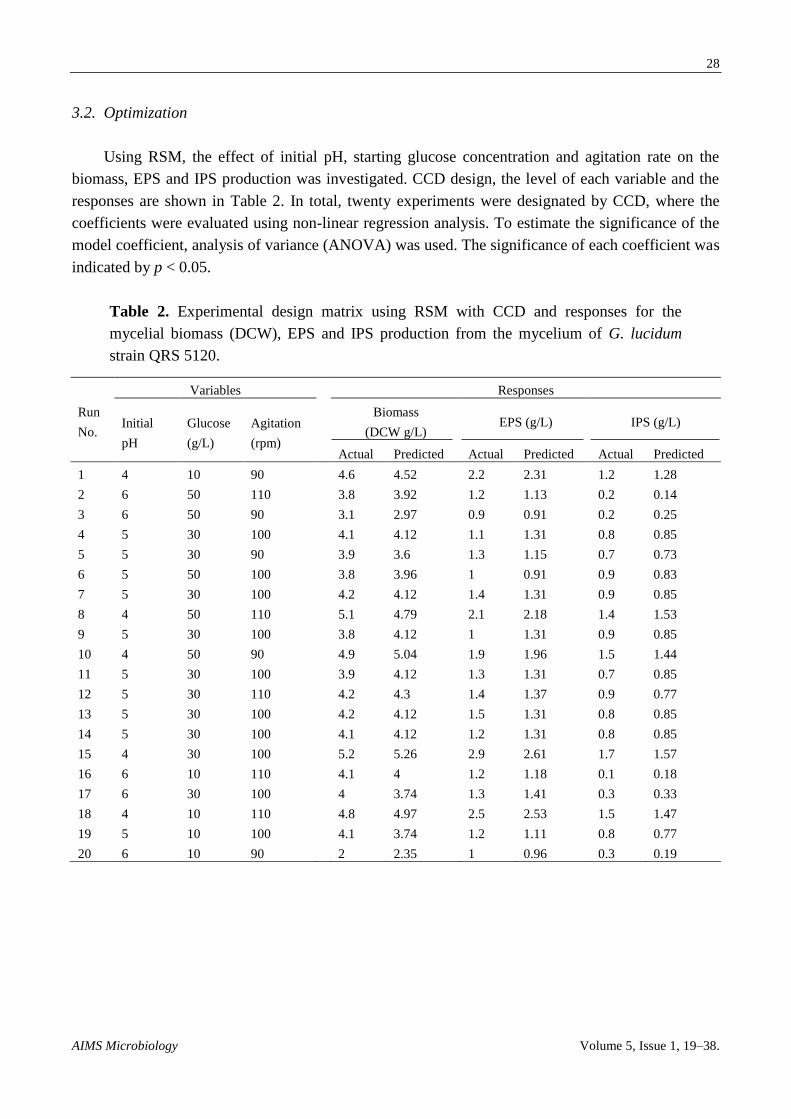
3.2. Optimization
Using RSM, the effect of initial pH, starting glucose concentration and agitation rate on the
biomass, EPS and IPS production was investigated. CCD design, the level of each variable and the
responses are shown in Table 2. In total, twenty experiments were designated by CCD, where the
coefficients were evaluated using non-linear regression analysis. To estimate the significance of the
model coefficient, analysis of variance (ANOVA) was used. The significance of each coefficient was
indicated by p < 0.05.
Table 2. Experimental design matrix using RSM with CCD and responses for the
mycelial biomass (DCW), EPS and IPS production from the mycelium of G. lucidum
strain QRS 5120.
Run
No.
Variables Responses
Initial
pH
Glucose
(g/L)
Agitation
(rpm)
Biomass
(DCW g/L) EPS (g/L) IPS (g/L)
Actual Predicted Actual Predicted Actual Predicted
1 4 10 90 4.6 4.52 2.2 2.31 1.2 1.28
2 6 50 110 3.8 3.92 1.2 1.13 0.2 0.14
3 6 50 90 3.1 2.97 0.9 0.91 0.2 0.25
4 5 30 100 4.1 4.12 1.1 1.31 0.8 0.85
5 5 30 90 3.9 3.6 1.3 1.15 0.7 0.73
6 5 50 100 3.8 3.96 1 0.91 0.9 0.83
7 5 30 100 4.2 4.12 1.4 1.31 0.9 0.85
8 4 50 110 5.1 4.79 2.1 2.18 1.4 1.53
9 5 30 100 3.8 4.12 1 1.31 0.9 0.85
10 4 50 90 4.9 5.04 1.9 1.96 1.5 1.44
11 5 30 100 3.9 4.12 1.3 1.31 0.7 0.85
12 5 30 110 4.2 4.3 1.4 1.37 0.9 0.77
13 5 30 100 4.2 4.12 1.5 1.31 0.8 0.85
14 5 30 100 4.1 4.12 1.2 1.31 0.8 0.85
15 4 30 100 5.2 5.26 2.9 2.61 1.7 1.57
16 6 10 110 4.1 4 1.2 1.18 0.1 0.18
17 6 30 100 4 3.74 1.3 1.41 0.3 0.33
18 4 10 110 4.8 4.97 2.5 2.53 1.5 1.47
19 5 10 100 4.1 3.74 1.2 1.11 0.8 0.77
20 6 10 90 2 2.35 1 0.96 0.3 0.19

29
AIMS Microbiology Volume 5, Issue 1, 19–38.
3.2.1. Optimization of mycelium biomass production
The ANOVA for mycelium biomass production is shown in Table 3. The predicted coefficient
determination indicates that 91.47% (R2 = 0.9147) of the variability in the response can be explained
using this model. The model is significant (p < 0.005). The adjusted coefficient determination value
(Adj. R2 = 0.84) implies the significance of the model and is in reasonable agreement with the
predicted R2 value. By considering the significant terms, the model, in terms of actual variables of
biomass, was regressed and is expressed by Eq 2.
(2)
Table 3. Analysis of variance (ANOVA) for the experimental results of the CCD
quadratic model for biomass from the mycelium of G. lucidum strain QRS_5120.
Source Sum of Squares DF Mean Square F Value Prob > F
Model 8.588136364 9 0.954237374 11.90767001 0.0003 significant
A: pH 5.776 1 5.776 72.07714124 <0.0001
significant
B: Glucose 0.121 1 0.121 1.509926262 0.2473
C: Agitation 1.225 1 1.225 15.28644356 0.0029
significant
A2 0.410511364 1 0.410511364 5.122660238 0.0471
significant
B2 0.191136364 1 0.191136364 2.385138968 0.1535
C2 0.073636364 1 0.073636364 0.918888259 0.3604
AB 0.005 1 0.005 0.062393647 0.8078
AC 0.72 1 0.72 8.984685196 0.0134
significant
BC 0.245 1 0.245 3.057288712 0.1109
Residual 0.801363636 10 0.080136364
Lack of Fit 0.666363636 5 0.133272727 4.936026936 0.0522 not significant
Pure Error 0.135 5 0.027
Cor Total 9.3895 19
Std. Dev. = 0.28308366896796 R2 = 0.91465321514845 Adeq Precision = 14.52399050576
Mean = 4.095 Adjusted R2 = 0.83784110878205
Significant value.
30
AIMS Microbiology Volume 5, Issue 1, 19–38.
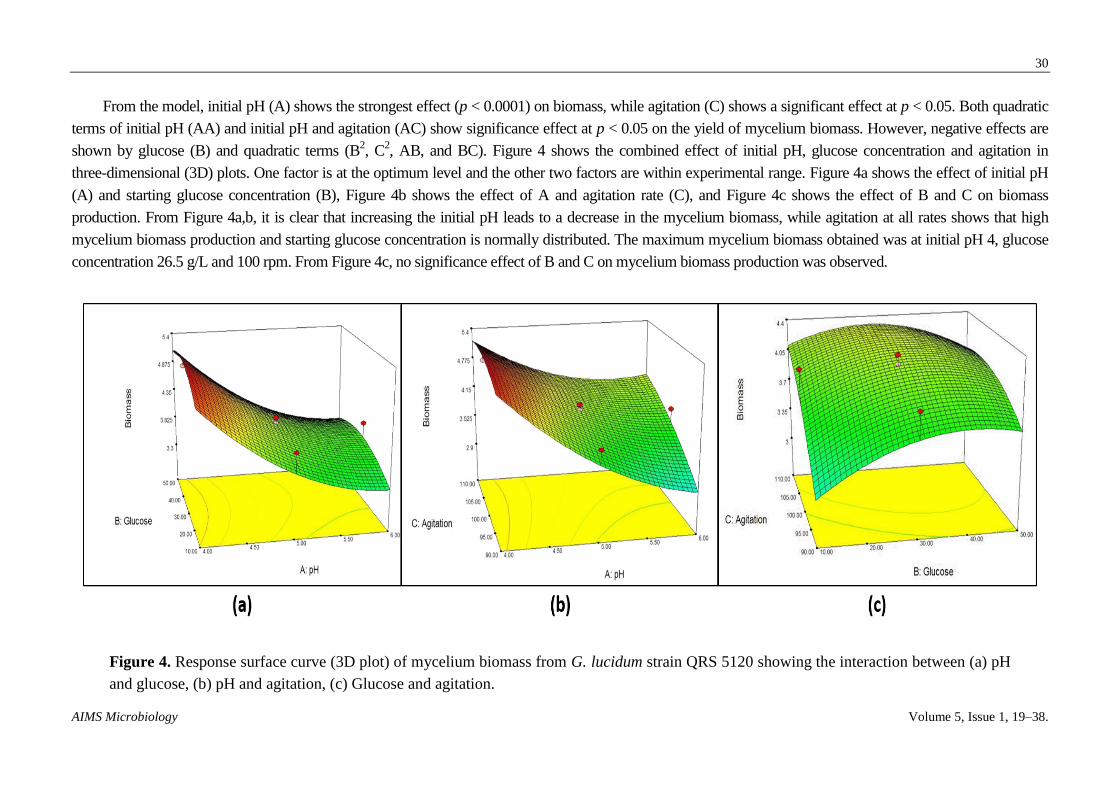
From the model, initial pH (A) shows the strongest effect (p < 0.0001) on biomass, while agitation (C) shows a significant effect at p < 0.05. Both quadratic
terms of initial pH (AA) and initial pH and agitation (AC) show significance effect at p < 0.05 on the yield of mycelium biomass. However, negative effects are
shown by glucose (B) and quadratic terms (B2, C
2, AB, and BC). Figure 4 shows the combined effect of initial pH, glucose concentration and agitation in
three-dimensional (3D) plots. One factor is at the optimum level and the other two factors are within experimental range. Figure 4a shows the effect of initial pH
(A) and starting glucose concentration (B), Figure 4b shows the effect of A and agitation rate (C), and Figure 4c shows the effect of B and C on biomass
production. From Figure 4a,b, it is clear that increasing the initial pH leads to a decrease in the mycelium biomass, while agitation at all rates shows that high
mycelium biomass production and starting glucose concentration is normally distributed. The maximum mycelium biomass obtained was at initial pH 4, glucose
concentration 26.5 g/L and 100 rpm. From Figure 4c, no significance effect of B and C on mycelium biomass production was observed.
Figure 4. Response surface curve (3D plot) of mycelium biomass from G. lucidum strain QRS 5120 showing the interaction between (a) pH
and glucose, (b) pH and agitation, (c) Glucose and agitation.
31
AIMS Microbiology Volume 5, Issue 1, 19–38.
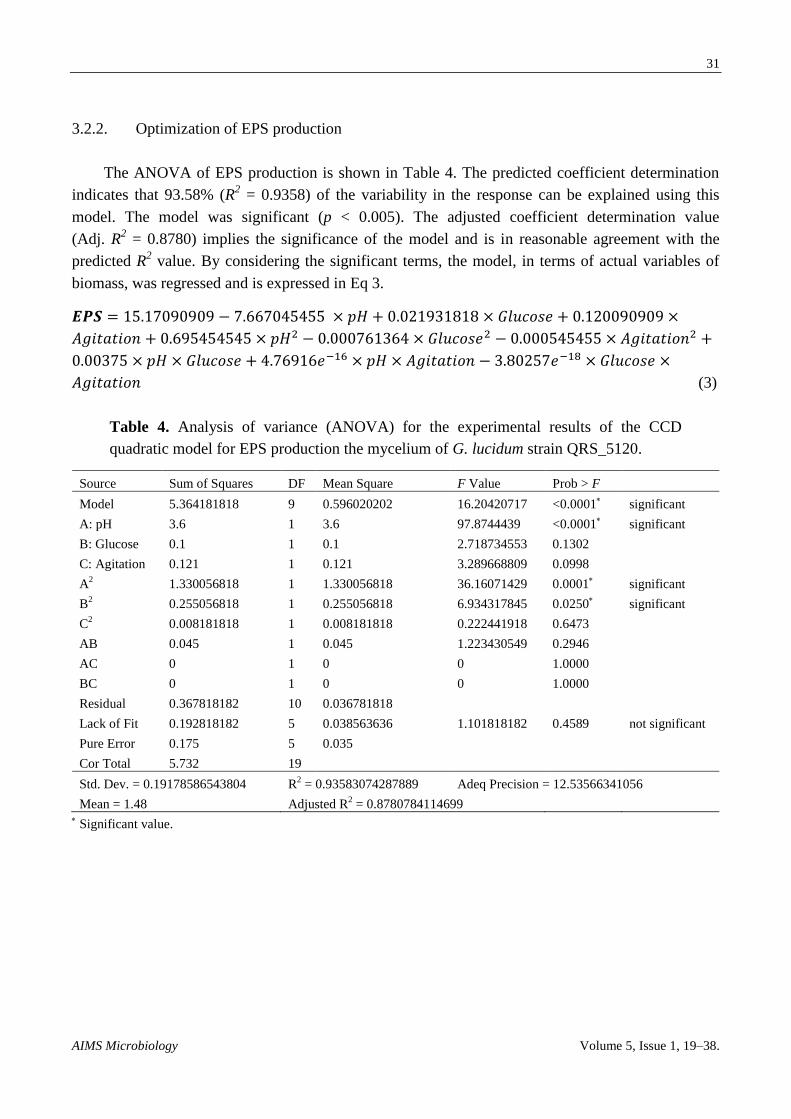
3.2.2. Optimization of EPS production
The ANOVA of EPS production is shown in Table 4. The predicted coefficient determination
indicates that 93.58% (R2 = 0.9358) of the variability in the response can be explained using this
model. The model was significant (p < 0.005). The adjusted coefficient determination value
(Adj. R2 = 0.8780) implies the significance of the model and is in reasonable agreement with the
predicted R2 value. By considering the significant terms, the model, in terms of actual variables of
biomass, was regressed and is expressed in Eq 3.
(3)
Table 4. Analysis of variance (ANOVA) for the experimental results of the CCD
quadratic model for EPS production the mycelium of G. lucidum strain QRS_5120.
Source Sum of Squares DF Mean Square F Value Prob > F
Model 5.364181818 9 0.596020202 16.20420717 <0.0001 significant
A: pH 3.6 1 3.6 97.8744439 <0.0001
significant
B: Glucose 0.1 1 0.1 2.718734553 0.1302
C: Agitation 0.121 1 0.121 3.289668809 0.0998
A2 1.330056818 1 1.330056818 36.16071429 0.0001
significant
B2 0.255056818 1 0.255056818 6.934317845 0.0250
significant
C2 0.008181818 1 0.008181818 0.222441918 0.6473
AB 0.045 1 0.045 1.223430549 0.2946
AC 0 1 0 0 1.0000
BC 0 1 0 0 1.0000
Residual 0.367818182 10 0.036781818
Lack of Fit 0.192818182 5 0.038563636 1.101818182 0.4589 not significant
Pure Error 0.175 5 0.035
Cor Total 5.732 19
Std. Dev. = 0.19178586543804 R2 = 0.93583074287889 Adeq Precision = 12.53566341056
Mean = 1.48 Adjusted R2 = 0.8780784114699
Significant value.

32
AIMS Microbiology Volume 5, Issue 1, 19–38.
From the model, initial pH (A) shows the strongest effect (p < 0.0001) on EPS concentration while both quadratic terms of initial pH (AA)
and initial pH and glucose (BB) show a significance effect at p < 0.005 and p < 0.05, respectively, on EPS production. However, negative effects
are shown by glucose (B), agitation (C) and quadratic terms (C2, AB, AC and BC). Figure 5 shows the combined effect of initial pH, glucose
concentration and agitation in 3D plots. One factor is at the optimum level and the other two factors are within experimental range. Figure 5a
shows the effect of initial pH (A) and starting glucose concentration (B), Figure 5b shows the effect of A and agitation rate (C) and Figure 5c
shows the effect of B and C on biomass production. From Figure 5a,b, increasing initial pH leads decreased EPS production, agitation at all rates
shows high EPS production and starting glucose concentration is normally distributed. The maximum EPS obtained was at initial pH 4, glucose
concentration 26.5 g/L and 100 rpm. From Figure 5c, no significance effect of B and C on mycelium biomass production was observed.
Figure 5. Response surface curve (3D plot) of EPS production from G. lucidum strain QRS 5120 showing the interaction between (a)
pH and glucose, (b) pH and agitation, (c) Glucose and agitation.
33
AIMS Microbiology Volume 5, Issue 1, 19–38.
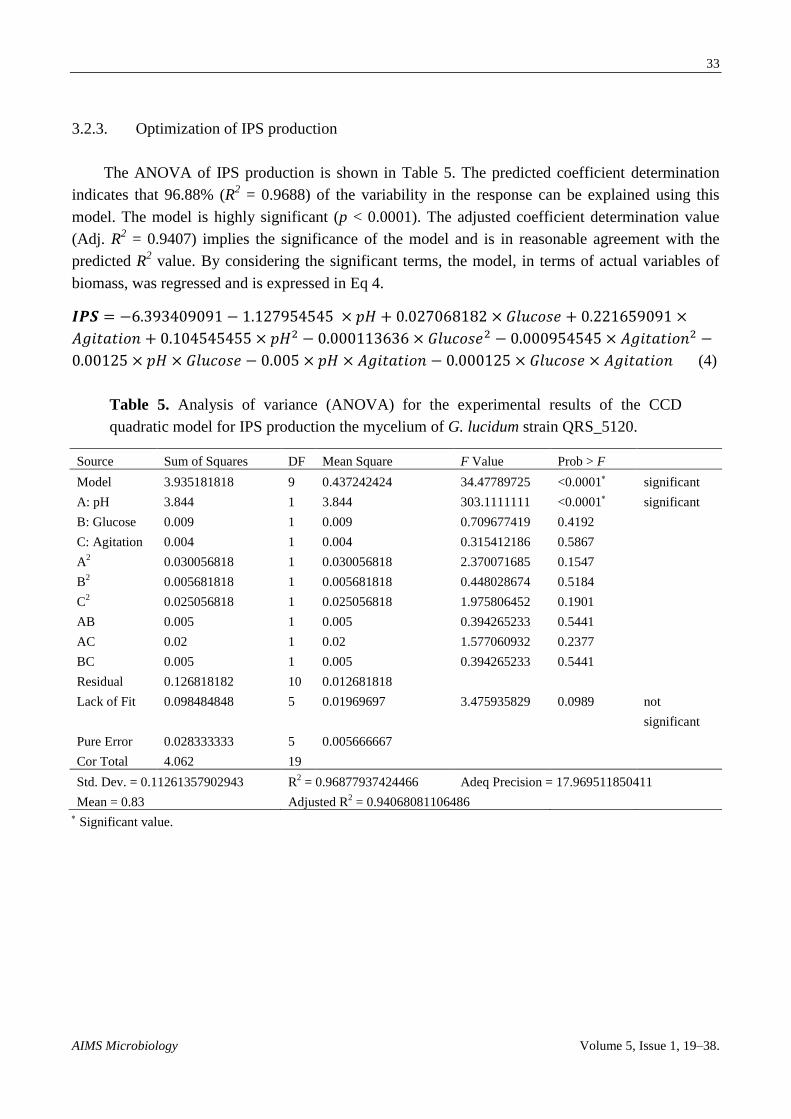
3.2.3. Optimization of IPS production
The ANOVA of IPS production is shown in Table 5. The predicted coefficient determination
indicates that 96.88% (R2 = 0.9688) of the variability in the response can be explained using this
model. The model is highly significant (p < 0.0001). The adjusted coefficient determination value
(Adj. R2 = 0.9407) implies the significance of the model and is in reasonable agreement with the
predicted R2 value. By considering the significant terms, the model, in terms of actual variables of
biomass, was regressed and is expressed in Eq 4.
(4)
Table 5. Analysis of variance (ANOVA) for the experimental results of the CCD
quadratic model for IPS production the mycelium of G. lucidum strain QRS_5120.
Source Sum of Squares DF Mean Square F Value Prob > F
Model 3.935181818 9 0.437242424 34.47789725 <0.0001 significant
A: pH 3.844 1 3.844 303.1111111 <0.0001
significant
B: Glucose 0.009 1 0.009 0.709677419 0.4192
C: Agitation 0.004 1 0.004 0.315412186 0.5867
A2 0.030056818 1 0.030056818 2.370071685 0.1547
B2 0.005681818 1 0.005681818 0.448028674 0.5184
C2 0.025056818 1 0.025056818 1.975806452 0.1901
AB 0.005 1 0.005 0.394265233 0.5441
AC 0.02 1 0.02 1.577060932 0.2377
BC 0.005 1 0.005 0.394265233 0.5441
Residual 0.126818182 10 0.012681818
Lack of Fit 0.098484848 5 0.01969697 3.475935829 0.0989 not
significant
Pure Error 0.028333333 5 0.005666667
Cor Total 4.062 19
Std. Dev. = 0.11261357902943 R2 = 0.96877937424466 Adeq Precision = 17.969511850411
Mean = 0.83 Adjusted R2 = 0.94068081106486
Significant value.

34
AIMS Microbiology Volume 5, Issue 1, 19–38.
From the model, initial pH (A) shows the strongest effect (p < 0.0001) on IPS concentration. However, negative effects are shown by glucose (B), agitation
(C) and quadratic terms (A2, B
2, C
2, AB, AC and BC). Figure 6 shows the combined effect of initial pH, glucose concentration and agitation in 3D plots. One
factor is at the optimum level and the other two factors are within experimental range. Figure 6a shows the effect of initial pH (A) and starting glucose
concentration (B), Figure 6b shows the effect of A and agitation rate (C) and Figure 6c shows the effect of B and C on biomass production. From Figure 6a,b, it
is clear that increasing initial pH leads to decreased IPS production, agitation at all rates shows high IPS production and all concentrations of starting glucose
give high IPS concentration. By this, it was concluded that there was no interaction between the factors. The maximum IPS obtained was at initial pH 4, glucose
concentration 40.45 g/L and 103 rpm. From Figure 6c, no significance effect of B and C on IPS production was observed.
Figure 6. Response surface curve (3D plot) of IPS production from G. lucidum strain QRS 5120 showing the interaction between (a) pH and
glucose, (b) pH and agitation, (c) Glucose and agitation.
35
AIMS Microbiology Volume 5, Issue 1, 19–38.
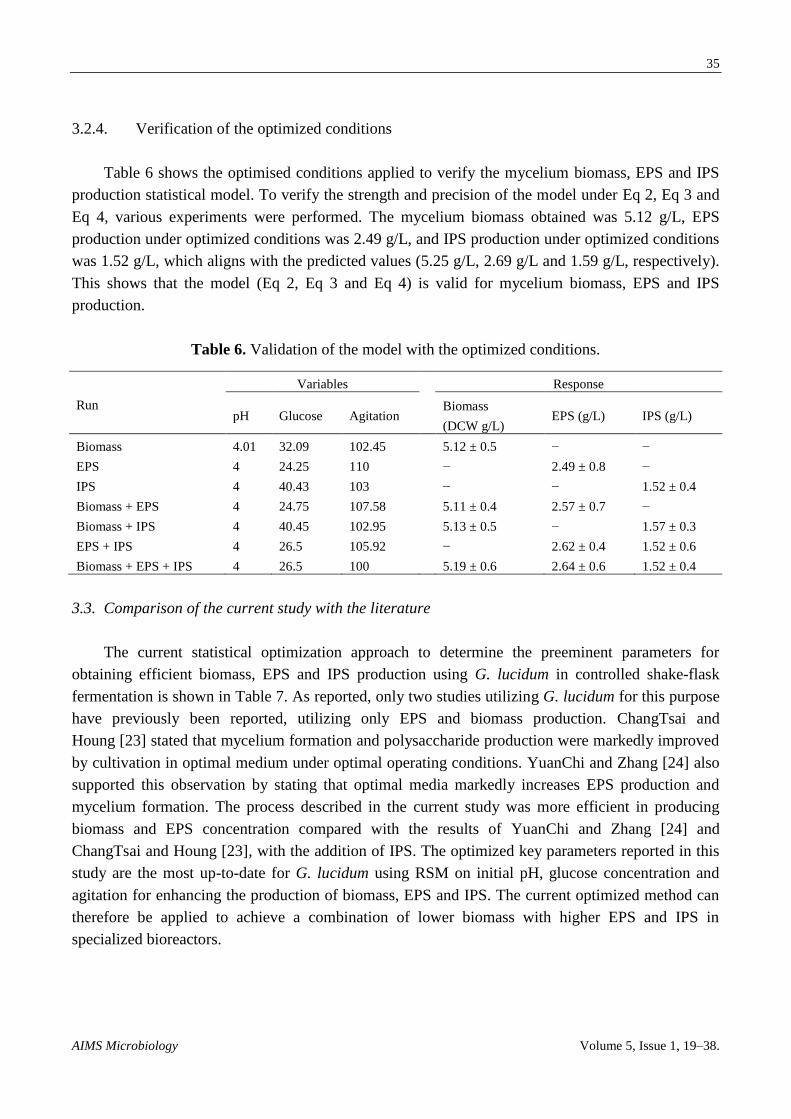
3.2.4. Verification of the optimized conditions
Table 6 shows the optimised conditions applied to verify the mycelium biomass, EPS and IPS
production statistical model. To verify the strength and precision of the model under Eq 2, Eq 3 and
Eq 4, various experiments were performed. The mycelium biomass obtained was 5.12 g/L, EPS
production under optimized conditions was 2.49 g/L, and IPS production under optimized conditions
was 1.52 g/L, which aligns with the predicted values (5.25 g/L, 2.69 g/L and 1.59 g/L, respectively).
This shows that the model (Eq 2, Eq 3 and Eq 4) is valid for mycelium biomass, EPS and IPS
production.
Table 6. Validation of the model with the optimized conditions.
Run
Variables Response
pH Glucose Agitation Biomass
(DCW g/L) EPS (g/L) IPS (g/L)
Biomass 4.01 32.09 102.45 5.12 ± 0.5 − −
EPS 4 24.25 110 − 2.49 ± 0.8 −
IPS 4 40.43 103 − − 1.52 ± 0.4
Biomass + EPS 4 24.75 107.58 5.11 ± 0.4 2.57 ± 0.7 −
Biomass + IPS 4 40.45 102.95 5.13 ± 0.5 − 1.57 ± 0.3
EPS + IPS 4 26.5 105.92 − 2.62 ± 0.4 1.52 ± 0.6
Biomass + EPS + IPS 4 26.5 100 5.19 ± 0.6 2.64 ± 0.6 1.52 ± 0.4
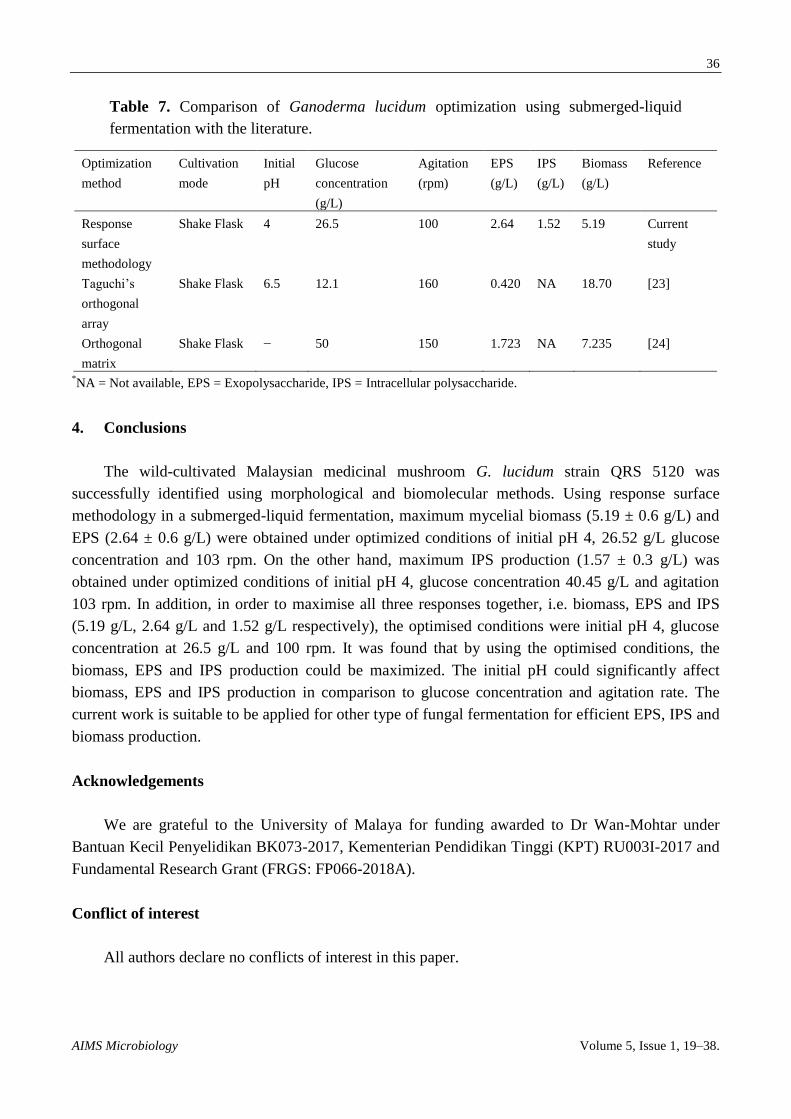
3.3. Comparison of the current study with the literature
The current statistical optimization approach to determine the preeminent parameters for
obtaining efficient biomass, EPS and IPS production using G. lucidum in controlled shake-flask
fermentation is shown in Table 7. As reported, only two studies utilizing G. lucidum for this purpose
have previously been reported, utilizing only EPS and biomass production. ChangTsai and
Houng [23] stated that mycelium formation and polysaccharide production were markedly improved
by cultivation in optimal medium under optimal operating conditions. YuanChi and Zhang [24] also
supported this observation by stating that optimal media markedly increases EPS production and
mycelium formation. The process described in the current study was more efficient in producing
biomass and EPS concentration compared with the results of YuanChi and Zhang [24] and
ChangTsai and Houng [23], with the addition of IPS. The optimized key parameters reported in this
study are the most up-to-date for G. lucidum using RSM on initial pH, glucose concentration and
agitation for enhancing the production of biomass, EPS and IPS. The current optimized method can
therefore be applied to achieve a combination of lower biomass with higher EPS and IPS in
specialized bioreactors.
36
AIMS Microbiology Volume 5, Issue 1, 19–38.
Table 7. Comparison of Ganoderma lucidum optimization using submerged-liquid
fermentation with the literature.
Optimization
method
Cultivation
mode
Initial
pH
Glucose
concentration
(g/L)
Agitation
(rpm)
EPS
(g/L)
IPS
(g/L)
Biomass
(g/L)
Reference
Response
surface
methodology
Shake Flask 4 26.5 100 2.64 1.52 5.19 Current
study
Taguchi’s
orthogonal
array
Shake Flask 6.5 12.1 160 0.420 NA 18.70 [23]
Orthogonal
matrix
Shake Flask − 50 150 1.723 NA 7.235 [24]
*NA = Not available, EPS = Exopolysaccharide, IPS = Intracellular polysaccharide.
4. Conclusions
The wild-cultivated Malaysian medicinal mushroom G. lucidum strain QRS 5120 was
successfully identified using morphological and biomolecular methods. Using response surface
methodology in a submerged-liquid fermentation, maximum mycelial biomass (5.19 ± 0.6 g/L) and
EPS (2.64 ± 0.6 g/L) were obtained under optimized conditions of initial pH 4, 26.52 g/L glucose
concentration and 103 rpm. On the other hand, maximum IPS production (1.57 ± 0.3 g/L) was
obtained under optimized conditions of initial pH 4, glucose concentration 40.45 g/L and agitation
103 rpm. In addition, in order to maximise all three responses together, i.e. biomass, EPS and IPS
(5.19 g/L, 2.64 g/L and 1.52 g/L respectively), the optimised conditions were initial pH 4, glucose
concentration at 26.5 g/L and 100 rpm. It was found that by using the optimised conditions, the
biomass, EPS and IPS production could be maximized. The initial pH could significantly affect
biomass, EPS and IPS production in comparison to glucose concentration and agitation rate. The
current work is suitable to be applied for other type of fungal fermentation for efficient EPS, IPS and
biomass production.
Acknowledgements
We are grateful to the University of Malaya for funding awarded to Dr Wan-Mohtar under
Bantuan Kecil Penyelidikan BK073-2017, Kementerian Pendidikan Tinggi (KPT) RU003I-2017 and
Fundamental Research Grant (FRGS: FP066-2018A).
Conflict of interest
All authors declare no conflicts of interest in this paper.

37
AIMS Microbiology Volume 5, Issue 1, 19–38.
References
1. Adotey G, Quarcoo A, Holliday JC, et al. (2011) Effect of immunomodulating and antiviral
agent of medicinal mushrooms (immune assist 24/7 (TM)) on CD4+T-lymphocyte counts of
HIV-infected patients. Int J Med Mushrooms 13: 109–113.
2. Andoh T, Zhang Q, Yamamoto T, et al. (2010) Inhibitory effects of the methanol extract of
Ganoderma lucidum on mosquito allergy-induced itch-associated responses in mice. J
Pharmacol Sci 114: 292–297.
3. Baig MN, Shahid AA, Ali M (2015) In vitro assessment of extracts of the lingzhi or reishi
medicinal mushroom, Ganoderma lucidum (higher basidiomycetes) against different plant
pathogenic fungi. Int J Med Mushrooms 17: 407–411.
4. Barbieri A, Quagliariello V, Del Vecchio V, et al. (2017) Anticancer and anti-inflammatory
properties of Ganoderma lucidum extract effects on melanoma and triple-negative breast cancer
treatment. Nutrients 9: 210.
5. Batbayar S, Kim MJ, Kim HW (2011) Medicinal mushroom Lingzhi or Reishi, Ganoderma
lucidum (W.Curt.:Fr.) P. Karst., beta-glucan induces toll-like receptors and fails to induce
inflammatory cytokines in NF-kappa B inhibitor-treated macrophages. Int J Med Mushrooms 13:
213–225.
6. Bao XF, Fang JN, Li XY (2001) Structural characterization and immunomodulating activity of a
complex glucan from spores of Ganoderma lucidum. Biosci Biotech Bioch 65: 2384–2391.
7. Trajkovic LMH, Mijatovic SA, Maksimovic-Ivanic DD, et al. (2009) Anticancer properties of
Ganoderma Lucidum methanol extracts in vitro and in vivo. Nutr Cancer 61: 696–707.
8. Wan-Mohtar WAAQ, Young L, Abbott GM, et al. (2016) Antimicrobial properties and
cytotoxicity of sulfated (1,3)-beta-D-glucan from the mycelium of the mushroom Ganoderma
lucidum. J Microbiol Biotechnol 26: 999–1010.
9. Wan-Mohtar WAAQI, Viegelmann C, Klaus A, et al. (2017) Antifungal-demelanizing
properties and RAW264.7 macrophages stimulation of glucan sulfate from the mycelium of the
mushroom Ganoderma lucidum. Food Sci Biotechnol 26: 159–165.
10. Wan-Mohtar WAAQI, Latif NA, Harvey LM, et al. (2016) Production of exopolysaccharide by
Ganoderma lucidum in a repeated-batch fermentation. Biocatal Agr Biotechnol 6: 91–101.
11. Viniegra-Gonzalez G, Favela-Torres E, Aguilar CN, et al. (2003) Advantages of fungal enzyme
production in solid state over liquid fermentation systems. Biochem Eng J 13: 157–167.
12. Wan-Mohtar WAAQI, Malek RA, Harvey LM, et al. (2016) Exopolysaccharide production by
Ganoderma lucidum immobilised on polyurethane foam in a repeated-batch fermentation.
Biocatal Agr Biotechnol 8: 24–31.
13. Espinosa-Ortiz EJ, Rene ER, Pakshirajan K, et al. (2016) Fungal pelleted reactors in wastewater
treatment: Applications and perspectives. Chem Eng J 283: 553–571.
14. Ubaidillah N, Hafizah N, Abdullah N, et al. (2015) Isolation of the intracellular and
extracellular polysaccharides of Ganoderma neojaponicum (Imazeki) and characterization of
their immunomodulatory properties. Electron J Biotech 18: 188–195.
38
AIMS Microbiology Volume 5, Issue 1, 19–38.
15. Ahmad R, Al-Shorgani NKN, Hamid AA, et al. (2013) Optimization of medium components
using response surface methodology (RSM) for mycelium biomass and exopolysaccharide
production by Lentinus squarrosulus. Adv Biosci Biotechnol 4: 1079.
16. Wu FL, Zhang G, Ren A, et al. (2016) The pH-responsive transcription factor PacC regulates
mycelial growth, fruiting body development, and ganoderic acid biosynthesis in Ganoderma
lucidum. Mycologia 108: 1104–1113.
17. Stamets P (1983) The mushroom cultivator: a practical guide to growing mushroom at home.
Chilton, JS.
18. Liao B, Chen X, Han J, et al. (2015) Identification of commercial Ganoderma (Lingzhi) species
by ITS2 sequences. Chin Med 10: 22.
19. Hennicke F, Cheikh-Ali Z, Liebisch T, et al. (2016) Distinguishing commercially grown
Ganoderma lucidum from Ganoderma lingzhi from Europe and East Asia on the basis of
morphology, molecular phylogeny, and triterpenic acid profiles. Phytochemistry 127: 29–37.
20. Hou X, Xiao M, Chen SCA, et al. (2016) Sequencer-based capillary gel electrophoresis (SCGE)
Targeting the rDNA internal transcribed spacer (ITS) regions for accurate identification of
clinically important yeast species. PLoS One 11: e0154385.
21. Park HG, Ko HG, Kim SH, et al. (2004) Molecular identification of Asian isolates of medicinal
mushroom Hericium erinaceum by phylogenetic analysis of nuclear ITS rDNA. J Microbiol
Biotechn 14: 816–821.
22. Parnmen S, Sikaphan S, Leudang S, et al. (2016) Molecular identification of poisonous
mushrooms using nuclear ITS region and peptide toxins: a retrospective study on fatal cases in
Thailand. J Toxicol Sci 41: 65–76.
23. Chang MY, Tsai GJ, Houng JY (2006) Optimization of the medium composition for the
submerged culture of Ganoderma lucidum by Taguchi array design and steepest ascent method.
Enzyme Microb Tech 38: 407–414.
24. Yuan BJ, Chi XY, Zhang RJ (2012) Optimization of exopolysaccharides production from a
novel strain of Ganoderma Lucidum Cau5501 in submerged culture. Braz J Microbiol 43: 490–
497.
© 2019 the Author(s), licensee AIMS Press. This is an open access
article distributed under the terms of the Creative Commons
Attribution License (http://creativecommons.org/licenses/by/4.0)