optimising wastewater networks … · a calibrated hydraulic model of the drainage system, based on...
TRANSCRIPT
1 Sanitary Engineer, SimTejo, SA. [email protected] 2 Environmental Engineer, Hidromod, Lda. [email protected] 3 Civil Engineer, Hidromod, Lda. [email protected] 4 Environmental Engineer, Bentley Systems. [email protected] 5 Civil Engineer, Hidromod, Lda. [email protected]
OPTIMISING WASTEWATER NETWORKS MANAGEMENT: THE EXAMPLE OF THE BEIROLAS SUBSYSTEM
Pedro PÓVOA1, Pedro GALVÃO2, Adélio SILVA3, Pedro PINA4 and Paulo LEITÃO5
ABSTRACT
An efficient information management system and the ability to anticipate problems or to plan operations in an efficient way are critical aspects to wastewater utilities, both because of more demanding environmental regulations and the need to increase systems exploitation efficiency and safety and improve the information to the consumer and to the general public.
Lately, apart from the traditional monitoring programs usage, wastewater utilities have increasingly invested in telemanagement and telemetry systems, producing large quantities of real-time acquired data. On the other hand, there is a growing use of modelling tools to support planning and operations. In spite of these technological advances, though, there is still an enormous deficit in what concerns the data utilisation and its respective transformation into useful information and in what concerns the integration of modelling tools in the daily management and operation actions.
Aiming to improve this situation, it was developed a business intelligence tool, AQUASAFE, capable to integrate in a single platform real time data and forecast and diagnostic tools. According to the implemented concepts, integration is achieved by managing measured data and modelled data in a uniform way.
In this document, AQUASAFE platform’s implementation to the Beirolas subsystem is presented as an example. The objective is to improve the wastewater flow management both in what concerns the drainage network, the waste water treatment plant and the discharges into the Tagus river estuary.
Keywords: Drainage networks, models, data management
1 INTRODUCTION
SIMTEJO has the responsibility of managing the waste water system in Lisbon, namely the Alcântara, Beirolas and Chelas subsystems. These subsystems have separative, unitary and pseudo-separative drainage systems, with pipes made of different materials with different diameters, including special infrastructures such as storm screens, pumping stations, inverted siphons, tidal flap valves, flow control valves, submarine outfall, debris pit and screening stations, which contribute to the high complexity of systems management.
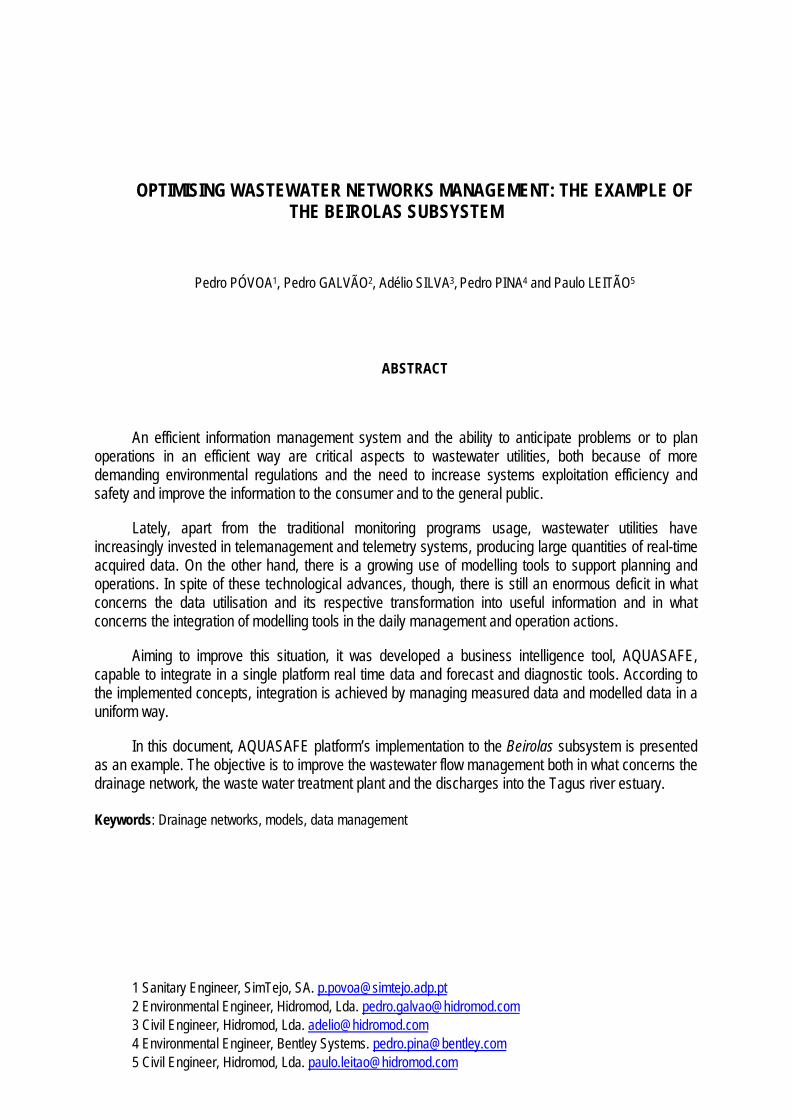
In humid weather conditions, there is an uncontrolled influx of rainwater to the SIMTEJO system, causing floods, the accumulation of large quantities of sand and solid matters and consequently the risk of operational collapse of the system (see Figure 1).
Figure 1 – Rainwater influx to waste water treatment plants.
SIMTEJO has been developing diagnostic studies regarding the behaviour of drainage systems, namely in what concerns the evaluation of their maximum capacity and the discharges in Tagus estuary and the control of the maximum flow to intercept and reroute to wastewater treatment plants (WWTP) in humid weather conditions.
Systematic approaches have been developed and integrated for the Beirolas subsystem as a pilot project, aiming to improve the hydraulic and environmental behaviour of the drainage system and to increase knowledge of the several system components, namely rain gauges and flow meters. In order to achieve these purposes the data collected by the real time sensors is being used together with mathematical models (meteorology, network and receiving waters).
As a result new approach paradigms in data integration systems have progressively gained strength, which will in the future provide an increased capability to process significant amounts of data automatically, resulting in more efficient control and management tools.
AQUASAFE is one of the elements of this strategy, integrating already existing data and models results in order to produce formatted responses to specific operation and management needs. This process, adjusted to the specific needs of different actors, includes the capability to provide diagnostic and forecast capabilities, apart from system gathered data support. Models are, in this case, considered as mere support instruments, once AQUASAFE is not dependent of any specific model, being able to incorporate models already in use. The main objective is always to increase productivity and safety.
In this document, a methodology supported by data and models results integration processes, which constitutes an added value to the management and operation of the Beirolas subsystem, as well as to the protection of the receiving waters, including water quality forecast capabilities, is presented.
1.1 Data and modelling tools integration
Telemetry systems, by allowing the acquisition of real-time data, constitute a valuable monitoring element of network operation conditions, but in order their use become effective it is necessary to add efficient data analysis procedures capable to extract information from the data being measured. This analysis capability is achieved by the existence of algorithms that allow “to look” at what is being measured, interpret this values, “learn” with the building up of experience and, in case of necessity, alerting the operator to some possible anomaly.
In a second stage, adding the models’ diagnostic and forecast capabilities, it is possible to go up to a higher level improving the system’s “learning” ability, which is then based not only upon statistical analysis but also in cause-effect relations. Such a system able to add “virtual sensors” to broaden the network’s monitoring points and to provide forecast and simulation capabilities regarding intervention scenarios.
This is one of the main aspects of the AQUASAFE platform: a structure to allow the management of all required information fluxes, in order to obtain an adequate response in the context of the typical problem management of these drainage systems (overflow and energy management, waste water treatment plants functioning, emergency discharges, etc.). Measured data is imported in real-time and models are periodically executed in forecast mode or, by request, in scenario mode.
AQUASAFE also provides tailor-made solutions to use the client’s already existing infrastructures (databases, sensors, numerical model structures, etc.), as well as personalised interfaces according to the profiles of different users.
2 THE BEIROLAS SUBSYSTEM
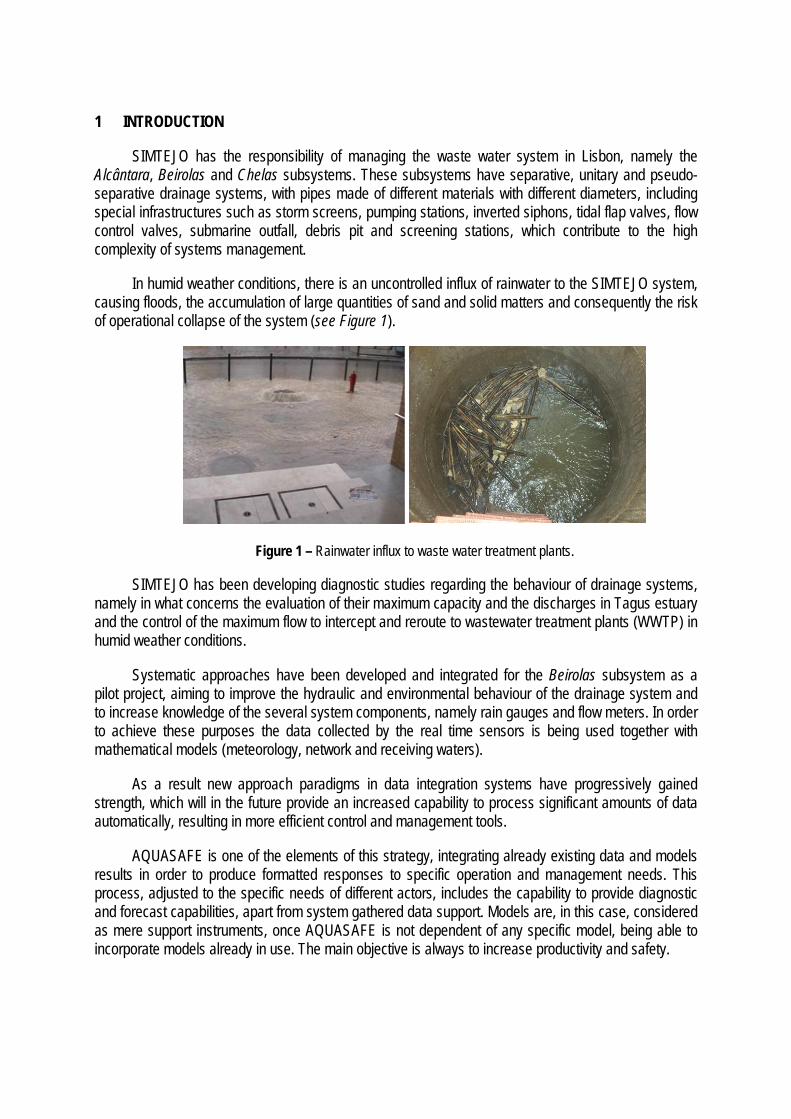
The Beirolas subsystem covers an area of approximately 2730 ha, divided between Loures and Lisbon municipalities, confined to the East by the Tagus river, North by Trancão river, South by the Chelas streams drainage basin and West by the Póvoa de Santo Adrião stream drainage basin (see Figure 2).
Figure 2 – The Beirolas subsystem.
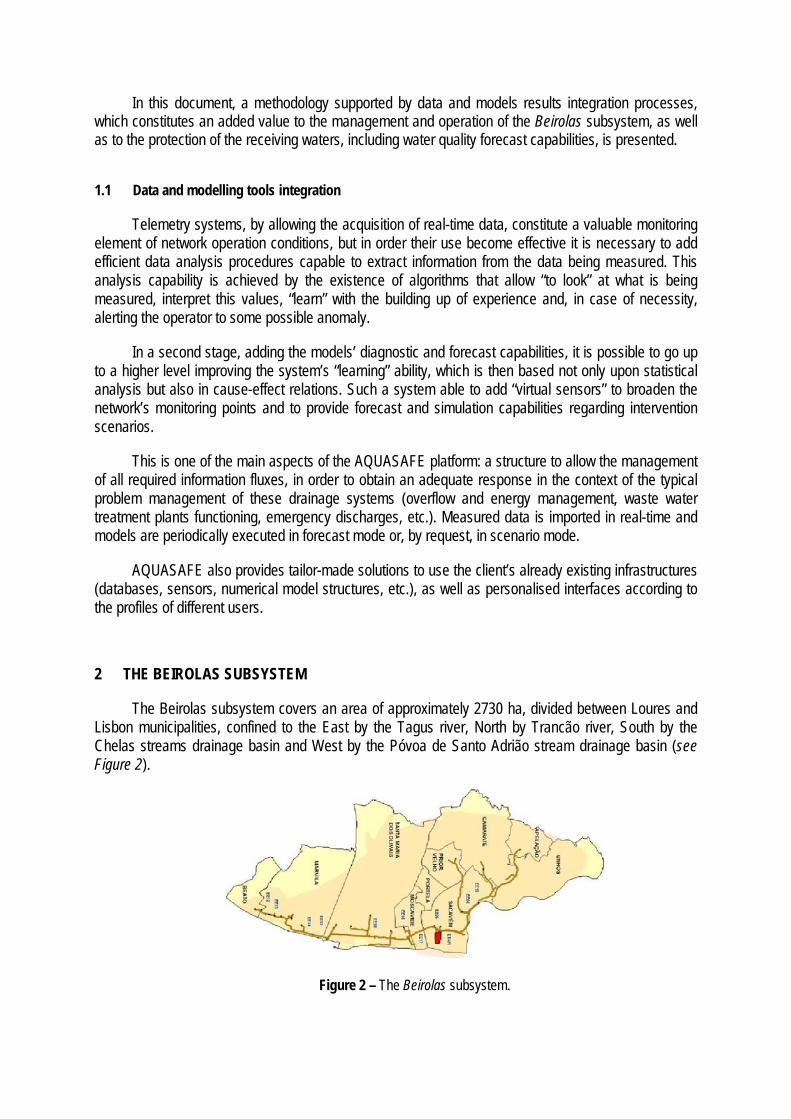
Beirolas WWTP (see Figure 3) is located in Loures municipality, with a treatment capacity of 54,500 m3/day, including a secondary level treatment by dispersed biomass activated sludge and tertiary level treatment by effluent filtering and disinfection. The wastewater produced by 204,000 equivalent inhabitants is drained to this WWTP by the following infrastructures:
Apelação / Catujal / Sacavém interceptor, Solavesso outfall, Santiago neighbourhood outfall, Camarate / Sacavém interceptor, Casal do Muro outfall, Sacavenense interceptor, Portela interceptor, Figo Maduro / Quinta das Pretas interceptor (initial section), eastern Praça da República interceptor, D1 / Figo Maduro outfall, Calçada do Grilo / Beirolas interceptor and Moscavide outfall;
Pumping stations EE18 (Sacavém), EE12, EE13, EE14, EE15, EE16 and EE17 (Beirolas) and their respective ducts.
Figure 3 – Beirolas treatment plant.
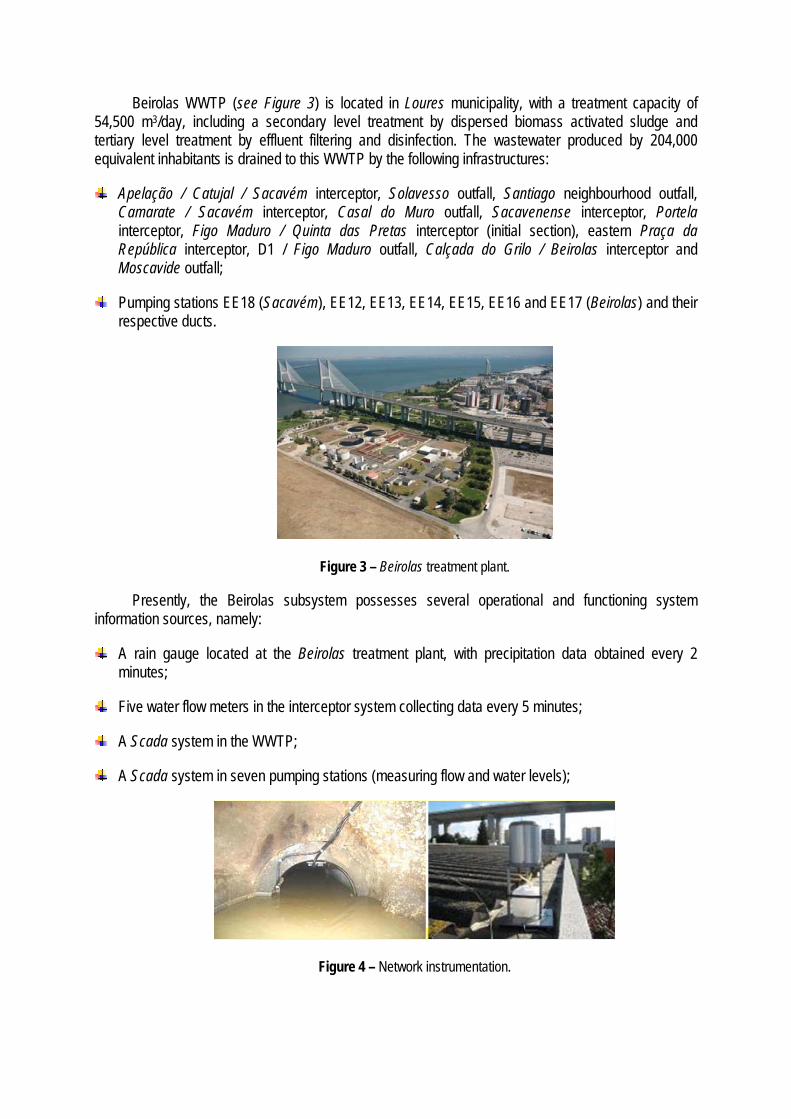
Presently, the Beirolas subsystem possesses several operational and functioning system information sources, namely:
A rain gauge located at the Beirolas treatment plant, with precipitation data obtained every 2 minutes;
Five water flow meters in the interceptor system collecting data every 5 minutes;
A Scada system in the WWTP;
A Scada system in seven pumping stations (measuring flow and water levels);
Figure 4 – Network instrumentation.
Daily composed sampling (static) of the wastewater flowing into the WWTP;
Quality spectrophotometry probe at the WWTP affluent, with sampling every 2 minutes;
A calibrated hydraulic model of the drainage system, based on Bentley’s SewerGems model;
Hydrodynamic model of Tagus estuary.
3 OBJECTIVES
As described above, SIMTEJO is responsible for the management of Lisbon drainage systems, including all types of drainage networks with unitary behaviour, made of different materials and with different diameters, ranging different components (overflows, inverted siphons, all types of transitions, etc.) and ages, with a vast range of problems and possible solutions.
Unitary systems problems come up when intense rain occurs, with the influx of rainwater in significant amounts to the drainage system, resulting in periodic floods transporting large quantities of solids and sand, which may lead to the system’s functioning collapse. In addition, the Lisbon topographic and geographic characteristics have to be considered, including the tide influence on the city’s downtown river front, which implies the existence of tidal flap valves in the system.
Analysing the type and location of the available information, it is evident that the integration of this information is not compatible with a single human capacity. The fact that this information is multidisciplinary, namely in terms of hydrology, urban hydraulics, treatment and estuary systems would imply in itself, at best, specialised technical work by each of these fields.
In order to improve the system efficiency, since 2002 SIMTEJO is promoting several investments regarding the renovation and building of new infrastructures, the implementation of mathematical models to drainage and estuary networks and the implementation of geographic and operational information systems (monitoring and factoring systems). At the same time, a significant improvement has been achieved in communication technologies, allowing the access to telemetry data at reduced costs.
This improved ability to collect data resulted in a necessity for more effective information systems, to allow transformation of this data into effective information, usable by the systems’ users. In this context, SIMTEJO has joined the development of the AQUASAFE platform, contributing with data and operation experience acquired in the Beirolas system.
Based on the AQUASAFE platform it is possible to take into account the management of daily problems associated with the drainage network (including overflows, sewer and pumping stations), treatment plants and discharges in the Tagus estuary. The following specific information management needs have been identified as approachable:
Provide SIMTEJO with mathematical simulations (meteorology, drainage systems, receiving waters) in real-time, without the need for technical specialised knowledge, thus minimising the system’s exploration costs;
Overflow events forecast. Part of the Lisbon drainage system is unitary, so when short and intense rain periods occur, overflow situations usually happen;
Forecast and assessment of uncontrolled discharges in Tagus estuary. These discharges needs to be accounted for and reported in detail to competent environmental authorities;
Maintenance intervention planning, taking tides and weather forecasts into account;
Data bases of historic data, to store proof of specific past situations, if needed;
Comparison between theoretical flow values from the model and flow meters collected values;
Parameter analysis possibility in a short time span, without the need for external programming consultants, such as the daily comparison of the OCD affluent to the treatment plant, with recorded precipitation intensity at the Beirolas rain gauge;
Forecast of the treatment plant entry flow to improve its functioning, including secondary treatment and energy production;
Continuous flow meter functioning status verification. Flow meters are used for factoring, so they produce valuable information for the company. The accumulation of debris in their proximity frequently affects performance. The continuous comparison between model forecasts and real measurements allows a timely detection of occasional flaws and the promotion of quick action from maintenance teams;
Integrated reports production and presentation, in the control room, of geographically dispersed data (scada systems, monitoring stations, model forecast analysis, etc.) which generate information flows usable by the operation;
User interface creation and automatic model run mechanisms, to allow effective modelling tools usage in the context of daily operations. Modelling tools were already in use, but limited to planning activities, so it was necessary to equip the operation with forecast capabilities in real-time. The fulfilment of this requisite included the implementation of periodic execution routines, automatic integration of measured data to define boundary conditions and automatic validation methods (including alert of observed discrepancies between model results and measurements);
Development of sufficiently simple interfaces to allow the system to be managed by non-specialists.
4 INFORMATION MANAGEMENT SYSTEM
4.1 The AQUASAFE concept
The AQUASAFE concept comprises the development of tools and services aiming to improve the systems management efficiency (see Figure 2). The objectives are:
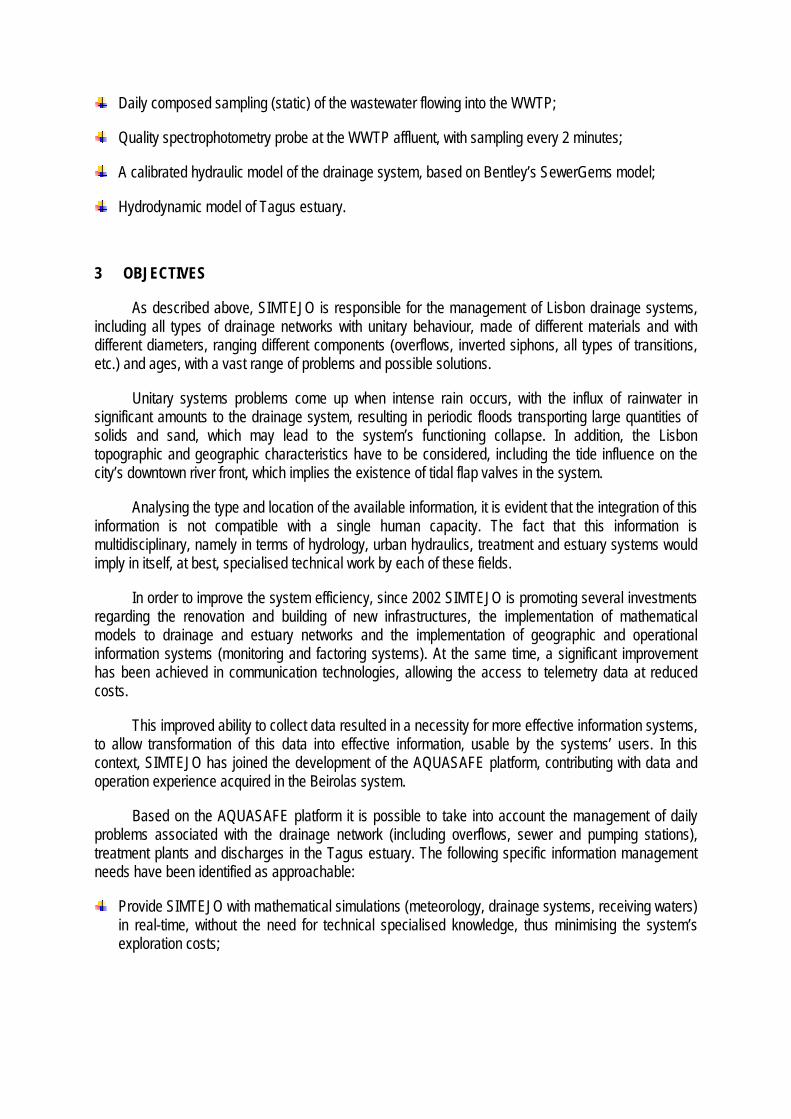
The development of data analysis capabilities in time and space dimensions, converting them to useful information;
The development of diagnostic and forecast capabilities, using modelling tools;
The implementation of automatic alert systems;
The development of effective monitoring strategies, optimising resources and costs;
The use of all available information to support management (decisions regarding the system’s functioning, legal and institutional obligations) and to keep effective communication channels open.
Figure 5 – General architecture.
The reporting component constitutes a fundamental aspect, since it ensures response to the institutional and legal obligations of entities, as well as communication with the public via online publication of the system’s relevant information.
Bearing these characteristics, AQUASAFE is specially indicated to support management and operation (in all kinds of usage that require data management to produce information) and to display, in a usable way, SIMTEJO’s acquired data, as well as model forecasts and execution of a set of operations about this data (measured and modelled), to effectively aid the operation.
4.2 Implemented functionalities in the Beirolas subsystem
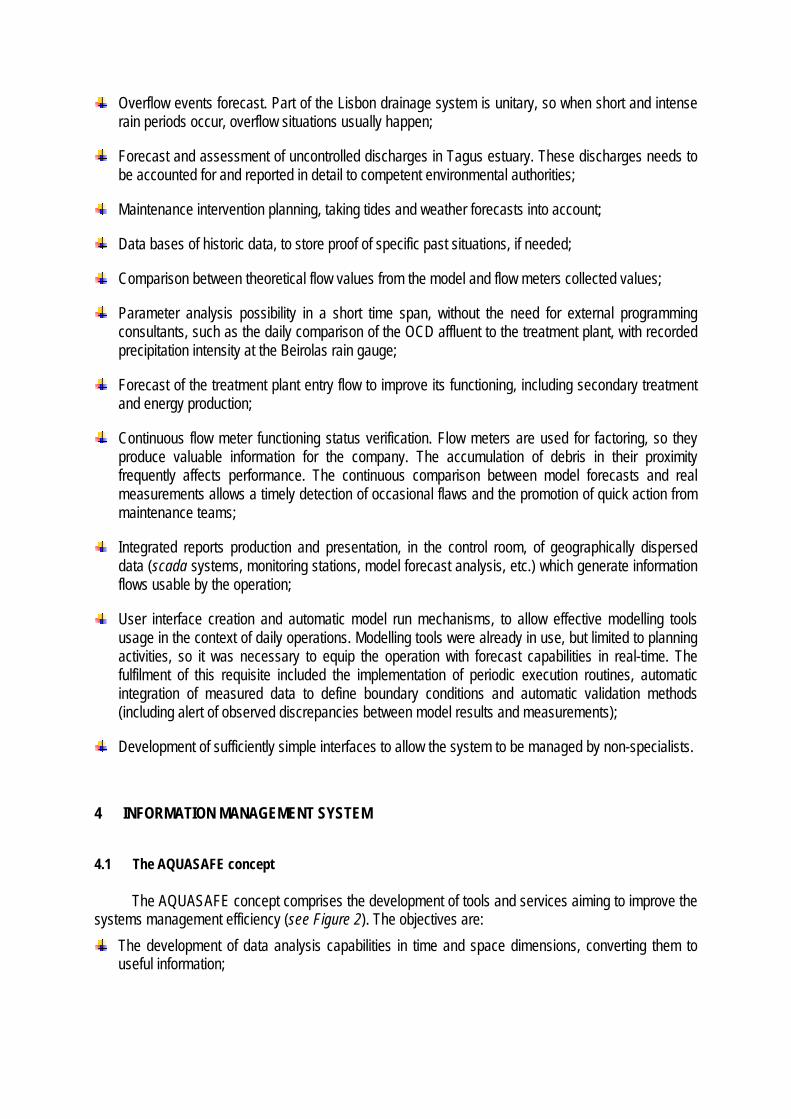
As described in Figure 6, AQUASAFE platform aggregates the available sensor data in SIMTEJO’s internal network. This data, when correctly indexed, may be used in reports and as initial or border conditions of waste water models.
Figure 6 – Information fluxes.
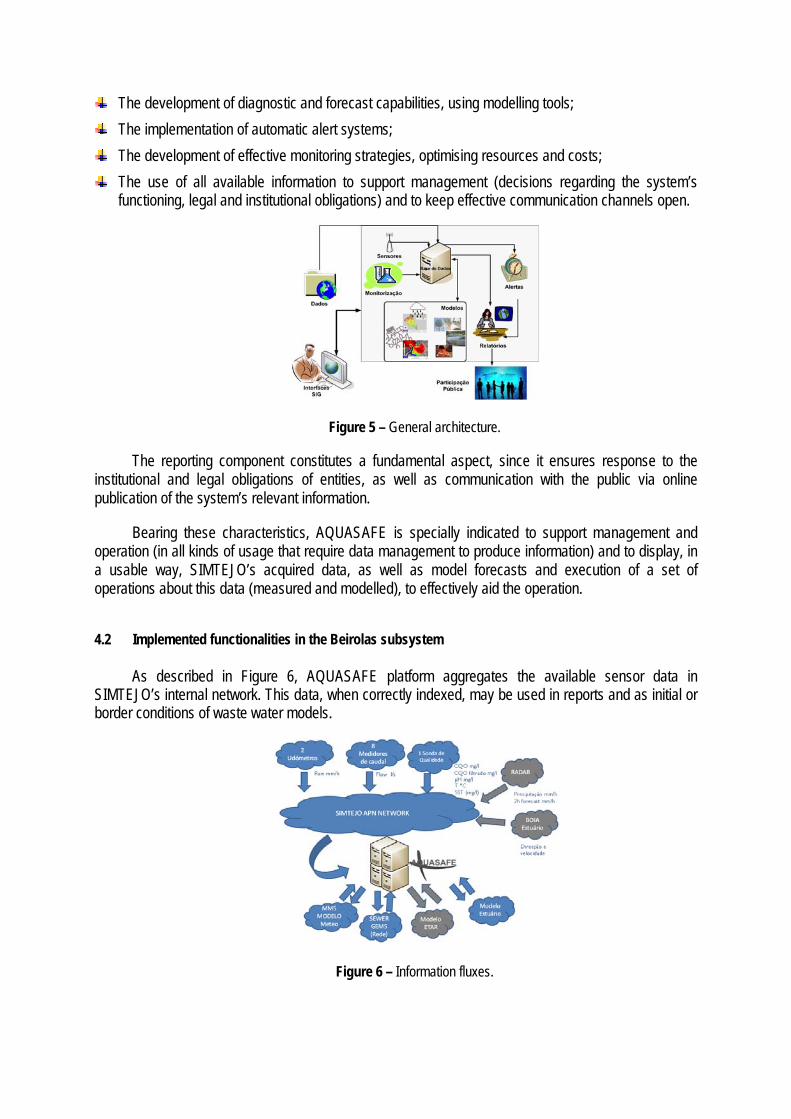
To complement this data (flow meters, quality and udometric stations), the platform aggregates external weather forecast data (MM5 model, radar and satellite images from the meteorological institute) and circulation in Tagus estuary (see Figure 7).
Figure 7 – System components to consider.
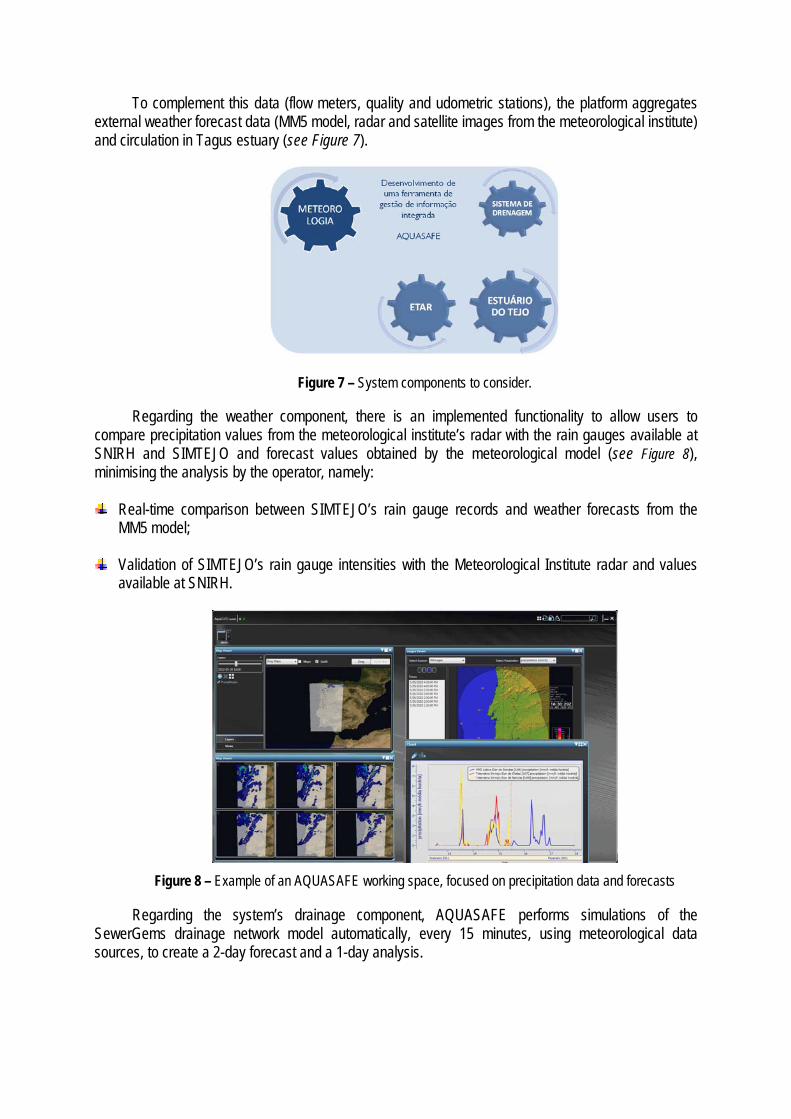
Regarding the weather component, there is an implemented functionality to allow users to compare precipitation values from the meteorological institute’s radar with the rain gauges available at SNIRH and SIMTEJO and forecast values obtained by the meteorological model (see Figure 8), minimising the analysis by the operator, namely:
Real-time comparison between SIMTEJO’s rain gauge records and weather forecasts from the MM5 model;
Validation of SIMTEJO’s rain gauge intensities with the Meteorological Institute radar and values available at SNIRH.
Figure 8 – Example of an AQUASAFE working space, focused on precipitation data and forecasts
Regarding the system’s drainage component, AQUASAFE performs simulations of the SewerGems drainage network model automatically, every 15 minutes, using meteorological data sources, to create a 2-day forecast and a 1-day analysis.
For the 2-day forecast, the simulation uses MM5 forecast data. For the user-defined past period, rain gauge recorded values are used. Apart from precipitation data, it is possible to compare flow values of all SewerGems simulations with flow gauge network values, lift stations and the treatment plant.
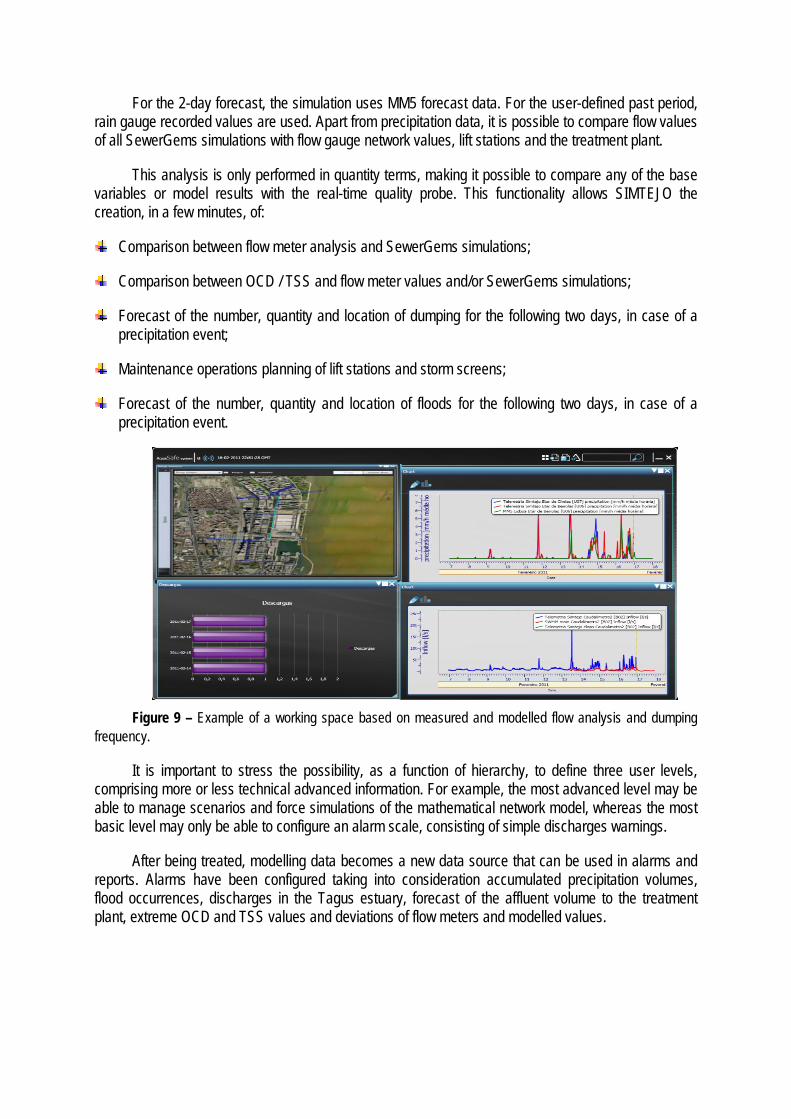
This analysis is only performed in quantity terms, making it possible to compare any of the base variables or model results with the real-time quality probe. This functionality allows SIMTEJO the creation, in a few minutes, of:
Comparison between flow meter analysis and SewerGems simulations;
Comparison between OCD / TSS and flow meter values and/or SewerGems simulations;
Forecast of the number, quantity and location of dumping for the following two days, in case of a precipitation event;
Maintenance operations planning of lift stations and storm screens;
Forecast of the number, quantity and location of floods for the following two days, in case of a precipitation event.
Figure 9 – Example of a working space based on measured and modelled flow analysis and dumping frequency.
It is important to stress the possibility, as a function of hierarchy, to define three user levels, comprising more or less technical advanced information. For example, the most advanced level may be able to manage scenarios and force simulations of the mathematical network model, whereas the most basic level may only be able to configure an alarm scale, consisting of simple discharges warnings.
After being treated, modelling data becomes a new data source that can be used in alarms and reports. Alarms have been configured taking into consideration accumulated precipitation volumes, flood occurrences, discharges in the Tagus estuary, forecast of the affluent volume to the treatment plant, extreme OCD and TSS values and deviations of flow meters and modelled values.
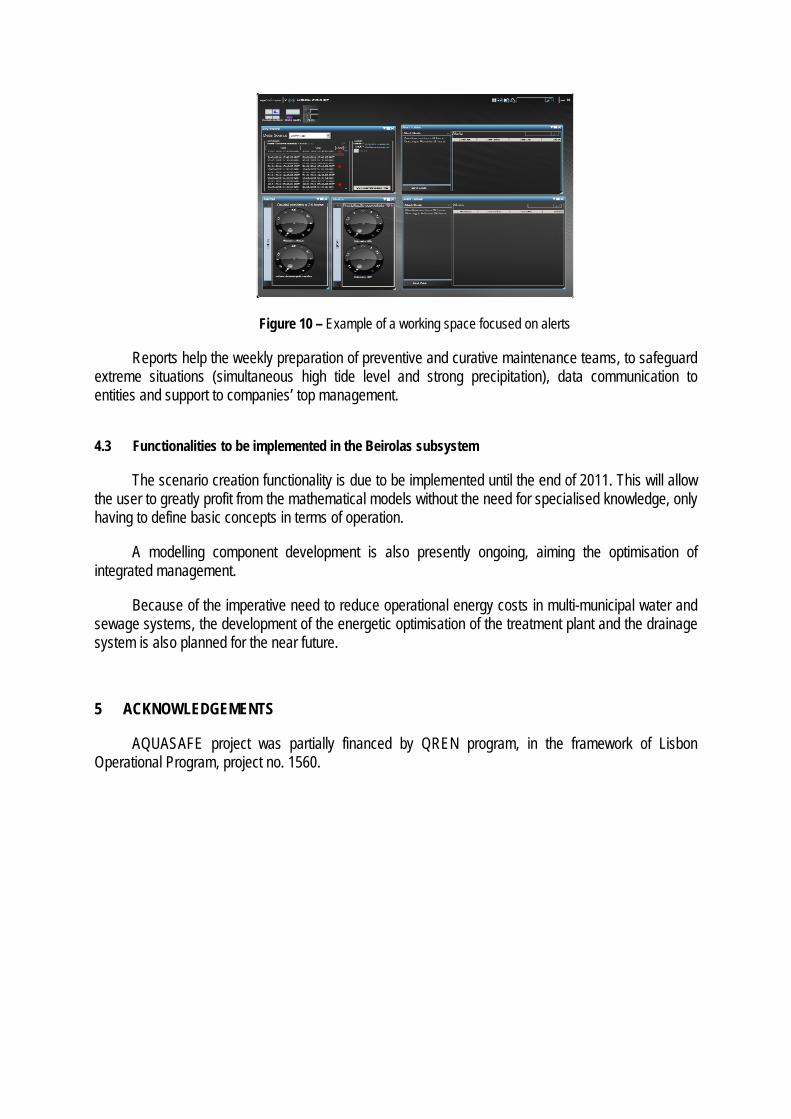
Figure 10 – Example of a working space focused on alerts
Reports help the weekly preparation of preventive and curative maintenance teams, to safeguard extreme situations (simultaneous high tide level and strong precipitation), data communication to entities and support to companies’ top management.
4.3 Functionalities to be implemented in the Beirolas subsystem
The scenario creation functionality is due to be implemented until the end of 2011. This will allow the user to greatly profit from the mathematical models without the need for specialised knowledge, only having to define basic concepts in terms of operation.
A modelling component development is also presently ongoing, aiming the optimisation of integrated management.
Because of the imperative need to reduce operational energy costs in multi-municipal water and sewage systems, the development of the energetic optimisation of the treatment plant and the drainage system is also planned for the near future.
5 ACKNOWLEDGEMENTS
AQUASAFE project was partially financed by QREN program, in the framework of Lisbon Operational Program, project no. 1560.