optimization: a perspective on improving …thesis.honors.olemiss.edu/389/13/marchant...
TRANSCRIPT

OPTIMIZATION: A PERSPECTIVE ON IMPROVING AN ETHYLBENZENE
PRODUCTION DESIGN
by
Derrick Cochrane Marchant
A thesis submitted to the faculty of The University of Mississippi in partial fulfillment of
the requirements of the Sally McDonnell Barksdale Honors College.
Oxford
May 2015
Approved by
___________________________________
Advisor: Dr. Adam Smith
___________________________________
Reader: Dr.John O’Haver
___________________________________
Reader: Dr. Paul Scovazzo

ii
2015
Derrick Cochrane Marchant
ALL RIGHTS RESERVED

iii
Acknowledgements
There are many people and factors to thank that have built and pushed me
throughout my academic career. My parents, Eddy and Cindy, have pushed me from the
start and are always there for encouragement. I would like to thank Dr. Adam Smith for
being my thesis advisor and helping me as an undergraduate student in class and for this
thesis. I would like to thank Dr. Paul Scovazzo and Dr. John O’Haver in the same manner
as well and also for reading my thesis as second and third readers. I thank my fellow
classmates Cary Robbins and Jasper Ring for working in a group together and passing
Plant Design I together. Cary Robbins provided the base case and optimized case process
flow diagrams and stream tables seen throughout. Jasper Ring helped with the PRO/II
simulation, the bulk of the sample calculations, and provided the selectivity/conversion
graph.

iv
Abstract
The goal of optimization in a chemical process or system involves improving an
existing design or a combination of devices. In the case of an established process such as
the ethylbenzene production process investigated here, the optimization involves
improving an established process and choosing the best available case within a set of
constraints that also considers maximizing the economic bottom line. An objective
function must be selected for an optimization problem which defines the achievable goal.
The objective function of the optimization process presented here is to minimize the
estimated annual operating cost (EAOC). An EAOC takes in to account all the necessary
variables that add up to the yearly operating costs of a chemical process such as utility
and raw material costs. The secondary objective function presented here is
maximizingthe net present value (NPV) which is directly related to minimizing the
EAOC. The NPV takes in to account the recurring costs of plant operation over a plant’s
expected lifetime. Both objective functions are assessed and considered. By defining a
number of constraints and decision variables related to the objective function, an
optimization problem becomes a dynamic and creative exercise. The report included
contains an evaluation of defined constraints, decision variables, and proposed changes
and an optimized design utilizing the engineering resources available. The optimized
design focuses on making a catalyst change to maximize the efficiency of the reactor
section and also on changing the raw material feed to directly reduce the raw material
cost of operation. Safety of the plant’s operation follows a full economic analysis and
detailed process description of the optimized design.

v
List of Figures
Figure 1 - Sensitivity analysis of the major economic components plotting net
present valuevs. %Difference
Figure 2 - Enhanced Sensitivity Analysis highlighting Labor, Utilities, and
Equipment
Figure 3 - Concentration of diethylbenzene (DEB) in product stream vs.
Exit temperature of theFired Heater (H-301)
Figure 4 - Conversion of benzene to ethylbenzene vs. Exit temperature of the Fired
Heater (H-301)
Figure 5 - Base case reactor train
Figure 6 - Process concept diagram highlighting feed components and effluent
components
Figure 7 - Optimized case process flow diagram
Figure 8– Raw material feed and reactor feed preparation
Figure 9 - Parallel Reactor Train
Figure 10 - Heat exchanger network and separation feed preparation
Figure 11 - Separation section

vi
List of Tables
Table 1 - Base Case Cost Summary (All Fixed Capital Investment (FCI) and
Estimated Annual Operating Costs (EAOC) are represented in millions.)
Table 2 – Process condition matrix highlighting conditions of special concern
Table 3 – Profit margin for the production of ethylbenzene
Table 4 – Flow stream summary for the optimized ethylbenzene production plant
Table 5 – Summary of Cost of Manufacturing without Depreciation (COMd)
Table 6 – Summary of Utility Requirements for the Equipment in the Ethylbenzene
Production Process
Table 7 – Summary of Fixed Capital Investment
Table 8 – Optimized Case Equipment Summary

vii
List of Abbreviations and Nomenclature
Distillation Column:
mD: Mass flow rate in the distillate
stream
mDl: Liquid mass flow rate in the
distillate stream
mB: Mass flow rate in the bottoms
stream
mBl: Liquid mass flow rate in the
bottoms stream
VDv: Volumetric flow rate of the vapor
in the distillate stream
VBv: Volumetric flow rate of the vapor
in the bottoms stream
VD: Total volumetric flow rate of the
vapor in the distillate stream
VB: Total volumetric flow rate of the
vapor in the bottoms stream
ρD: Density of the distillate stream
ρB: Density of the bottoms stream
R: Reflux ratio
vD: Linear velocity of the distillate
stream
vB: Linear velocity of the bottoms stream
DD: Diameter of column required by
distillate stream
DB: Diameter of column required by
bottoms stream
Ntheoretical: Number of theoretical trays
required in the distillation column
ε: Efficiency of each tray
H: Height of the distillation column

viii
Vessels:
m: Mass flow rate of the feed into the
vessel
V: Volumetric flow rate of the feed into
the vessel
ρ: Density of the feed stream
t: Holdup time of the vessel
Vol: Volume of the vessel
k: Height to diameter ratio
H: Height of the vessel
D: Diameter of the vessel
Heat Exchangers:
Tpf: Process stream feed temperature
Tpm: Process stream intermediate
temperature
Tpe: Process stream effluent temperature
Twf: Water stream feed temperature
Twm: Water stream intermediate
temperature
Twe: Water stream effluent temperature
TLMl: Log mean temperature difference
of latent heating
TLMs: Log mean temperature difference
of sensible heating
Ul: Latent heat transfer coefficient of the
water stream
Us: Sensible heat transfer coefficient of
the water stream
mw: Mass flow rate of the water stream
Hwf: Enthalpy of the water at the feed
temperature
Hwm: Enthalpy of water at the
intermediate temperature
Hwe: Enthalpy of water at the effluent
temperature
Qt: Total duty of the heat exchanger

ix
Ql: Latent duty of the heat exchanger
Qs: Sensible duty of the heat exchanger
At: Total heat transfer area of the heat
exchanger
Al: Latent heat transfer area of the heat
exchanger
As: Sensible heat transfer area of the
heat
exchanger
Reactors:
Vc: Volume of the catalyst in the reactor
L: Length of the catalyst in the reactor
D: Diameter of the reactor
LR: Length of the reactor
VR: Volume of the reactor
Pumps:
m: Mass flow rate of feed stream into
pump
V: Volumetric flow rate of feed stream
into pump
ρ: Density of feed stream into pump
Pf: Pressure of feed stream into pump
Pe: Pressure of effluent stream out of
pump
ΔP: Pressure rise in pump
ε: Efficiency of pump
W: Pump work
Table of Contents
Copyright…………………………………………………………………………………ii
Acknowledgments……………………………………………………………………….iii
Abstract……………..……………………………………………………………………iv
List of Figures…………………………………………………………………………….v
List of Tables…………………………………………………………………………….vi
List of Abbreviations and Nomenclature...…………………………………………...vii
Introduction………....……………………..………………………………………....…..1
Theory and Background of Optimization……………………………….……………..2
Results and Discussion……..…………………………………………………………….7
Analysis of base case design and process justifications..………………..…….….7
Summary of proposed changes and improvements..……...…………..………...13
Economic analysis of optimized design………...…….....……………..…....……21
Description of optimized design……….……………....………..……………..….26
Conclusion…..……………………………………….…………….…………………....32
Recommendations…….………………………...……………………………………....32
Process Safety………....…………………...…………………………………………....33
Appendices…..………...…………………………………………………………….......34
Appendix A: Base Case PFD…………………………………………………......35
Appendix B: Base Case Stream Tables…………………….……………………36
Appendix C: Base Case Cash Flow Statement………………………………….39
Appendix D: Equipment Sizing Calculations……………………………...........40
Appendix E: Optimized PFD…………………………………………………….50
Appendix F: Optimized Stream Tables…………………………………………52
Appendix G: Optimized Cash Flow Statement…………………………………55
Appendix H: References………………………………………………………….56

1
Introduction
The production of ethylbenzene is an important process that predominantly plays
a role in the co-production of styrene. 99% of ethylbenzene produced is involved in
consumption in the production of styrene. Styrene is the main precursor for the
production of polystyrene, a common thermoplastic material [1]. The alkylation of
benzene and ethylene in the presence of a catalyst is the primary reaction that produces
ethylbenzene. However, additional side reactions may occur under certain circumstances
whereby higher degrees of benzyl alkylations are formed. The side reactions form
undesirable products that must be separated and reacted with excess benzene to form
additional ethylbenzene.
The purpose of this report is to design and optimize a new ethylbenzene (EB)
plant. A case study with a certain amount of base case plant information is available
through the senior design class, Ch E 451, under the instruction of Dr. Adam Smith
during the fall 2014 academic term. Analysis and evaluation of the case study is
necessary to make improvements and recommendations for an optimized design. The EB
plant produces 80,000 tonne/yr of 99.8% ethylbenzene with an impurity of less than 2
parts per million (ppm) of diethylbenzene. Numerous changes are available for the base
case EB plant within the case study. These changes affect certain parts of the plant and
thus affect the design of the overall plant.Choices and decisions to accept or decline the
changes proposed are a part of the optimization process that forms the bulk of this report.
The major changes and improvements considered forthe EB plant include:
optimizing the base case, making a catalyst change, making a feed change, or making

2
both a catalyst and feed change. This report analyzes each change and defends the
decisions through justifications and guidelines available.
Theory and Background of Optimization
Optimization is the process of improving an existing situation, device, or system
such as the chemical process of ethylbenzene production investigated here [2]. In order to
set up an optimization problem, an objective function is selected and constraints are
placed on a specified number of decision variables. An objective function is simply a
mathematical function that one either minimizes or maximizes to obtain an improved
process. The objective function for this process is to maximize the net present value
(NPV) of the ethylbenzene production or, in other terms, to minimize the estimated
operating annual costs (EAOC). The recurring costs of the operation are discounted to
obtain a NPV while the capital costs of the full operation are annualized to obtain the
EAOC. Both of the objective functions considered are interchangeable in the economic
analysis of the process. Decision variables are independent variables considered whereby
one has the ability to control and vary based on justifications. Constraints are the
limitations of the decision variables and consider the range of operation of certain
variables [2]. The constraints for this optimization process are to produce 80,000 tonne/yr
of ethylbenzene product, maintain an ethylbenzene product at 99.8% purity, and also
maintain an impurity of less than 2 ppm of diethylbenzene in the ethylbenzene product.
For the investigation represented in this report, both a base-case and a topological
approach identify considerations for improvement and represent the starting point of
optimization. The goal of optimization is to improve a process, therefore, it is necessary

3
to start from an ethylbenzene production process that is already defined. For the senior
plant design course, Ch E 451, a case study is provided with a fully operational process
for the production of ethylbenzene. The case study contains the base case used for the
optimization. This report elaborates in detail the important considerations of the base case
before an optimization approach is undertaken.
The production of an ethylbenzene product at 99.8% mole purity with less than 2
ppm diethylbenzene at a rate of 80,000 tonne per year are the primary constraints of this
optimization research. Using the given base case as a guideline, a unique optimized
design achieves a more efficient and less expensive overall plant design using the
resources at hand. Table 1, found below, is the cost summary of the base case and a
logical starting point for the optimization.
Table 1 - Base Case Cost Summary (All Fixed Capital Investment (FCI) and
Estimated Annual Operating Costs (EAOC) are represented in millions.)
Equipment FCI % of FCI
Fired Heater $2.333 40
Heat Exchangers $1.373 23
Pumps $0.224 4
Towers $0.535 9
Vessels $1.383 24
Total $5.848 100
Cost Type EAOC % of EAOC
Natural Gas $2.556 2.81
HPS $1.767 1.94
LPS $1.120 1.23
CW $0.039 0.04
Electricity $0.010 0.01
Benzene $68.516 75.37
Ethylene $16.894 18.58
Total $90.902 100
HPS, credit -$2.092 LPS, credit -$1.332

4
An initial analysis of Table 1 shows that the Fired Heater makes up the largest
portion of the fixed capital cost of the plant operation. The fired heater also uses the
utility of natural gas which makes up the third most percentage of the EAOC behind the
raw materials of benzene and ethylene. A next step is to investigate the operation of the
fired heater, the use of natural gas as a fuel, and also the necessity of the fired heater to
the production of ethylbenzene.
Using Table 1 and knowledge of justifications from a process condition matrix
(PCM), a topological optimization approach is nextimplemented, eliminating or
rearranging equipment according to process condition and heuristic guidelines [2]. Table
3, below in the results and discussion section, contains the PCM for the base case.
The details for the decisions made for the topological approach are found in the
results and discussion section.
The objective function of this optimization process is to improve the net present
value as much as is feasible; therefore, a full economic analysis of the plant is necessary.
A sensitivity analysis aids in the approach to this economic analysis by highlighting
components to be considered and evaluated. Below, in Figure 1, are the main components
from the base case information considered. An initial sensitivity analysis covering a ±30
percent difference change in each component focuses the approach and direction of the
optimization process.

5
Figure 1 - Sensitivity analysis of the major economic components plotting net
present value vs. %Difference
An initial consideration from Figure 1 is that the ethylbenzene production has the
greatest positive impact on the NPV of the operation. The raw materials, ethylene and
benzene, have the greatest cost and negative impact on the NPV of the operation.
Figure 2, below, contains an enhanced sensitivity analysis featuring the three
components that have less of an effect on the net present value as they increase or
decrease in value. After a full economic analysis of the base case design, the net present
-100
-80
-60
-40
-20
0
20
40
60
80
-30% -20% -10% 0% 10% 20% 30%NET
PR
ESEN
T V
ALU
E (M
M $
)
PERCENT DIFFERENCE
Ethylbenzene
Raw Material
Labor
Utilities
Equipment

6
value is approximately -$10.86 million as can be seen in Figure 2 as well.
Figure 2 – Enhanced Sensitivity Analysis highlighting Labor, Utilities, and
Equipment
-15.00
-14.00
-13.00
-12.00
-11.00
-10.00
-9.00
-8.00
-7.00
-6.00
NET
PR
ESEN
T V
ALU
E (M
M $
)
PERCENT DIFFERENCE
Labor
Utilities
Equipment

7
Results and Discussion
Analysis of the base case design and process justifications
Given a case study for the production of ethylbenzene, a PRO/II simulation
program that obeys the constraints supplied further analyzes the overall ethylbenzene
production process. A process flow diagram (Appendix A) for the base case is found in
the appendix as well as the respective stream table (Appendix B). A primary objective
for the analysis of the base case is to gain a deeper understanding of the major sections of
the plant, meet the design specifications, and define the Estimated Annual Operating Cost
(EAOC) to consequentlyanalyze the net present value (NPV) of the plant.
An appropriate thermodynamic model for the PRO/II simulation is necessary to
provide as accurate as possible data for analysis. The selection of the SRK SIMSCI
model is used in both the base case analysis and optimized plant design simulations. This
model applies to calculations with aromatic, non-polar hydrocarbons. The production of
ethylbenzene predominantly uses these compounds.
Looking through each major section of the plant while analyzing the base case,
the process conditions for justification are summarized in a process condition matrix
(PCM) that is seen below in Table 3. Conditions of special concern are marked with an X
in the diagram. The X identifies which pieces of equipment are closely reviewed for
conditions of special concern. [2]

8
Table 2 – Process condition matrix highlighting conditions of special concern
Equipment
Reactors and Separators Other Equipment
High Temp
Low Temp
High Pres.
Low Pres.
Non-Stoich. Feed Comp. Exch. Htr. Valve Mix
R-301 X X X
R-302 X X X
R-303 X X X
R-304 X X X
V-301
V-302
V-303
V-304
T-301
T-302
H-301 X
E-301 X
E-302 X
E-303
E-304
E-305
E-306
E-307
E-308
E-309
P-301 X
P-302
P-303
P-304 X
P-305 X
PCV stream 14 X
Evaluating the process conditions identified above, improvements are either
justified or recommended for the conditions of the particular piece of equipment and
overall process topology.
The elevated temperature associated with the reactor train (R-301 – R-303) allows
for a favorable reaction conversion when compared to lower conditions below the 400°C

9
0
1
2
3
4
5
6
7
8
9
10
200 250 300 350 400 450
Co
nce
ntr
atio
n o
f D
EB in
Pro
du
ct S
trea
m
(PP
M)
Exit Temperature of Fired Heater (oC)
limitations. A decision to maintain the elevated temperature of the reactor train is made
after analyzing the conversion-selectivity curves of the reactor train seen below in
Figures 3 and 4. Data for the streams can be seen in Appendix A.2 as part of the base
case stream tables. Also seen below is a visualization of the base case reactor train
labeled Figure 5. To accommodate for the increasein temperature, special materials need
to be used and are considered further in the report.
Figure 3 - Concentration of diethylbenzene (DEB) in product stream vs. Exit
temperature of theFired Heater (H-301)

10
0
0.02
0.04
0.06
0.08
0.1
0.12
0.14
0.16
0.18
0.2
200 250 300 350 400 450
Co
nve
rsio
n (
kmo
l B c
on
vert
ed/k
mo
l B
fed
)
Exit temperature of Fired Heater (oC)
Figure 4- Conversion of benzene to ethylbenzene vs. Exit temperature of the Fired
Heater (H-301)
Figure 5 – Base case reactor train

11
The reactions taking place within the reactor train all have experimental data
provided as well as kinetic data in the case study. As a result, the overall reaction is
kinetically controlled. No further considerations are evaluated involving changing the
reactions other than suppressing one or more of the side reactions based on undesirable
products. The summary of reactions is given below.
𝐶6𝐻6 + 𝐶2𝐻4 → 𝐶6𝐻5𝐶2𝐻5 (1)
Benzene Ethylene Ethylbenzene
𝐶6𝐻5𝐶2𝐻5 + 𝐶2𝐻4 → 𝐶6𝐻4(𝐶2𝐻5)2 (2)
Ethylbenzene Ethylene Diethylbenzene
𝐶6𝐻4(𝐶2𝐻5)2 + 𝐶6𝐻6 → 2𝐶6𝐻5𝐶2𝐻5 (3)
Diethylbenzene Benzene Ethylbenzene
𝐶6𝐻5𝐶𝐻3 + 2𝐶2𝐻4 → 𝐶6𝐻5𝐶2𝐻5 + 𝐶3𝐻6 (4)
Toluene Ethylene Ethylbenzene Propylene
The inherent reactor design is reviewed and a series vs. parallel setup is
considered.R-301 in the reactor train produces the highest ratio of ethylbenzene to
diethylbenzene. This results from R-301 having the highest benzene to ethylene ratio in
the inlet feed. Since diethylbenzene is an undesirable product and a chemical that must be
recycled and reacted further, an initial consideration is to simply suppress the production
of it. Diethylbenzene must be accounted for in the second separation section, T-302, and
subsequent recycle stream if it is not suppressed. The suppression is accomplished by
splitting the initial reactor train feed and feeding it to two separate reactors in parallel.
This split in feed eliminates the production of diethylbenzene by way of reaction (2).
With the suppression of reaction (2), the separation and recycle of diethylbenzene is

12
unnecessary. The eventual reaction of diethylbenzene in reaction (3) is also an
unnecessary consideration and is eliminated.
The non-stoichiometric feed of benzene compared to the ethylene feed ensures a
high conversion to ethylbenzene. An 8:1 ratio of benzene to ethylene is employed for the
base case. The minimum ratio of benzene to ethylene is found in the reactor train at the
inlet feed to R-303. The ratio is 4.36:1 of benzene to ethylene feed and this ratio is
utilized for the optimization of the plant design.
Large outlet pressures at P-301, P-304, and P-305 arenecessary in order to run the
reactors at high pressures. Enforced materials are required to withstand the elevated
pressures. Multiple pumps for different process conditions and topological arrangements
are considered.
The Fired Heater, H-301, needs to produce an effluent at a higher temperature
than that of high pressure steam (254°C). [2] This is necessary for proper reactor
conditions but requires special heating to reach temperatures in excess of 400°C. Also,
lowering the reactor feed stream temperature is evaluated based on the reactor design.
The pressure control valve (PCV) on stream 14 has a large pressure drop
warranting the possible use of a turbine to recapture some of the energy lost to the
pressure drop. Because stream 14 passing through the valve is predominantly all liquid,
little useful work is recovered from the stream and the use of a turbine is not a
recommended addition to thetopological optimization process.
The fuel gas product in Stream 15 is burned instead of being recycled or stored.
This burning approach is the easiest and cheapest way to deal with the left over ethane
and propylene and is not considered any further than the base case evaluation. Similar

13
amounts in the overhead fuel gas from the flash vaporization process is utilized in the
optimized design. An appreciable amount of benzene raw material feed can occur if the
temperature of the separator is too high. A lower temperature of this two-phase separator
is reviewed and optimized to minimize the loss of raw materials.
Summary of proposed changes and improvements
The major objective of the optimization process is improving the topological
design as well as improving the use of sensitive components, such as raw material feeds,
in order to maximize the profit of the plant. The profit margin of a plant is the difference
between the value of the products and the cost of the raw materials. Table 3 below
showcases that the profit margin for the base case is small initially, therefore, many
improvements are necessary to make the economic potential a more positive number.
Also below, in Figure 6, the process concept diagram highlights the main inputs and
outputs of the plant. A process concept determines the chemical components that enter
with the inputs feeds and exit as product outputs. All of the reactions, both desired and
undesired, that take place in the process limit the performance of equipment such as the
reactors involved.
Table 3 – Profit margin for the production of ethylbenzene
Economic Potential
$27,468,394.38 per year
$3,301 per hour
$0.34 per kg

14
Benzene
Toluene
Ethylene
Ethane
Fuel Gas
Ethylbenzene
Figure 6 – Process concept diagram highlighting feed components and effluent
components
A number of changes and a summary of the major improvements is included
below. Each changed is evaluated and implemented based on the contribution to the
objection function of improving the economic impact of the plant.
The first major change considered is to implement a new catalyst. The new
catalyst costs $8/kg and expects to have a lifetime of only 4 years. The project length is
12 years after start up so the catalyst needs to be changed at least 3 times over this span.
The catalyst provides enhanced suppression of diethybenzene production and can operate
at a maximum of 500 °C. The operation of our reactor train is optimal between 400 °C
and 500 °C in our design, so the catalyst meets these requirements. After running the
𝐶6𝐻6 + 𝐶2𝐻4 → 𝐶6𝐻5𝐶2𝐻5 (1)
Benzene Ethylene Ethylbenzene
𝐶6𝐻5𝐶2𝐻5 + 𝐶2𝐻4 → 𝐶6𝐻4(𝐶2𝐻5)2 (2)
Ethylbenzene Ethylene Diethylbenzene
𝐶6𝐻4(𝐶2𝐻5)2 + 𝐶6𝐻6 → 2𝐶6𝐻5𝐶2𝐻5 (3)
Diethylbenzene Benzene Ethylbenzene
𝐶6𝐻5𝐶𝐻3 + 2𝐶2𝐻4 → 𝐶6𝐻5𝐶2𝐻5 + 𝐶3𝐻6 (4)
Toluene Ethylene Ethylbenzene Propylene

15
newer catalyst in PRO/II simulations, the feed rates are reduced allowing more
controllability over the raw materials cost. As seen earlier in the sensitivity analysis, the
raw materials cost hugely impacts the economic growth of the process. The new catalyst
therefore greatly affects the net present value of the plant positively.
The second change consists of purchasing and implementing a lower grade of
benzene feed. The new feed contains 10% toluene and 90% benzene and costs $0.85/kg.
The implementation of the lower grade of feed is possible given the constraints by
adjusting the raw material feed rates in the PRO/II simulations. This change is also
economically attractive, reducing the raw material component cost drastically. The design
of the reactor scheme allows for the suppression of diethylbenzene production and
increases the controllability of the feed rates even further. The choice of implementing
the lower grade of benzene will have a positive impact on the optimization design set
forth in describing thus far.
The third proposed change involves implementing both the new catalyst and
lower grade of benzene. This option is the chosen change for the optimized plant design
and has the best economic impact based on this process design. By changing to the lower
grade of benzene a direct reduction in the raw material feed cost is observed. A more
efficient reaction scheme with a controllable suppression of diethylbenzene occurs with
the utilization of the new catalyst as well.
The fourth proposed change calls for optimizing the base case with no catalyst
change or purchase of lower grade of benzene feed. This is a viable option, however, the
added benefits of reduction of feed costs and controllability of the reaction scheme as it

16
relates to the economic analysis are too good to not implement. Therefore, simply
optimizing the base case is not the best change proposed in the design.
After a detailed analysis of the individual proposed changes given, the third
proposed change is chosen to best optimize the plant’s design. After consideration of the
process conditions of concern in the base case the topological approach is now
implemented. An optimized plant design continues by removing certain equipment and
adjusting accordingly.
The removal of the bottom recycle stream as a result of implementing the new
catalyst and using a parallel reactor design leads to the first major topological
improvement. The suppression of diethylbenzene is the most important contribution to
the removal of the second separation and recycle loop. The removal of equipment
contained within this recycle is as follows: T-302, E-308, E-309, V-304, P-303 A/B, P-
304 A/B, the bottom of H-301, R-304. A direct reduction in the fixed capital investment
of equipment results from the elimination of this bottom recycle stream. A major
reduction in the relatively high annual utility cost of natural gas in the bottom part of H-
301 also results with this elimination. A more concentrated focus on the simple
separation of ethylbenzene from the reactor effluent without regards to the
diethylbenzene continues next.
The second major topological improvement considered involves deciding between
a series versus parallel design to the reactor. In a series design, the benzene to ethylene
ratio of the feed to each subsequent reactor reduces with the last reactor having the lowest
ratio. In the base case this ratio is 4.36:1 benzene to ethylene. In a parallel reactor design,
the benzene to ethylene ratio is kept constant and controlled to meet the minimum feed

17
ratio of benzene to ethylene. This ratio keeps the catalyst in use from being poisoned and
thus ineffective. Since the ratio is 4.36:1 benzene to ethylene in the base case design, this
ratio is kept for the optimized design as well. With the implementation of both the lower
grade of benzene and the newer catalyst, the parallel design of reactor train continues in
the optimized topology also. The controllability of feed rates and the temperature of our
feed train leads to a positive impact and is an economically attractive improvement.
Figure 7, shown below, contains the optimized process flow diagram design.
Table 4, further below, contains the respective stream tables for this optimized design.

18
Figure 7 – Optimized case process flow diagram

19
Table 4 – Flow stream summary for the optimized ethylbenzene production plant
Stream Name 1 2 3 24 25 26
Temperature oC 25.0 25.0 38.6 25.0 25.0 25.0
Pressure kPa 110.0 2000.0 110.0 2000.0 2000.0 2000.0
Vapor Mole Fraction 0.0 1.0 0.0 1.0 1.0 1.0
Total kmol/h 93.4 102.9 475.6 25.7 77.2 25.7
Total kg/h 7426.0 2893.5 36557.3 723.4 2170.1 723.4
Flowrates in kmol/h Ethylene
99.83 0.0025 24.96 74.87 24.96
Ethane
3.09 1.69 0.77 2.32 0.77
Propylene
18.6 Benzene 84.1
445.0
Toluene 9.34
9.34 Ethylbenzene
1.02
1,4-DiEthBenzene
Stream Name 27 28 29 30 31 32
Temperature oC 25.0 25.0 25.0 420.0 420.0 420.0
Pressure kPa 2000.0 2000.0 2000.0 1950.0 1950.0 1950.0
Vapor Mole Fraction 1.0 1.0 1.0 1.0 1.0 1.0
Total kmol/h 51.5 25.7 25.7 356.7 118.9 118.9
Total kg/h 1446.8 723.4 723.4 27418.0 9139.3 9139.2
Flowrates in kmol/h Ethylene 49.9 25.0 25.0 0.0 0.0 0.0
Ethane 1.54 0.772 0.772 1.267 0.422 0.422
Propylene
13.9 4.6 4.6
Benzene
333.7 111.2 111.2
Toluene
7.01 2.34 2.34
Ethylbenzene
0.762 0.254 0.254
1,4-DiEthBenzene

20
Stream Name 33 34 35 36 37 38
Temperature oC 420.0 420.0 420.0 390.7 390.7 390.7
Pressure kPa 1950.0 1950.0 1950.0 1950.0 1950.0 1950.0
Vapor Mole Fraction 1.0 1.0 1.0 1.0 1.0 1.0
Total kmol/h 237.8 118.9 118.9 144.6 144.6 144.6
Total kg/h 18278.8 9139.4 9139.4 9862.7 9862.6 9862.8
Flowrates in kmol/h Ethylene 0.00124 0.00062 0.00062 25.0 25.0 25.0
Ethane 0.844 0.422 0.422 1.194 1.194 1.194
Propylene 9.28 4.64 4.64 4.64 4.64 4.64
Benzene 222.5 111.2 111.2 111.2 111.2 111.2
Toluene 4.67 2.34 2.34 2.34 2.34 2.34
Ethylbenzene 0.508 0.254 0.254 0.254 0.254 0.254
1,4-DiEthBenzene
Stream Name 39 40 41 42 43
Temperature oC 390.7 489.5 489.5 489.5 489.5
Pressure kPa 1950.0 1522.9 1522.9 1522.9 1522.9
Vapor Mole Fraction 1.0 1.0 1.0 1.0 1.0
Total kmol/h 144.6 122.0 122.0 122.0 122.0
Total kg/h 9862.8 9862.7 9862.6 9862.8 9862.8
Flowrates in kmol/h Ethylene 25.0 0.00225 0.00225 0.00225 0.00225
Ethane 1.19 1.19 1.19 1.19 1.19
Propylene 4.64 6.97 6.97 6.97 6.97
Benzene 111.2 91.0 90.9 91.0 91.0
Toluene 2.34 0.000985 0.000985 0.000985 0.000985
Ethylbenzene 0.254 22.9 22.9 22.9 22.9
1,4-DiEthBenzene
1.9x10^-5 1.9x10^-5 1.9x10^-5 1.9x10^-5

21
Stream Name 14 15 16 17 19
Temperature oC 491.0 40.0 40.0 42.3 155.4
Pressure kPa 1935.0 110.0 110.0 150.0 165.0
Vapor Mole Fraction 1.0 1.0 0.0 0.0 0.0
Total kmol/h 488.0 15.2 472.8 382.2 90.6
Total kg/h 39450.8 705.2 38745.7 29132.8 9612.9
Flowrates in kmol/h Ethylene 0.00900 0.00652 0.00248 0.00248
Ethane 4.78 3.09 1.69 1.69 Propylene 27.9 9.3 18.6 18.6 Benzene 363.8 2.7 361.1 360.9 0.2
Toluene 0.00394 0.00001 0.00393 0.00182 0.00211
Ethylbenzene 91.5 0.089 91.4 1.01 90.411
1,4-DiEthBenzene 7.5x10^-5
7.5x10^-5
7.5x10^-5
Economic Analysis of Optimized Design
A detailed economic analysis is necessary to optimize the objective function of
the plant design improvement. The objective function in this research is to maximize the
net present value.
The project length for the ethylbenzene plant is 12 years with a start-up time
period 2 years before. The hurdle rate (MARR, after tax) is 12%.
A Chemical Engineering Plant Cost Index (CEPCI) is a composite index that
accounts for inflation and the effects of time on the value of money [2]. CAPCOST is a
program run in Microsoft Excel that estimates the value of equipment to determine the
capital cost of a plant. A user must enter a CEPCI value to determine an accurate modern
day capital cost. A CEPCI value of 587.4 is the most recent and reliable value for
estimating the total cost for this plant. Obeying the economic parameters included in the

22
base case study packet, the net present value for this optimized case design is $34.4
million.
There are many factors that affect the cost of manufacturing ethylbenzene. Table
5, seen below, contains the most important costs associated in the production of
ethylbenzene. The important factors governing the day-to-day operation of this optimized
plant are important to estimate the economic feasibility. A summary of the manufacturing
costs, in units of dollars per time, gives an estimate for the practicality to operate the
chemical process.
Table 5 – Summary of Cost of Manufacturing without Depreciation (COMd)
Factors Cost per year
Grass Roots $12,500,000.00
Utilities $1,169,464.18
Labor $805,000.00
Raw Materials $79,031,303.50
COMd $103,094,594.25
Table 6, below, summarizes the utility requirements for the equipment in the
optimized ethylbenzene process. The steam generated from heat exchangers E-303, E-
310, E-304, and E-311 count for credit towards the annual cost of utilities and positively
impact the economic impact for this design. The prices for steam and cooling water are
costs already associated with inefficiencies inherent in their use. It is assumed that an
efficiency of 1 accounts for the full credit of their use. An efficiency of 0.8 in the fired
heater, H-301, and an efficiency of 0.85 for pumps P-301 and P-306 take in to account
inefficiencies of operation. [2]

23
Table 6 – Summary of Utility Requirements for the Equipment in the Ethylbenzene
Production Process
Equipment Utility Duty (GJ/hr) Efficiency Price ($/GJ) Annual Cost
E-303 High Pressure Steam 10.14 1 -17.7 -$1,493,616
E-310 High Pressure Steam 9.2 1 -17.7 -$1,355,154
E-304 Medium Pressure
Steam 9.3 1 -14.83 -$1,147,762
E-311 Low Pressure Steam 10.4 1 -14.05 -$1,216,011
E-305 Cooling Water 4.4 1 0.354 $12,962
E-312 Cooling Water 5.9 1 0.354 $17,381
E-306 Low Pressure Steam 20.2 1 14.05 $2,361,867
E-307 Cooling Water 16.5 1 0.354 $48,609
E-313 Cooling Water 1.5 1 0.354 $4,419
H-301 Natural Gas 39.3 0.8 11.1 $4,537,883
P-301 Electricity 34.3 0.85 0.06 $20,149
P-302 Electricity 1 1 0.06 $499
P-306 Electricity 0.05 0.85 0.06 $29
T-301 n/a n/a n/a n/a n/a
V-301 n/a n/a n/a n/a n/a
V-302 n/a n/a n/a n/a n/a
V-303 n/a n/a n/a n/a n/a
R-301 (V-306) n/a n/a n/a n/a n/a
R-305 (V-307) n/a n/a n/a n/a n/a
R-306 (V-308) n/a n/a n/a n/a n/a
R-307 (V-309) n/a n/a n/a n/a n/a
Total Cost of Utilities $1,786,807
Table 7, below, contains the optimized fixed capital cost investment summary. A
visualization of the percentage that each individual piece of equipment highlights the
magnitude of the overall cost importance of the individual piece. Fixed capital costs are
independent of changes in production rate. The costs are charged at the same rate even
during periods when the plant is not in operation.

24
Table 7 – Summary of Fixed Capital Investment
Equipment Bare Module Cost Percentage of FCI
E-303 $177,000 1.8%
E-310 $288,000 2.9%
E-304 $269,000 2.7%
E-311 $128,000 1.3%
E-305 $103,000 1.0%
E-312 $86,500 0.9%
E-306 $666,000 6.7%
E-307 $153,000 1.5%
E-313 $115,000 1.1%
H-301 $3,980,000 39.8%
P-301 $203,000 2.0%
P-302 $28,200 0.3%
P-306 $32,900 0.3%
T-301 $538,000 5.4%
V-301 $194,000 1.9%
V-302 $90,300 0.9%
V-303 $38,500 0.4%
R-301 (V-306) $730,000 7.3%
R-305 (V-307) $730,000 7.3%
R-306 (V-308) $730,000 7.3%
R-307 (V-309) $730,000 7.3%
Total $10,010,400 100
Table 8, below, summarizes the optimized case design. The optimized case
summary is referenced many times in the description of the optimized case design in the
following section and includes an organized table here for convenience to the reader. All
calculations for the optimized case equipment come from CAPCOST. The user has to
have knowledge of certain limitations on equipment to present reasonable data for the
limitations. Guidelines for experience-based principles to input in to the CAPCOST
program are used throughout the economic analysis [2].The materials of construction
(MOC) used for the equipment throughout is carbon steel (CS) as a result of the low cost,
availability and resistance to abrasion advantages comparted to other metal materials.

25
Table 8 – Optimized Case Equipment Summary
Exchangers Type Shell P (barg) Tube P (barg) MOC
Area (square meters)
E-303 Floating Head 41 18.4 CS/CS 182
E-310 Floating Head 41 18.4 CS/CS 368
E-304 Fixed 18.4 10 CS/CS 588
E-311 Fixed 18.4 5 CS/CS 131
E-305 Floating Head 18.4 3 CS/CS 58.2
E-312 Fixed 0.65 5 CS/CS 40.4
E-306 Floating Head 0.1 3 CS/CS 163
E-307 Floating Head 0.5 3 CS/CS 1000
E-313 Floating Head 0.5 3 CS/CS 89.9
Fired Heaters Type Heat Duty
(GJ/hr) Pressure
(barg) MOC
H-301 Process Heater 49.2 18.5 CS
Pumps Type Power (kW) # Spares MOC Discharge P
(barg)
P-301 Positive
Displacement 40.4 1 CS 18.5
P-302 Centrifugal 1 1 CS 0.5
P-306 Positive
Displacement 0.06 1 CS 0.5
Towers Type Height (m) Diameter
(m) MOC Pressure (barg)
T-301 26 Sieve Trays 17 2.75 CS 0.2
Vessels Orientation Length/Height
(m) Diameter
(m) MOC Pressure (barg)
V-301 Vertical 8.1 2.7 CS 0.05
V-302 Vertical 5.7 1.9 CS 0.1
V-303 Horizontal 3 1 CS 0.05
R-301 (V-306) Horizontal 10 2 CS 18.5
R-305 (V-307) Horizontal 10 2 CS 18.5
R-306 (V-308) Horizontal 10 2 CS 18.5
R-307 (V-309) Horizontal 10 2 CS 18.5
26
Description of Optimized Design
A detailed description of the optimized design for theproduction of ethylbenzene
is necessary to fully justify the improvements. An evaluation of each major section and
the major changes involved follows.
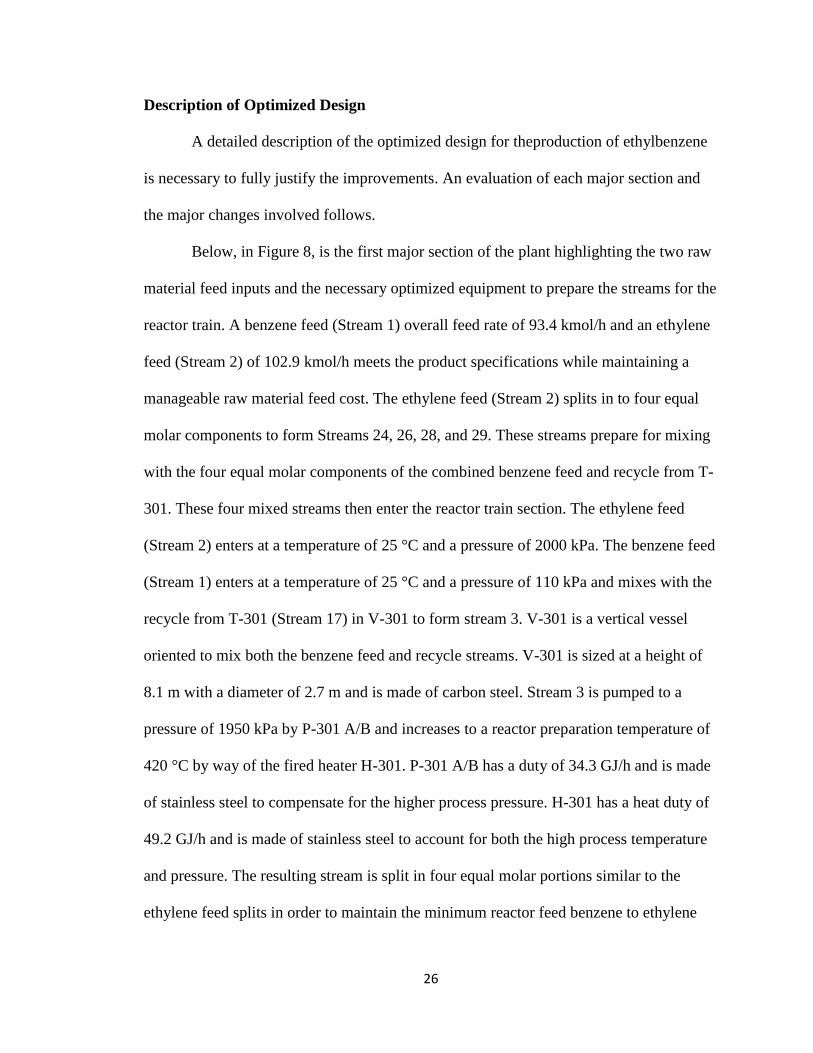
Below, in Figure 8, is the first major section of the plant highlighting the two raw
material feed inputs and the necessary optimized equipment to prepare the streams for the
reactor train. A benzene feed (Stream 1) overall feed rate of 93.4 kmol/h and an ethylene
feed (Stream 2) of 102.9 kmol/h meets the product specifications while maintaining a
manageable raw material feed cost. The ethylene feed (Stream 2) splits in to four equal
molar components to form Streams 24, 26, 28, and 29. These streams prepare for mixing
with the four equal molar components of the combined benzene feed and recycle from T-
301. These four mixed streams then enter the reactor train section. The ethylene feed
(Stream 2) enters at a temperature of 25 °C and a pressure of 2000 kPa. The benzene feed
(Stream 1) enters at a temperature of 25 °C and a pressure of 110 kPa and mixes with the
recycle from T-301 (Stream 17) in V-301 to form stream 3. V-301 is a vertical vessel
oriented to mix both the benzene feed and recycle streams. V-301 is sized at a height of
8.1 m with a diameter of 2.7 m and is made of carbon steel. Stream 3 is pumped to a
pressure of 1950 kPa by P-301 A/B and increases to a reactor preparation temperature of
420 °C by way of the fired heater H-301. P-301 A/B has a duty of 34.3 GJ/h and is made
of stainless steel to compensate for the higher process pressure. H-301 has a heat duty of
49.2 GJ/h and is made of stainless steel to account for both the high process temperature
and pressure. The resulting stream is split in four equal molar portions similar to the
ethylene feed splits in order to maintain the minimum reactor feed benzene to ethylene

27
component ratio of 4.36:1. A ratio of 4.36:1 benzene to ethylene reactor feed ratio
prevents catalyst poisoning while maintaining an effective reactor train conversion.
Suppression of the diethylbenzene production and the additional side alkylation reactions
occurs as well.
Figure 8 – Raw material feed and reactor feed preparation
The next major section of the optimized design is the reactor train section and
Figure 9, below, gives a visual representation of the equipment and streams. The four
equal molar components with the same 4.36:1 benzene to ethylene component feed
ratiosenter each reactor in a parallel reactor design. Four identical reactors in parallel,
sized at 10 m length and 2.11 m in diameter, adheres to the heuristic of a 5:1 reactor
length to diameter ratio [2]. In each reactor, a 0.5 m space prevents waste of catalyst due
to channeling of the streams in and out of each respective reactor. Each reactor is made of

28
stainless steel to compensate for the high process temperature and pressure of the process
streams by providing a safer inherent design. Streams 40-43 have identical component
and overall flowrates as well as an identical reactor effluent temperature and pressure of
489.5 °C and 1522.9 kPa respectively. These four identical streams combine to form
stream 14. Stream 14 continues to the heat exchanger network.
Figure 9 – Parallel Reactor Train
The third major section of the optimized design includes the heat exchanger
network and the separation feed preparation sections. Figure 10, below, visualizes the
necessary equipment in this section. Stream 14, at 491 °C, 1935 kPa,with an overall
flowrate of 488 kmol/h, enters the heat exchanger network producing utilities to be sold
to a sister styrene production plant. This network also adjusts the necessary separation
feed temperature and pressure conditions. E-303 and E-310 produce high pressure steam
that is sold for $17.7/GJ and they perform at duties of 10.14 GJ/h and 9.2 GJ/h

29
respectively. The effluent from the first two heat exchangers has a temperature of 280 °C
and is sent to E-304 having a duty of 9.3 GJ/h that produces medium pressure steam that
sells for $14.83/GJ. The effluent from E-304 at a temperature of 225 °C is sent to E-311
having a duty of 10.4 GJ/h to produce low pressure steam that sells for $14.05/GJ. A
pressure control valve reduces the pressure from 1950 kPa to 110 kPa to prepare the
stream for the separation section. The vapor quality of the effluent stream from E-311 is
not high enough to merit any more energy credit by way of an expander or turbine and it
remains a liquid to be sent to the separation section without any more appreciable energy
recovery consideration. The process stream continues through E-305 and E-312 each
having duties of 4.4 GJ/h and 5.9 GJ/h respectively and each using cooling water as a
cost for utilities to account for in the annual operating costs. The heat exchanger network
effluent has a temperature of 40 °C and a pressure of 110 kPa. All of the heat exchangers
in this network contain carbon steel for both the shell and tubes to minimize the fixed
capital cost investment for our equipment. The effluent process stream, at a temperature
of 40 °C, continues to the flash vaporizer (V-302) to minimize the loss of the raw
material benzene in the overhead fuel gas. By circulating the benzene through the
separation section and further on to the recycle stream and reactor train, more benzene
reacts further to form even more ethylbenzene and thus enhances the net present value of
the optimized design. The overhead fuel gas (Stream 15) continues to the fired heater as a
side product and mostly contains the light gases of propylene and ethane. The condensed
liquid (Stream 16) from the two-phase separator (V-302) at a temperature of 40 °C and a
pressure of 110 kPa continues to a pump, P-306 A/B, to attain the separator feed pressure
condition of 150 kPa.

30
Figure 10 – Heat exchanger network and separation feed preparation
The final section in the optimized design, located below in Figure 11, composes
the separation section and features a single distillation column, T-301. This section, also
the most important and costly step in the plant, separates the ethylbenzene product at a
purity of 99.8% ethylbenzene at a rate of 80,000 tonne/yr containing an impurity less than
2 ppm of diethylbenzene. The necessary flowrate of the product (Stream 19) is a design
constraint of the rigorous column implemented in PRO/II. The distillation column, T-301,
operates with an efficiency of 75% and has a heuristic safety factor of 1.1 incorporated in
the sizing calculations for tray spacing considerations. The number of actual trays needed
is 26 sieve trays. 3 meters of height adds to the overall height as well to result in an
overall height of 17 meters. A diameter of 2.75 meters maintains the length to diameter
ratio heuristic between values of 30 and 2 meters. The feed to T-301 has a temperature of
40 °C and a pressure of 110 kPa. The light component is benzene and the heavy

31
component is ethylbenzene for this separation. The top tray pressure ofT-301 is 150 kPa
and the bottom tray pressure is 165 kPa, therefore, the pressure drop across the column is
15 kPa or 0.15 bar. The reboiler, E-306, uses low pressure steam as a utility and performs
at a duty of 20.2 GJ/h. The limitations for area in square meters in CAPCOST for heat
exchangers is 1000 m2, therefore, the condenser for T-301 had to be modeled as two
separate condensers E-307 and E-313 which have duties of 16.5 GJ/h and 1.5 GJ/h
respectively. V-303 is a horizontal vessel sized at a length of 4.05 m and a height of 1.35
m. V-303 is made of carbon steel. The final part of the total condenser of T-301 is P-302
A/B which pumps both the liquid reflux back in to the top of T-301 and the total liquid
phase top product (Stream 17). The liquid product recycles back to V-301 and maintains
a pressure of 150 kPa. P-302 A/B is made of carbon steel.
Figure 11 – Separation section

32
Conclusion
A detailed analysis of the given case study base gives a focused starting point to
an optimization problem. This analysis leads to a justified and optimized design for a new
and improved ethylbenzene plant. Elimination of several pieces of equipment as well as
certain utilities that are costly aid in the minimizing the final EAOC value and
subsequently maximizing the net present value (NPV). Both the addition of the newer
catalyst proposed and the cheaper benzene feed stream positively impact the economic
growth of the plant as well. A net present value of $34.4 million results. The proposed
changes are justified and are recommended in order to optimize the design.
Recommendations
A first recommendation involves decreasing the overall flowrate throughout the
process design with a predominant focus the recycle section.
Another recommendation involves further investigating the catalyst poisoning
possibilities of the catalyst in use in the reactor train. The benzene to ethylene feed ratio
to each reactor was maintained at a relatively high number starting at 8:1 with a
minimum of 4.36:1 in the base case to both combat the catalyst poisoning as well as to
suppress the production of diethylbenzene. More research in to this phenomenon leads to
a better understanding of the optimum feed ratios needed for each reactor feed to better
improve the production of ethylbenzene to possibly reduce the raw material feed costs.

33
Process Safety
The temperature and pressure limits of the vessels in use for this plantis a first
concern. To avoid uncontrolled, catastrophic releases of chemicals and/or destruction of
process vessels, vessels contain pressure-relief systems, which open automatically when
the pressure reaches a specified limit. Tanks and pressure-relief systems require regular
inspection to ensure integrity.
Ethylene, benzene, and ethylbenzene are all flammable, and plans of action
develop in case of a fire. Gas detectors exist throughout the plant in order to monitor the
composition of air and ensure the chemicals in the air do not reach the lower
flammability limit. Additionally, chemicals and potential sources of leaks are all kept
away from potential sources of ignition. In the event of a fire, firefighters use dry
chemical powder to extinguish small fires and alcohol foam, water spray, or fog for large
fires. Firefighters wear self-contained breathing apparatuses and full turnout gear.
Workers wear splash goggles, chemical suits, and respirators when there is any
risk for inhalation of or exposure to the chemicals. Eye-wash stations must exist
throughout the plant as well.
Permits for emissions are in effect prior to the construction of the plant and
require modification and renewal should the plant undergo significant modification.
These permits go through the state environmental protection agency and adhere to federal
regulations. Process upsetsresult in emergency releases, in which case a control and
response plan is in place dictating the protocol for the containment, removal, and disposal
of any and all waste created in the process.

34
APPENDICES

35
Appendix A: Base Case PFD

36
Appendix B: Base Case Stream Tables
Stream Name 1 2 3 4 5
Temperature oC 25.0 25.0 17.1 25.0 25.0
Pressure kPa 110.0 2000.0 105.0 2000.0 2000.0
Vapor Mole Fraction 0.0 1.0 0.0 1.0 1.0
Total kmol/h 89.3 100.0 239.9 30.0 35.0
Total kg/h 7011.4 2819.5 18633.5 845.8 986.8
Flowrates in kmol/h Ethylene
93.0 1.19 27.9 32.55
Ethane
7.00 1.11 2.10 2.45
Propylene
1.24 Benzene 86.6
233.02
Toluene 2.68
2.68 Ethylbenzene
0.620
1,4-DiEthBenzene
9.13x10^-8
Stream Name 6 7 8 9 10
Temperature oC 383.2 429.4 380.0 441.2 25.0
Pressure kPa 2000.0 1985.0 1960.0 1960.0 2000.0
Vapor Mole Fraction 1.0 1.0 1.0 1.0 1.0
Total kmol/h 269.9 249.8 284.8 256.2 35.0
Total kg/h 19479.3 19479.3 20466.1 20466.1 986.8
Flowrates in kmol/h Ethylene 29.1 6.48 39.0 10.3 32.6
Ethane 3.21 3.21 5.66 5.66 2.45
Propylene 1.24 3.79 3.79 3.92 Benzene 233.0 215.5 215.5 187.1 Toluene 2.68 0.1372 0.1372 7.13x10^-5 Ethylbenzene 0.6203 20.7 20.7 49.3 1,4-DiEthBenzene 9.13x10^-8 0.0022 0.0022 0.0122

37
Stream Name 11 12 13 14 15
Temperature oC 380.0 442.4 500.0 450.6 73.6
Pressure kPa 1935.0 1935.0 2000.0 1935.0 198.3
Vapor Mole Fraction 1.0 1.0 1.0 1.0 1.0
Total kmol/h 291.2 260.2 46.9 307.1 29.5
Total kg/h 21453.0 21453.0 3673.1 25126.0 1375.4
Flowrates in kmol/h Ethylene 42.9 11.9 0.0137 11.9 10.3
Ethane 8.11 8.11 0.3397 8.45 7.00
Propylene 3.92 3.92 0.3824 4.31 2.68
Benzene 187.1 156.1 44.60 200.7 8.8910217
Toluene 7.13x10^-5 2.20x10^-9 9.55x10^-11 2.29x10^-9 3.78x10^-11
Ethylbenzene 49.3 80.2 1.53 81.72 0.6398
1,4-DiEthBenzene 0.0122 0.0310 0.0013 0.0323 4.58E-05
Stream Name 16 17 18 19 20
Temperature oC 73.6 12.3 142.7 139.3 150.1
Pressure kPa 198.3 105.0 120.0 110.0 140.0
Vapor Mole Fraction 0.0 0.0 0.0 0.0 0.0
Total kmol/h 277.6 196.8 91.5 90.6 1.0
Total kg/h 23750.6 15193.3 9714.0 9612.1 101.9
Flowrates in kmol/h Ethylene 1.56 1.56
Ethane 1.45 1.45 Propylene 1.63 1.63 Benzene 191.8 191.4 0.2058 0.2056 0.000213
Toluene 2.25x10^-9 3.9x10^-10 2.06x10^-9 2.06x10^-9 5.29X10^-12
Ethylbenzene 81.08 0.8109 91.30 90.39 0.9131
1,4-DiEthBenzene 0.0323 1.19x10^-7 0.0367 3.67x10^-6 0.0367

38
Stream Name 21 22 23
Temperature oC 12.3 12.6 16.5
Pressure kPa 105.0 2000.0 2000.0
Vapor Mole Fraction 0.0 0.0 0.0
Total kmol/h 150.6 46.3 47.2
Total kg/h 11622.1 3571.2 3673.1
Flowrates in kmol/h Ethylene 1.19 0.3664 0.3664
Ethane 1.11 0.3397 0.3397
Propylene 1.24 0.3824 0.3824
Benzene 146.4 45.0 45.0
Toluene 2.98x10^-10 9.16x10^-11 9.69x10^-11
Ethylbenzene 0.6203 0.1906 1.10
1,4-DiEthBenzene 9.13x10^-8 2.81x10^-8 0.0367

39
Appendix C: Base Case Cash Flow Statement

40
Appendix D: Equipment Sizing Calculations
Distillation Column:
In order to size the distillation columns appropriately, several calculations were
necessary. Those calculations were carried out for both the distillate and bottoms
streams, in the following order: stream densities, volumetric flow of the streams, linear
velocities of the streams, and the diameter of the column required to sufficiently separate
and transport each stream. The height must also be calculated. An example calculation
is provided below.
First the density was calculated using the mass and vapor volumetric flows of the
distillate and bottmos streams.

41
Next the total volumetric flow was calculated using the mass flows of the liquid and the
previously calculated densities. The reflux ratio of the condenser was also used in
calculating the distillate volumetric flow rate to account for both liquid and vapor
volumetric flows.
After that, the linear velocities of both the distillate and bottoms streams were calculated
using the stream densities previously found and the vapor factor of 1.35 m/s*(kg/m3).5
was used, falling between the values of 1.2 and 1.5 m/s*(kg/m3).5
recognized by Turton et
al. as the upper and lower limits respectively for an economically efficient distillation
column.

42
With the volumetric flows and linear velocities of the distillate and bottoms streams
calculated, it became possible to calculate the required diameters of the distillate and
bottoms streams, thus providing an appropriate diameter for the distillation column.
Lastly, the height of the distillation column was calculated. This calculation required
several assumptions to be made. The first was a tray efficiency of .75, a value falling
between the values .6 and .9. The second assumption was that each tray requires half a
meter in spacing. Next it was assumed that an additional 10% of column height would be
required as a safety factor. The last assumption was that an additional 1.2 and 1.3 meters
would be required for vapor disengagement at the top and bottom of the column
respectively. These assumptions were based off of the recommendations made by Turton
et al.

43
Vessels:
In order to properly size the vessels throughout the ethylbenzene production process
several calculations had to be carried out. Those calculations included volumetric flow
rates of the feed streams into the vessels, holdup times, vessel volumes, and vessel
heights and diameters. An example calculation is provide below.
First it was necessary to calculate the volumetric flow rate of the feed into each stream.
Once the volumetric flow rate into each vessel was found it was possible to calculate the
holdup time required for each vessel. For reflux drums the holdup time is 5 minutes, for
drums feeding a tower the holdup time is 10 minutes and for drums feeding furnaces and
fired heaters the holdup time is 30 minutes as recommended by Turton et al. The
following calculation is for a drum feeding a furnace, thus the holdup time is 30 minutes.
From the holdup time, the Solver function in Microsoft Excel was used to find the
volume of the vessels.

44
Once the volume of the vessels was found, the height and diameter of the vessels could
be found. This was done by using the optimum height to diameter ratio of 3 as
recommended by Turton et al. and using the Solver function in Microsoft Excel.

45
Heat Exchangers:
In order to properly size the heat exchangers in the ethylbenzene production process
several calculations were carried out. Those calculations included the mass flow rate of
the water, latent and sensible heats, intermediate temperature of the process stream, log
mean temperatures of both the latent and sensible portions of the exchanger, latent and
sensible heat exchanger areas and total heat exchanger area. It is important to note that
when no phase change occurs in the water, only the sensible heat exchanger calculations
were and when only a phase change occurs, only the latent heat exchanger calculations
were performed. An example equation is provided below for a heat exchanger
experiencing both latent and sensible heat transfer.
First the mass of the water required in the heat exchanger had to be calculated.

46
Once the mass of the water was obtained, it was possible to calculate both the latent and
sensible heats.
With the sensible and latent heats calculated, the intermediate process stream temperature
was calculated.
The log mean temperature difference, the driving force behind the heat transfer, could
then be calculated for both sensible and latent heat transfer areas. It was assumed that the
maximum log mean temperature difference was 100 K as recommended by Turton et al.

47
After the log mean temperatures were calculated the latent and sensible areas were found,
the sum of which was the total area of the heat exchanger. For the area of the sensible
heat a fouling factor of 0.9 was assumed to account for inefficiencies in the heat transfer
over time. It was also assumed that the maximum total area was 1000 m3 for an
economically practical heat exchanger as recommended by Turton et al.

48
Reactors:
In order to properly size the reactors in the ethylbenzene production process, it was
necessary to do several calculations. These calculations were based on the catalyst length
and volume and included the reactor diameter, length and volume. An assumed length to
diameter ratio of about 5 was used with a maximum length of 10 meters as recommended
by Turton et al. for horizontal vessels. An example calculation is provided below.
The diameter of the reactors was first calculated.
From the diameter, a volume could be calculated based on a length of 10 meters.

49
Pumps:
To properly size the pumps in the ethylbenzene production process, several calculations
had to be performed. These calculations included the volumetric flow rate through the
pump, the pressure rise across the pump, and the power used by the pump. An example
calculation is provided below.
First the volumetric flow into the pump was calculated.
Next, the pressure rise across the pump was calculated.
Last, the power required by the pump was calculated using the volumetric flow rate into
the pump and pressure rise from the previous calculations. A pump efficiency of .8 was
used as it falls in the middle of the efficiency range recommended by Turton et al.

50
Appendix E: Optimized PFD

51

52
Appendix F: Optimized Stream Tables
Stream Name 1 2 3 24 25 26
Temperature oC 25.0 25.0 38.6 25.0 25.0 25.0
Pressure kPa 110.0 2000.0 110.0 2000.0 2000.0 2000.0
Vapor Mole Fraction 0.0 1.0 0.0 1.0 1.0 1.0
Total kmol/h 93.4 102.9 475.6 25.7 77.2 25.7
Total kg/h 7426.0 2893.5 36557.3 723.4 2170.1 723.4
Flowrates in kmol/h Ethylene
99.83 0.0025 24.96 74.87 24.96
Ethane
3.09 1.69 0.77 2.32 0.77
Propylene
18.6 Benzene 84.1
445.0
Toluene 9.34
9.34 Ethylbenzene
1.02
1,4-DiEthBenzene
Stream Name 27 28 29 30 31 32
Temperature oC 25.0 25.0 25.0 420.0 420.0 420.0
Pressure kPa 2000.0 2000.0 2000.0 1950.0 1950.0 1950.0
Vapor Mole Fraction 1.0 1.0 1.0 1.0 1.0 1.0
Total kmol/h 51.5 25.7 25.7 356.7 118.9 118.9
Total kg/h 1446.8 723.4 723.4 27418.0 9139.3 9139.2
Flowrates in kmol/h Ethylene 49.9 25.0 25.0 0.0 0.0 0.0
Ethane 1.54 0.772 0.772 1.267 0.422 0.422
Propylene
13.9 4.6 4.6
Benzene
333.7 111.2 111.2
Toluene
7.01 2.34 2.34
Ethylbenzene
0.762 0.254 0.254
1,4-DiEthBenzene

53
Stream Name 33 34 35 36 37 38
Temperature oC 420.0 420.0 420.0 390.7 390.7 390.7
Pressure kPa 1950.0 1950.0 1950.0 1950.0 1950.0 1950.0
Vapor Mole Fraction 1.0 1.0 1.0 1.0 1.0 1.0
Total kmol/h 237.8 118.9 118.9 144.6 144.6 144.6
Total kg/h 18278.8 9139.4 9139.4 9862.7 9862.6 9862.8
Flowrates in kmol/h Ethylene 0.00124 0.00062 0.00062 25.0 25.0 25.0
Ethane 0.844 0.422 0.422 1.194 1.194 1.194
Propylene 9.28 4.64 4.64 4.64 4.64 4.64
Benzene 222.5 111.2 111.2 111.2 111.2 111.2
Toluene 4.67 2.34 2.34 2.34 2.34 2.34
Ethylbenzene 0.508 0.254 0.254 0.254 0.254 0.254
1,4-DiEthBenzene
Stream Name 39 40 41 42 43
Temperature oC 390.7 489.5 489.5 489.5 489.5
Pressure kPa 1950.0 1522.9 1522.9 1522.9 1522.9
Vapor Mole Fraction 1.0 1.0 1.0 1.0 1.0
Total kmol/h 144.6 122.0 122.0 122.0 122.0
Total kg/h 9862.8 9862.7 9862.6 9862.8 9862.8
Flowrates in kmol/h Ethylene 25.0 0.00225 0.00225 0.00225 0.00225
Ethane 1.19 1.19 1.19 1.19 1.19
Propylene 4.64 6.97 6.97 6.97 6.97
Benzene 111.2 91.0 90.9 91.0 91.0
Toluene 2.34 0.000985 0.000985 0.000985 0.000985
Ethylbenzene 0.254 22.9 22.9 22.9 22.9
1,4-DiEthBenzene
1.9x10^-5 1.9x10^-5 1.9x10^-5 1.9x10^-5

54
Stream Name 14 15 16 17 19
Temperature oC 491.0 40.0 40.0 42.3 155.4
Pressure kPa 1935.0 110.0 110.0 150.0 165.0
Vapor Mole Fraction 1.0 1.0 0.0 0.0 0.0
Total kmol/h 488.0 15.2 472.8 382.2 90.6
Total kg/h 39450.8 705.2 38745.7 29132.8 9612.9
Flowrates in kmol/h Ethylene 0.00900 0.00652 0.00248 0.00248
Ethane 4.78 3.09 1.69 1.69 Propylene 27.9 9.3 18.6 18.6 Benzene 363.8 2.7 361.1 360.9 0.2
Toluene 0.00394 0.00001 0.00393 0.00182 0.00211
Ethylbenzene 91.5 0.089 91.4 1.01 90.411
1,4-DiEthBenzene 7.5x10^-5
7.5x10^-5
7.5x10^-5

55
Appendix G: Optimized Cash Flow Statement

56
Appendix H: References
[1] Migniot, Jacques. ETHYLBENZENE : ENVIRONMENTAL, HEALTH &
SAFETY GUIDELINES. CEFIC. 12 December 2012.
http://www.ethylbenzene.org/content/1-2.html
[2] Turton, Richard. Analysis, Synthesis, and Design of Chemical Processes.
Upper Saddle. River, NJ: Prentice Hall, 2012. Print
[3] Wiley, Ron, Joe Bernardi, Joe Louvar, Dennis Hendershot, Dan Crowl, Ralph
W. Pike, Amy Theis, and Robert Johnson. Sache - Student Certificate
Program. Rep. American Institute of Chemical Engineers, Safety and
Chemical Engineering Education Program, n.d. Web. 01 Dec. 2014.
<http://sache.org/student_certificate_program.asp>.
[4] Perry, Robert H., Don W. Green, James O. Maloney. Perry’s Chemical
Engineers’ Handbook. New York: McGraw-Hill, 1984. Print.