optimization and control of a primary sag mill using real ... · pdf file1 optimization and...
TRANSCRIPT

1
Optimization and Control of a Primary SAG Mill Using Real-time Grind
Measurement
C.W Steyn*, K Keet**, W Breytenbach***
*Control Engineer, Anglo American Platinum, Control and Instrumentation Department, Johannesburg,
South Africa, (Tel: +2711-3736710; e-mail: [email protected])
**Process Engineer, Blue Cube Systems, Stellenbosch, South Africa (Tel: +2721-8801036; e-mail:
*** Metallurgical Technical Engineer, Anglo American Platinum, Waterval Concentrator Metallurgy, Rustenburg,
South Africa (Tel: +2714-5982261; e-mail: [email protected])
Abstract: Constrained energy supply and increasing steel and power cost, prompted Anglo American Platinum
(AAP) to investigate opportunities in operating its milling circuits more efficiently. Following this investigation,
model predictive control (MPC) with real-time optimization was implemented on the primary milling operations of
most AAP concentrators. The purpose of these controllers is to operate the primary mills within an optimized
region as determined by the grind curves of the mill and defined by the parameter constraints of the controller. At
Waterval Concentrator, the control application delivered a 4 % (passing 75 µm) improvement in the primary grind.
With the addition of a Blue Cube MQi analyzer, on-line grind measurements were incorporated in the control
algorithm of the primary mill. This resulted in a further 1.2% increase in the percentage passing 75 µm. In
addition to the increase in product fineness, milling efficiency was improved by reducing the effective power
consumption by 2.3 kWh/t (-75 µm).
Keywords: Comminution, SAG Milling, Model Predictive Control, Online Grind Measurement
1. INTRODUCTION
Optimization of primary milling circuits through application of model predictive control has been implemented
across all Anglo American Platinum’s operations. van Drunick and Smit (2006) have shown that milling is an
inefficient method of transferring energy into particle breakage and optimization strategies almost universally
include the maximization of a milling efficiency objective. The objective function is obtained by establishing the
effective power consumption measured as the power consumed per unit mass of desired product produced (kWh/t
passing 75 µm). With this strategy, the controller was able to move the mill power and load into the region that
delivers a finer grind without compromising on throughput. Due to the unavailability of reliable online grind
measurements, this algorithm was up until now based on shiftly averages which do not cater for higher (than shiftly)
frequency changes in the grind and took several weeks to achieve.

2
Powell et al. (2009) explains how ore body variations result in variable operation. This leads to variable grind,
which in turn leads to variable recovery of the desired mineral, which is not optimal. Anglo American Platinum’s
Waterval Concentrator treats mainly a blend of Merensky and UG2 ores, but also receives development reef,
screened waste and open cast material. Since the blending of these ores is not perfect, it can be assumed, that the
operating condition, primary grind and milling efficiency will also vary. An in-line grind analyser was installed on
the primary mill product in an attempt to control and possibly reduce flotation feed size variability.
The objectives of this study were to:
1. Evaluate the suitability and reliability of the in-line instrument used to measure real-time data,
2. Determine the minimum sampling frequency necessary to capture sufficient circuit dynamics for real-time
grind control,
3. Incorporate real-time grind control into the existing objective function and,
4. Review preliminary performance of the controller with respect to fineness of grind and milling efficiency.
This paper describes the control strategy implemented at Waterval Concentrator using a shiftly composite grind
measurement. The Blue Cube MQi in-line analyser is then discussed, together with the calculated minimum
sampling frequency necessary to prevent aliasing. The incorporation of real-time grind into the current control
algorithm is discussed and results are reviewed.
2. BENCHMARKED CIRCUIT
2.1. Process Flow and Control Infrastructure
Each Module at Waterval Concentrator (WvalC) employs a φ7.3 m x 8.2 m EGL SAG mills with 2 x 5200 kW
motors in primary milling duty. Two silos containing Merensky and UG2 ore respectively feed the mill that
operates at a fixed 75% of the critical speed. The circuit is closed with a 600 µm aperture classification screen with
the product reporting to the primary rougher flotation feed sump.
Steyn et al. (2010) explains the Anglo American Platinum (AAP) control philosophy for Run-of-Mine ball mills as
implemented at Mototolo Joint Venture. This includes a layered approach that involves synchronizing the
regulatory and supervisory control layers. The latter is administered by a rule-based administrator that allows on-
line optimization by means of model predictive control (MPC) and abnormal situation management by a fuzzy-logic
controller. The WvalC SAG milling operation applies a similar control schema but with changes to the fuzzy-logic
rules and dynamic models. The base-layer comprises of a series of cascading PID loops aimed at stabilizing the ore
feed, Merensky/UG2 ratio (MUR) and inlet water ratio to specific setpoints (SP). The latter is provided by an
operator with the aim of stabilizing power and load. This control schema is illustrated in figure 1. During
supervisory control, these human-machine-interface (HMI) SPs are annexed by the advanced process controller
(APC). The inlet water is an exception as the MPC bypasses the feed-forward control (FF) and writes directly to the
water flow PID. This was done to reduce non-linearity that might be introduced to the MPC models as a result of

3
controlling a ratio. The MPC also utilizes the feed size distribution on the belt, measured by means of a camera, as a
disturbance variable. The controller is thus able to perform FF to better reject upstream disturbances in the form of
feed ore variability.
Figure 1: The process flow and base-layer control diagram of WvalC primary milling circuit
2.2. Optimization – Grind Curves
Similar to the optimization algorithm described by Steyn et al. (2010), the MPC at WvalC aims at minimizing an
objective function formulated as a quadratic program (QP):
(1)
With constraints,
MVi,min < MVi < MVi,max
CVi,min < CVi < CVi,max
The objective function implemented at WvalC is an efficiency function minimizing the power used per ton of
desired product produced [kWh/t-75 µm]. The variables available for manipulation (degrees-of-freedom) in this
milling circuit were ore feed [t/h] and inlet water flow [m3/h]. Note that it is not possible to manipulate the MUR
within the QP, due to a silo management constraint. The ore feed and inlet water flow rate were regressed against
the calculated objective, which at the time was based on shiftly averages. The modelling was performed to
determine the magnitude and direction of the manipulative variables (MVs) in the QP, which are the coefficients of

4
the regression and given as the variable CSTi in equation 1. Figure 2 shows the model fit of the two remaining MVs
to the objective function with CSTi parameters: CSTFeed = -8 and CSTWat = 1.4. Since J in equation 1 is minimized,
these parameters translate to feed maximization having a higher priority than the minimization of water. The
accuracy of the model obtained was however questionable at a root-mean-square-error (RMSE) of 12% relative to
the objective function. This model however, only serves as an indication of optimization directionality and such
variance was considered acceptable.
As WvalC is ore supply limited, these optimization parameters meant that the feed, as first priority, would be driven
to the maximum allowable rate as specified by the mine plan. When this variable reaches its upper limit, the water
will be driven as low as possible until either constrained by its MV limit or some other corresponding control
variable (CV) limit. Note that the MPC algorithm follows a staged approach where a feasible solution is obtained
first, by possibly relaxing certain CV limits, before optimizing according to its QP.
20
40
60
80
28030032034036038040025
30
35
40
45
IW Flow
Effective Power Utilization Model - Linear Fit
Feed
Obj
.Fnc
.
Figure 2: The linear fit of ore feed and inlet water flow to milling efficiency based on shiftly averages
The main priority of the supervisory control layer is to stabilize the plant within a set recipe, as defined by its MV
and CV limits. Powell et al. (2009) describes that advanced control solutions have proven to successfully achieve
this objective. However, obtaining the operating conditions (or recipe) that will target optimal milling in terms of its
grind curves, should be considered a priority. This recipe or feasible region of operation is determined by
conducting a series of crash stops and recording the volumetric filling, load indication (by means of lubrication
pressure) and power draw of the mill. These tests were conducted at WvalC over the period Sep 2010 to Nov 2010
where 4 crash stop reference points where collected – see figure 3. A fairly linear load and power curve was
obtained with R-squared statistics of 0.99 and 0.93 for the load and power to volume filling models respectively.
The first observation from these crash stops was that the mill was being operated at very low volume fillings of
between 14 % and 26 %. The aim was to provide the controller with an operating region where the finest grind
could be achieved for the specific ore feed rate. Powell et al. (2009) indicate that a finer grind is usually achieved at
volume fillings higher than 30 %, with a possible grind peak for mills operating at speeds of 75 % critical. It was
estimated that the highest volume filling achievable, given the constrained ore supply, was between 30 % and 35 %.

5
This target filling was well within the region where Powell et al. located the grind peak. Powell and Mainza (2006)
found that load, inferred from the lubrication pressures, to volume filling tends to be more non-linear at higher loads.
The WvalC crash stop data only provided data in the low load linear region. In the absence of data at higher volume
filling, the low load linear model was extrapolated to the target volume filling region. The 30 % to 35 % operating
load region was estimated to be between 570 tonne and 605 tonne.
y = 82.987x + 2822.1R² = 0.9375
y = 7.033x + 360.28R² = 0.9972
440
460
480
500
520
540
560
580
600
620
1000
1500
2000
2500
3000
3500
4000
4500
5000
5500
10.0 15.0 20.0 25.0 30.0 35.0 40.0
Lo
ad (
ton
s)
Po
wer
(kW
)
Vol. Filling (%)
WvalC Grind Curves
Power Load
1
2
4
3
5.1
5.2
Figure 3: WvalC primary SAG mill grind curves (Sep 2010 to Oct 2010)
Hulbert (2006) warns that external factors might invalidate the comparison of results based on data before versus
data after a process change. It was not possible to obtain data where the controller was off during the periods Dec
’10 to Feb ’11 due to the value that the operation attributes to the controller. Despite this, a grind and load
comparison of three months before and after the implementation of this optimization (in Nov 2010) was conducted.
An average of 77.4 ton or 16 % increase from 477 ton to 555 ton was observed on mill load between periods Aug
’10 to Oct ’10 and Dec ’10 to Feb ’10 (figure 4a). An average grind increase of 4 % passing 75 µm, without
significantly affecting throughput, was obtained over the same periods, which was attributed to this increase in mill
load (figure 4b). The grind results obtained a > 95 % confidence interval for rejecting the null hypothesis on shiftly
averaged data. It is also important to note the decrease in load variation achieved with the MPC. A 41 % reduction
in the load standard deviation, from 23.8 ton to 14.1 ton was recorded. This stability improvement enables the
operation to control the mill within a smaller operating region. This capability should prove very useful in
stabilizing the mill in an area of optimal grind should a grind peak, in terms of the grind curves, be established.

6
150
160
170
180
190
200
210
220
27
28
29
30
31
32
33
34
35
36
37
Aug-10 Sep-10 Oct-10 Nov-10 Dec-10 Jan-11 Feb-11
t/h
% -
75
µµ µµm
Prim Grind Throughput
30.9
35.3
Figure 4: a) The normal distribution of the load for a three month period before (blue) and after (red) the controller
installation and first pass optimization of the primary mill and, b) the average monthly grind and throughput results
for the same period (4% passing 75 µm grind difference > 95 % confidence).
Although a significant increase in product fineness was established, the average monthly grind for Dec ’10 and Feb
’11 did not achieve the desired minimum grind target of 35 % passing 75 µm. The objective of ensuring a
continuous supply of product above the target grind, at the intended higher volume fillings, was not achieved. The
need for a reliable source of real-time grind to achieve an acceptable measure of quality control was identified.
3. ONLINE GRIND MEASUREMENT
3.1. Background
The technology investigated for grind measurement is based on diffuse reflective spectroscopy. Cardenas-Valencia
and Garcia-Rubio (2001) reported that multi-wavelength reflectance and transmittance spectroscopy measurements
contain information on several particle properties of interest such as particle size, particle counts and chemical
composition. Haavisto (2009) also reported that particle size strongly affects overall reflectance in minerals. It was
found that in pyrite and chalcopyrite, samples with smaller particles are less reflective, whereas the opposite was
true for sphalerite and barite.
Blue Cube Systems (Pty) Ltd designs equipment that utilises the changes to the optical spectra together with
proprietary chemometric methods to make real-time data available for mineral grade. The same technology is being
applied to make particle size data available.
3.2. Installation
An MQi in-line analysing system was supplied by Blue Cube Systems (Pty) Ltd. and was installed on the primary
flotation feed of Module 1 at WvalC. This stream is also the product of the primary comminution circuit. The system
was installed in a turbulent, vertical pipe section after the pump (to ensure optimum homogeneity) and consists of
the following units:

7
• Pipe assembly (with identical pipe dimensions and lining as the host pipeline) with a square flange, making
provision for the scan head and round flange making provision for the pneumatic sampler,
• Scan head and optical processor joined by optical fibres housed in a hydraulic hose,
• Pneumatic sampler for calibration purposes,
• Data processor used for computations from optical data to grind data using the latest uploaded calibration based on chemometric methods,
• Communications unit that enables remote support and the uploading of calibrations,
• Interface unit where analogue outputs to SCADA is connected as well as other cabling.
Data is made available for the %-75µm and %+150µm particle size fractions. The remaining fraction (75µm –
150µm) can be calculated from the reported fractions.
Figure 5: The BlueCube MQi installation at Waterval Concentrator, Module 1
3.3. Maximum sampling interval time
Mercus (2008) reported that one of the requirements for successful process control is measuring at sufficient
frequency in relation to the process dynamics. Aliasing occurs when data is sampled at interval times longer than
those which would capture the dynamics of a process.
The MQi can provide particle size data at 15 second intervals, and with this data frequency, it is possible to quantify
the maximum sampling interval time to prevent aliasing. This is calculated by considering the Fourier transform of
the uncontrolled data over a specified time frame. The Fourier transform expresses the mathematical function of
time as a function of frequency (or cycle time as its inverse). The Nyquist-Shannon sampling theorem is then
applied as it states that a minimum sampling rate of more than twice the highest frequency component within a
signal is required to avoid temporal aliasing distortion. The maximum sampling interval (MSI) is then calculated as
a function of the cycle time that accounts for 90 % of the variance (CT90):
MSI = 0.5 x CT90 (2)
8
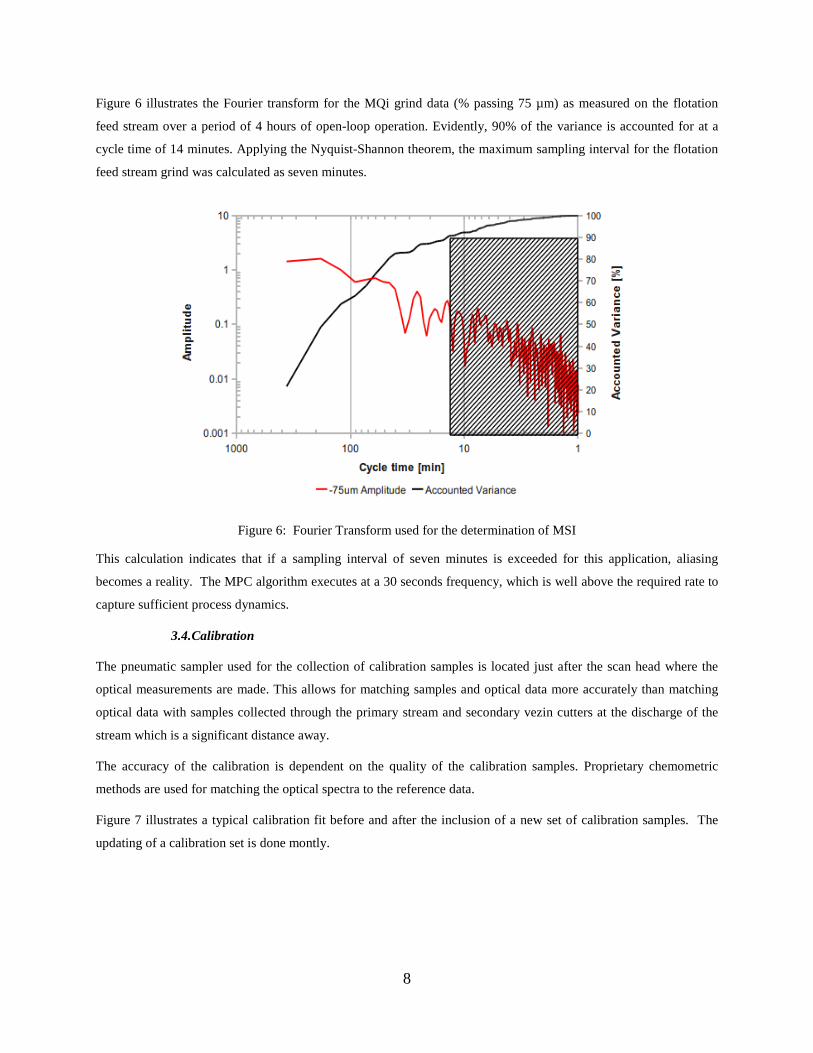
Figure 6 illustrates the Fourier transform for the MQi grind data (% passing 75 µm) as measured on the flotation
feed stream over a period of 4 hours of open-loop operation. Evidently, 90% of the variance is accounted for at a
cycle time of 14 minutes. Applying the Nyquist-Shannon theorem, the maximum sampling interval for the flotation
feed stream grind was calculated as seven minutes.
Figure 6: Fourier Transform used for the determination of MSI
This calculation indicates that if a sampling interval of seven minutes is exceeded for this application, aliasing
becomes a reality. The MPC algorithm executes at a 30 seconds frequency, which is well above the required rate to
capture sufficient process dynamics.
3.4. Calibration
The pneumatic sampler used for the collection of calibration samples is located just after the scan head where the
optical measurements are made. This allows for matching samples and optical data more accurately than matching
optical data with samples collected through the primary stream and secondary vezin cutters at the discharge of the
stream which is a significant distance away.
The accuracy of the calibration is dependent on the quality of the calibration samples. Proprietary chemometric
methods are used for matching the optical spectra to the reference data.
Figure 7 illustrates a typical calibration fit before and after the inclusion of a new set of calibration samples. The
updating of a calibration set is done montly.

9
Figure 7: Data fit before and after updating of a calibration set
4. ONLINE GRIND CONTROL
4.1. Grind Response
The availability of a reliable and accurate real-time grind measurement allowed the response of the product fineness
to each of the manipulated variables to be measured, and ultimately controlled. Dynamic model measurement
commenced with a step campaign during the period December 2011 to January 2012. The resulting step responses
with the corresponding model uncertainties are presented in figure 8. The model uncertainty is calculated by the
AspenTechTM software as a function of the variance of the resulting step response coefficients. An uncertainty
rating of A, B, C or D, with A representing very low uncertainty and D very high, is generated for both the dynamic,
high frequency and for the steady-state, low frequency responses. Note that the primary focus of this campaign was
to obtain the steady-state model gain of the grind for optimization purposes, rather than the higher frequency
dynamic response. Reducing the steady-state uncertainty was thus targeted through long +60 minute step durations.
Mill Feed (t/h): As expected, an increase in fresh feed resulted in a decrease in product fineness. A steady state
gain of -0.03 was observed for an increase of 1 t/h at a very low steady-state uncertainty (A-rating) (see figures 8a
and 8b).
Inlet Water Flow (m3/h): The inlet water flow response resulted in an increase in the fineness of grind with a gain
of 0.23 % passing 75 µm for a 1 m3/h water flow increase. Again a model uncertainty rating of A confirmed that
this response was very repeatable at lower frequencies. This water response was probably the most interesting result
of the modelling campaign. It indicated that in the attempt to increase milling performance by increasing the mill
load, according to the information of the grind-curves (section 2.2); the inlet water flow was lowered to a point
which resulted in very high in-mill viscosity. According to Napier-Munn (1999), the mill was driven, in all
probability, into the region marked “C” in figure 9, where the net production rate decreased rapidly with an increase

10
in in-mill % solids. Operating at higher water addition rates was cited as a possible opportunity to increase fineness
of grind of the mill product.
Figure 8: a) The primary mill dynamic models with product grind and b) the model uncertainty for these grind
models.
Feed Size (% -45 mm): A feed size increase of 1% in the passing 45 mm aperture range resulted in a steady state
reduction of -0.012 % passing 75 µm in product grind. The model uncertainty does report a “C”-rating, typical to
feed-forward variables that are uncontrolled and hence not possible to conduct crisp steps. The -45 mm sized
particles in the feed are typically considered too fine to participate as grinding media. It is therefore interesting to
observe that the grind fineness improves when the more competent autogenous grinding material, in the % retained
by the 45 mm sizes, is increased.
Figure 9: Net production rate as a function of the % solids inside the mill (Napier-Munn 1999)

11
4.2. Optimization
In an attempt to improve the model quality and provide more precise optimization parameters, CSTi, the objective
function discussed in section 2.2 was reviewed with the higher frequency grind measurement in equation 1. The
reviewed cost parameters obtained from this linear model fit are reported: CSTFeed = -12 and CSTWat = 5.2 (figure
10). The resulting model quality indicated an improvement with the higher frequency data, reducing the RMSE from
12 % to 4.8 % relative to the milling efficiency objective. It is reassuring to observe that the directionality of the
two MVs were the same as the shiftly averages model. The ratio of CSTFeed to CSTWat also remained similar at a
ratio of 2.3 (previous ratio, 5.7), again indicating that feed maximization was still the higher priority.
Figure 10: The linear fit of ore feed and inlet water flow to milling efficiency based on one minute sampled data
Since the optimization direction of the QP for both MVs will decrease fineness of grind, according to the dynamic
models in figure 8, a minimum grind constraint had to be imposed on the optimization. As the targeted minimum
for the primary mill product grind at WvalC is 35 % passing 75 µm, the controller grind minimum was set to 36 %
passing 75 µm, thus providing the controller with a 1 % passing 75 µm safety margin. The typical control scenario
would then be for the feed to increase to the ore supply maximum and subsequent to that will the water decrease to
either the water addition minimum or the grind minimum constraint of 36 % passing 75 µm.
4.3. Preliminary Results
At the time of the report, a structured ON/OFF test of grind control versus pre-grind control had not yet been
performed. The results evaluated in this section are for a period of a week with the online grind analyzer but before
grind control compared to a week with grind control. During periods where grind control was active, results showed
a average of 1.24 % passing 75 µm increase in fineness of grind as well as a 0.35 % passing 75 µm (absolute)
reduction in standard deviation from 1.77 % to 1.42 % (passing 75 µm). The probability density function (PDF) of
the grind during control presented a skewed distribution with a mean at 36.1 % passing 75 µm but a mode at a lower

12
value of 35.4 % passing 75 µm. As no control action was necessary at grinds higher than 36 % passing 75 µm, a
cliff-tent distribution was expected, with a wider distribution for grinds greater than 36 % passing 75 µm and a sharp
decline to the left of the 36 % passing 75 µm limit. To ensure a product grind above the targeted operational
minimum (TGTMIN) of 35 % passing 75 µm, within a 95 % probability, the grind minimum constraint (CTRLMIN)
was set to a value of: CTRLMIN = TGTMIN + 2σ. This equates to a minimum grind limit of 37.8 % passing 75 µm.
A decrease from 36.39 to 34.08 kWh/t (passing 75 µm) was observed on the milling efficiency objective with the
addition of grind control. This indicates that the mill will require 2.32 kWh less power to produce a ton of desired
product.
Figure 11: The normal distributions of a) the product grind in % passing 75 µm and b) the milling efficiency
(objective function) in kWh/t(passing 75 µm) for periods before (Dec ’11) and after (Jan ’12) active grind control.
5. FUTURE DEVELOPMENT
The monetary value of a finer, more stable mill product grind and a more efficient operation is still to be determined.
Determining the consequence of milling performance is often considered difficult as no concentration of valuable
material is achieved (Sosa-Blanco et al 2000, Hodouin et al. 2001). The financial impact of milling product on the
performance of subsequent beneficiation processes was presented by Wei and Craig (2009b) as typically in the form
of a quadratic performance function of recovery versus particle size (figure 12a). Lynxx and Bush (1977) did
however find this relationship to be more of the form shown in figure 12b, with a sharp increase in recovery as the
overall particle size gets finer, a plateau and eventually a drop-off at very fine grinds.

13
Figure 12: a) A quadratic performance function of recovery to particle size (Wei and Craig 2009b) and b) the Lynxx
and Bush (1977) representation of the recovery to particle size relationship
It is assumed that the extremely fine grinds necessary to result in a decrease in recovery will not be obtained in a
primary milling operation at the current throughput. Determining the recovery to primary milling product size
relationship is key to allocating a potential monetary value to the grind controller.
It is also important to consider the impact of (a) degree of grinding efficiency and (b) variation in grind on the
quality of the recovered flotation product. Variation in the fineness of grind has a significant impact on the
efficiency of all classification and flotation processes. Coarse fractions may vary and so will the destination of the
classified ore particles. If a low degree of grinding efficiency is experienced, non-liberated particles may bypass the
secondary milling stage and may not be recovered during flotation. In the event of excessive grinding an excellent
degree of liberation is achieved. However, valuables are not the only material reduced in size. Gangue including
chrome and silicates are also reduced in size and are easily entrained during flotation. Chemical reagent dosing is
pre-determined and optimized for a certain degree of liberation. Measurable quality attributes include the
concentrate grade and the concentrate mass pull, both affecting the Smelter cost and efficiency.
Future work therefore includes laboratory flotation tests at various sized ore particles (size-by-size recovery
analysis) to determine this relationship. The ultimate goal of the optimization objective will be to control the grind
closer to the lower end recovery drop-off or shoulder (figure 12b and 13). By lowering the minimum allowable
grind, the controller will actively drive the water and, according to the dynamic models, the power usage
downwards. This will result in less power usage for a product grind that will still provide sufficient recovery
potential. Achieving this, the lowest possible power usage for a product that will not impede on the beneficiation
performance will be realized. This optimal control philosophy is illustrated in figure 13.
In addition, Waterval Concentrator employs two further milling operations in its process flowsheet, a secondary ball
milling circuit, followed by a Mainstream Inert Grinding (MIG) ISA milling circuit. Selection and control of the

14
transfer sizes between these three comminution operations is key to optimising overall plant recovery and energy
utilization.
Re
cov
ery
Product Particle Size
Shoulder
Current PDF of the
primary milling
product
95 % probability (2σ)
Figure 13: Optimizing the milling efficiency by producing a product that will not impede on recovery but uses
fewer resources to achieve
6. NOMENCLATURE
AAP Anglo American Platinum
FFC Flow ratio controller (ISA 5.1)
WFC Weight ratio controller (ISA 5.1)
PID Proportional Integral Derivative
WT Weightometer
FT Flow meter
LNX Lynxx image analyzer (feed ore size measurement)
MPC Model Predictive Control
BC BlueCube
CSTi Cost Parameter of variable MV in the QP
QP Quadratic Program
JT Power indicator
MV Manipulated Variable
CV Controlled Variable
WvalC Waterval Concentrator
MUR Merensky/UG2 Ratio
CT90 Cycle time where 90% of the variance is accounted for (from the Fourier transform)

15
7. ACKNOWLEDGEMENTS
1. To AAP Process Control Department, Dr R de Villiers, G Humphries and D Muller.
2. To Waterval Concentrator staff for all their effort and support during this project.
3. Gustaf Gouws and the BluESP team who was part of the initial controller design.
8. REFERENCES
Cardenas-Valencia, A.M, and Garcia-Rubio, L.H. Reflectance Spectroscopy Probes for Continuous Process Monitoring of Particle Size, Concentration and Chemical Composition, 2001. Merkus, G. Particle Size Measurements: Fundamentals, Practice, Quality. ISBN1402090153, 9781402090158, Springer, Delft, 2008. Napier-Munn, T. J., Morrell, S., Morrison, R. D., and Kojovic, T. Mineral Comminution Circuits, their Operation and Optimization, JKMRC – Queensland University. Steyn, C. W., Brooks, K. S., de Villiers, P. G. R., Muller, D., Humphries, G. A holistic approach to Control and Optimization of an Industrial Run-of-Mine Ball Milling Circuit. IFAC MMM 2010 Conference Paper. Powell, M. S., van der Westhuizen, A. P., Mainza, A. N. Applying Grindcurves to Mill Operation and Optimization. Minerals Engineering, 22, Elsevier, 2009 Powell, M. S., Mainza, A. N. Extended Grinding Curves are Essential to the Comparison of Milling Performance. Minerals Engineering, 19, 2006 Van Drunick, W., Smit, I. Energy Efficient Comminution – HPGR Experience at Anglo Research. SAG Conference 2006, Department of Mining Engineering, University of British Columbia, Vancouver