optimization of 16s amplicon analysis using mock ... 1 optimization of 16s amplicon analysis using...
TRANSCRIPT

1
Optimization of 16S amplicon analysis using mock communities: implications for 1
estimating community diversity 2
3
Andrew Krohn1,2, Bo Stevens3, Adam Robbins-Pianka4, Matthew Belus5, Gerard J. Allan1,2, 4
Catherine Gehring1,6 5
6
1Department of Biological Sciences, Northern Arizona University, Flagstaff, AZ 7
2NAU Environmental Genetics and Genomics Laboratory, Flagstaff, AZ 8
3School of Earth Sciences and Environmental Sustainability, Northern Arizona University, 9
Flagstaff, AZ 10
4Department of Computer Science, University of Colorado Boulder, Boulder, CO 11
5Anschutz Medical Campus, University of Colorado Denver, Aurora, CO 12
6Merriam-Powell Center for Environmental Research, Flagstaff, AZ 13
14
Corresponding Author: 15
Andrew Krohn1,2 16
17
Email address: [email protected] 18
19
20
21
22
23
24
25
26
27
28
29
30
31
32
PeerJ Preprints | https://doi.org/10.7287/peerj.preprints.2196v3 | CC BY 4.0 Open Access | rec: 26 Oct 2016, publ:

2
Abstract: 33
The diversity of complex microbial communities can be rapidly assessed by high-34
throughput DNA sequencing of marker gene (e.g., 16S) PCR amplicon pools, often yielding 35
many thousands of DNA sequences per sample. However, analysis of such community amplicon 36
sequencing data requires multiple computational steps which affect the outcome of a final data 37
set. Here we use mock communities to describe the effects of parameter adjustments for raw 38
sequence quality filtering, picking operational taxonomic units (OTUs), taxonomic assignment, 39
and OTU table filtering as implemented in the popular microbial ecology analysis package, 40
QIIME 1.9.1. We demonstrate a workflow optimization based upon this exploration, which we 41
also apply to environmental samples. We found that quality filtering of raw data and filtering of 42
OTU tables had large effects on observed OTU diversity. While all taxonomy assignment 43
programs performed with similar accuracy, an appropriate choice of similarity threshold for 44
defining OTUs depended on the method used for OTU picking. Our “default” analysis in QIIME 45
overestimated mock community OTU diversity by at least a factor of ten. Our optimized analysis 46
correctly characterized mock community taxonomic composition and improved the OTU 47
diversity estimate, reducing overestimation to a factor of about two. Though observed relative 48
abundances of mock community member taxa were approximately correct, most were still 49
represented by multiple OTUs. Low-frequency OTUs conspecific to constituent mock 50
community taxa were characterized by multiple substitution and indel errors and the presence of 51
a low-quality base call resulting in sequence truncation during quality filtering. Low-quality base 52
calls were observed at “G” positions most of the time, and were also associated with a preceding 53
“TTT” trinucleotide motif. Environmental diversity estimates were reduced by about 40% from 54
2508 to 1533 OTUs when comparing output from the default and optimized workflows. We 55
attribute this reduction in observed diversity to the removal of erroneous sequences from the data 56
set. Our results indicate that both strict quality filtering of raw sequencing data and careful 57
filtering of raw OTU tables are important steps for accurately estimating microbial community 58
diversity. 59
60
61
62
63
PeerJ Preprints | https://doi.org/10.7287/peerj.preprints.2196v3 | CC BY 4.0 Open Access | rec: 26 Oct 2016, publ:

3
Introduction: 64
Over the past decade, amplicon sequencing of marker gene fragments has become the 65
preferred method for profiling the diversity of microbial communities. Briefly, the technique 66
uses the polymerase chain reaction (PCR) to amplify a pool of PCR products from an 67
environmental sample to be resolved by high throughput DNA sequencing. Similar sequences 68
are binned together into operational taxonomic units (OTUs) and compared against a database to 69
obtain taxonomic classifications. Amplicon sequencing is flexible in that a community can be 70
profiled for different genes which may represent markers specifically suited for identification of 71
certain microbial constituents (e.g., 16S for bacteria and archaea, ITS for fungi). Similarly, 72
profiling with functional genes can offer a better understanding of community traits (e.g., 73
Bentzon-Tilia et al., 2015). While communities were originally profiled with high-throughput 74
sequencing on 454 pyrosequencing instruments (Sogin et al., 2006), amplicon sequencing has 75
been adapted to newer instrumentation including sequencers from Illumina (Caporaso et al., 76
2012) and Pacific Biosciences (Fichot & Norman, 2013). Illumina sequencing is currently the 77
most popular option due to several factors including cost, throughput, instrument availability, 78
and the existence of multiple protocols for amplification and sequencing of marker gene pools on 79
this platform (Caporaso et al., 2012; Bokulich & Mills, 2013; Kozich et al., 2013; Fadrosh et al., 80
2014). 81
Accurate determination of community diversity and taxonomic content are often primary 82
aims of community amplicon sequencing projects. Systematic errors experienced during sample 83
preparation, such as PCR and sequencing errors, can contribute to overestimation of diversity 84
(Kunin, 2010). Additionally, signal cross-talk during index sequence cycles on Illumina 85
sequencers can lead to false identification of an organism in a sample (Kircher, Sawyer & 86
Meyer, 2012; Nelson et al., 2014). In the face of such potential complications, careful analysis is 87
necessary to ensure that diversity estimates are not inflated and that data are properly filtered to 88
avoid Type II errors. Several comprehensive tools exist for processing such data including 89
mothur (Schloss et al., 2009), QIIME (Caporaso et al., 2010a), and UPARSE (Edgar, 2013). 90
Many stand-alone tools are also available for performing specific bioinformatic tasks which may 91
or may not be implemented in QIIME, mothur or UPARSE. It may be beneficial in some cases to 92
perform separate bioinformatic steps with different software packages in order to obtain the most 93
PeerJ Preprints | https://doi.org/10.7287/peerj.preprints.2196v3 | CC BY 4.0 Open Access | rec: 26 Oct 2016, publ:

4
accurate community representation for a given ecosystem. For instance, the use of various pre-94
processing tools (e.g., error correction, chimera filtering) may improve the outcome for a given 95
data set. In this instance, the average researcher would require greater familiarity with the 96
production and processing of amplicon sequencing data in order to make the best decisions 97
during data processing. 98
Automated quality filtering is among the first steps performed in any sequencing project 99
and is a necessity for managing modern DNA sequencing data sets. To achieve the status of 100
“finished,” genome sequencing projects require consensus base quality scores where the 101
likelihood of an incorrect base call is less than 1 in 100,000 (q50), whereas assemblies using 102
unfiltered data are considered “standard draft” and are expected to contain errors (Chain & 103
Grafham, 2009). The default parameters in QIIME 1.9.1 require a minimum quality score of q4 104
as recommended by Bokulich et al. (2013), and should be similarly treated as “draft” data. More 105
reads are retained for downstream analysis, but a low quality score requirement also introduces 106
an unknown degree of sequencing error as base quality scores may vary widely across a single 107
sequencing run. Thus, data generated on runs with higher average error rates are more likely to 108
overestimate alpha diversity if quality scores are not strictly controlled (at the expense of 109
sequencing depth). Inconsistent qualities from sequencing runs can be effectively controlled via 110
quality filtering, and default quality filtering in QIIME retains reads that may be variably 111
trimmed to a range of 75-100% of the original sequence length. Because the quality of different 112
sequences may decrease non-uniformly across a sequencing run, variable read lengths may also 113
contribute to an inflated estimate of OTU richness if reads are not de-replicated or sorted by size 114
prior to clustering. Various error correction algorithms are available for processing Illumina data 115
(e.g., Kelley, Schatz & Salzberg, 2010; Medvedev et al., 2011; Nikolenko, Korobeynikov & 116
Alekseyev, 2013), the use of which may result in an increased number of reads retained 117
following quality filtering. Callahan et al. (2016) recently demonstrated a data processing 118
workflow that utilized error correction with good success, where the number of expected taxa 119
approximately equaled the number of observed OTUs, though we do not explore the use of error 120
correction techniques here. Chimera filtering, commonly performed following quality filtering, is 121
essential to remove PCR artifacts and further improves sequencing data quality. 122
PeerJ Preprints | https://doi.org/10.7287/peerj.preprints.2196v3 | CC BY 4.0 Open Access | rec: 26 Oct 2016, publ:

5
Quality-filtered amplicon sequencing data are clustered into OTU definitions, a 123
computational process for which numerous programs are available. CD-HIT (Fu et al., 2012), 124
UCLUST (Edgar, 2010), BLAST (Altschul, 1990), and Swarm (Mahé et al., 2014) are popular 125
options that are all available in QIIME. Reference-based analysis techniques, such as BLAST, 126
are known to incur biases according to the choice of reference database (Nelson et al., 2014), but 127
can easily be parallelized for more efficient computation. UCLUST can utilize a reference 128
database, perform database-independent de novo clustering, or, as with the open-reference 129
strategy currently implemented in QIIME, a combination of both methods (Navas-Molina et al., 130
2013). Pure de novo analysis is preferred by many as the approach least likely to impose a bias 131
on the final outcome. One popular option for de novo OTU clustering is CD-HIT, but as this 132
program cannot be parallelized it can be time-prohibitive when used with larger data sets. 133
Swarm, another de novo OTU clustering program, allows for portions of the de novo clustering 134
process to be parallelized, thus eliminating database-specific effects while also optimizing 135
computational requirements. All OTU picking programs require the researcher to choose a 136
similarity or distance threshold beyond which two sequences must be considered as separate 137
OTUs. If present at this stage, PCR or sequencing errors may contribute to OTU inflation to an 138
unknown degree. In addition to ensuring the data are properly filtered, one can also utilize a 139
conservative clustering threshold in order to avoid overestimation of community diversity (i.e., 140
≤97%; Kunin et al., 2010). 141
Taxonomic assignment, achieved through comparison of OTU definition sequences to a 142
reference database, can also be performed in a variety of ways. Popular methods include 143
BLAST, UCLUST, and RDP (Wang et al., 2007), and each are available in QIIME. In 2008, Liu 144
et al. reported that RDP provided the most accurate taxonomic assignments. Presently, other 145
techniques continue to be utilized by various amplicon sequencing analysis pipelines (e.g., 146
Giongo et al., 2010; Gweon et al., 2015), revealing a lack of consensus among researchers. 147
Considering that improved taxonomic accuracies may be observed when sequences obtained for 148
study organisms are more similar to those populating the reference database, the relative success 149
of each algorithm may be context-dependent. For environmental data sets, accuracies of 150
taxonomic assignments are estimated by means of a confidence or quality value relevant to the 151
utilized technique (e.g., e-value for BLAST). Careful assessment of taxonomic accuracies can 152
PeerJ Preprints | https://doi.org/10.7287/peerj.preprints.2196v3 | CC BY 4.0 Open Access | rec: 26 Oct 2016, publ:

6
only be done when the sequence content of a given sample can be anticipated. This can be 153
achieved with synthetic mock communities created in silico by extracting sequences from a 154
database (e.g., Bellemain et al., 2010) or using genomic mock communities that combine DNA 155
extracts from cultured organisms. Neither scenario is likely to provide an outcome that is directly 156
comparable to the natural complexities of environmental communities, yet both can offer a 157
measure of accuracy for taxonomic assignment methods. 158
Once quality filtered sequences have been clustered and taxonomically classified, they 159
are compiled into an OTU table with count data for each observation. As OTUs defined from 160
erroneous sequences may persist to this point in an analysis, the resulting OTU table must be 161
filtered prior to conducting diversity analyses, and the filtering approach can have a profound 162
effect on the final result (Bokulich et al., 2013). Although Bokulich et al. (2013) suggested the 163
inclusion of mock communities on sequencing runs to assess the overall run quality and improve 164
diversity assessments, they also provide a general recommendation to quality filter the final table 165
by removing OTUs that represent less than 0.005% of the total read abundance. This has proven 166
to be a useful guideline for numerous studies in which mock communities were not included. 167
However, this practice ignores the independence of each sample and will treat samples 168
differently according to sequencing depth such that low read count samples will be more 169
severely filtered than samples with higher read counts. 170
Considering samples independently, Kircher, Sawyer & Meyer (2012) observed an 171
indexing inaccuracy rate of 0.3%, citing cluster mixing during sequencing as a mechanism by 172
which single-indexed Illumina sequences are likely attributed incorrectly to a particular sample. 173
For certain applications, their result argues that such data must be filtered at 0.3% by sample in 174
order to avoid Type II errors. Another common practice is to remove singleton OTUs (by sample 175
or by table) under the assumption that such OTUs represent errors generated during sequencing 176
(see Dickie, 2010). However, errors introduced during early PCR cycles may be faithfully 177
replicated many times so as to appear as valid OTUs, causing overestimation of OTU richness 178
even after singleton filtering (Nguyen et al., 2015). As an alternative, Nguyen et al. (2015) 179
suggest the removal of low-count or low-proportion OTUs by sample at a threshold informed by 180
mock community data. Mock communities used in this way may also identify certain sequence 181
motifs prone to error, which may help to identify whether novel OTUs observed in 182
PeerJ Preprints | https://doi.org/10.7287/peerj.preprints.2196v3 | CC BY 4.0 Open Access | rec: 26 Oct 2016, publ:

7
environmental data should be considered suspect. Unfortunately, such controls are not available 183
for many data sets and artificial communities may not perform similarly to environmental 184
communities during sample preparation and analysis. Because samples are amplified 185
independently, PCR errors are likely to be present in the form of private OTUs observed only in 186
a single sample, so removal of unshared OTUs may be another effective precaution against 187
overestimation of diversity due to sequencing error. 188
As these examples illustrate, accurate filtering of an OTU table is not straightforward. 189
The sequence misattribution rate reported by Kircher, Sawyer & Meyer (2012) is vastly different 190
than the filtering threshold of 0.005% recommended by Bokulich et al. (2013), though their 191
recommendation was to filter across the entire OTU table. Since many amplicon sequencing 192
studies report relatively few taxa present above 0.3% per sample, filtering by sample at this 193
threshold (Kircher threshold) will exclude many valid taxa. The presence of misattributed 194
sequences may also diminish the efficacy of private OTU removal to eliminate PCR errors, 195
though dual-indexing of samples should reduce or eliminate sequence misattribution events 196
(Kircher, Sawyer & Meyer, 2012). Singleton filtering, however applied, is unlikely to be 197
thorough enough to remove errors that are either replicated during the PCR process or systematic 198
errors from the sequencing process. For single- or dual-indexed Illumina data, filtering at 0.005% 199
across the entire table (Bokulich threshold) may represent a viable compromise between 200
confident assignment of sequences to samples and the stringency that one imposes on filtering 201
the final table. 202
In this study, we used simple genomic mock communities and an environmental data set 203
to describe the effects of parameter adjustments for methods implemented in QIIME 1.9.1 204
(Caporaso et al., 2010a) on sequence quality filtering, OTU picking, taxonomic assignment, and 205
OTU table filtering. We focused on QIIME because of its popularity and flexibility for 206
processing amplicon sequencing data sets. We hypothesized that observed OTU diversity will be 207
inflated due to the presence of PCR and/or sequencing artifacts, and that such effects will be 208
observable in simple genomic mock communities under the expectation that one OTU should be 209
observed per constituent taxon. Using five mock communities consisting of 4-8 taxa each, we 210
developed a modified protocol for the analysis of 16S community amplicon sequencing data, and 211
demonstrate the method on an environmental data set. By carefully controlling each of the steps 212
PeerJ Preprints | https://doi.org/10.7287/peerj.preprints.2196v3 | CC BY 4.0 Open Access | rec: 26 Oct 2016, publ:

8
that we investigated, we were able to describe mock community compositions more correctly 213
than with a default workflow. 214
215
Materials and Methods: 216
217
Mock communities 218
DNA was extracted from axenic cultures of Pseudomonas aeruginosa (Proteobacteria), 219
Proteus vulgaris (Proteobacteria), Klebsiella pneumoniae (Proteobacteria), Escherichia coli 220
(Proteobacteria), Bacillus megaterium (Firmicutes), Lactococcus lactis (Firmicutes), 221
Staphylococcus aureus (Firmicutes), and Micrococcus luteus (Actinobacteria) using a PowerSoil 222
DNA Extraction Kit (MoBio Laboratories, Carlsbad, CA). DNA was quantified by PicoGreen 223
(Life Technologies, Carlsbad, CA) fluorescence, and normalized to approximately 0.75 ng/µL. 224
Five mock communities containing different ratios of bacterial taxa were constructed from the 225
extracted DNA. Community 0 contained equal volumes of DNA from each taxon; Community 226
1a contained 8% M. luteus, 42% B. megaterium, 42% L. lactis, and 8% S. aureus; Community 1b 227
contained 42% M. luteus, 8% B. megaterium, 8% L. lactis, and 42% S. aureus; Community 2a 228
contained 8% E. coli, 8% K. pneumoniae, 42% P. vulgaris, and 42% P. aeruginosa; Community 229
2b contained 42% E. coli, 42% K. pneumoniae, 8% P. vulgaris, and 8% P. aeruginosa. Final 230
concentrations for each mock community were determined to be ~ 0.75 ng/µL (Table S1). 231
Expected compositions of mock communities were corrected for genome size and copy number 232
against the CBS Genome Atlas Database (Hallin & Ussery, 2004). 233
234
Environmental samples 235
Environmental samples with an expected environmental contrast were collected from the 236
Northern Arizona University Pinyon Pine Common Garden near Sunset Crater National 237
Monument, AZ. During garden installation in October 2009, soil samples were collected from 238
holes dug to plant seedlings (“pre-tree” treatment). Soil core samples were taken from the same 239
seedlings in December 2010 (“post-tree” treatment). The top 2 centimeters (cm) of soil were 240
brushed aside prior to taking cores. A 2.5 cm diameter metal corer was placed 2 cm from the 241
seedling base and driven to a depth of 10 cm. Samples were kept on ice in the field and stored at 242
-20 oC until DNA extraction. DNA was extracted from homogenized soil cores using a 243
PeerJ Preprints | https://doi.org/10.7287/peerj.preprints.2196v3 | CC BY 4.0 Open Access | rec: 26 Oct 2016, publ:

9
PowerSoil DNA Extraction Kit. Only samples which produced a clean ribosomal PCR product 244
were included in this study, resulting in unequal sample sizes between pre-tree (n = 13) and post-245
tree (n = 28) groups. A random number generator was used to select a subset of post-tree samples 246
(n = 13) for comparisons of data with equal sample sizes. Samples were normalized to c. 1 ng/µL 247
prior to PCR amplification for library construction. 248
The environmental samples presented here are meant only to allow a demonstration of 249
the effects of a mock community-based workflow optimization on real environmental data. 250
Though we expect the presence of a seedling to create additional niche space which would 251
increase observed diversity, no background soil control samples were collected in order to 252
properly test this hypothesis. Nonetheless, the two sets of soil samples can be expected to vary 253
because of the presence or absence of a seedling and also due to differences in the time of 254
sampling, both year and season. 255
256
Library construction and sequencing 257
Amplicons were produced in a two-step protocol as suggested by Berry et al. (2011). 258
Briefly, samples were amplified in triplicate PCR reactions for the 16S V4 region using the 259
universal bacterial/archaeal primers 515F and 806R (Bates et al., 2011). First round reactions 260
were performed in triplicate in 384 well plates. The 8 µL volumes contained the following: 1 µM 261
each primer (Eurofins MWG Operon, LLC), 200 µM each dNTP (Phenix Research, Candler, 262
NC), 0.01 U/µL Phusion Hot Start II DNA Polymerase (Life Technologies), 1X HF Phusion 263
Buffer (Life Technologies), 3 mM MgCl2, 6% glycerol, and 1 µL normalized template DNA. 264
Cycling conditions were: 2 minutes at 95°C followed by 20 cycles of 30 seconds at 95°C, 30 265
seconds at 55°C, 4 minutes at 60°C. Triplicate reactions for each sample were pooled by 266
combining 4 µL from each, and 2 µL was used to check for results on a 1% agarose gel. The 267
remainder was diluted 10-fold and used as template in a second PCR reaction in which 12 base 268
Golay indexed sequencing tails (Caporaso et al., 2012) were added. Second round reaction 269
conditions were identical to the first round except only one reaction was conducted per sample 270
and only 15 total cycles were performed. Indexed PCR products were purified using a 1:1 ratio 271
of 18% polyethylene glycol and carboxylated magnetic beads as described in Rohland & Reich 272
(2012), quantified by PicoGreen fluorescence, and an equal mass of each sample was combined 273
into a final sample pool. The pool was purified and concentrated, and subsequently quantified by 274
PeerJ Preprints | https://doi.org/10.7287/peerj.preprints.2196v3 | CC BY 4.0 Open Access | rec: 26 Oct 2016, publ:

10
quantitative PCR against Illumina DNA Standards (Kapa Biosystems, Wilmington, MA). 275
Sequencing was carried out on a MiSeq Desktop Sequencer (Illumina Inc, San Diego, CA) 276
running in paired end 2x150 mode. 277
278
Sanger sequencing of mock community members 279
The 16S gene for each mock community member was sequenced by the Sanger method 280
to a minimum depth of 2 in order to provide an accurate sequence for assessing taxonomic 281
assignment methods. Briefly, PCR products were produced using primers 27F (Lane, 1991) and 282
806R or 515F and 1492R (Turner et al., 1999). Products were bead-purified with 18% PEG and 283
used as template in sequencing reactions containing 0.25 µL BigDye Terminator v3.1 (Life 284
Technologies), 1X BigDye Terminator Sequencing Buffer (Life Technologies), 3 µM primer and 285
1.5 mM additional MgCl2. Cycling conditions were: 2 minutes at 95°C followed by 60 cycles of 286
5 seconds at 95°C, 5 seconds at 50°C, 2 minutes at 60°C. Sequencing products were bead-287
purified with a 3:1 ratio of 25% PEG, resuspended in water, and sequenced on either a 3730xl or 288
a 3130 Genetic Analyzer (Life Technologies). Chromatograms were processed in Staden 289
Package v1.7 (Staden, Beal & Bonfield, 2000) and the resulting sequences used to augment the 290
Greengenes database so that an exact match for each expected OTU would be present during 291
taxonomy assignment. Taxonomic identity for each sequence was confirmed by comparing 292
against the non-redundant database at NCBI using the online BLAST tool (Altschul et al., 1990). 293
Sequences were deposited to GenBank with accession numbers KY007579-KY007586. 294
295
Data processing and statistical analysis 296
All bioinformatics were carried out on a Mac Pro (Apple, Inc.) running Ubuntu Linux 297
14.04 LTS (Canonical Ltd.) or the Monsoon high-performance computing cluster at Northern 298
Arizona University (https://nau.edu/hpc/) running CentOS 6.6 (The CentOS Project). Figures 299
were generated in Veusz v1.24 (http://home.gna.org/veusz/) or Geneious v8.1 (Biomatters Ltd.). 300
As contaminating PhiX Control sequence can complicate sequencing projects (Mukherjee et al., 301
2015), we calculated the amount of PhiX Control among our demultiplexed data and removed it 302
prior to sample processing. This task was performed with the akutils phix_filtering 303
command in akutils v1.2 (Krohn, 2016; https://github.com/alk224/akutils-v1.2) which maps raw 304
PeerJ Preprints | https://doi.org/10.7287/peerj.preprints.2196v3 | CC BY 4.0 Open Access | rec: 26 Oct 2016, publ:

11
data against the Enterobacteria phage phiX174 sensu lato complete genome sequence 305
(NC_001422.1) using Smalt 0.7.6 (http://www.sanger.ac.uk/resources/software/smalt/). 306
Overlapping paired end reads were aligned using the akutils join_paired_reads 307
command in akutils which employs the fastq-join command from ea-utils (Aronesty, 2011). 308
Demultiplexing and quality filtering of raw, joined data (mean length = 253 bp) was carried out 309
in QIIME with the split_libraries_fastq.py script using default parameters, or with 310
more strict requirements of a minimum quality threshold of q20 (q = 19), allowing 0-3 low-311
quality base calls (r = 1-3), and requiring at least 95% of each read to be high quality (p = 0.95). 312
Chimeras were removed by the UCHIME method (Edgar et al., 2011) as implemented in vsearch 313
1.1.1 (Rognes et al., 2016) using either the –uchime_denovo or –uchime_ref option against 314
the Gold reference database (http://drive5.com/uchime/gold.fa). OTU picking and taxonomy 315
assignments were performed using the akutils pick_otus command in akutils which calls 316
standard functions in QIIME. After manual inspection of sequence divergence among congeneric 317
mock community members, sequences were dereplicated on the first 100 bases using the 318
prefix_suffix OTU picker in QIIME. OTU picking was performed with multiple similarity or 319
distance thresholds using common OTU picking algorithms (CD-HIT, UCLUST and BLAST at 320
97%, 95%, 92%, 90%, 85%, and Swarm at d1, d2, d3, d4, d5). BLAST was used only for closed 321
reference analysis, UCLUST for open reference analysis, and CD-HIT and Swarm for de novo 322
analyses. Taxonomy was assigned using BLAST, RDP, and UCLUST options with default 323
settings available in QIIME 1.9.1 (UCLUST option in QIIME actually uses the USEARCH 324
algorithm for database matching steps). Reference-based OTU picking steps and taxonomic 325
assignments were conducted against the Greengenes 97% database (McDonald et al., 2012) 326
which had been formatted to include only the V4 region using the akutils 327
format_database command in akutils. Sequence alignments and phylogenetic trees were 328
produced using the akutils align_and_tree command in akutils which aligns sequences 329
using PyNAST (Caporaso et al., 2010b) and generates phylogenies with FastTree (Price, Dehal 330
& Arkin, 2009). Diversity analyses were conducted using the akutils core_diversity 331
command in akutils. 332
In order to facilitate assessment of optimal workflow steps, we first sought to establish a 333
method of filtering the final OTU tables by eliminating OTUs resulting from mixed clusters. To 334
PeerJ Preprints | https://doi.org/10.7287/peerj.preprints.2196v3 | CC BY 4.0 Open Access | rec: 26 Oct 2016, publ:

12
this end, we processed the mock and environmental data sets through a default QIIME workflow 335
(see below) to assess taxonomic components, and compared methods for filtering OTU tables to 336
remove contaminating taxa from the mock data. An ideal filtering method should remove 337
erroneous OTUs that arise either from sequencing error or cluster mixing. Table filtering was 338
carried out using either the Kircher threshold (0.3% by sample; Kircher, Sawyer & Meyer, 339
2012), the Bokulich threshold (0.005% by table; Bokulich et al., 2013), singletons removed by 340
table (mc2), or singletons removed by sample (n2). Private OTUs were assumed to be errors and 341
were also removed in the n2 tables. Filtered OTU tables were grouped according to filtering 342
method, and differences in the amount of OTUs classified as contaminating taxa was assessed by 343
one-way ANOVA. Tukey’s HSD test was used to determine which groups were statistically 344
distinct. 345
An optimal workflow was chosen by assessing diversity estimates and taxonomic 346
identities assigned to mock community data. The optimal OTU picking algorithm was 347
determined as the method that yielded the correct diversity result over the broadest range of 348
similarity or distance thresholds. Taxonomic accuracy was determined by seeding the 349
Greengenes database with the expected sequences from the mock community constituent taxa 350
prior to analysis, and inspecting the results. OTU tables from the optimal workflow across the 351
accurate range of similarity thresholds were filtered at each of the four thresholds described 352
above. Our “default QIIME workflow” was identical to the optimal workflow with the following 353
changes: the split_libraries_fastq.py command was performed with default settings; 354
OTU picking was performed with the pick_open_reference_otus.py command; 355
taxonomic assignment was performed with UCLUST; OTU tables were filtered with the 356
Bokulich threshold. Results from the optimal workflow were compared to the result obtained 357
from our default workflow. Environmental data was then processed using the best workflow 358
determined from this process and compared to the default result. 359
Diversity analyses for mock community data were calculated on OTU tables that had 360
been rarefied to 10,000 reads, or 5,000 reads for environmental data. Comparison of observed 361
mock community composition to the a priori expectation (Table S1) was conducted with 362
Spearman’s rank correlation using species-level assignments. Comparison of observed OTU 363
diversity between environmental sample groupings was performed with nonparametric t-tests. A 364
PeerJ Preprints | https://doi.org/10.7287/peerj.preprints.2196v3 | CC BY 4.0 Open Access | rec: 26 Oct 2016, publ:

13
random subset of post-tree samples from the environmental data (n = 13) was selected to 365
determine if unequal sample sizes were contributing to observed OTU diversity. Distance 366
matrices were calculated from environmental data for weighted UniFrac distance (Lozupone & 367
Knight, 2005). Tests of differences of total beta diversity were carried out on distance matrices 368
using PERMANOVA (Anderson, 2001), and differences in multivariate dispersion were detected 369
with PERMDISP (Anderson, Ellingsen & McArdle, 2006). 370
Representative sequences for the optimized mock community result were extracted from 371
the output data. When multiple OTU definition sequences represented the same taxonomic 372
identity, they were aligned with Mafft v7.123b (Katoh & Standley, 2013) using the L-INS-i 373
setting. The lower abundance OTU for each multi-OTU taxon was assumed to be erroneous and 374
base differences compared to the major OTU were characterized. Trinucleotide motifs preceding 375
each base difference and terminal truncation position were tabulated. Because 2x150 sequencing 376
data does not fully overlap for 515F-806R amplicons (mean length = 253 bp), terminal base and 377
preceding trimers were considered in the context of the second read. Environmental data 378
processed through the optimal workflow was also investigated for terminal truncation positions 379
and preceding trinucleotide motifs. Because we have no reliable reference sequence for many 380
environmental OTUs, we investigated only OTUs that shared a taxonomic designation with at 381
least one other OTU, and had been truncated by more than 3 bases during quality filtering. For 382
mock and environmental data, motif and terminal base representations were tested against the 383
assumption of random occurrence with Chi-square tests. 384
We attempted to determine actual sequencing error rates for data used in either the 385
default QIIME workflow or our optimized workflow. Mock community reads were 386
demultiplexed in QIIME with split_libraries_fastq.py under default or strict quality 387
filtering, utilizing the --store_demultiplexed_fastq option. Demultiplexed fastq files 388
were imported into Geneious and aligned against the Sanger sequencing data for each mock 389
community member, requiring a 95% similarity in order to exclude contaminant sequences from 390
the alignments. The resulting alignments were exported in SAM format and SAM “NM” flags 391
were calculated in SAMtools v1.19 (Li et al., 2009). The sam-stats command in ea-utils was 392
used to calculate mismatch rates (“snp rate” field). 393
394
PeerJ Preprints | https://doi.org/10.7287/peerj.preprints.2196v3 | CC BY 4.0 Open Access | rec: 26 Oct 2016, publ:

14
Results: 395
The sequencing run clustered at 1119 k/mm2 (+/- 70) and resulted in 17.96 million total 396
reads passing filter, an overall error rate of 0.36%, and 91% of reads exceeded q30. PhiX 397
Sequencing Control v3 sequences (Illumina, Inc.) constituted 8.31% of the total run (percent 398
aligned). Once demultiplexed, mock community data contained 4.35% PhiX (103,070/2,371,510 399
reads) while the environmental data contained 4.10% PhiX (259,366/6,332,586 reads). Mock 400
community data demultiplexed under default parameters were determined to have an average 401
error rate of 0.3661% while stringent quality filtering yielded an improved error rate of 0.0990%. 402
Actual error rates varied for each taxon (Table S2). Denovo chimera detection found zero 403
chimeric reads, while reference-based detection consistently identified chimeras at a rate of 404
about 1% for each data set. As the more conservative option, we chose to utilize reference-based 405
chimera detection for the remainder of this study. Sample metadata is available in Table S11. 406
Raw sequencing data for samples used in this study are publicly available in the NCBI Sequence 407
Read Archive (study accession SRP091609; BioProject PRJNA348617). 408
Under default QIIME assessment, the mock community data showed substantial OTU 409
inflation; where there should have been just 8 OTUs, there were 127 (Table S3). When the 410
environmental data set was processed through the same workflow, 73 OTUs were classified at 411
the family level as Sphingomonadaceae. Together, these OTUs made up 5.3% of environmental 412
sequences, and Sphingomonadaceae was the most abundant classification observed at the family 413
level (Table S4). Three OTUs representing about 0.13% of the mock community data set were 414
also classified as Sphingomonadaceae, a designation which should be absent from the mock data. 415
This result led us to surmise that sequences from the environmental data set were contaminating 416
the mock communities during sequencing. Such sample cross-talk presumably arises from the 417
cluster mixing effect described by Kircher, Sawyer & Meyer (2012) where the index read from a 418
flowcell cluster is spuriously attributed to a neighboring cluster. The mock data also contained 3 419
OTUs classified as Planococcaceae (<0.03%) and 1 OTU classified as Methylobacteriaceae 420
(<0.01%), again corresponding with OTUs observed within the environmental data. 421
Sphingomonadaceae sequences were observed across all five mock communities, whereas 422
Planococcaceae was only associated with communities 0, 1a, and 1b, suggesting that cluster-423
mixing events may occur non-randomly. Methylobacteriaceae was present as just a single read 424
PeerJ Preprints | https://doi.org/10.7287/peerj.preprints.2196v3 | CC BY 4.0 Open Access | rec: 26 Oct 2016, publ:

15
among community 1b. Three mock community OTUs were observed at low levels in 425
communities from which they should be absent, indicating additional cluster-mixing within the 426
mock community data. 427
As the most prevalent non-target taxon observed among the mock community data, we 428
sought to establish a method for filtering OTU tables that would eliminate the presence of 429
Sphingomonadaceae reads. OTU tables generated for the mock communities by each of the OTU 430
picking, taxonomy assignment and table filtering methods were compared for the presence of 431
Sphingomonadaceae contaminants. Considering filtering method (mc2, n2, Kircher threshold, or 432
Bokulich threshold) as the predictive variable, we found strong differences among them in 433
removing non-target OTUs (F3,239 = 89.301, p < 0.0001). The least severe filtering method (mc2) 434
retained the most Sphingomonadaceae OTUs (2.50 +/- 1.21) followed by n2 (2.45 +/- 1.21), and 435
Bokulich threshold (1.85 +/- 0.86). Only the Kircher threshold completely removed 436
Sphingomonadaceae contamination from the mock community OTU tables effectively (Tukey’s 437
HSD, p < 0.05). 438
Default quality filtering and OTU picking in QIIME resulted in overestimation of mock 439
community diversity regardless of how the final OTU table was filtered (Figure 1a-d; Figure S1: 440
Default mock community rarefactions). Diversity estimates were inflated up to 35 times when 441
singletons were removed by table, compared to nearly 3.5 times when filtering with the Kircher 442
threshold. Despite the reduction of OTU inflation by an order of magnitude, these results indicate 443
that revisions to initial processing steps may yield improved results. We therefore sought to 444
establish an optimized workflow that would produce the correct number of OTUs for an input of 445
known constituents. Using data that had been filtered according to strict standards during the 446
split_libraries_fastq.py step in QIIME (q = 19, r = 0, p = 0.95), a correct result was 447
achieved for each of the OTU picking algorithms tested. However, each algorithm differed in 448
which similarity threshold was required for the optimal result (Table 1). Closed reference OTU 449
picking with BLAST overestimated diversity above a similarity threshold of 92%. Open 450
reference OTU picking with UCLUST overestimated diversity at every threshold except 95% 451
similarity. De novo OTU picking using CD-HIT at thresholds below 92% and Swarm resolutions 452
below d4 underestimated diversity. Swarm yielded the correct result over the broadest range of 453
tested distance thresholds (d1-d4), and offers other attractive features that made it stand out 454
PeerJ Preprints | https://doi.org/10.7287/peerj.preprints.2196v3 | CC BY 4.0 Open Access | rec: 26 Oct 2016, publ:

16
among the tested OTU pickers (e.g., de novo picking, multi-threaded analysis). Thus, Swarm was 455
chosen as the optimal OTU picking method for the remainder of the study. We chose d4 distance 456
as the optimal threshold as it was the most conservative setting to yield a correct result. 457
Taxonomic accuracy for Swarm-picked OTUs (d4) was assessed for the different 458
taxonomy assigners using default parameters in QIIME 1.9.1. To control for reference database 459
bias, we added representative sequences from each of the correct OTUs to our Greengenes 460
reference with a unique identifier. We observed that BLAST returned the representative 461
sequence 100% of the time, while RDP and UCLUST never found the exact match (Table 2). 462
Even though RDP and UCLUST did not find optimal sequences, assignments were correct, 463
though less specific in taxonomic depth. BLAST yielded similar results when the representative 464
sequences were not present in the database (Table 2). While BLAST offers the advantage of 465
obtaining the best sequence match when available in the database, RDP and UCLUST both offer 466
an advantage in substantially reducing computational time while providing reasonable accuracy 467
for most applications. For the analysis presented here, we chose BLAST as the optimal 468
taxonomy assigner for its superior accuracy. 469
A perfect result for analysis of our mock communities requires stringent quality filtering 470
of the raw data. Default quality filtering in QIIME 1.9.1 was established according to Bokulich et 471
al. (2013). This imposes a minimum Phred quality score of 4 (q = 3), truncates sequences after 472
three bases are observed below this threshold (r = 3), and retains truncated reads that represent a 473
minimum of 75% of the original sequence length (p = 0.75). In contrast, we performed strict 474
quality filtering using q = 19, r = 0, and p = 0.95. This more stringent filtering protocol ensures 475
that data used for analysis are of much higher quality with approximately uniform read lengths. 476
An important consequence of such stringency is that much of the raw data is discarded. Of the 477
2,373,247 raw mock community sequences, default quality filtering retained 2,020,542 reads 478
(85.1%), whereas stringent parameters retained just 657,544 reads (27.7%). Holding constant q = 479
19 and p = 0.95, we found that increasing r during quality filtering had a profound effect on the 480
amount of data retained (Figure 2a). Allowing r = 1 resulted in an increase of data retention from 481
approximately 27% (r = 0) to over 56%. When r = 2 and r = 3, increases in data retention 482
showed diminishing returns, with 70% and 75% of the data retained, respectively. However, we 483
also found that allowing r > 0 will generally cause an inaccurate estimate of the number of 484
PeerJ Preprints | https://doi.org/10.7287/peerj.preprints.2196v3 | CC BY 4.0 Open Access | rec: 26 Oct 2016, publ:

17
OTUs, depending on the criteria used for OTU picking (Figure 2b). With the d1 resolution, 485
increasing r will create a proportional inflation in the number of OTUs determined by Swarm. At 486
d2 resolution, allowing r = 1 still correctly described our simple mock community whereas 487
allowing r = 2 or r = 3 caused diversity to be overestimated. At resolutions d3 and d4, allowing r 488
> 0 caused underestimates of diversity. This suggests that the best result is obtained with the 489
most stringent quality filter, which we selected for our optimal workflow (q = 19). Similar results 490
using more data may be possible by allowing a small amount of errors (e.g., r = 1) and picking 491
OTUs with a more conservative similarity or distance threshold (e.g., Swarm at d2 resolution). 492
The Kircher threshold was effective at removing contaminating OTUs in our mock 493
community data thus yielding a near-perfect result (Figure 3). However, we anticipated that such 494
filtering could be too stringent for environmental analysis given the low per-sample OTU 495
frequencies commonly reported (e.g., Sogin et al., 2006). We compared the expected mock 496
community results to those observed with either default settings, or optimized settings for quality 497
filtering, OTU picking and taxonomy assignment, using each of the final OTU table filtering 498
methods we tested. For all comparisons, Spearman’s rank correlation yielded significant p-values 499
(<0.001), so we present only correlation values and 95% confidence intervals (CI) here. When 500
comparing the default analysis to the expected outcome, Spearman’s r showed a negative 501
correlation (r = −0.3494; CI = [−0.4280, −0.2655]). Optimized results exhibited strong positive 502
correlations regardless of filtering threshold used. Lower values for Spearman’s r occured when 503
diversity was overestimated and when contaminants were present. Correlation with the expected 504
outcome improved as filtering stringency increased with every filtering method producing a 505
dramatic improvement over the default workflow (mc2: r = 0.8075, CI = [0.7663, 0.8420]; n2: r 506
= 0.8702, CI = [0.8344, 0.8987]; Bokulich threshold: r = 0.9135, CI = [0.8841, 0.9357]; Kircher 507
threshold: r = 0.9646, CI = [0.9495, 0.9752]). The Bokulich threshold was chosen as our optimal 508
OTU table filtering method because it yielded the best correlation without being overly strict. 509
Output for the environmental data using either the default or optimized workflow was 510
examined for basic diversity statistics. Default analysis identified 2508 OTUs classified into 388 511
taxonomic assignments (OTUs per taxon: mean = 6.46, median = 2; Figure S3: Default 512
environmental rarefactions). The optimized analysis identified 1533 OTUs classified into 328 513
taxonomic assignments (OTUs per taxon: mean = 4.67, median = 2; Figure S4: Optimized 514
PeerJ Preprints | https://doi.org/10.7287/peerj.preprints.2196v3 | CC BY 4.0 Open Access | rec: 26 Oct 2016, publ:

18
environmental rarefactions). By treatment, OTU diversity was reduced about twofold when 515
assessed via the optimized workflow and compared to the default results (Figure 4a-4b). In the 516
default analysis, pre-tree soils hosted 978.30 +/- 128.42 OTUs while post-tree soils had 1138.35 517
+/- 86.34 OTUs (nonparametric T-test = 4.578, p < 0.001). In the optimized analysis, pre-tree 518
soils contained 543.28 +/- 79.32 compared to 674.95 +/- 50.21 OTUs in post-tree soils 519
(nonparametric T-test = 6.277, p < 0.001). Differences in beta diversity were observed between 520
treatments for each workflow using weighted UniFrac distance matrices (Figure 4c-4d; default 521
PERMANOVA = 8.181, p < 0.001; optimized PERMANOVA = 9.355, p < 0.001). We also 522
noticed an increase in multivariate dispersion in the optimized workflow, though the differences 523
were not found to be significant in either case (default PERMDISP = 1.086, p = 0.294; optimized 524
PERMDISP = 2.160, p = 0.158). When data was processed with equivalent sample sizes, the 525
same patterns were observed for both alpha diversity (pre-tree = 545.76 +/- 78.84, post-tree = 526
679.00 +/- 47.86; nonparametric T-test = 5.004, p < 0.001) and beta diversity (PERMANOVA = 527
6.585, p < 0.001), though statistical power was slightly reduced, and multivariate dispersion 528
increased (PERMDISP = 3.248, p = 0.071), consistent with a reduction in sample size. 529
Of the 17 OTUs observed in the optimized mock result, the nine extra OTUs therein were 530
composed of three contaminants and six spurious OTUs representing sequence variants of the 531
target taxa. All extra OTUs were present at low levels ranging from 0.003% to 0.17% per sample 532
(Table S5). That sequence counts of contaminant OTUs were observed in all samples, but only 533
for select taxa, strongly suggests that cluster mixing events occur non-randomly during Illumina 534
sequencing. Species-level mock community observations from the optimized workflow describe 535
the eight constituent taxa at approximately the correct proportions. However, six of the eight taxa 536
were represented by two OTUs each. The main OTU for each taxon was present as 6.30% to 537
19.09% of the total community while the rates of lower frequency OTUs ranged from 0.01% to 538
0.05%. Manual inspection of conspecific OTU sequence alignments revealed multiple 539
substitution and indel positions within the first 100 bases which prevented these sequences from 540
dereplicating into the correct sequence during our workflow (Table S6). Additionally, these 541
sequence variants were shorter than the main constituent sequence by at least seven bases, 542
indicating that they derive from inherently lower quality reads. Inspection of trinucleotide motifs 543
preceding each substitution or indel position did not reveal any pattern relating to the observed 544
PeerJ Preprints | https://doi.org/10.7287/peerj.preprints.2196v3 | CC BY 4.0 Open Access | rec: 26 Oct 2016, publ:
19
errors (Table S7). Consistent with the results of Schirmer et al. (2015), we observed a higher rate 545
of errors among A or C bases than G or T (error ratio = 1.67). Since A and C or G and T bases 546
share fluorescence excitation wavelengths during Illumina 4-channel sequencing-by-synthesis 547
(SBS), this result suggests that some of the errors we observed were indeed the result of 548
systematic errors during sequencing, although this study was not designed to distinguish between 549
such errors and those generated during PCR. Examining the terminal trinucleotide motif 550
immediately preceding truncation positions (Table S8) we observed “TTT” 83% of the time (Χ263 551
= 271.333, p < 0.0001). Additionally, the correct base at the truncation position was “G” 83% of 552
the time (Χ23 = 11.33, p = 0.0101). An example alignment for the two OTUs representing B. 553
megaterium is presented in Figure 5a, illustrating the “TTT” motif preceding a “G” truncation 554
position (reverse complimented). 555
Truncation positions and preceding trimers were also characterized for environmental 556
data, resulting in 34 “suspect” OTUs (Table S9). Of these, 27 OTUs had been truncated at a “G” 557
position (79.41%; Χ23 = 54.235, p < 0.0001), and just 10 possible trimers were represented 558
preceding the truncation position. The motifs “TTT” and “TTC” were substantially 559
overrepresented, being observed 14 (41.18%) and 7 (20.59%) times, respectively (Χ263 = 560
474.235, p < 0.0001). An example alignment for 5 OTUs classified to the family level as 561
Sphingomonadaceae is presented in Figure 5b, and includes one such suspect OTU with a “TTT” 562
motif preceding a “G” truncation position (reverse complemented). 563
564
Discussion: 565
Our results show that amplicon sequencing data from Illumina MiSeq instruments 566
requires stringent quality filtering in order to provide the most accurate estimates of diversity. 567
Kunin et al. (2010) found that diversity was grossly overestimated for their mock community 568
data until a quality threshold of q27 was implemented. Similarly, Nelson et al. (2014) observed 569
high overestimation of mock community diversity (25-125 times expected) unless the data was 570
carefully controlled. Our optimal workflow still overestimated the OTU diversity of our simple 571
mock communities by a factor of about two. While this is still an overestimation, it is an 572
improvement over results obtained by default processing. Our optimized protocol yielded a 573
reasonable characterization of taxonomic content for mock communities (Table S5) and 574
PeerJ Preprints | https://doi.org/10.7287/peerj.preprints.2196v3 | CC BY 4.0 Open Access | rec: 26 Oct 2016, publ:

20
environmental data (Table S10) alike, though it is important to recognize that mock community 575
results may not always generalize well to environmental samples. 576
Some authors have suggested that excessive OTU diversity may be at least partially 577
explained by the presence of unfiltered chimeric reads (Edgar, 2013), ribosomal paralogs (Pei et 578
al., 2010), or laboratory contaminants (Nelson et al., 2014). It seems worth noting that the level 579
of chimeric reads in our data was very low compared to rates observed by others (e.g., Schloss, 580
Gevers & Westcott, 2011; Edgar, 2013). We speculate this is due the use of a high-fidelity 581
polymerase and low cycling conditions during library construction, consistent with the results of 582
Gohl et al. (2016). As chimeras are thought to form primarily when incomplete products from 583
the previous cycle act as primers during the extension step (Haas et al., 2011), we made use of an 584
extra-long, low temperature extension of 4 minutes at 60 oC in an attempt to minimize this effect. 585
We tested the cycling conditions by amplifying serial dilutions of 16S products by qPCR (data 586
not shown) and found it yielded an efficiency of about 1, lending further support to the 587
possibility that our data is virtually chimera-free. Intragenomic ribosomal diversity is also an 588
unlikely explanation for OTU inflation in our mock community results. While structural changes 589
are often associated with diversity of the ribosomal operon (Lim, Furuta & Kobayashi, 2012), 590
these should have little impact on the sequence diversity of the 16S V4 region. In fact, Sun et al. 591
(2013) found that the V4-V5 region suffers from lower rates of intragenomic diversity compared 592
to other variable regions of the 16S rRNA gene. Using a quality cut-off of q20 across a 253 nt 593
sequence, paralogous sequences may remain, though we did not observe any such sequences at a 594
rate high enough to be considered as potential paralogs. Further, the observed proportion of each 595
constituent was quite close to expected proportions after accounting for genome size and 16S 596
rRNA gene copy numbers (Figure 3). All contaminants that we observed in the mock community 597
data could be directly attributed to taxa present in the environmental data set. 598
Schirmer et al. (2015) observed that error rates reported by Illumina MiSeq sequencers, 599
according to the PhiX Control v3, do not accurately reflect those of amplicon sequences. Their 600
conclusion that actual error rates were higher than those indicated by q-scores reported by the 601
MiSeq has important implications for the use of Illumina sequencing in estimating microbial 602
diversity. It is possible that newer imaging strategies (e.g., 2-channel SBS chemistry used by 603
Illumina NextSeq and MiniSeq instruments) will provide improved parity between the estimated 604
PeerJ Preprints | https://doi.org/10.7287/peerj.preprints.2196v3 | CC BY 4.0 Open Access | rec: 26 Oct 2016, publ:

21
and actual error rates, but this will require careful testing. Interestingly, when we attempted to 605
determine actual error rates through alignment of mock community sequences (demultiplexed 606
under default settings) to their expected result, we observed a very close correlation compared to 607
the error reported by PhiX Control (0.36% vs. 0.37%). This result was not consistent across 608
different mock community constituent taxa, suggesting that error rates can be taxon-specific 609
(Table S2). We further note that data filtered under our strict filtering conditions, which 610
stipulated a minimum per-base quality of q20, yielded an average mismatch rate of just 0.099% 611
(q30), indicating that most of our data is of exceptional quality following quality filtering. 612
Of the non-target OTUs present in our optimized mock community result, one third were 613
contaminants arising from cluster mixing events during sequencing and two thirds were sequence 614
variants of the constituent OTUs which may have arisen during PCR, sequencing, or a 615
combination of the two. Cluster mixing can be controlled by dual-indexing of samples (Kircher, 616
Sawyer & Meyer, 2012), but errors arising during PCR or sequencing represent systematic errors 617
inherent to the procedure of amplicon sequencing which are difficult, if not impossible, to 618
completely eliminate irrespective of indexing strategy. Even though dual-indexing offers a clear 619
advantage over single indexing with regard to sample attribution, single-indexed protocols (e.g., 620
Caporaso et al., 2012) remain popular and widely used. Single-indexed data still yields valuable 621
information and should not be discounted, as long as researchers are aware of the limitations. 622
Dual-indexed designs should be encouraged for new research projects (e.g., Kozich et al., 2013; 623
Fadrosh et al., 2014). 624
We echo the recommendation by others (e.g., Bokulich et al., 2013; Schirmer et al., 625
2015) to include control mock community samples to guide data analysis. PhiX Control v3 is 626
still needed to improve sequence diversity for the purpose of cluster map generation 627
(https://goo.gl/NpauDN), but an alternative reference sequence could be used with onboard mock 628
communities to more directly estimate error profiles for community amplicon sequencing data. 629
PhiX sequence itself likely contributes little, if at all, to inflation of diversity estimates, and is 630
easily quantified and removed. Though such an effect is direct evidence of cluster mixing, the 631
rate of PhiX infiltration is likely much higher than the rate of sample mixing because PhiX 632
Control is unindexed, producing no fluorescent signal during indexing cycles. Spurious OTUs 633
PeerJ Preprints | https://doi.org/10.7287/peerj.preprints.2196v3 | CC BY 4.0 Open Access | rec: 26 Oct 2016, publ:

22
defined from contaminating PhiX sequence may be more prevalent amid sequence data which 634
was accompanied by higher concentrations of PhiX Control v3 during sequencing. 635
Although this study was not designed for careful investigation of errors generated during 636
amplicon sequencing projects, we were able to observe that certain bases and motifs were more 637
frequently associated with low-quality base calls than should be expected by chance. The 638
presence of a “TTT” or “TTC” motif immediately preceding a “G” position near the end of a 639
sequence (near the start of the second read) was most frequently associated with an erroneous or 640
suspect OTU (Table S8). Indeed, mock community diversity was inflated on account of this 641
effect, but determining the source of such error requires more careful investigation than is 642
possible here, given that this study derives from a single MiSeq run with limited taxonomic 643
diversity. In addition to the terminal truncation observations, we note that all other observed 644
errors in the mock community sequences occurred within the first 100 bp of sequence, specific to 645
the non-overlapping region of the first sequencing read (Figure 5a). It is likely that the errors we 646
observed here would have occurred less frequently had we used fully-overlapping reads for this 647
study. Importantly, the motif-specific patterns we observed were consistent between the mock 648
and environmental data sets (Figure 5; Table S8; Table S9). 649
Estimates of alpha diversity are more sensitive than beta diversity calculations to the 650
effects of cluster mixing and systematic errors. Increasing the number of allowed low-quality 651
reads (r parameter in split_libraries_fastq.py) increases the amount of data available 652
for processing, but also changes observed diversity. For this reason, we suggest that alpha 653
diversity estimates should be performed only with data that has been stringently filtered for 654
quality. Because errors in amplicon sequencing data may follow sequence-specific patterns 655
(Schirmer et al., 2015; this study), spurious OTUs may provide artificial support to the statistical 656
separation of experimental treatments. Alternatively, spurious OTUs arising from taxa which are 657
not differentially represented among treatments could provide artificial noise, making it more 658
difficult to detect real differences. In either scenario, careful quality filtering can diminish such 659
effects. 660
Our results suggest that alpha diversity can be overestimated if sequencing error rates are 661
not carefully controlled. Here we observed this effect with a QIIME-based workflow, although 662
QIIME is just one of a variety of tools used in data analysis for such work. Because errors may 663
PeerJ Preprints | https://doi.org/10.7287/peerj.preprints.2196v3 | CC BY 4.0 Open Access | rec: 26 Oct 2016, publ:

23
arise systematically during PCR or sequencing implies that a similar effect is likely to be 664
observed regardless of which analysis pipeline is used to assess the data. We made use of a high-665
fidelity polymerase (Phusion Hot Start II) in contrast to many studies which continue to utilize 666
Taq polymerase, with which PCR-derived errors will be more prevalent. Lower fidelity will 667
promote more PCR-derived errors, and those generated during early cycles will be highly 668
perpetuated, an effect which would be more problematic under high-cycling conditions. This 669
effect was recently demonstrated by Gohl et al. (2016), who also showed that PCR-chimeras are 670
virtually absent from protocols utilizing low-cycling conditions. Because errors may follow 671
sequence-specific patterns, some diversity estimates may be particularly inflated for certain taxa, 672
which can further affect studies using taxonomic content to predict community function (e.g. 673
Langille et al., 2013). The use of phylogenetic metrics (e.g., phylogenetic diversity for alpha 674
diversity, UniFrac for beta diversity) during data analysis will likely diminish the effects of 675
complications associated with systematically-inflated OTU diversity. Though the quality-676
filtering recommendations outlined by Bokulich et al., (2013) have subsequently provided 677
valuable guidance to numerous researchers, newer quality-filtering methods promise 678
improvements in accuracy and read retention (e.g., Puente-Sánchez, Aguirre & Parro, 2016). 679
Careful consideration of the results presented here and elsewhere (Kunin et al., 2010; Schirmer et 680
al., 2015) will improve upon our collective interpretation of microbial diversity across 681
environments. 682
683
Conclusions: 684
In this study, we observed that each of the various workflow components tested (quality 685
filtering, OTU picking, taxonomic assignment, and OTU table filtering) affect the outcome of an 686
amplicon sequencing project. Though high quality output can be achieved through a variety of 687
means, in this study the optimal result was achieved with a specific set of steps. We outline them 688
here as a general recommendation for processing community amplicon data generated on MiSeq 689
instruments through QIIME 1.9.1 (Caporaso et al., 2010a). Analysis parameters can and should 690
be adjusted as necessary for individual data sets. The optimal workflow as performed in this 691
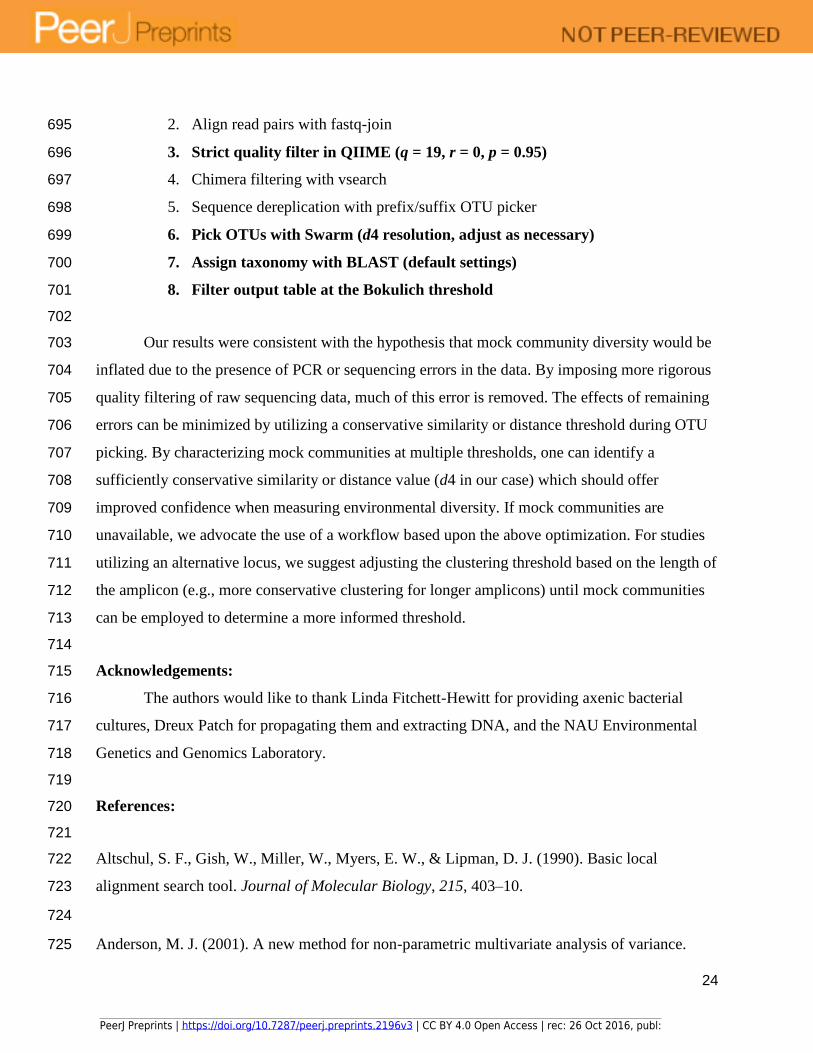
study was as follows (optimized steps in bold): 692
693
1. Remove PhiX Control v3 contamination with Smalt 694
PeerJ Preprints | https://doi.org/10.7287/peerj.preprints.2196v3 | CC BY 4.0 Open Access | rec: 26 Oct 2016, publ:
24
2. Align read pairs with fastq-join 695
3. Strict quality filter in QIIME (q = 19, r = 0, p = 0.95) 696
4. Chimera filtering with vsearch 697
5. Sequence dereplication with prefix/suffix OTU picker 698
6. Pick OTUs with Swarm (d4 resolution, adjust as necessary) 699
7. Assign taxonomy with BLAST (default settings) 700
8. Filter output table at the Bokulich threshold 701
702
Our results were consistent with the hypothesis that mock community diversity would be 703
inflated due to the presence of PCR or sequencing errors in the data. By imposing more rigorous 704
quality filtering of raw sequencing data, much of this error is removed. The effects of remaining 705
errors can be minimized by utilizing a conservative similarity or distance threshold during OTU 706
picking. By characterizing mock communities at multiple thresholds, one can identify a 707
sufficiently conservative similarity or distance value (d4 in our case) which should offer 708
improved confidence when measuring environmental diversity. If mock communities are 709
unavailable, we advocate the use of a workflow based upon the above optimization. For studies 710
utilizing an alternative locus, we suggest adjusting the clustering threshold based on the length of 711
the amplicon (e.g., more conservative clustering for longer amplicons) until mock communities 712
can be employed to determine a more informed threshold. 713
714
Acknowledgements: 715
The authors would like to thank Linda Fitchett-Hewitt for providing axenic bacterial 716
cultures, Dreux Patch for propagating them and extracting DNA, and the NAU Environmental 717
Genetics and Genomics Laboratory. 718
719
References: 720
721
Altschul, S. F., Gish, W., Miller, W., Myers, E. W., & Lipman, D. J. (1990). Basic local 722
alignment search tool. Journal of Molecular Biology, 215, 403–10. 723
724
Anderson, M. J. (2001). A new method for non-parametric multivariate analysis of variance. 725
PeerJ Preprints | https://doi.org/10.7287/peerj.preprints.2196v3 | CC BY 4.0 Open Access | rec: 26 Oct 2016, publ:

25
Austral Ecology, 26, 32-46. 726
727
Anderson, M.J., Ellingsen, K.E., McArdle, B.H. (2006). Multivariate dispersion as a measure of 728
beta diversity. Ecology Letters, 9, 683–693. 729
730
Aronesty, E. (2011). ea-utils: Command-line tools for processing biological sequencing data; 731
https://expressionanalysis.github.io/ea-utils/ 732
733
Bates, S. T., Berg-Lyons, D., Caporaso, J. G., Walters, W. A., Knight, R., & Fierer, N. (2011). 734
Examining the global distribution of dominant archaeal populations in soil. The ISME Journal, 5, 735
908–17. 736
737
Bellemain, E., Carlsen, T., Brochmann, C., Coissac, E., Taberlet, P., & Kauserud, H. (2010). ITS 738
as an environmental DNA barcode for fungi: an in silico approach reveals potential PCR biases. 739
BMC Microbiology, 10, 189. 740
741
Bentzon-Tilia, M., Traving, S. J., Mantikci, M., Knudsen-Leerbeck, H., Hansen, J. L., Markager, 742
S., & Riemann, L. (2015). Significant N2 fixation by heterotrophs, photoheterotrophs and 743
heterocystous cyanobacteria in two temperate estuaries. The ISME Journal, 9, 273–285. 744
745
Berry, D., Mahfoudh, K. B., Wagner, M., & Loy, A. (2011). Barcoded Primers Used in 746
Multiplex Amplicon Pyrosequencing Bias Amplification. Applied and Environmental 747
Microbiology, 77, 612–612. 748
749
Bokulich, N. A., & Mills, D. A. (2013). Improved selection of internal transcribed spacer-750
specific primers enables quantitative, ultra-high-throughput profiling of fungal communities. 751
Applied and Environmental Microbiology, 79, 2519–2526. 752
753
Bokulich, N. A., Subramanian, S., Faith, J. J., Gevers, D., Gordon, J. I., Knight, R., Mills, D. A., 754
& Caporaso, J. G. (2013). Quality-filtering vastly improves diversity estimates from Illumina 755
amplicon sequencing. Nature Methods, 10, 57–9. 756
PeerJ Preprints | https://doi.org/10.7287/peerj.preprints.2196v3 | CC BY 4.0 Open Access | rec: 26 Oct 2016, publ:

26
757
Callahan, B. J., Mcmurdie, P. J., Rosen, M. J., Han, A. W., Johnson, A. J., & Holmes, S. P. 758
(2016). DADA2: High resolution sample inference from amplicon data. Nature Methods, 13, 759
581-583. 760
761
Caporaso, J. G., Kuczynski, J., Stombaugh, J., Bittinger, K., Bushman, F. D., Costello, E. K., 762
Fierer, N., Peña, A. G., Goodrich, J. K., Gordon, J. I., Huttley, G. A., Kelley, S. T., Knights, D., 763
Koenig, J. E., Ley, R. E., Lozupone, C. A., McDonald, D., Muegge, B. D., Pirrung, P., Reeder, 764
J., Sevinsky, J. R., Turnbaugh, P. J., Walters, W. A., Widmann, J., Yatsunenko, T., Zaneveld, J., 765
& Knight, R. (2010a). QIIME allows analysis of high-throughput community sequencing data. 766
Nature Methods, 7, 335–336. 767
768
Caporaso, J. G., Bittinger, K., Bushman, F. D., Desantis, T. Z., Andersen, G. L., & Knight, R. 769
(2010b). PyNAST: A flexible tool for aligning sequences to a template alignment. 770
Bioinformatics, 26, 266–267. 771
772
Caporaso, J. G., Lauber, C. L., Walters, W. A., Berg-Lyons, D., Huntley, J., Fierer, N., Owens, 773
S. M., Betley, J., Fraser, L., Bauer, M., Gormley, N., Gilbert, J. A., Smith, G., & Knight, R. 774
(2012). Ultra-high-throughput microbial community analysis on the Illumina HiSeq and MiSeq 775
platforms. The ISME Journal, 6, 1621–1624. 776
777
Chain, P., & Grafham, D. (2009). Genome project standards in a new era of sequencing. Science, 778
326, 1–5. 779
780
Dickie, I. A. (2010). Insidious effects of sequencing errors on perceived diversity in molecular 781
surveys. New Phytologist, 188, 916-918. 782
783
Edgar, R. C. (2010). Search and clustering orders of magnitude faster than BLAST. 784
Bioinformatics, 26, 2460–1. 785
786
PeerJ Preprints | https://doi.org/10.7287/peerj.preprints.2196v3 | CC BY 4.0 Open Access | rec: 26 Oct 2016, publ:

27
Edgar, R. C., Haas, B. J., Clemente, J. C., Quince, C., & Knight, R. (2011). UCHIME improves 787
sensitivity and speed of chimera detection, Bioinformatics, 27, 2194–2200. 788
789
Edgar, R. (2013). UPARSE: highly accurate OTU sequences from microbial amplicon reads. 790
Nature Methods, 10, 996–998. 791
792
Fadrosh, D. W., Ma, B., Gajer, P., Sengamalay, N., Ott, S., Brotman, R. M., & Ravel, J. (2014). 793
An improved dual-indexing approach for multiplexed 16S rRNA gene sequencing on the 794
Illumina MiSeq platform. Microbiome, 2, 6. 795
796
Fichot, E. B., & Norman, R. S. (2013). Microbial phylogenetic profiling with the Pacific 797
Biosciences sequencing platform. Microbiome, 1, 10. 798
799
Fu, L., Niu, B., Zhu, Z., Wu, S., & Li, W. (2012). CD-HIT: Accelerated for clustering the next-800
generation sequencing data. Bioinformatics, 28, 3150–3152. 801
802
Giongo, A., Crabb, D. B., Davis-Richardson, A. G., Chauliac, D., Mobberley, J. M., Gano, K. 803
A., Mukherjee, N., Casella, G., Roesch, L. F. W., Walts, B., Riva, A., King, G., & Triplett, E. W. 804
(2010). PANGEA: pipeline for analysis of next generation amplicons. The ISME Journal, 4, 805
852–61. 806
807
Gohl, D. M., Vangay, P., Garbe, J., MacLean, A., Hauge, A., Becker, A., Gould, T. J., Clayton, 808
J. B., Johnson, T. J., Hunter, R., Knights, D., & Beckman, K. B. (2016). Systematic improvement 809
of amplicon marker gene methods for increased accuracy in microbiome studies. Nature 810
Biotechnology, 34, 942-949. 811
812
Gweon, H. S., Oliver, A., Taylor, J., Booth, T., Gibbs, M., Read, D. S., Griffiths, R. I., & 813
Schonrogge, K. (2015). PIPITS: An automated pipeline for analyses of fungal ITS sequences 814
from the Illumina sequencing platform. Methods in Ecology and Evolution, 6, 973-980. 815
816
PeerJ Preprints | https://doi.org/10.7287/peerj.preprints.2196v3 | CC BY 4.0 Open Access | rec: 26 Oct 2016, publ:

28
Hallin, P. F., & Ussery, D. W. (2004). CBS Genome Atlas database: A dynamic storage for 817
bioinformatic results and sequence data. Bioinformatics, 20, 3682–3686. 818
819
Haas, B. J., Gevers, D., Earl, A. M., Feldgarden, M., Ward, D. V., Giannoukos, G., Ciulla, D., 820
Tabbaa, D., Highlander, S. K., Sodergren, E., Methé, B., DeSantis, T. Z., Petrosino, J. F., Knight, 821
R. & Birren, B. W. (2011). Chimeric 16S rRNA sequence formation and detection in Sanger and 822
454-pyrosequenced PCR amplicons. Genome Research, 21, 494–504. 823
824
Katoh, K., & Standley, D. M. (2013). MAFFT multiple sequence alignment software version 7: 825
Improvements in performance and usability. Molecular Biology and Evolution, 30, 772-826
780.reference 827
828
Kelley, D. R., Schatz, M. C., & Salzberg, S. L. (2010). Quake: quality-aware detection and 829
correction of sequencing errors. Genome Biology, 11, R116. 830
831
Kircher, M., Sawyer, S., & Meyer, M. (2012). Double indexing overcomes inaccuracies in 832
multiplex sequencing on the Illumina platform. Nucleic Acids Research, 40, e3. 833
834
Kozich, J. J., Westcott, S. L., Baxter, N. T., Highlander, S. K., & Schloss, P. D. (2013). 835
Development of a dual-index sequencing strategy and curation pipeline for analyzing amplicon 836
sequence data on the MiSeq Illumina sequencing platform. Applied and Environmental 837
Microbiology, 79, 5112-5120. 838
839
Krohn, A. (in review). akutils-v1.2: Facilitating analyses of microbial communities through 840
QIIME. The Journal of Open Source Software, (in review). 841
842
Kunin, V., Engelbrektson, A., Ochman, H., & Hugenholtz, P. (2010). Wrinkles in the rare 843
biosphere: Pyrosequencing errors can lead to artificial inflation of diversity estimates. 844
Environmental Microbiology, 12, 118–123. 845
846
PeerJ Preprints | https://doi.org/10.7287/peerj.preprints.2196v3 | CC BY 4.0 Open Access | rec: 26 Oct 2016, publ:

29
Lane, D. J. (1991). 16S/23S rRNA sequencing. Pp. 115–176 in E. Stackebrandt and M. 847
Goodfellow, eds. Nucleic acid techniques in bacterial systematics. New York, NY: John Wiley. 848
849
Langille, M. G. I., Zaneveld, J., Caporaso, J.G., McDonald, D., Knights, D., Reyes, J. A., 850
Clemente, J. C., Burkepile, D. E., Vega Thurber, R. L., Knight, R., Beiko, R. G., & Huttenhower, 851
C. (2013). Predictive functional profiling of microbial communities using 16S rRNA marker 852
gene sequences. Nature Biotechnology, 31, 814-821. 853
854
Li H., Handsaker B., Wysoker A., Fennell T., Ruan J., Homer N., Marth G., Abecasis G., & 855
Durbin R. (2009). The Sequence Alignment/Map format and SAMtools. Bioinformatics, 25, 856
2078–2079. 857
858
Lim, K., Furuta, Y., & Kobayashi, I. (2012). Large variations in bacterial ribosomal RNA genes. 859
Molecular Biology and Evolution, 29, 2937–2948. 860
861
Liu, Z., DeSantis, T. Z., Andersen, G. L., & Knight, R. (2008). Accurate taxonomy assignments 862
from 16S rRNA sequences produced by highly parallel pyrosequencers. Nucleic Acids Research, 863
36, e120. 864
865
Lozupone, C., & Knight, R. (2005). UniFrac: a New Phylogenetic Method for Comparing 866
Microbial Communities. Applied and Environmental Microbiology, 71, 8228–8235. 867
868
Mahé, F., Rognes, T., Quince, C., de Vargas, C., & Dunthorn M. (2014). Swarm: robust and fast 869
clustering method for amplicon-based studies. PeerJ, 2, e593. 870
871
McDonald, D., Price, M. N., Goodrich, J., Nawrocki, E. P., DeSantis, T. Z., Probst, A., 872
Andersen, G. L., Knight, R., & Hugenholtz, P. (2012). An improved Greengenes taxonomy with 873
explicit ranks for ecological and evolutionary analyses of bacteria and archaea. The ISME 874
Journal, 6, 610–8. 875
876
PeerJ Preprints | https://doi.org/10.7287/peerj.preprints.2196v3 | CC BY 4.0 Open Access | rec: 26 Oct 2016, publ:

30
Medvedev, P., Scott, E., Kakaradov, B., & Pevzner, P. (2011). Error correction of high-877
throughput sequencing datasets with non-uniform coverage. Bioinformatics, 27, 137–141. 878
879
Mukherjee, S., Huntemann, M., Ivanova, N., Kyrpides, N. C., & Pati, A. (2015). Large-scale 880
contamination of microbial isolate genomes by Illumina PhiX control. Standards in Genomic 881
Sciences, 10, 1–4. 882
883
Navas-Molina, J. A., Peralta-Sánchez, J. M., González, A., McMurdie, P. J., Vázquez-Baeza, Y., 884
Xu, Z., Ursell, L. K., Lauber, C., Zhou, H., Song, S. J., Huntley, J., Ackermann, G. L., Berg-885
Lyons, D., Holmes, S., Caporaso, J. G., Knight, R. (2013). Advancing our understanding of the 886
human microbiome using QIIME. Methods in Enzymology, 531, 371-444. 887
888
Nelson, M. C., Morrison, H. G., Benjamino, J., Grim, S. L., & Graf, J. (2014). Analysis, 889
optimization and verification of Illumina-generated 16S rRNA gene amplicon surveys. PloS 890
One, 9, e94249. 891
892
Nguyen, N. H., Smith, D., Peay, K., & Kennedy, P. (2015). Parsing ecological signal from noise 893
in next generation amplicon sequencing. New Phytologist, 205, 1389-1393. 894
895
Nikolenko, S. I., Korobeynikov, A. I., & Alekseyev, M. A. (2013). BayesHammer: Bayesian 896
clustering for error correction in single-cell sequencing. BMC Genomics, 14, 1–11. 897
898
Pei, A. Y., Oberdorf, W. E., Nossa, C. W., Agarwal, A., Chokshi, P., Gerz, E. A., Jin, Z., Lee, P., 899
Yang, L., Poles, M., Brown, S. M., Sotero, S., DeSantis, T., Brodie, E., Nelson, K., Pei, Z. 900
(2010). Diversity of 16S rRNA genes within individual prokaryotic genomes. Applied and 901
Environmental Microbiology, 76, 3886–3897. 902
903
Price, M. N., Dehal, P. S., & Arkin, A. P. (2009). Fasttree: Computing large minimum evolution 904
trees with profiles instead of a distance matrix. Molecular Biology and Evolution, 26, 1641–905
1650. 906
907
PeerJ Preprints | https://doi.org/10.7287/peerj.preprints.2196v3 | CC BY 4.0 Open Access | rec: 26 Oct 2016, publ:

31
Puente-Sánchez, F., Aguirre, J., & Parro, V. (2016). A novel conceptual approach to read-908
filtering in high-throughput amplicon sequencing studies. Nucleic Acids Research, 44, e40. 909
910
Rognes, T., Flouri, T., Nichols, B., Quince, C., & Mahé, F. (2016). VSEARCH: a versatile open 911
source tool for metagenomics. PeerJ, 4, e2584. 912
913
Rohland, N., & Reich, D. (2012). Cost-effective, high-throughput DNA sequencing libraries for 914
multiplexed target capture. Genome Research, 22, 939–46. 915
916
Schirmer, M., Ijaz, U. Z., D’Amore, R., Hall, N., Sloan, W. T., & Quince, C. (2015). Insight into 917
biases and sequencing errors for amplicon sequencing with the Illumina MiSeq platform. Nucleic 918
Acids Research, 43, 1–16. 919
920
Schloss, P. D., Westcott, S. L., Ryabin, T., Hall, J. R., Hartmann, M., Hollister, E. B., 921
Lesniewski, R. A., Oakley, B. B., Parks, D. H., Robinson, C. J., Sahl, J. W., Stres, B., Thallinger, 922
G. G., Van Horn, D. J. & Weber, C. F. (2009). Introducing mothur: Open-source, platform-923
independent, community-supported software for describing and comparing microbial 924
communities. Applied and Environmental Microbiology, 75, 7537–7541. 925
926
Schloss, P. D., Gevers, D., Westcott, S. L. (2011). Reducing the effects of PCR amplification and 927
sequencing Artifacts on 16s rRNA-based studies. PLoS ONE, 6, e27310. 928
929
Sogin, M. L., Morrison, H. G., Huber, J. A., Welch, D. M., Huse, S. M., Neal, P. R., Arrieta, J. 930
M. & Herndl, G. J. (2006). Microbial diversity in the deep sea and the underexplored “rare 931
biosphere”. Proceedings of the National Academy of Sciences of the United States of America, 932
103, 12115–12120. 933
934
Staden, R., Beal, K. F, Bonfield, J. K. (2000). The Staden package, 1998. Methods in Molecular 935
Biology, 132, 115-130. 936
937
PeerJ Preprints | https://doi.org/10.7287/peerj.preprints.2196v3 | CC BY 4.0 Open Access | rec: 26 Oct 2016, publ:

32
Sun, D. L., Jiang, X., Wu, Q. L., & Zhou, N. Y. (2013). Intragenomic heterogeneity of 16S 938
rRNA genes causes overestimation of prokaryotic diversity. Applied and Environmental 939
Microbiology, 79, 5962–5969. 940
941
Turner, S., Pryer, K. M., Miao, V. P., Palmer, J. D. (1999). Investigating deep phylogenetic 942
relationships among cyanobacteria and plastids by small subunit rRNA sequence analysis. The 943
Journal of Eukaryotic Microbiology, 46, 327–338. 944
945
Wang, Q., Garrity, G. M., Tiedje, J. M., & Cole, J. R. (2007). Naive Bayesian classifier for rapid 946
assignment of rRNA sequences into the new bacterial taxonomy. Applied and Environmental 947
Microbiology, 73, 5261–7. 948
949
950
951
952
953
954
955
956
957
958
959
960
961
962
963
964
965
966
967
968
PeerJ Preprints | https://doi.org/10.7287/peerj.preprints.2196v3 | CC BY 4.0 Open Access | rec: 26 Oct 2016, publ:

33
Table 1: Mock community OTU picking results. Comparison of OTU picking methods using 969
mock communities with eight total taxa. Cell values represent the number of OTUs returned for a 970
given algorithm and similarity or distance threshold. Correct results are emphasized with bold 971
text. 972
97%/d1 95%/d2 92%/d3 90%/d4 85%/d5
BLAST 9 9 8 8 8
CD-HIT 8 8 8 5 5
UCLUST 11 8 9 9 11
Swarm 8 8 8 8 5
973
974
975
976
977
978
979
980
981
982
983
984
985
986
987
988
989
990
991
PeerJ Preprints | https://doi.org/10.7287/peerj.preprints.2196v3 | CC BY 4.0 Open Access | rec: 26 Oct 2016, publ:

1
Table 2: Mock community taxonomic assignment results. Comparison of taxonomic assignment methods using mock communities 992
with eight total taxa. Representative sequences were added to Greengenes to test each of the assigners for the ability to return the 993
optimal sequence from a database search. Resulting taxonomic assignments for each method are listed with method-specific 994
confidence values indicated in parentheses (BLAST: e-value, RDP: bootstrap confidence, and UCLUST: p-value). An asterisk (*) 995
indicates an exact match against the correct representative sequence. The final column shows results with BLAST when the 996
representative sequences are excluded from the database. 997
OTU ID Expected
result BLAST RDP UCLUST
BLAST (Greengenes only)
denovo 0 Escherichia coli *Escherichia coli (1e-139)
Escherichia coli (0.860)
Enterobacteriaceae (1.00)
Enterobacteriaceae (1e-139)
denovo 1 Staphylococcus aureus
*Staphylococcus aureus (6e-135)
Staphylococcus (0.980)
Staphylococcus epidermidis (0.67)
Staphylococcus (6e-135)
denovo 2 Bacillus megaterium
*Bacillus megaterium (2e-137)
Bacillus cereus (0.720)
Bacillus (0.67) Bacillus cereus (2e-137)
denovo 3 Klebsiella pneumoniae
*Klebsiella pneumoniae (1e-139)
Enterobacteriaceae (1.000)
Enterobacteriaceae (0.67)
Enterobacteriaceae (1e-139)
denovo 4 Proteus vulgaris *Proteus vulgaris (1e-139)
Proteus (0.960) Proteus (0.67) Proteus (2e-137)
denovo 5 Lactococcus lactis
*Lactococcus lactis (1e-136)
Lactococcus (0.640) Lactococcus (1.00) Lactococcus (1e-136)
denovo 6 Micrococcus *Micrococcus luteus Micrococcus (0.900) Micrococcus (0.67) Micrococcus (2e-
PeerJ Preprints | https://doi.org/10.7287/peerj.preprints.2196v3 | CC BY 4.0 Open Access | rec: 26 Oct 2016, publ:

2
luteus (2e-137) 137)
denovo 7 Pseudomonas aeruginosa
*Pseudomonas aeruginosa (1e-139)
Pseudomonas (0.520)
Pseudomonadaceae (0.67)
Pseudomonas (1e-139)
Matches 8/8 (100%) 0/8 (0%) 0/8 (0%) 0/8 (0%)
998
PeerJ Preprints | https://doi.org/10.7287/peerj.preprints.2196v3 | CC BY 4.0 Open Access | rec: 26 Oct 2016, publ:

1
Figure 1: Alpha diversities of mock communities by default analysis. Alpha diversity 999
comparisons for mock communities using default analysis settings and rarefied to 10,000 1000
sequences per sample. Mean values are represented by an “x” while median values are 1001
represented by a straight line. Each plot depicts a different OTU table filtering method: (a) 1002
singletons removed across the entire table (mc2), (b) private alleles and singletons removed per 1003
sample (n2), (c) OTUs removed that do not exceed 0.005% of the total data (Bokulich), and (d) 1004
OTUs removed that do not exceed 0.3% per sample (Kircher). In every case, diversity estimates 1005
are inflated (expected values are Community 0: 8 OTUs; Communities 1a, 1b, 2a, 2b: 4 OTUs 1006
each). 1007
1008
1009
PeerJ Preprints | https://doi.org/10.7287/peerj.preprints.2196v3 | CC BY 4.0 Open Access | rec: 26 Oct 2016, publ:

2
Figure 2: Effect of allowed low-quality reads on data retention and observed OTU diversity. The 1010
effect of adjusting (a) the r parameter (allowed low quality reads), in the split_libraries_fastq.py 1011
command in QIIME, on the percent of raw reads retained after data processing (Swarm d4 only), 1012
and (b) the observed number of OTUs in the mock community data compared to expected values 1013
(expressed as percent of total) across Swarm resolutions d1-d4. 1014
1015
1016
1017
1018
1019
1020
1021
1022
1023
1024
1025
1026
1027
1028
1029
PeerJ Preprints | https://doi.org/10.7287/peerj.preprints.2196v3 | CC BY 4.0 Open Access | rec: 26 Oct 2016, publ:

3
Figure 3: Observed versus expected mock community compositions. Observed mock community 1030
compositions (Obs) plotted against expected values (Exp) for each separate community. Data 1031
presented here are for the optimized analysis using the Kircher threshold for OTU table filtering, 1032
and yielded a strong positive correlation to the expected result (Spearman’s r = 0.9646, CI = 1033
[0.9495, 0.9752]). 1034
1035
1036
1037
1038
1039
1040
1041
1042
1043
PeerJ Preprints | https://doi.org/10.7287/peerj.preprints.2196v3 | CC BY 4.0 Open Access | rec: 26 Oct 2016, publ:

4
Figure 4: Diversity analyses for environmental data rarefied to 5000 reads per sample. Alpha 1044
diversity as assessed by default (a) or optimized (b) workflow. Beta diversity assessed by default 1045
(c) or optimized (d) workflow (white squares: pre-tree; black circles: post-tree). All data show 1046
the same trends with strong statistical support (see text). Optimization has a strong effect on the 1047
interpretation of alpha diversity results while results are similar between workflows for beta 1048
diversity analyses 1049
1050
1051
PeerJ Preprints | https://doi.org/10.7287/peerj.preprints.2196v3 | CC BY 4.0 Open Access | rec: 26 Oct 2016, publ:

5
Figure 5: Mafft alignments illustrating typical truncation of low-frequency OTUs for mock and 1052
environmental sequences. Mafft alignments for (a) two OTUs constituting mock community 1053
member Bacillus megaterium, and (b) five environmental OTUs classified to the family level as 1054
Sphingomonadaceae. Sequences are labelled with de novo OTU designations from the optimized 1055
workflow, and base positions are indicated above the sequence alignments. Highlighted bases 1056
indicate differences from the alignment consensus (not shown) and are colored according to 1057
identity. Overlapping and non-overlapping regions of the first and second reads are indicated 1058
above the alignments. Pink and blue positions indicate a “TTT” trimer preceding a “G” 1059
truncation position respectively. In each case, the bottom sequence represents a low-frequency 1060
OTU which was truncated during quality filtering. 1061
PeerJ Preprints | https://doi.org/10.7287/peerj.preprints.2196v3 | CC BY 4.0 Open Access | rec: 26 Oct 2016, publ:

6
1062
PeerJ Preprints | https://doi.org/10.7287/peerj.preprints.2196v3 | CC BY 4.0 Open Access | rec: 26 Oct 2016, publ: