optimization of acetylene black conductive additive and
TRANSCRIPT

1
Optimization of Acetylene Black Conductive Additive and Polyvinylidene Difluoride
Composition for High Power Rechargeable Lithium-Ion Cells
G. Liua,z
, H. Zhenga,c
, V. S. Battagliaa, A. S. Simens
b,d, A. M. Minor
b, and X. Song
a
a Environmental Energy Technologies Division, Lawrence Berkeley National Laboratory,
Berkeley, CA 94720, USA
bNational Center for Electron Microscopy, Material Science Division, Lawrence
Berkeley National Laboratory, Berkeley, CA 94720, USA
c On Leave from Henan Normal University, Henan Provence, China
d Present Address: Material Science and Engineering Department, Stanford University,
Stanford, 94305, USA
z Corresponding Author:
Gao Liu
Lawrence Berkeley National Laboratory
1 Cyclotron Rd., MS 70R108B
Berkeley, CA 94720
Office Phone: (510) 486-7207
Office Fax: (510) 486-7303
E-mail: [email protected]

2
Abstract
Fundamental electrochemical methods were applied to study the effect of the
acetylene black (AB) and the polyvinylidene difluoride (PVDF) polymer binder on the
performance of high-power designed rechargeable lithium ion cells. A systematic study
of the AB/PVDF long-range electronic conductivity at different weight ratios is
performed using four-probe direct current tests and the results reported. There is a wide
range of AB/PVDF ratios that satisfy the long-range electronic conductivity requirement
of the lithium-ion cathode electrode; however, a significant cell power performance
improvement is observed at small AB/PVDF composition ratios that are far from the
long-range conductivity optimum of 1 to 1.25. Electrochemical impedance spectroscopy
(EIS) tests indicate that the interfacial impedance decreases significantly with increase in
binder content. The hybrid power pulse characterization results agree with the EIS tests
and also show improvement for cells with a high PVDF content. The AB to PVDF
composition plays a significant role in the interfacial resistance. We believe the higher
binder contents lead to a more cohesive conductive carbon particle network that results in
better overall all local electronic conductivity on the active material surface and hence
reduced charge transfer impedance.
Key Words
Lithium-Ion Battery; Electrode Design; Polymer Composite.

3
Introduction
Lithium-ion rechargeable batteries are a prime candidate for electric vehicle (EV) and
hybrid electric vehicle (HEV) applications due to their high energy density and light
weight. These applications, especially HEV, require low internal resistance for superb
high-rate charge and discharge performance. The lithium-ion cell electrode is composed
of active materials, conductive additives and a polymer binder to combine the particles
into an integrated electrode system. The cathode active material is made from metal
oxide materials which have very low intrinsic conductivity ranging from 10-3
S/cm for
LiCoO2 to 10-9
S/cm for LiFePO4 at ambient condition.1-4
The active material primary
particles are sintered into micron-size particles and mixed with highly conductive carbon
additives to improve the particle conductivity. In this study, LiNi0.8Co0.15Al0.05O2 is used
as active material; acetylene black (AB) is used as conductive additive; and
polyvinylidene difluoride (PVDF) is used as polymer binder. The focus here is the
optimization of the composition of the porous composite electrodes to improve the
lithium-ion cell performance.
A unique approach is taken to study the lithium-ion battery cathode electrode as a
polymer composite. A simple cathode is a three-component composite including a
polymer binder and two discreet sized particles: the nano-size AB and the micro-size
LiNi0.8Co0.15Al0.05O2. The specific surface area of the AB is at least ten times larger than
that of the LiNi0.8Co0.15Al0.05O2 material. In a polymer composite system, the surface
area dominants the mixing process such that most of the polymer binder in a composite
will associate with the smaller size conductive additive, even when the AB is far from
being the weight dominant component.5-7
In this respect, we view the electrode system as

4
a LiNi0.8Co0.15Al0.05O2 cathode material being bond together by an AB/PVDF composite.
The electronic properties of the AB/PVDF composites naturally affect the performance of
the electrode.8
In this report, a set of experiments were designed to evaluate the contribution of the
long-range electronic conductivity of AB/PVDF composites to the overall electrode
performance. The long range electronic conductivities of the AB/PVDF composites and
the AB/PVDF/active material composites were measured via a four-point probe direct-
current (DC) method.9 The composite films were cast on glass for the four-point probe
DC measurements. Lithium-ion cells of very similar capacity and configuration but with
various the AB/PVDF ratios were constructed, and their power performance evaluated
with variable rate cycling, hybrid pulse power characterization (HPPC) experiments, and
electrochemical impedance spectroscopy (EIS).
Most of the previous work on electrode compositions treats the conductive additive
and binder as two independent variables: one present for providing electronic
conductivity and the other present to hold the electrode components together.10
And
although AB does provide electronic conductivity in the cathode electrode, long-range
electron pathways cannot be formed without the participation of the binders. Therefore
AB and PVDF are the integrated parts of the electrode rather than two independent
components.11-15
We report the electronic properties of the AB/PVDF composites and
their effects to the electrode performance.

5
Experimental
Materials
Battery grade AB with an average particle size of 40 nm and a material density of
1.95 g/cm3 was acquired from Denka Singapore Private Limited. PVDF #1100 binder
with a material density of 1.78 g/cm was supplied by Kureha, Japan. Anhydrous N-
methylpyrrolidinone (NMP) was purchased from Aldrich Chemical Company. The
AB/PVDF mixtures were made by dissolving 5 g of PVDF in 95 g of anhydrous NMP. A
given amount of AB was dispersed in the PVDF polymer solution to meet the desired
ratio. To ensure the thorough mixing of the AB nanoparticles into the polymer solution,
sonification was used. A Branson 450 sonicator equipped with a solid horn was used.
The sonication power was set at 70%. A continuous sequence of 10 s pulses followed by
a 30 s rests was used. The sonic dispersion process took about 30 minutes. The slurry
properties for all AB/PVDF in NMP were constant after 20 minutes of sonification.
Slurries with active cathode material were made by adding the targeted amount of
LiNi0.8Co0.15Al0.05O2 active material to into premixed AB/PVDF/NMP slurry. The
cathode mixture was homogenized using Polytron PT10-3S Homogenizer at 3000 RPM
for 15 minutes until viscous slurry is acquired. LiNi0.8Co0.15Al0.05O2, with a mean
particle size of 10 µm and lattice density of 4.73 g/cm3, was a gift from Toda, Japan. The
manufacture suggested specific capacity is 173 mAh/g when cycled between 3 V and 4.1
V.

6
Film and Electrode Casting
In order to understand the conductive behavior of the AB/PVDF composite system,
different weight ratios of AB are dispersed in PVDF-NMP solutions and cast into thin
films. The film compositions extend from 1:10 to 1:1 AB/PVDF weigh ratios. The films
show cracks beyond the AB/PVDF ratio of 1:1, which would indicate that mixtures with
less than this fraction of binder may not effectively maintain coherent, long-range
conductivity in an electrode. AB/PVDF ratios greater than 1:1 will also likely to result in
mechanically weak composites. LiNi0.8Co0.15Al0.05O2 active material was used with the
AB/PVDF to fabricate electrodes. The AB content was fixed at 4% by weight in three
electrode compositions, but the amount of PVDF binder was varied to achieve AB/PVDF
weight ratios of 1:2, 1:1.25 and 1:1.
Both AB/PVDF and AB/PVDF/LiNi0.8Co0.15Al0.05O2 films for the four-point probe
DC tests were cast on to glass surfaces with a doctor blade. Cathode laminates
(AB/PVDF/LiNi0.8Co0.15Al0.05O2) for coin-cell testing was cast on 30 µm thick battery
grade Al sheet using a Mitutoyo doctor blade and a Yoshimitsu Seiki vacuum drawdown
coater. The films and laminates were first dried under IR lamps for an hour until most of
the NMP was evaporated and they appeared dried. The films and laminates were further
dried at 120°C, under 10-2
torr pressure for 24 hours. The film and laminate thickness was
measured with a Mitutoyo micrometer with an accuracy of 1 µm. The typical thickness of
the AB/PVDF film is around 20 µm with a density of around 1.2 g/cm3. The typical
thickness of the AB/PVDF/LiNi0.8Co0.15Al0.05O2 film is approximately 50 µm with an
initial porosity around 52%. The electrodes were compressed to 35% porosity before coin
cell assembly using a rolling mill with a continuously adjustable gap from International
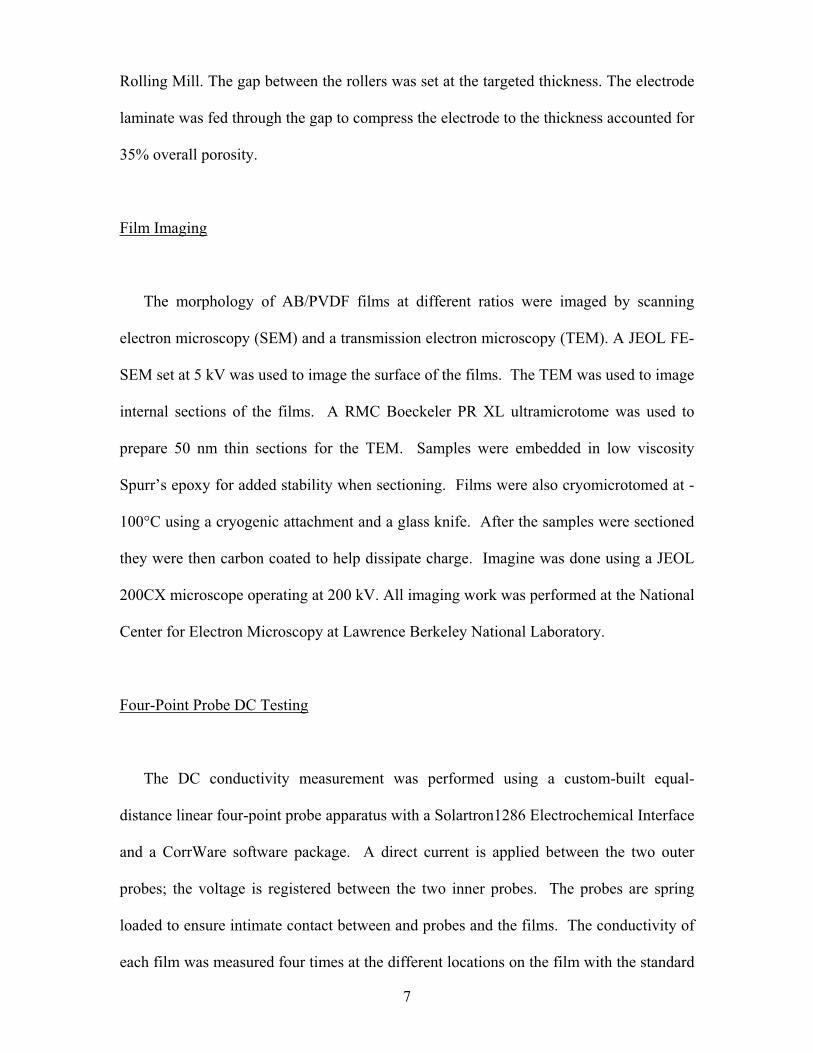
7
Rolling Mill. The gap between the rollers was set at the targeted thickness. The electrode
laminate was fed through the gap to compress the electrode to the thickness accounted for
35% overall porosity.
Film Imaging
The morphology of AB/PVDF films at different ratios were imaged by scanning
electron microscopy (SEM) and a transmission electron microscopy (TEM). A JEOL FE-
SEM set at 5 kV was used to image the surface of the films. The TEM was used to image
internal sections of the films. A RMC Boeckeler PR XL ultramicrotome was used to
prepare 50 nm thin sections for the TEM. Samples were embedded in low viscosity
Spurr’s epoxy for added stability when sectioning. Films were also cryomicrotomed at -
100°C using a cryogenic attachment and a glass knife. After the samples were sectioned
they were then carbon coated to help dissipate charge. Imagine was done using a JEOL
200CX microscope operating at 200 kV. All imaging work was performed at the National
Center for Electron Microscopy at Lawrence Berkeley National Laboratory.
Four-Point Probe DC Testing
The DC conductivity measurement was performed using a custom-built equal-
distance linear four-point probe apparatus with a Solartron1286 Electrochemical Interface
and a CorrWare software package. A direct current is applied between the two outer
probes; the voltage is registered between the two inner probes. The probes are spring
loaded to ensure intimate contact between and probes and the films. The conductivity of
each film was measured four times at the different locations on the film with the standard

8
deviations shown as error bars. Electrolyte solvent was made by mixing 1:1 weight ratio
of ethylene carbonate (EC) and diethylene carbonate (DEC) for the four-probe DC test.
No salt was added to the electrolyte solvent to prevent ion interference with the
measurements. The film was submerged in the electrolyte solvent and the conductivity
measurements repeated, intermittently, until it constant value was recorded. The
conductivities of the AB/PVDF and AB/PVDF//LiNi0.8Co0.15Al0.05O2 films on glass
substrate were measured using the four-point probe DC method.9 The dry film
conductivities were measured after the films were dried in a vacuum oven overnight at
120°C. Afterwards, the films were wetted with electrolyte solvent and their
conductivities were measured again.
Coin Cell Fabrication and Testing
Coin cell assembly was prepared in standard 2325 coin cell hardware with
LiNi0.8Co0.15Al 0.05O2 as the active cathode material. The cathode laminates were
prepared with different AB/PVDF contents. A 1.26 cm diameter disk was punched out
from the cathode laminate for use in the coin cell assembly. Both lithium metal and
MCMB10-28 graphite were used as counter electrodes. The counter electrodes are 1.47
cm diameter disks, which are larger than the cathode to prevent lithium deposition at high
charge rate. The cathode electrode was placed in the center of the outer shell of the coin
cell assembly and 2 drops of 1 M LiPF6 in EC:DEC (1:1 weight ratio) electrolyte added
to fill the electrode. A 2 cm diameter of Celgard 2400 porous polyethylene separator was
place on top of the cathode electrode. A few drops the electrolyte were added to the
separator. The counter electrode was placed on the top of the separator. Special care was
taken to align the counter electrode symmetrically above the cathode. A stainless steel

9
spacer and a Belleville spring were placed on top of the counter electrode. Plastic
grommet was placed on top of the outer edge of the electrode assembly and crimped
closed with a custom-build hydraulic crimping machine manufactured by National
Research Council of Canada. The entire cell fabrication procedure was done in an Argon
filled glove box at oxygen level below 0.1 ppm and dew point below -80ºC.
The coin cell performance was evaluated in a thermal chamber at 30ºC with a Maccor
Battery Test System. The electrode rate performance was characterized against lithium
counter electrode and MCMB10-28 counter electrode coin cells. The cycling voltage
limits were set at 4.1 V at the top of charge and 3.0 V at the bottom of charge. The coin
cells made with MCMB10-28 graphite were first formed by going through 2 cycles at
C/25 at 30°C. The EIS tests were performed at 40% depth of discharge (DOD) at
frequencies between 105 Hz to 0.01 Hz using a Solartron 1260 Impedance/Gain-phase
Analyzer and Z-plot software package. HPPC tests were performed only on the MCMB-
based coin cells following the established procedures.16
Results and discussion
The DC Conductivities of the AB/PVDF and AB/PVDF/LiNi0.8Co0.15Al0.05O2 cast films.
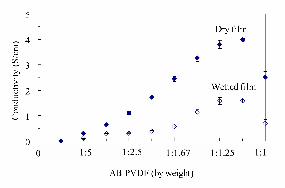
Figure 1 is the conductivity plot of the AB/PVDF film at different compositions.
The conductivity increases with increasing AB content and peaks at 1:1.25 AB to
PVDF.17
An increase in AB content beyond 1:1.25 resulted in cracked films and a
significant decrease in the conductivity. This is due to the lack of PVDF binder needed
to hold all the carbon particles together. When the composites are in contact with excess

10
electrolyte, conductivities of the wet films are only a third as high as the conductivity of
the dry films. The AB particles are separated with a thin layer of PVDF binder.18
It is
well known that the PVDF swells in the presence of electrolyte.19
The distance between
the conductive AB particles is increased when the PVDF layer between the particles
swells, resulting in the drop of electronic conductivity. The wetted condition is more
representative of the electronic conductivity one might expect in a functioning cell.
However, the figure shows that even at AB/PVDF ratio of 1:5, the composite
conductivity is still greater than 0.1 S/cm which is still far greater than the electronic
conductivity of the active material and of the electrolyte, which has conductivity on the
order of 10-2
-10-3
S/cm.20-22
Among the compositions shown in Figure 1, 1:2, 1:1.25, and 1:1 AB/PVDF were
selected for further testing with active material. 1:1.25 gave the best electronic
conductivity among all the AB/PVDF compositions; 1:2 and 1:1 have similar
conductivity but straddle the optimum. In the three electrode compositions tested, the
conductive additive AB was fixed at 4% by weight and the PVDF and active material
contents varied in order to achieve the desired AB/PVDF ratios. Although the conductive
additive is constant in all three compositions, the long-range electronic conductivity of
the composite electrodes changed, as shown in Figure 2. This trend is in agreement with
the conductivity behavior of the AB/PVDF thin films (Figure 1). In a none calendared
electrode film, 52% of volume is void space, 48% is occupied by
AB/PVDF/LiNi0.8Co0.15Al0.05O2 as reported in the experimental section. Considering the
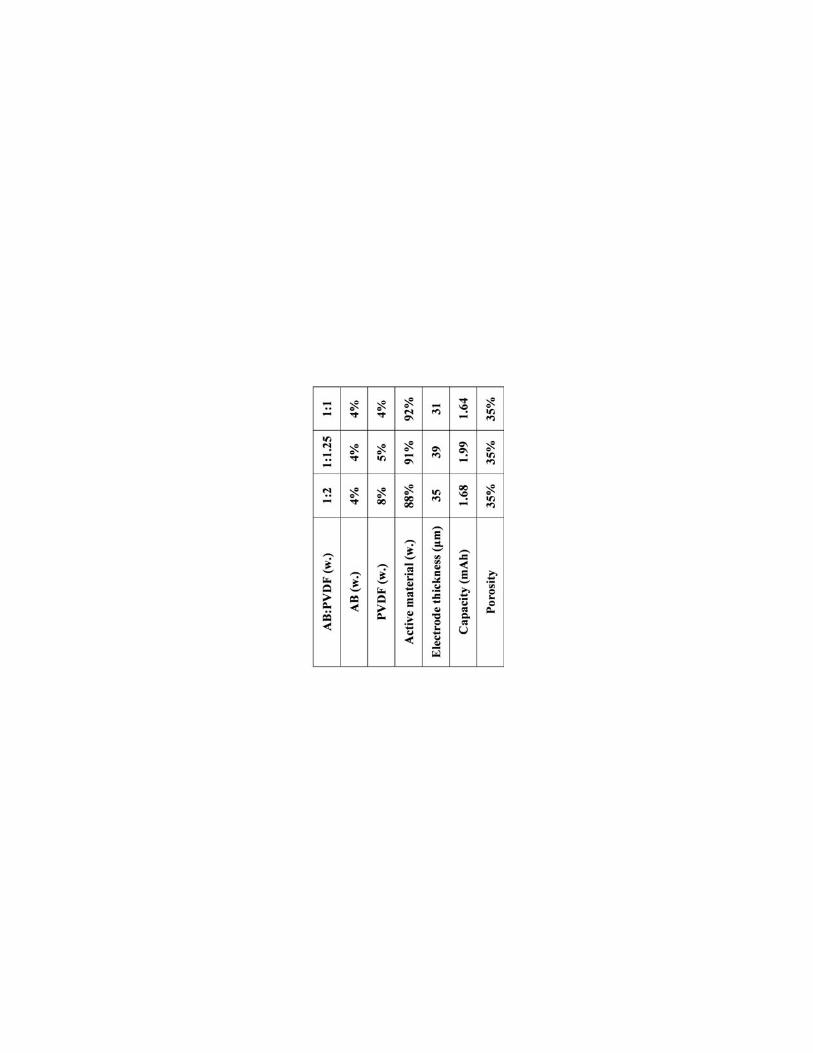
material densities and the PVDF and LiNi0.8Co0.15Al0.05O2 contents as shown in Table 1,
the volume ratio of the AB/PVDF is only around 10% of the total volume of the electrode
as labeled in Figure 2. This 10% volume ratio of the AB/PVDF of the electrode agrees

11
well with the 90% drop of long range electronic conductivity of the composite films. The
AB/PVDF composite is the major component to allow for conductivity of the electrode.
A similar result of electronic conductivity drop is seen for composite films with
electrolyte added. Despite the additional drop in conductivity of the composite electrodes,
all three electrode compositions still maintain significantly higher electronic
conductivities than the electronic conductivity of either LiNi0.8Co0.15Al 0.05O2 or the
conductivity of the electrolyte. 20-22
Morphologies of the Composites
SEM was used to correlate the AB/PVDF films’ surface morphology to their
conductivity as shown in Figure 3. At low AB loading (Figure 3 A), a continuous
polymer phase was clearly visible (white arrows) with aggregates of AB embedded in it.
With increasing AB concentration (Figure 3 B, C), AB becomes more abundant on the
surface with the retreat of the polymer phase. Although the 1:1 ratio of AB/PVDF
appears uniform under visual examination, low magnification SEM images (Figure 3 C,
in-set) show extended micro cracks in the film. This loss of mechanical integrity is
attributed to the decrease of conductivity with increasing AB content beyond the
optimum electronic conductivity level at 1:1.25 AB/PVDF ratio.
In a working composite electrode, electrons are transported mostly through the
AB/PVDF of the composite system, and, therefore, the conductivity of this pathway is
critical to the electrode performance. We therefore felt the need to study the morphology
of this pathway more closely. AB/PVDF of 1:2, 1:1.25, and 1:1 ratios were studied.
These three samples covered the binder rich, optimum conductivity, and AB rich

12
composition. As shown in the TEM images in Figure 4, the acetylene black is not
uniformly distributed in the binder. There are distinct phases that are either binder rich or
AB aggregate rich. At higher binder contents, the AB forms extended 3-dimensional
networks to provide long range conductivity while free polymer forms another phase
within the AB network. At 1:2 composition, TEM image (Figure 4, A) shows that pure
PVDF phases exist that do not contribute to the composite long-rang conductivity, and
that extended AB agglomerate phase as current path. There are very few visible regions
of free polymer phases observable under TEM at a 1:1.25 AB/PVDF ratio and greater,
(Figure 4, B, C) due to the fact that the PVDF is mostly associated with AB particles
rather than form its own phases.23
As a reminder, electronic conductivity peaks at 1:1.25
and decreases at 1:1 AB/PVDF ratio. There appears to be a minimum requirement of
polymer at 1:1.25 to tightly bind the AB particles together. The disappearing of free
polymer phases with increasing AB ratio is due to the strong interaction between the
polymer and AB particle surface. The polymer molecules can be adsorbed onto the AB
surface either chemically or physically. With increasing AB content, the free polymer
regions transform into mostly surface absorbed layers around the AB particles.5
Electrochemistry Testing
Cathode laminates of varying AB/PVDF weight ratios of 1:2, 1:1.25, and 1:1 on
aluminum substrates were tested in coin cells against lithium foil and MCMB counter
electrodes. The AB content in all of the cells was held at 4%. The detailed cell
compositions and configurations are listed in Table 1. The porosity of the three
electrodes was held constant at 35% in order to minimize the configuration effects of the
cell performance. The capacity and thickness of the three electrodes are controlled at

13
10% standard deviation in order to minimize the configuration effects to the cell
performance.24
However it should be noted that a small variation of either parameters
can’t be entirely eliminated because active material content also changes a few percents
due to the change of PVDF. Although only 4% change of PVDF content, this brings a
50% change in the AB/PVDF ratios among three electrodes. All coin cell capacities
agree well with the literature suggested LiNi0.8Co0.15Al0.05O2 material capacity of 173
mAh/g during C/10 charge and discharge tests between 3 V and 4.1 V as shown in Table
1.25
Figure 5 shows the rate performance of three lithium counter-electrode cells. These
cells are charged at C/10 rate and discharged at different rates. The discharge capacities
of the cells are normalized as the measured discharge capacities at variable C-rate divided
by the corresponding cell capacity as shown in Table 1. All three cells perform similarly
at low to medium rate. However the performances diverge at high rates. The electrode
with the optimum electronic conductivity (AB/PVDF = 1:1.25) is not the best performing
cell at high rates. The cell with the highest binder content (AB/PVDF = 1:2), gives the
best capacity retention at high rates. The cell with lowest binder content (AB/PVDF =
1:1) performs the worst.
In order to better interpret these results, EIS was performed on all three cells at 40%
DOD, as shown in Figure 6. The major difference in the impedance data between the
three cells is the interfacial resistance represented by the squashed semicircle in the high
frequency region of the spectrum. The width of the semicircle increases with decreasing
binder content. Similar results were observed with coin cells made containing MCMB10-
28 as the counter electrode, as shown in Figure 7. The width of the semicircles in Figures
6 and 7 each contain contributions from the interfacial impedance from the counter
electrodes, with a smaller contribution coming from the graphite than that of the lithium.

14
Separate experiments with reference electrodes (not shown) performed cells with lithium
foil indicate that the lithium contributes very little to the overall cell impedance. The
increase in impedance with removal of binder is thus a major contributor to the cell
impedance and lead to a loss of capacity at high rates. HPPC tests were performed on
three MCMB-based counter electrode coin cells, with the results plotted in Figure 8. The
area specific impedance (ASI) data is in very good agreement with the EIS test, as the
AB/PVDF = 1:2 composition gave the lowest ASI of the three cells across the entire
DOD range, followed by 1:1.25, and then 1:1.
Figure 9 is a schematic of the cathode particle and its environment in the working
electrodes with lithium-ion transport and electron movement pathways identified. The
open space is occupied by the electrolyte where lithium-ions can move in and out of the
active materials, while the black is the AB/PVDB electronic contact to the active
materials. The schematic is not drawn to scale but to demonstrate the possible
contributions of the spices during electrochemical process. All three electrodes are
designed to minimize the configuration contribution to the impedance variation. Since the
porosities are controlled at 35%, the electrolyte mass-transfer rate within the electrode is
very similar among all 3 compositions (Figure 9, A). The close-matching of the
capacities ensures very similar active material surface areas among all three electrodes.
There are two major changing factors among the three electrodes. The long range matrix
electronic conductivities of the electrodes are in the order of 1:1.25>1:1>1:2. Should the
matrix conductivity be the limiting factor (Figure 9, B) for all 3 electrodes, the power
performance starting from the best would be in the order of 1:1.25>1:1>1:2. PVDF is
viewed as a nonconductive material in the electrode composition. Increasing its amount
could exert a lithium-ion blocking effect both in the electrolyte and at the active material

15
interface, which might slow down the lithium-ion transfer in the electrolyte or at the
interface. (Figure 9, A, C) Should this be the scenario, the power performance starting
from the best would be 1:1>1:1.25>1:2. Neither of the above hypotheses is correct, so the
only possibility is the variation of the electronic conductivity (Figure 9, D) between the
active material particles and the AB/PVDF composite, which can affect the lithium-ion
transfer at the interface. Figure 10 is schematic pictures of the active material particle in
combination with the TEM image of the AB/PVDF composites. This schematics is not
drawn to scale but to illustrate the possible mechanism of the critical role of the binder in
designing cell for power performance. The existing of pure polymer phase in 1:2 (Figure
10, A) may serve a critical function to provide and maintain better mechanical contact
between the active material and AB conductive pathways rather than slowing down
lithium-ion transfer at the interface. Intimate contact between the AB and the active
materials allows effective local electronic charge injection therefore facilitate lithium-ion
transfer at the interface. At low binder loading, the AB tends to move away from the
active material to form agglomerate by itself due to the flocculation phenomenon.26,27
This AB micro-scale structures do not affect the long range conductivity but significantly
alters the interfacial impedance.
Conclusions
The long-range electronic conductivity in a composite electrode is almost exclusively
provided by the AB/PVDF matrix. A wide range of compositions of AB/PVDF ratios
tend to satisfy the long-range electronic conductivity requirement of lithium-ion cathodes.
This long-range electronic conductivity does not play an important factor for high rate
performance as much as the interfacial resistance does. Our research indicates that the

16
ratio of carbon conductive additive to binder ratio is a critical parameter in optimizing the
interfacial resistance, with higher binder contents being more beneficial. Thus, the PVDF
binders play a significant role in that it not only helps maintain electrode integrity, it also
provides intimate contact between the conductive additive and the active material
particles resulting in high, localized electronic conductivity at the active material
interface thus decreasing interfacial impedance.
Acknowledgments
This research was funded by the Assistant Secretary for Energy Efficiency and
Renewable Energy, Office of FreedomCAR and Vehicle Technologies of the U.S.
Department of Energy under contract no. DE-AC03-76SF00098.

17
References
1. S. Y. Chung, J. T. Bloking, and Y. M. Chiang, Nat. Mater. 1 (2), 123 (2002).
2. A. K. Padhi, K. S. Nanjundaswamy, and J. B. Goodenough, J. Electrochem. Soc.
144 (4), 1188 (1997).
3. H. Tukamoto and A. R. West, J. Electrochem. Soc. 144 (9), 3164 (1997).
4. J. Wolfenstine, J. Power Sources 129 (2), 324 (2004).
5. E. M. Dannenberg, Rubber Chem. Technol. 59 (3), 512 (1986).
6. J. C. Kenny, V. J. McBrierty, Z. Rigbi et al., Macromolecules 24 (2), 436 (1991).
7. A. I. Medalia, J. Colloid Interface Sci. 32 (1), 115 (1970).
8. K. Miyasaka, K. Watanabe, E. Jojima et al., J. Mater. Sci. 17 (6), 1610 (1982).
9. C. W. Wang, A. M. Sastry, K. A. Striebel et al., J. Electrochem. Soc. 152 (5),
A1001 (2005).
10. L. Fransson, T. Eriksson, K. Edstrom et al., J. Power Sources 101 (1), 1 (2001).
11. Z. H. Chen, L. Christensen, and J. R. Dahn, J. Electrochem. Soc. 150 (8), A1073
(2003).
12. D. Guy, B. Lestriez, R. Bouchet et al., Electrochem. Solid State Lett. 8 (1), A17
(2005).
13. D. Guy, B. Lestriez, R. Bouchet et al., J. Electrochem. Soc. 153 (4), A679 (2006).
14. K. Zaghib, J. Shim, A. Guerfi et al., Electrochem. Solid State Lett. 8 (4), A207
(2005).
15. Y. H. Chen, C. W. Wang, G. Liu et al., presented at the The 211th
Electrochemical Society Meeting, Chicago, IL, 2007.
16. T. Q. Duong, J. Power Sources 89 (2), 244 (2000).
17. Y. B. Yi and A. M. Sastry, Phys. Rev. E 66 (6) (2002).

18
18. F. Carmona, Ann. Chim.-Sci. Mat. 13 (6), 395 (1988).
19. Z. H. Chen, L. Christensen, and J. R. Dahn, J. Appl. Polym. Sci. 91 (5), 2958
(2004).
20. K. Xu, S. S. Zhang, and T. R. Jow, Electrochem. Solid State Lett. 8 (7), A365
(2005).
21. G. M. Ehrlich, Lithium-ion Batteries, 3rd ed ed. (McGraw-Hill: New York, 2002,
2002).
22. R. Kostecki and F. McLarnon, Electrochem. Solid State Lett. 7 (10), A380 (2004).
23. C. M. Blow, Polymer 14 (7), 309 (1973).
24. D. Y. W. Yu, K. Donoue, T. Inoue et al., J. Electrochem. Soc. 153 (5), A835
(2006).
25. R. B. Wright, J. P. Christophersen, C. G. Motloch et al., J. Power Sources 119,
865 (2003).
26. B. W. Derryaguin and L. D. Landau, Act. Physchem. SSSR 14, 375 (1941).
27. E. J. W. Verwey and J. Th. G. Overbeek, Theory of Stability of Lipophobic
Colloids. (Elseview, Amsterdam, 1948).

19
Figure Captions
Figure 1. Long range electronic conductivity of AB/PVDF composite films characterized
by four-point probe DC test at different AB to PVDF ratios.
Figure 2. Long range electronic conductivity of three LiNi0.8Co0.15Al0.05O2 cathodes with
constant 4% AB by weight. The Vol. labels indicate the volume ratios of the AB/PVDF
composite to the overall electrode volume.
Figure 3. SEM surface images of the AB/PVDF composites. (A) AB:PVDF = 1:2. Free
polymer is seen on the surface of AB as pointed out by the arrows. (B) AB:PVDF =
1:1.25. (C) AB:PVDF = 1:1.
Figure 4. TEM bulk morphology of AB/PVDF composites. (A) AB:PVDF = 1:2. Solid
lines indicate the AB aggregate phases and current paths. Dotted line enclosures indicate
free PVDF phases. (B) AB:PVDF = 1:1.25. (C) AB:PVDF = 1:1. Higher AB
concentration composites lack the free PVDF phases.
Figure 5. Variable rate performance of the lithium counter electrode coin cells made from
cathode electrode with different AB/PVDF ratios.
Figure 6. EIS of the lithium counter electrode coin cells at 40% DOD.
Figure 7. EIS of the MCMB10-28 counter electrode coin cells at 40% DOD.

20
Figure 8. HPPC test results of the MCMB10-28 counter electrode coin cells.
Figure 9. Schematic of the micro-scale cathode local environment. (A) lithium-ion mass
transfer in the electrolyte. (B) Electron pathway in the AB/PVDF composite. (C)
Lithium-ion transfer at the electrolyte-active material interface. (D) Electron transfer at
the AB/PVDF-active material interface.
Figure 10. Schematics of the interactions between active material particle and the
AB/PVDF composites. (A) Free polymer phases provide adhesion to pull the AB
conductive phases toward the active material particles as indicated by the white arrows.
(B) Lack of free polymer phase in higher AB concentration composite results in AB
conductive particles move away form the active material due to AB particle self-
attractions.

21
Table Caption
Table 1. The compositions and configurations of three LiNi0.8Co0.15Al0.05O2 cathode
electrodes.