optimization of antimony leaching from … materials made of low density polyethylene (ldpe) was ......
TRANSCRIPT
International Research Journal of Engineering and Technology (IRJET) e-ISSN: 2395 -0056
Volume: 03 Issue: 01 | Jan-2016 www.irjet.net p-ISSN: 2395-0072
© 2016, IRJET | Impact Factor value: 4.45 | ISO 9001:2008 Certified Journal | Page 1041
OPTIMIZATION OF ANTIMONY LEACHING FROM FOOD PACKAGING
COVERS MADE OF LOW DENSITY POLYETHYLENE USING RESPONSE
SURFACE METHODOLOGY
K. Ramarajan, S. Anbazhagi 2, P. Selvendiran, P. Hariprasad, M. Muthukumar* *Environmental Engineering and Technology Laboratory,
Department of Environmental Sciences, Bharathiar University, Coimbatore - 641 046, Tamilnadu, India.
Abstract
Heavy metal contamination in the environment, especially in packaged food and drinking water, are always of great concern due to their health impact. The use of heavy metal as catalysts during plastic syntheses, particularly antimony, human exposure to metal release from plastic covers has been a serious concern in recent years. The antimony (Sb) leaching from food packaging materials made of low density polyethylene (LDPE) was investigated and optimized using response surface methodology (RSM). The individual and interactive effect of three main independent variables such as pH (X1), temperature (ºC) (X2) and retention time (min) (X3) on the efficiency of leaching of antimony from plastic cover has been assessed. A second-order empirical relationship between the response and the independent variable was derived. Analysis of variance (ANOVA) showed a high coefficient of determination value (R2 = 0.8998 and an adjusted R2 0.8097). The maximum leachability of Sb was found at, alkaline pH with high temperature and less retention time. This study evidently showed that response surface methodology was one of tool to optimize the variables response for leaching of antimony from low density polyethylene covers.
Key words: Antimony; Central composite design (CCD); Leaching; LDPE; Response surface methodology
(RSM). 1. INTRODUCTION
Plastic is an organic, synthetic or processed material that is a high molecular weight polymer. The
material used for plastic covers varies from country to country, but the most widespread material in use
is polyethylene terephthalate (PET). PET has become the most favorable packaging material world wide
for water and soft drinks bottles. The reason for this development is the excellent material properties,
especially its durability and very low weight of the bottles compared to glass bottles of the same filling
volume. In comparison to other packaging polymers, PET has also a high clarity as well as good barrier
properties towards moisture and oxygen [1]. They are light, durable, moldable, hygienic and economic,
making them suitable for a wide variety of applications including food and product packaging, car
manufacturing, agriculture and housing products. Ninety percent of the worldwide manufacture of

International Research Journal of Engineering and Technology (IRJET) e-ISSN: 2395 -0056
Volume: 03 Issue: 01 | Jan-2016 www.irjet.net p-ISSN: 2395-0072
© 2016, IRJET | Impact Factor value: 4.45 | ISO 9001:2008 Certified Journal | Page 1042
polyethylene terephthalate (PET), polyester of terephthalic acid and ethylene glycol, employs Sb2O3 as a
catalyst [2]. The amount of PET covers for the package is still increasing worldwide. Antimony trioxide is
the preferred polycondensation catalyst for the fabrication of PET due to its adequate catalytic activity,
colour and cost. The Sb concentration of the commercialized PET resin is between 190 and 300 μg/g [3].
USEPA and EU have established 6 and 10 μg/L, respectively, of maximum permissible Sb concentration in
drinking water [4-5]. In contrast, an earlier study of metal content of food given to institutionalized
children showed about 0.209 to 0.693 mg/kg of antimony in food which is identical with a guideline for
drinking-water quality with regard to antimony by the World Health Organizations WHO (1996)[6].
Werrin (1963) reported that the intake of a drink containing 30 μg/ml Sb concentrations might cause
nausea, vomit, and diarrhea. In chronic exposure to lesser Sb doses, myocardial atrophy could be
observed; meanwhile higher doses cause increased occurrences of lung, liver and bile cancers [7-9]. The
USEPA has not classified antimony as a human carcinogen in water due to lack of studies. However,
research shows that antimony and arsenic, a proven carcinogen, are similarly toxic [10].
The commercialization of mineral water in PET covers dates back several decades; however, the
determination of the nature and extent of toxic substances that can dissolve from the bottle covers into
the water has only been achieved with the development of modern analytical techniques. In early
investigations, the possible leaching effect of water on the material of the cover was not considered.
Response surface methodology (RSM) is based on the statistical analysis of regression consisting in
determining an optimal model, which minimizes the residual variations [11]. Recently, RSM has been
successfully applied to different processes, which includes, O3 oxidation of acid dye effluent [12], Landfill
leachate [13], Selenite and Selenate Biosorption [14] and electrochemical oxidation of textile dye
International Research Journal of Engineering and Technology (IRJET) e-ISSN: 2395 -0056
Volume: 03 Issue: 01 | Jan-2016 www.irjet.net p-ISSN: 2395-0072
© 2016, IRJET | Impact Factor value: 4.45 | ISO 9001:2008 Certified Journal | Page 1043
wastewater [15]. The major objective of this study is to optimize the variables such as pH, temperature,
and the retention time on the leachability of antimony from the food packaging material.
2. MATERIALS AND METHODS
2.1 Chemicals and materials
The food packaging, plastic covers of low-density polyethylene (No.4) having the size of 40µm,
purchased from market (Kamala Plastics, Coimbatore, India). The ultra pure water was used for all the
experiments. The pH was adjusted as per the design experiment by adding 0.1 N HCl and 0.1 N NaOH
using the pH meter (Susima AP-1 Plus, Chennai, India). The temperature was varied by boiling the water
in an Induction stove (TTK Prestige Limited, Hosur, India). The water temperature was measured using a
thermometer (Brannan, UK). All glassware, polyethylene covers, and sample vessels (Borosil) used for
the experiments were immersed and rinsed three times with ultrapure water before use. All chemicals
used in this study were analytical grade, purchased from Loba Chemie, Mumbai, India.
2.2 Sample Preparation
Each experiment, 100 mL of ultra pure water was taken in the glass vessel and adjusted the pH,
temperature according to the design of experiments. Then poured the water into the low density
polyethylene cover and retained it for the duration given in the design of experiments. After attaining the
retention time, it was transferred to glass vials and analyzed immediately.
2.3 Experimental Design
To optimize the conditions for variables at which maximum antimony leaches out from the food
packaging material was found using response surface methodology. The experimental conditions were
designed as a function of the selected main variables such as pH (X1), temperature °C (X2) and residential
International Research Journal of Engineering and Technology (IRJET) e-ISSN: 2395 -0056
Volume: 03 Issue: 01 | Jan-2016 www.irjet.net p-ISSN: 2395-0072
© 2016, IRJET | Impact Factor value: 4.45 | ISO 9001:2008 Certified Journal | Page 1044
time (X3). The central composite design (CCD) was selected because it is ideal for sequential
experimentation and allows a reasonable amount of information for testing lack of fit while not involving
an unusually large number of design points [16].
The factors (independent variables) range selected for this experiment were pH (X1): 3-11,
temperature ºC (X2): 4 – 90 ºC and retention time (X3): 1- 60 min. A three-level factorial design was
established with the help of the Design Expert 8.0.4 Trial software (USA). In order to develop the
regression equation, the test factors were coded according to the following equation:
Ui – Ui0
Xi = ---------------- (1)
Δ Ui0
where Xi is the coded value of the ith independent variable, Ui the natural value of the ith
independent variable, Ui0 the natural value of the ith independent variable at the center point, and Δ Ui0 is
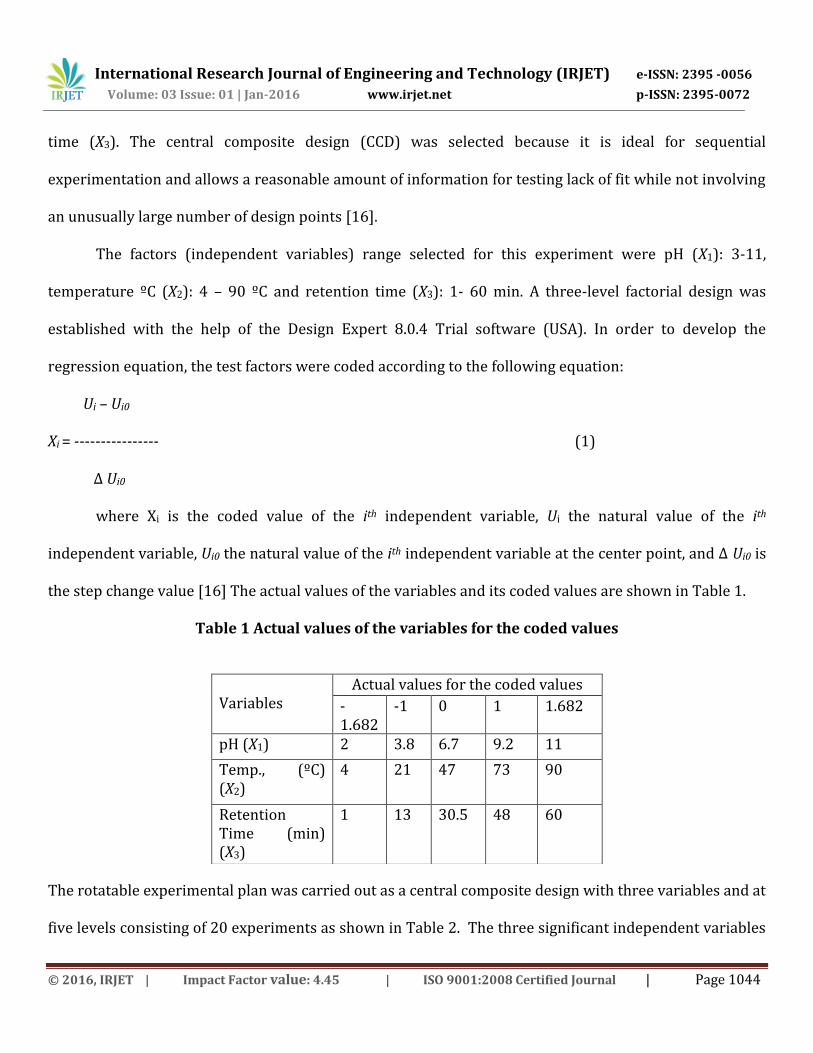
the step change value [16] The actual values of the variables and its coded values are shown in Table 1.
Table 1 Actual values of the variables for the coded values
The rotatable experimental plan was carried out as a central composite design with three variables and at
five levels consisting of 20 experiments as shown in Table 2. The three significant independent variables
Variables
Actual values for the coded values
-1.682
-1 0 1 1.682
pH (X1) 2 3.8 6.7 9.2 11
Temp., (ºC) (X2)
4 21 47 73 90
Retention Time (min) (X3)
1 13 30.5 48 60
International Research Journal of Engineering and Technology (IRJET) e-ISSN: 2395 -0056
Volume: 03 Issue: 01 | Jan-2016 www.irjet.net p-ISSN: 2395-0072
© 2016, IRJET | Impact Factor value: 4.45 | ISO 9001:2008 Certified Journal | Page 1045
X1, X2, and X3 and the mathematical relationship of the response Y (Sb leachability) on these variables can
be approximated by quadratic/(second-degree) polynomial equation as shown below:
Y = b0 + b1X1 + b2X2 + b3X3 + b11X12 + b22X22 + b33X32 + b12X1 X2 + b13X1 X3 + b23X2 X3 (2)
where Y is the predicted response, b0 the constant, b1, b2, and b3 the linear coefficients, b12, b13, and b23 the
cross-product coefficients, and b11, b22, and b33 are the quadratic coefficients. ANOVA was applied to
obtain the interaction between the process variables and the response. The coefficients of determination,
R2 and R2adj expressed the quality of fit of the resultant polynomial model, and statistical significance was
checked by the F - test.
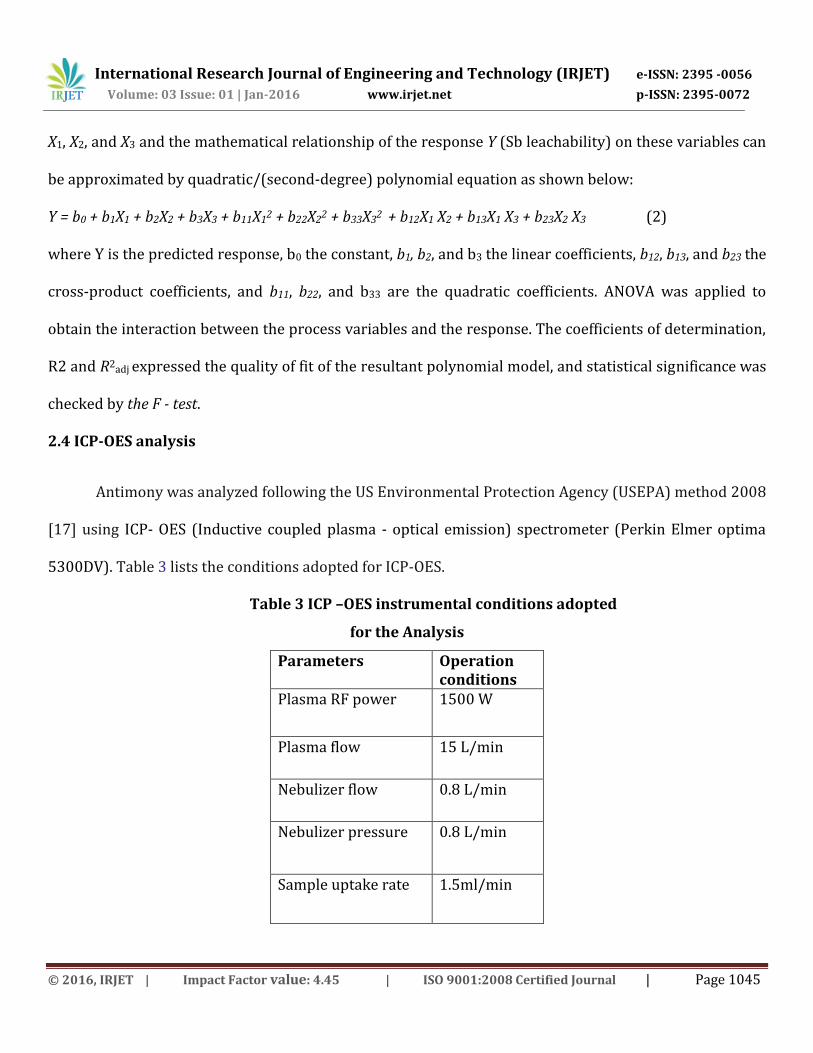
2.4 ICP-OES analysis
Antimony was analyzed following the US Environmental Protection Agency (USEPA) method 2008
[17] using ICP- OES (Inductive coupled plasma - optical emission) spectrometer (Perkin Elmer optima
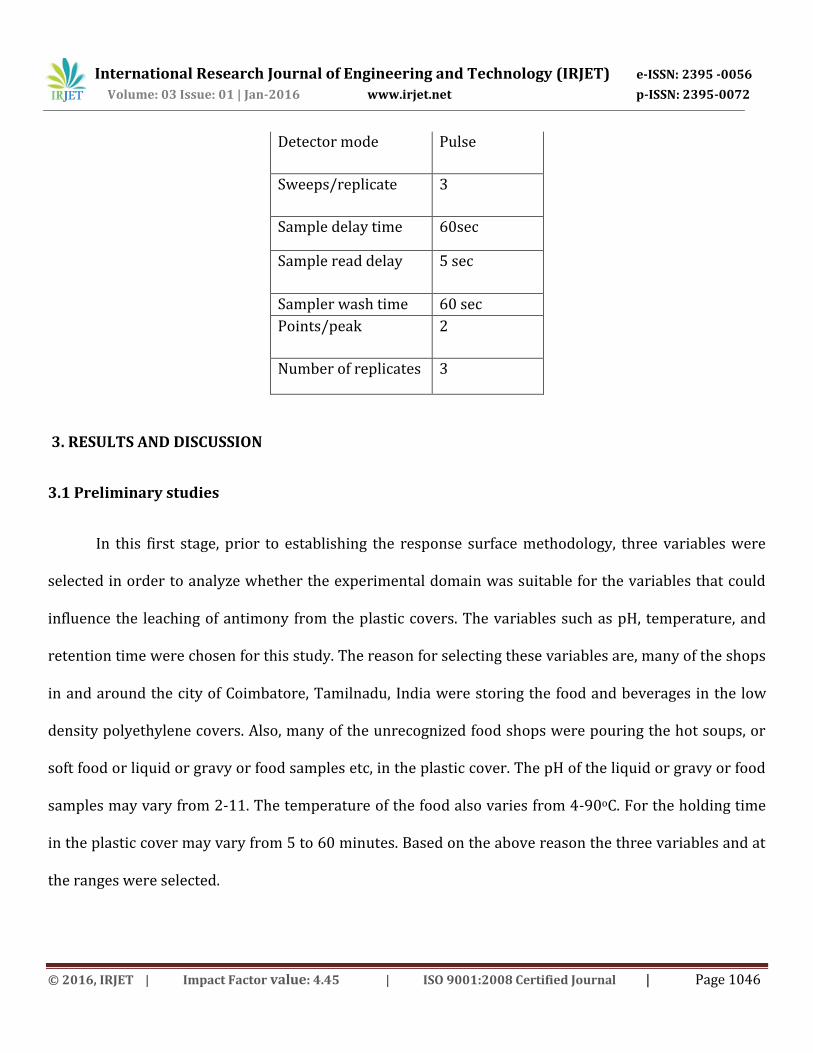
5300DV). Table 3 lists the conditions adopted for ICP-OES.
Table 3 ICP –OES instrumental conditions adopted
for the Analysis
Parameters Operation conditions
Plasma RF power 1500 W
Plasma flow 15 L/min
Nebulizer flow 0.8 L/min
Nebulizer pressure 0.8 L/min
Sample uptake rate 1.5ml/min
International Research Journal of Engineering and Technology (IRJET) e-ISSN: 2395 -0056
Volume: 03 Issue: 01 | Jan-2016 www.irjet.net p-ISSN: 2395-0072
© 2016, IRJET | Impact Factor value: 4.45 | ISO 9001:2008 Certified Journal | Page 1046
Detector mode Pulse
Sweeps/replicate 3
Sample delay time 60sec
Sample read delay 5 sec
Sampler wash time 60 sec
Points/peak 2
Number of replicates 3
3. RESULTS AND DISCUSSION
3.1 Preliminary studies
In this first stage, prior to establishing the response surface methodology, three variables were
selected in order to analyze whether the experimental domain was suitable for the variables that could
influence the leaching of antimony from the plastic covers. The variables such as pH, temperature, and
retention time were chosen for this study. The reason for selecting these variables are, many of the shops
in and around the city of Coimbatore, Tamilnadu, India were storing the food and beverages in the low
density polyethylene covers. Also, many of the unrecognized food shops were pouring the hot soups, or
soft food or liquid or gravy or food samples etc, in the plastic cover. The pH of the liquid or gravy or food
samples may vary from 2-11. The temperature of the food also varies from 4-90oC. For the holding time
in the plastic cover may vary from 5 to 60 minutes. Based on the above reason the three variables and at
the ranges were selected.
International Research Journal of Engineering and Technology (IRJET) e-ISSN: 2395 -0056
Volume: 03 Issue: 01 | Jan-2016 www.irjet.net p-ISSN: 2395-0072
© 2016, IRJET | Impact Factor value: 4.45 | ISO 9001:2008 Certified Journal | Page 1047
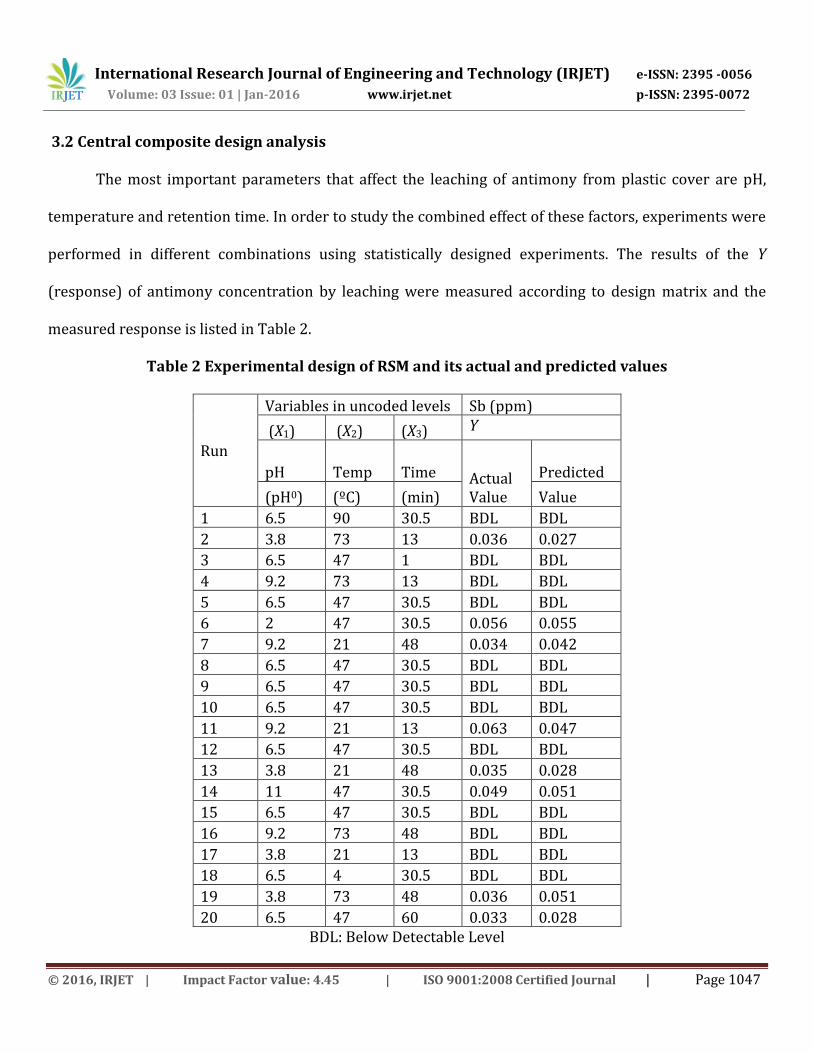
3.2 Central composite design analysis
The most important parameters that affect the leaching of antimony from plastic cover are pH,
temperature and retention time. In order to study the combined effect of these factors, experiments were
performed in different combinations using statistically designed experiments. The results of the Y
(response) of antimony concentration by leaching were measured according to design matrix and the
measured response is listed in Table 2.
Table 2 Experimental design of RSM and its actual and predicted values
Run
Variables in uncoded levels Sb (ppm)
(X1) (X2) (X3) Y
pH Temp Time Actual Value
Predicted
(pH0) (ºC) (min) Value
1 6.5 90 30.5 BDL BDL
2 3.8 73 13 0.036 0.027
3 6.5 47 1 BDL BDL
4 9.2 73 13 BDL BDL
5 6.5 47 30.5 BDL BDL
6 2 47 30.5 0.056 0.055
7 9.2 21 48 0.034 0.042
8 6.5 47 30.5 BDL BDL
9 6.5 47 30.5 BDL BDL
10 6.5 47 30.5 BDL BDL
11 9.2 21 13 0.063 0.047
12 6.5 47 30.5 BDL BDL
13 3.8 21 48 0.035 0.028
14 11 47 30.5 0.049 0.051
15 6.5 47 30.5 BDL BDL
16 9.2 73 48 BDL BDL
17 3.8 21 13 BDL BDL
18 6.5 4 30.5 BDL BDL
19 3.8 73 48 0.036 0.051
20 6.5 47 60 0.033 0.028 BDL: Below Detectable Level
International Research Journal of Engineering and Technology (IRJET) e-ISSN: 2395 -0056
Volume: 03 Issue: 01 | Jan-2016 www.irjet.net p-ISSN: 2395-0072
© 2016, IRJET | Impact Factor value: 4.45 | ISO 9001:2008 Certified Journal | Page 1048
3.3 The second-order model and analysis of variance (ANOVA)
After the evaluation of experimental results, the quadratic function for the leaching of antimony
was obtained by utilizing Design-Expert® 8.0.4 Trial software. To estimate the coefficients of the
polynomial, at least square fit procedure was applied, and then based upon the fitted surface response
analysis was performed. Analysis of the fitted surface nearly corresponded to that of the actual system if
the fitted surface was an adequate approximation of the true response function [18]. Quadratic equations
based upon the coded values, for leaching of antimony are presented in Eq. (3), i.e.,
Y (Sb ppm) = -3.380 x 10⁻⁵-1.715 x 10-3X1-4.454 x 10-3X2+4.503 x 10-3X3-0.017X1X2
-8.000 x 10-3X1X3-7.500 x 10-4X2X3+0.019X12+2.086 x 10-4X22+6.029 x 10-3X32
…(3)
The statistical importance of the generated model evaluated by the Fisher test (i.e., F-test) was
quantified by dividing the Model Mean Square by its Residual Mean Square for analysis of variance
(ANOVA). The results of ANOVA for the leaching of antimony are presented in Table 4. According to
ANOVA (Table 4), the Fisher F-values for all regressions were higher. The large value of F indicates that
most of the variation in the response can be explained by the regression equation. The associated p-value
is used to estimate whether F is large enough to indicate statistical significance. p-values lower than 0.05
indicates that the model is statistically significant [19]. The ANOVA result in the leaching of antimony in
plastic cover shows the F-value of 9.98, which implies that the terms in the model have a significant effect
on the response. The model gives the coefficient of determination, R2 value of 0.8998 and an adjusted-R2
value of 0.8097, which is high and advocates a high correlation between the observed and the predicted
values. The probability p (~0.0001) is less than 0.05 indicates that the model terms are significant at 95%
probability level.

International Research Journal of Engineering and Technology (IRJET) e-ISSN: 2395 -0056
Volume: 03 Issue: 01 | Jan-2016 www.irjet.net p-ISSN: 2395-0072
© 2016, IRJET | Impact Factor value: 4.45 | ISO 9001:2008 Certified Journal | Page 1049
Table 4 Analysis of variance (ANOVA) for the fitted quadratic model of Sb (ppm)
Source Sum of squares df
Mean square F value Prob >F
Remarks
Model 8.75E-03 9 9.72E-04 9.98 0.0006 significant
Residual 9.74E-04 10 9.74E-05
Lack of Fit 9.74E-04 5 1.95E-04
Pure Error 0 5 0
Cor Total 9.72E-03 19
R2 0.8998
R2 adj 0.8097
df degrees of freedom
Data were also analyzed to check the normality of the data by constructing a normal probability plot of
the residuals. The residuals are normally distributed if the points on the plot follow a straight line [13, 15, 20].
The actual leaching rate is the measured value for a particular run and the predicted value is evaluated
from the model. A large value of R2 does not imply that the regression model is a good one. However, R2
adj is preferred to use to determine the fit of a regression model, as it does not always increase when
variables are added. Good agreement has obtained between the predicted leaching value and the actual
experimental value. The R2 and R2adj of 0.8998 and 0.8097 respectively, indicate that the proposed model
had an adequate approximation to the actual value.
3.4 Effect of variables on antimony leaching
3.5 Effect of pH
It is always a big concern whether pH has any effect on metal contamination leaching from the
plastic covers. It has been reported that pH between 6-8 had no effect on antimony leaching from
drinking water [21]. However, it is still worth investigating whether metal leaching out could happen low
pH as well as very high pH because many fruit juices that are used in daily life, such as orange juices,
International Research Journal of Engineering and Technology (IRJET) e-ISSN: 2395 -0056
Volume: 03 Issue: 01 | Jan-2016 www.irjet.net p-ISSN: 2395-0072
© 2016, IRJET | Impact Factor value: 4.45 | ISO 9001:2008 Certified Journal | Page 1050
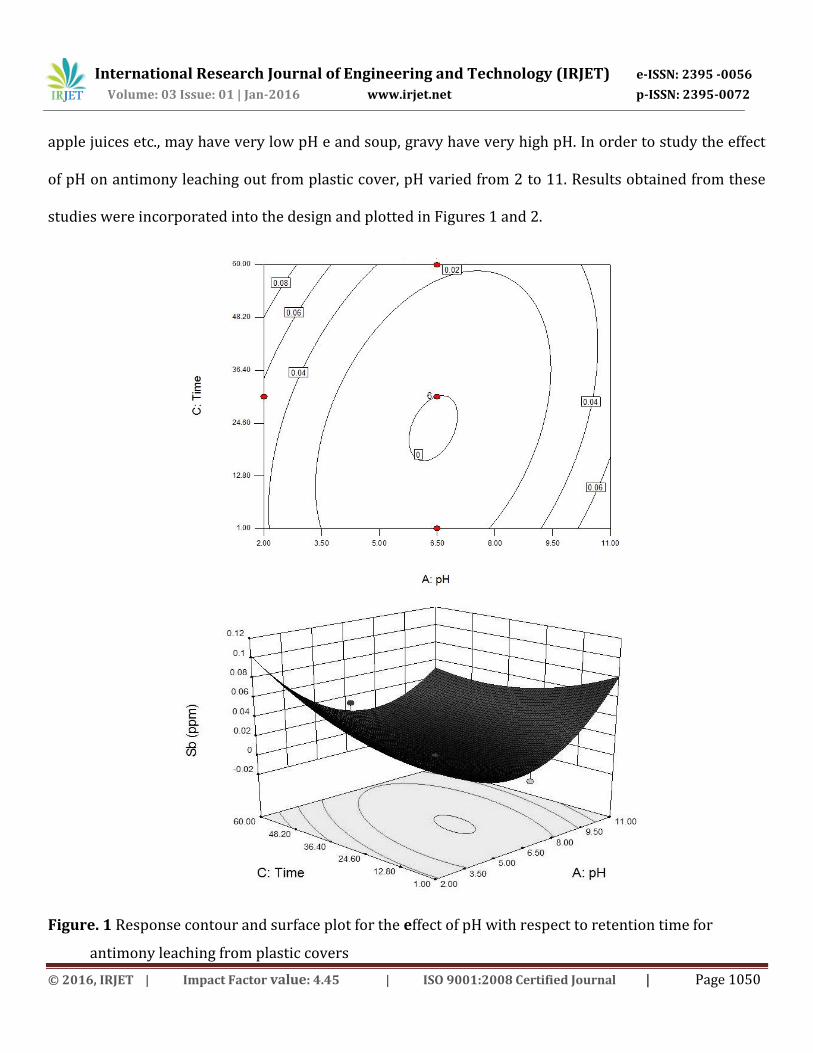
apple juices etc., may have very low pH e and soup, gravy have very high pH. In order to study the effect
of pH on antimony leaching out from plastic cover, pH varied from 2 to 11. Results obtained from these
studies were incorporated into the design and plotted in Figures 1 and 2.
Figure. 1 Response contour and surface plot for the effect of pH with respect to retention time for
antimony leaching from plastic covers
International Research Journal of Engineering and Technology (IRJET) e-ISSN: 2395 -0056
Volume: 03 Issue: 01 | Jan-2016 www.irjet.net p-ISSN: 2395-0072
© 2016, IRJET | Impact Factor value: 4.45 | ISO 9001:2008 Certified Journal | Page 1051
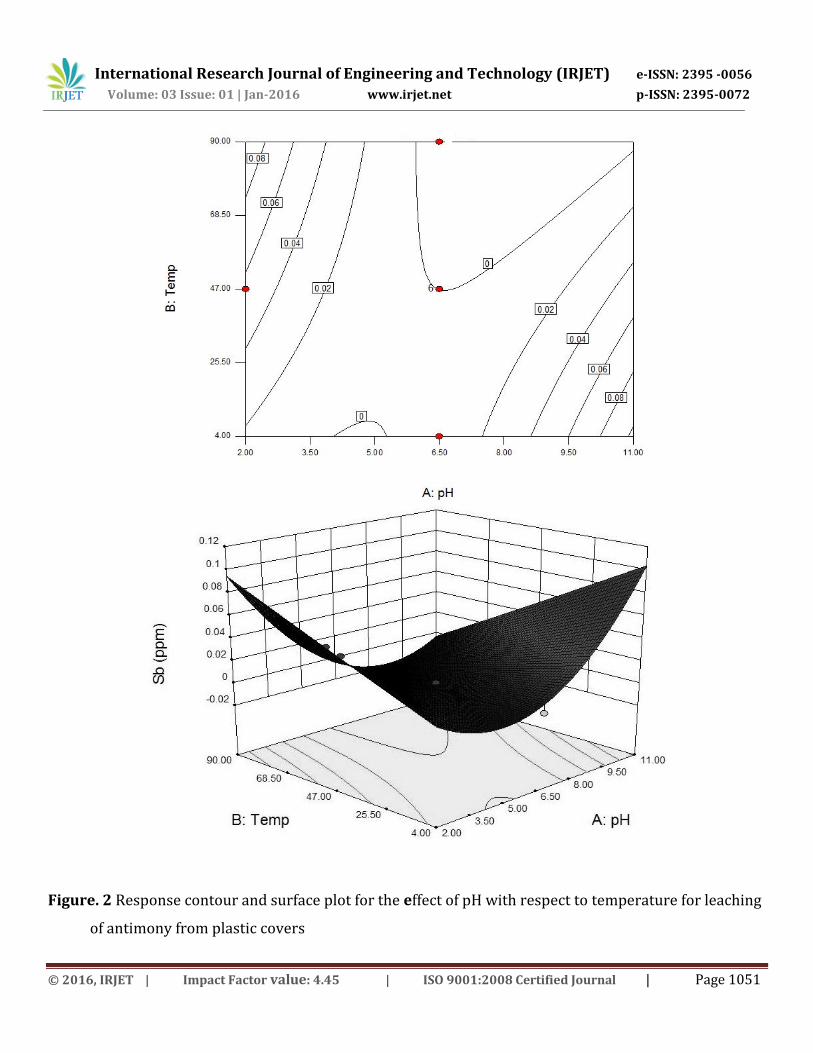
Figure. 2 Response contour and surface plot for the effect of pH with respect to temperature for leaching
of antimony from plastic covers
International Research Journal of Engineering and Technology (IRJET) e-ISSN: 2395 -0056
Volume: 03 Issue: 01 | Jan-2016 www.irjet.net p-ISSN: 2395-0072
© 2016, IRJET | Impact Factor value: 4.45 | ISO 9001:2008 Certified Journal | Page 1052
It was found that as the pH increase from acidic to neutral the leachability of antimony
concentration decreases. The concentration of antimony increases from neutral to alkaline pH. It
concludes that pH is an important variable for antimony leach out from the sample. The pH around 6-7 is
the safe level and the leach out almost below detectable limit. Many researchers have investigated that
antimony leaching from plastic PET bottles at low pH and the concentration between 0.233 and 1.967
mg/L [2, 21 ,22, 23].
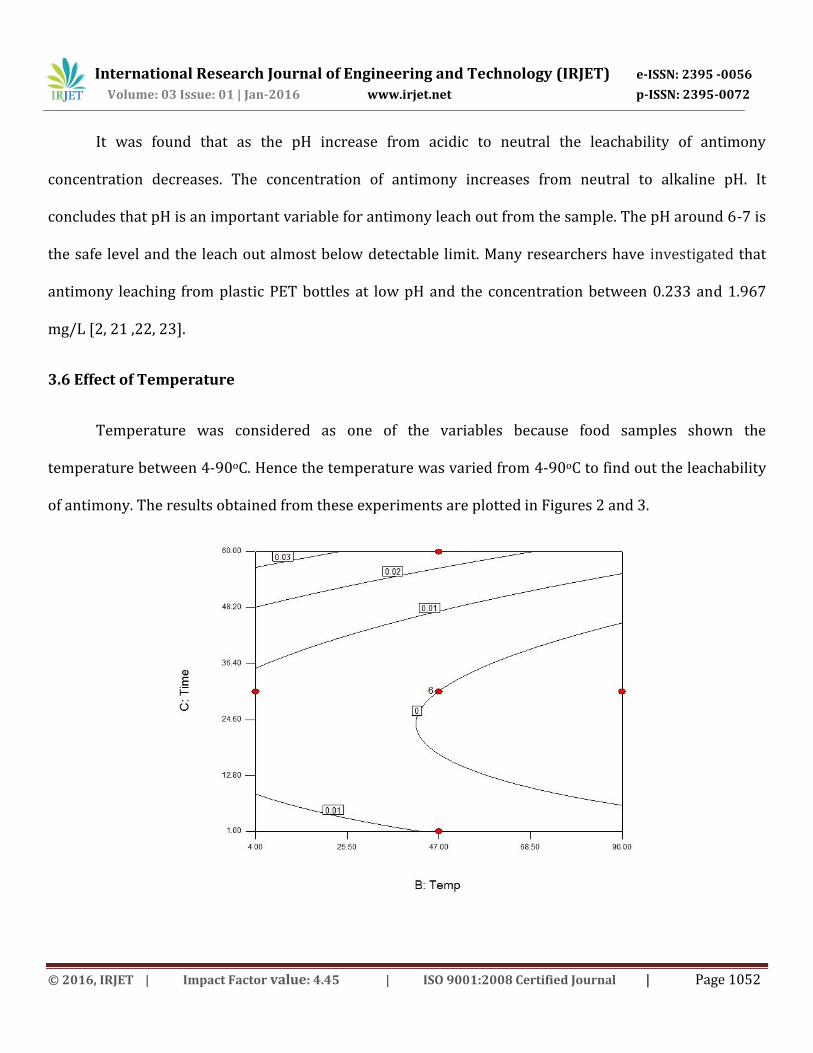
3.6 Effect of Temperature
Temperature was considered as one of the variables because food samples shown the
temperature between 4-90oC. Hence the temperature was varied from 4-90oC to find out the leachability
of antimony. The results obtained from these experiments are plotted in Figures 2 and 3.
International Research Journal of Engineering and Technology (IRJET) e-ISSN: 2395 -0056
Volume: 03 Issue: 01 | Jan-2016 www.irjet.net p-ISSN: 2395-0072
© 2016, IRJET | Impact Factor value: 4.45 | ISO 9001:2008 Certified Journal | Page 1053
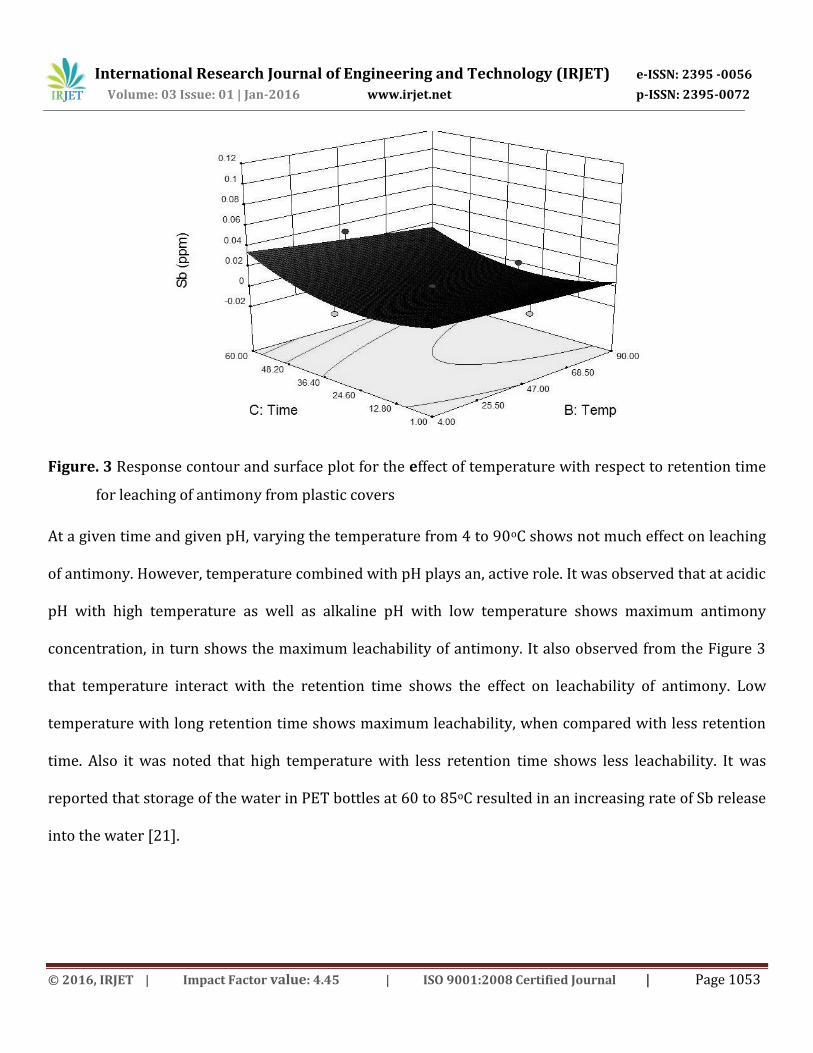
Figure. 3 Response contour and surface plot for the effect of temperature with respect to retention time
for leaching of antimony from plastic covers
At a given time and given pH, varying the temperature from 4 to 90oC shows not much effect on leaching
of antimony. However, temperature combined with pH plays an, active role. It was observed that at acidic
pH with high temperature as well as alkaline pH with low temperature shows maximum antimony
concentration, in turn shows the maximum leachability of antimony. It also observed from the Figure 3
that temperature interact with the retention time shows the effect on leachability of antimony. Low
temperature with long retention time shows maximum leachability, when compared with less retention
time. Also it was noted that high temperature with less retention time shows less leachability. It was
reported that storage of the water in PET bottles at 60 to 85oC resulted in an increasing rate of Sb release
into the water [21].
International Research Journal of Engineering and Technology (IRJET) e-ISSN: 2395 -0056
Volume: 03 Issue: 01 | Jan-2016 www.irjet.net p-ISSN: 2395-0072
© 2016, IRJET | Impact Factor value: 4.45 | ISO 9001:2008 Certified Journal | Page 1054
3.7 Effect on Time
The duration of food (or) liquid samples in the covers may vary from sample to sample (or) food
to food. Some of the food material may be eaten fast and some cannot be. So retention time in the plastic
cover may play a role for leaching of antimony. In order to find the effect of retention time on leachability
of antimony, it varied from 1 to 60 minutes. The results obtained are plotted in Figure 3. It was found that
at a given pH and Temperature, by varying retention times the leachability of antimony increases. It was
also observed that at high pH with less duration and low pH with longer duration shows maximum
leachability of antimony. Also observed that increasing retention time with increasing temperature
shows maximum leachability. Earlier investigator observed that Sb leaching from PET containers was
time and temperature dependent [21].
4. Conclusion
Experiments were conducted to investigate the factors that could potentially influence antimony
leaching from low density polyethylene covers. Experiments were designed using a statistical tool
response surface methodology. The results obtained from this study reveals that pH, temperature and
retention time, interacts with each variable enhancing the leachability of antimony from plastic covers.
Acidic pH with high temperature, alkaline pH with low temperature shows maximum leachability of
antimony from low density polyethylene covers. It is concluded that low density polyethylene covers
should be avoided for storing (or) carrying the food samples because the leaching of antimony was
confirmed.
International Research Journal of Engineering and Technology (IRJET) e-ISSN: 2395 -0056
Volume: 03 Issue: 01 | Jan-2016 www.irjet.net p-ISSN: 2395-0072
© 2016, IRJET | Impact Factor value: 4.45 | ISO 9001:2008 Certified Journal | Page 1055
REFERENCES
[1] Welle F, “Twenty years of PET bottle to bottle recycling—an overview.”Resources, Conservation and Recycling, 55(11), 865 –
875, 2011.
[2] Shotyk W, Krachle M, Chen B “Contamination of Canadian and European bottled waters with antimony from PET
containers.”Journal of Environmental Monitoring 8, 288 – 292, 2006.
[3] Duh B, “Effect of antimony catalyst on solid-state polycondensation of poly (ethylene terephthalate)”., Polymer, 43 ,3147–
54,2002.
[4]CEC (Council of the European Communities). “Council Directive Relating to the Quality of Water Intended for Human
Consumption”.80/778/EEC, 1980.
[5]USEPA. “Antimony: an Environmental and Health Effects Assessment.,” US Environmental Protection Agency, Office of
drinking water, Washington, DC, 1984.
[6] WHO “Health criteria and other supporting information”., In: Guidelines for Drinking-water Quality, second ed., 1 940–949,
1996.
[7] Werrin M Chemical food poisoning. “Association of food and drug officials.Q Bull – Hussock Food and Drug Off.”, US 27:28–
45, 1963.
[8] Schnorr TM Steenland K, Thun MJ Rinsky RA “Mortality in a cohort of antimony smelter workers”.,American Journal of
Industrial Medicine. 27, 759 –770, 1995.
[9] Jones RD “Survey of antimony workers: mortality”, 1961–1992. Occupational Environmental Medicine.51, 772 – 776, 1994.
[10] Gebel T “Arsenic and antimony: comparative approach on mechanistic toxicology”,Chemico Biological Interaction., 107 (3),
131–144, 1997.
[11] Merabet S, Robert D, Weber JV, Bouhelassa M, Benkhanouche S “Photocatalytic degradation of indole in UV/TiO2:
optimization and modelling using the response surface methodology (RSM)”, Environmental Chemistry Letters. 7, 45 – 49,
2009.
[12] Muthukumar M, Sargunamani D, Selvakumar N, & Venkata Rao, J. “Optimisation of ozone treatment for colour and COD
removal of acid dye effluent using central composite design experiment”, Dyes and Pigment, 63, 127–134, 2004.
[13] Bashir MJK, Isa MH, Kutty SRM, Zarizi Bin Awang HA, Aziz S, Mohajeri IH, Farooqi “Landfill leachate treatment by
electrochemical oxidation, Waste Management”., 29, 2534– 2541, 2009.
[14] Ranjan D, and Hasan SH “Parametric Optimization of Selenite and Selenite Biosorption Using Wheat Bran in Batch and
Continuous Mode”.,Journal of Chemical Engineering Dat A. 55, 4808 – 4816, 2010.
[15] Rajkumar K, Muthukumar M “Optimization of Electro-oxidation Process for the Treatment of Reactive Orange 107 using
Response Surface Methodology”. Environ. Sci. Pollut. Res. 19 (1), 148 – 160, 2012.
[16] Box G and Hunter WG “Statistics for experimenters: an introduction to design, data analysis, and model building”. Wiley
Interscience, 1987.
[17] Creed JT, Crockhoff CA, Martin TD “Determination of trace elements in waters and wastes by inductively coupled plasma-
Mass spectrometry”. US EPA Method 200.8, 1994.
International Research Journal of Engineering and Technology (IRJET) e-ISSN: 2395 -0056
Volume: 03 Issue: 01 | Jan-2016 www.irjet.net p-ISSN: 2395-0072
© 2016, IRJET | Impact Factor value: 4.45 | ISO 9001:2008 Certified Journal | Page 1056
[18] Montgomery DC “Design Analysis of Experiments”, 4th ed., John Wiley and Sons, USA, 1996.
[19]Segurola J, Allen NS, Edge M, Mahon AM “Design of eutectic photo initiator blends for UV/curable acrylatedprinting inks and
coatings”.Prog. Org. Coat. 37, 23 – 37, 1999.
[20] Mohajeri S, Aziza HA, Isa MH, Zahed MA, Adlan , MN “Statistical optimization of process parameters for landfill leachate
treatment using electro-Fenton technique”, Journal of Hazardous Material., 176 , 749 –758, 2010.
[21] Westerhoff P, Prapaipong P, Shoch E, Hillaireau “A Antimony leaching from Polyethylene terephthalate (PET) plastic used
for bottled drinking water”., Water Resources. 42(3), 551- 556, 2008.
[22] Fertmann R, Hentschel S, Dengler D, Janssen U, Lommel A Lead exposure by drinking water: an epidemiological study in
hamburg, Germany. “International Journal of Hygiene Environment and Health”.207, 1049 – 1061, 2004.
[23] Ahmad M, Bajahlan AS. “Leaching of styrene and other aromatic compounds in drinking water from PS bottles”, Journal of
Environmental Sciences., 19, 421-426, 2007.