optimization of chromium mixed powder edm · pdf filechandan deep singh et al optimization of...
TRANSCRIPT

International Journal of Multidisciplinary and Scientific Emerging Research
©2014 IJMSER, All Rights Reserved Available at http://www.ijmser.com/ (ISSN 2349 – 6037)
1068Int. J. of Multidisciplinary and Scientific Emerging Research, Vol.4, No.2 (May 2015)
RESEARCH ARTICLE
Optimization of Chromium Mixed Powder EDM parameters using Response
Surface Methodology for H13 Tool steel Machining
Bikramjit Singh1, Chandan Deep Singh
2, and
Jaswinder Singh3
1Research Scholar, Department of Mechanical Engineering, Punjabi University Patiala, Punjab, India, 2Assistant Professor, Department of Mechanical Engineering, Punjabi University Patiala, Punjab, India 3Assistant Professor, Department Mechanical Engineering, Lovely Professional University, India
Accepted 24 April 2015, Available online 15 May 2015, Vol.4, No.2 (May 2015)
Abstract
The increasing technological inventions like cellular phones and GPS devices, we observe increasing number of
distractions to divert the driver’s attention. This distraction has led to increasing number of accidents on road, which
brings a need of a Drowsiness Detection System that calculates various eye parameters to help the driver stay alert. This
type of system brings about alertness and accuracy in the driver towards risk and safety. This technology uses face and
eye detection methods to create a prototype which can be further developed into a software to reduce the risk of road
accidents.
Keyword: Chromium powder, MRR, TWR and Response Surface Methodology.
1. INTRODUCTION
Development of the materials like Inconel, hot hardened
steels, polycrystalline diamond, titanium, Hastalloys,
carbides etc which are electrical conductive and are very
difficult to machine by conventional methods lead the rise
of non conventional machining processes . Electrical
Discharge Machining is one of the non conventional
processes that is used widely in industries to machine such
materials. It is a thermal process that uses spark discharges
to machine electrical conductive materials regardless their
hardness. A shaped electrode or wire acts as a tool which
makes cavities or holes in the work piece. Electrically
conductive work piece is connected to one pole of pulsed
power supply and the electrode is connected to another
pole of power supply. A small gap is maintained between
electrode and work piece to provide controlled electrical
resistance in the gap. Since there is no contact between the
tool and work piece in EDM, machining problems like
mechanical stresses, chattering and vibrations does not
arise during machining. In spite of advantages of EDM,
there are disadvantages like low material removal rate and
poor surface finish which restricts its application in
industries to some extent. In order to remove these
limitations, a new technique known as Powder Mixed
EDM has been emerged for the enhancement of EDM
process capabilities [16].
In PMEDM, a suitable powder like silicon, vanadium,
titanium etc is mixed with the dielectric of EDM. Due to
the applied electric field applied, the powder particles get
energized and accelerated and become conductors and
promote breakdown in the gap and also enhance the spark
gap between the tool and the workpiece.
Figure 1: Principle of PMEDM
Powder particles formed the chain type structure and
arrange themselves in the direction of current.

Chandan Deep Singh et al Optimization of Chromium Mixed Powder EDM parameters using Response
Surface Methodology for H13 Tool steel Machining
1069| Int. J. of Multidisciplinary and Scientific Emerging Research, Vol. 4, No2 (May 2015)
This causes the bridging gap between the electrode and
workpiece, hence insulating strength of dielectric gets
reduced which lead to easy short circuiting and hence
early explosion in the gap takes place. It results in the
series of discharges under the electrode area. Due to this,
faster sparking causes the faster erosion from the
workpiece and hence MRR get increased. Addition of
powder in the dielectric enlarged the plasma which causes
the electric density to decrease and hence uniform erosion
occurs on the workpiece leading to better surface finish
along with high material removal rate [7].
2. LITERATURE REVIEW
Kansal et al., [8] performed the experiments on H-11 steel
using copper electrode. Peak current, pulse duration, duty
cycle and silicon powder concentration were taken as
input parameters while the MRR and surface roughness
were taken as performance measures. Taguchi method was
used to analyze the result. It was found that pulse duration,
powder concentration and peak current affect the MRR
and surface roughness significantly. Jaswani et al., [6]
concluded that there is an increase in MRR by 60% and
TWR by 15% by adding graphite powder in the dielectric
fluid of EDM. Furutani et al., [3] found that there is
deposition of titanium carbide layer on carbon steel with
copper electrode using titanium powder mixed dielectric.
Wu KL., et al., [25] studied the problem of powder
settling by adding a surfactant with aluminium powder in
dielectric fluid and observed that a surface roughness (Ra
value) of less than 0.2μm. This is because of more
apparent discharge distribution. It was also reported that
negative polarity of the tool resulted in better hardness of
the surface. Kansal et al., [9] found that PMEDM
technology is used in industry at very slow pace. It may be
due to large powder consumption, difficulty in operation
of dielectric interchange and higher initial cost. Singh et
al., [18] conducted an experiment on ZNC EDM machine
to study the effect of aluminium powder mixed dielectric
on machining characteristics of Hastealloy. Copper
electrode was used as a tool. Concentration and grain size
of the powder were taken as input parameters. Addition of
powder resulted in lowering TWR and improves surface
finish as well as MRR of the Hastealloy. Very small and
large size of powder particle resulted in reducing the MRR
but increasing the surface roughness of Hastealloy. %WR
decreases by using small size particles and vice versa.
Prihandana et al., [19] presented a new method that
consists of suspending micro-MoS2 that consists of
suspending micro-MoS2 powder in dielectric fluid and
using ultrasonic vibration during µ-EDM processes.
Taguchi method was used to optimize process parameters
which were concentration of micro-powder, tool electrode
material, ultrasonic vibration of the dielectric fluid and
workpiece material, to increase the MRR. It was observed
that the introduction of MoS2 micro-powder in dielectric
fluid and using ultrasonic vibration significantly increase
the MRR and improves the surface quality. Goyal et al.,
[4] used the alumimium powder mixed dielectric to study
the performance characteristics of AISI 1045 steel.
Electrical parameters namely current, voltage, pulse on
time and duty cycle remains constant while grain size and
concentration of powder were varied. Taguchi method was
employed to optimize the results. Grain size and
concentration have the significant effect on MRR and
surface roughness. Y S Wong et al., [27] studied the near
mirror finish phenomena in EDM when fine powder is
mixed with dielectric during machining of various types of
steels using different types of powder suspension at the
peak current of 1ampere. Mirror finish condition is
significantly influenced by the various factors like right
combination of workpiece material and powder
characteristics, setting of electrode polarity and pulse
parameters. It was found that the main condition required
for mirror finish is the negative electrode polarity. Singh
et al., [5] carried out a study on H 13 steel by mixing
aluminium powder of particle size 325 µmm in the
dielectric. Solid copper electrode of 8mm diameter was
used as the tool. Experimental design was based on L18
orthogonal array. Polarity, peak current, pulse on time,
duty cycle, gap voltage and powder concentration were
input parameters. ANOVA analysis was used to find the
significant factors affecting the surface roughness of H13
steel. It was found all the input parameters affect the
surface roughness. Higher peak currents produce rougher
surface in EDM process. Chow et al., [2] concluded that
addition of SiC powder in the pure water resulted in larger
expanding slit and electrode wear during micro slit EDM
of titanium alloy than those of pure water used as
dielectric for EDM. Sharma et al., [20] found that
addition of graphite powder in the dielectric and the use of
cold treated electrode are the favorable conditions for
reducing the electrode wear rate. Singh P. et al., [21]
investigate the Concentrations of aluminium powder and
grain size of powder mixed in dielectric fluid strongly
affects the machining performance of EDM process.
Sharma et al., [22] studied the effect of adding aluminium
powder in the dielectric of EDM on the performance
measures namely MRR, TWR. Powder characteristics
found to be significantly affecting the MRR and TWR.
Klocke et al., [19] figured out that addition of aluminium
and silicon powder in the dielectric during machining of
Inconel 718 alloy using tungsten electrode resulted in
causing the greater expansion of plasma channel as
compared to powder free dielectric and also changed the
thermal material removal mechanism. Tzeng et al., [23]
studied the effect of various powder characteristics by
using SKD 11 steel. Ojha et al., [17] used the chromium
powder mixed dielectric for machining EN-8 steel and
found that MRR shows increasing trend for increase in
powder concentration. TWR increases with lower range of
powder concentration but then decrease. Aggrawal A et
al., [1] found that addition of powder in dielectric resulted
in decreasing the wear of the electrode. Muniu et al., [15]
investigated the effect of adding copper, diatomite and
aluminium on MRR of mild steel using graphite electrode.
MRR increases with increase in powder concentration but
then decreases with further increase in powder
Chandan Deep Singh et al Optimization of Chromium Mixed Powder EDM parameters using Response
Surface Methodology for H13 Tool steel Machining
1070| Int. J. of Multidisciplinary and Scientific Emerging Research, Vol. 4, No2 (May 2015)
concentration. Kolahan et al., [11] used the genetic
algorithm approach to optimize the MRR and TWR of
aluminium powder mixed dielectric EDM. Kumar S et
al., [12] found that adding the manganese powder in the
dielectric causes the micro hardness of the machined
surface under the favorable conditions. Kung et al., (13)
reported that the material removal rate and electrode wear
ratio in powder mixed electrical discharge machining of
cobalt-bonded tungsten carbide by suspending aluminium
powder in dielectric fluid. They observed that the powder
particles disperses and makes the discharging energy
dispersion uniform. Vhatkar et al., [24] reported that
adding powder in the dielectric causes the MRR to
increase and reduces the surface roughness. Silicon
powder provides the best result for MRR and surface
roughness. W.S Jhao et al., [26] studied the surface
morphology using dielectric with and without powder. It
was revealed that more circular shapes with smaller
diameter are produced with powder mixed dielectric as
compared to without powder additives. Kanasl et al., [14]
tried to optimize the condition of aluminium powder
mixed EDM of Al-10%SiCP metal matrix composite using
response surface methodology. Yan BH., et al., [28]
studied the electric discharge machining with powder
suspended working media and reported that the gap length
become shorter regardless of a mixed powder with a
decrease of the pulse duration at a duty factor of 0.5.
From the literature survey, it is concluded that most of the
work is done by using Silicon, Alumimium and Zinc
powder mixed dielectric to enhance and optimize the
machining output parameters of various hard and tough
materials. Very little literature is available on chromium
powder mixed EDM. Therefore, present study is carried
out to optimize the chromium powder mixed EDM
parameters using RSM for H13 tool steel machining. H13
is selected as work material because of its wide
applications for hot punches and dies for blanking,
blending and forging, hot extrusion dies for aluminium,
cores, injector pins, nozzles for tin and lead die castings
etc.
3. EXPERIMENTATION
3.1 Experimental Setup and Material
Experiments are performed on ELEKTRA PS 35 die
sinking EDM machine. The working tank of the machine
is very large having dimensions of 850mm long 550mm
wide and 300mm high. Therefore in order to prevent the
mixing of powder with the whole dielectric fluid and to
avoid the clogging of main filter unit of the machine, a
separate tank of 300mm X 150mm X 145mm is fabricated
from the mild steel sheet of 1.5mm thick. This tank is
placed in the working tank of EDM and the machining is
performed in this tank. Fixture is placed in the tank to hold
the workpiece. Tank is filled with the EDM oil. Small
circulation pump is installed in the tank for proper
circulation of powder mixed dielectric at the discharge
gap. Two permanent is used at the bottom of machine tank
to hold the fixture during machining and to separate the
debris from the fluid. Copper electrode of 16 mm is used
as the cutting tool and H13 is used as working material.
Specimen of H13 steel are cut into rectangle shaped blocks
of 28mm X 20mm X10mm. Chemical composition of H13
steel, properties of Chromium powder and copper
electrode are shown in table 1, table 2 and table 3
respectively.
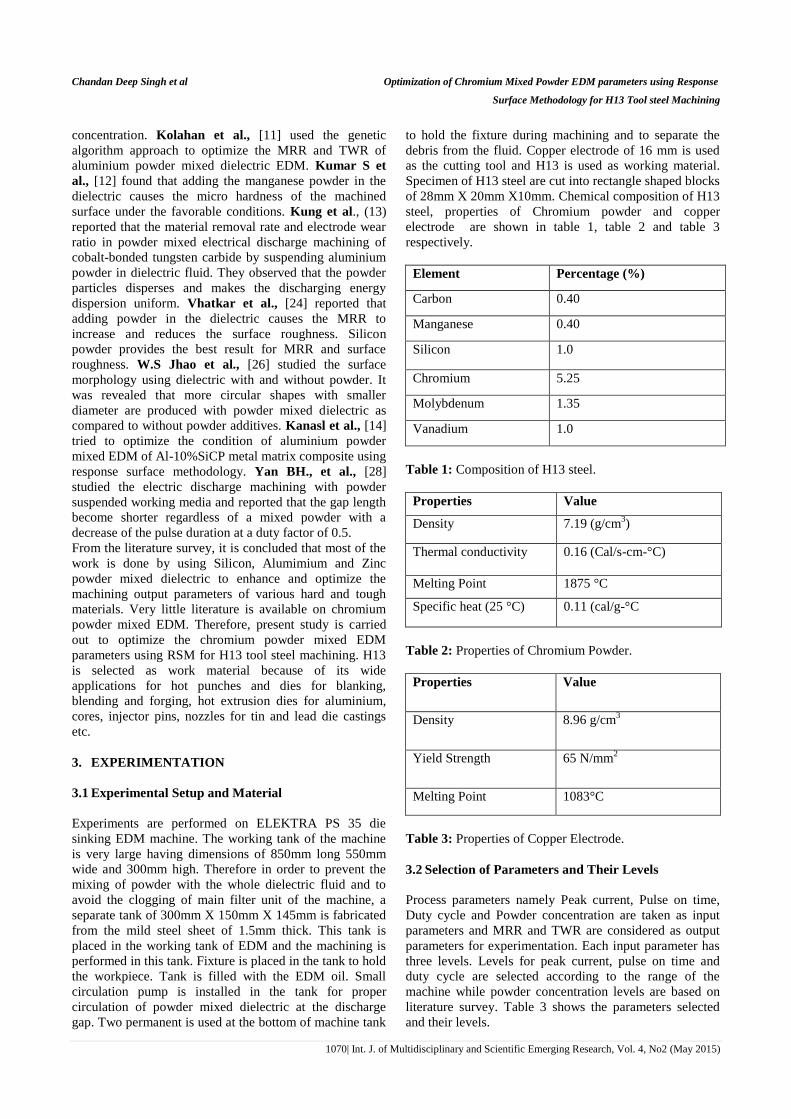
Element Percentage (%)
Carbon 0.40
Manganese 0.40
Silicon 1.0
Chromium 5.25
Molybdenum 1.35
Vanadium 1.0
Table 1: Composition of H13 steel.
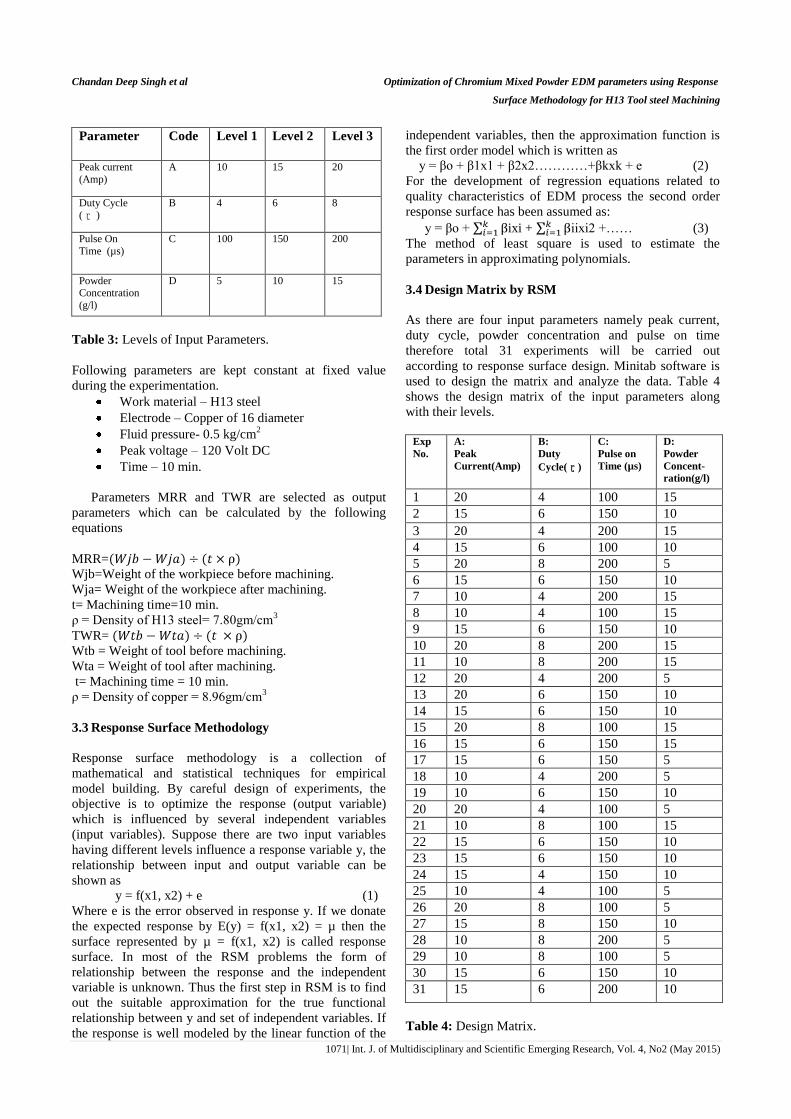
Properties Value
Density 7.19 (g/cm3)
Thermal conductivity 0.16 (Cal/s-cm-°C)
Melting Point 1875 °C
Specific heat (25 °C) 0.11 (cal/g-°C
Table 2: Properties of Chromium Powder.
Properties Value
Density 8.96 g/cm3
Yield Strength 65 N/mm2
Melting Point 1083°C
Table 3: Properties of Copper Electrode.
3.2 Selection of Parameters and Their Levels
Process parameters namely Peak current, Pulse on time,
Duty cycle and Powder concentration are taken as input
parameters and MRR and TWR are considered as output
parameters for experimentation. Each input parameter has
three levels. Levels for peak current, pulse on time and
duty cycle are selected according to the range of the
machine while powder concentration levels are based on
literature survey. Table 3 shows the parameters selected
and their levels.
Chandan Deep Singh et al Optimization of Chromium Mixed Powder EDM parameters using Response
Surface Methodology for H13 Tool steel Machining
1071| Int. J. of Multidisciplinary and Scientific Emerging Research, Vol. 4, No2 (May 2015)
Parameter Code Level 1 Level 2 Level 3
Peak current
(Amp)
A 10 15 20
Duty Cycle
( ɽ )
B 4 6 8
Pulse On
Time (µs)
C 100 150 200
Powder Concentration
(g/l)
D 5 10 15
Table 3: Levels of Input Parameters.
Following parameters are kept constant at fixed value
during the experimentation.
Work material – H13 steel
Electrode – Copper of 16 diameter
Fluid pressure- 0.5 kg/cm2
Peak voltage – 120 Volt DC
Time – 10 min.
Parameters MRR and TWR are selected as output
parameters which can be calculated by the following
equations
MRR=
Wjb=Weight of the workpiece before machining.
Wja= Weight of the workpiece after machining.
t= Machining time=10 min.
ρ = Density of H13 steel= 7.80gm/cm3
TWR=
Wtb = Weight of tool before machining.
Wta = Weight of tool after machining.
t= Machining time = 10 min.
ρ = Density of copper = 8.96gm/cm3
3.3 Response Surface Methodology
Response surface methodology is a collection of
mathematical and statistical techniques for empirical
model building. By careful design of experiments, the
objective is to optimize the response (output variable)
which is influenced by several independent variables
(input variables). Suppose there are two input variables
having different levels influence a response variable y, the
relationship between input and output variable can be
shown as
y = f(x1, x2) + e (1)
Where e is the error observed in response y. If we donate
the expected response by E(y) = f(x1, x2) = µ then the
surface represented by µ = f(x1, x2) is called response
surface. In most of the RSM problems the form of
relationship between the response and the independent
variable is unknown. Thus the first step in RSM is to find
out the suitable approximation for the true functional
relationship between y and set of independent variables. If
the response is well modeled by the linear function of the
independent variables, then the approximation function is
the first order model which is written as
y = βo + β1x1 + β2x2…………+βkxk + e (2)
For the development of regression equations related to
quality characteristics of EDM process the second order
response surface has been assumed as:
y = βo + ixi + iixi2 +…… (3)
The method of least square is used to estimate the
parameters in approximating polynomials.
3.4 Design Matrix by RSM
As there are four input parameters namely peak current,
duty cycle, powder concentration and pulse on time
therefore total 31 experiments will be carried out
according to response surface design. Minitab software is
used to design the matrix and analyze the data. Table 4
shows the design matrix of the input parameters along
with their levels.
Exp
No.
A:
Peak
Current(Amp)
B:
Duty
Cycle( ɽ )
C:
Pulse on
Time (µs)
D:
Powder
Concent-
ration(g/l)
1 20 4 100 15
2 15 6 150 10
3 20 4 200 15
4 15 6 100 10
5 20 8 200 5
6 15 6 150 10
7 10 4 200 15
8 10 4 100 15
9 15 6 150 10
10 20 8 200 15
11 10 8 200 15
12 20 4 200 5
13 20 6 150 10
14 15 6 150 10
15 20 8 100 15
16 15 6 150 15
17 15 6 150 5
18 10 4 200 5
19 10 6 150 10
20 20 4 100 5
21 10 8 100 15
22 15 6 150 10
23 15 6 150 10
24 15 4 150 10
25 10 4 100 5
26 20 8 100 5
27 15 8 150 10
28 10 8 200 5
29 10 8 100 5
30 15 6 150 10
31 15 6 200 10
Table 4: Design Matrix.
Chandan Deep Singh et al Optimization of Chromium Mixed Powder EDM parameters using Response
Surface Methodology for H13 Tool steel Machining
1072| Int. J. of Multidisciplinary and Scientific Emerging Research, Vol. 4, No2 (May 2015)
After EDM process, values of both responses are
calculated for each experiment. These values are given
below in table:
Table 5: Design Matrix.
4. RESULT ANALYSIS
ANOVA tables for both responses are used to analyze the
results. These will signify the effect of input parameters on
responses and indicates that which parameter is significant
in a particular process. It can be seen from these tables that
which input parameter affects the response parameters
In the present study Minitab software is used to generate
ANOVA tables for each response.
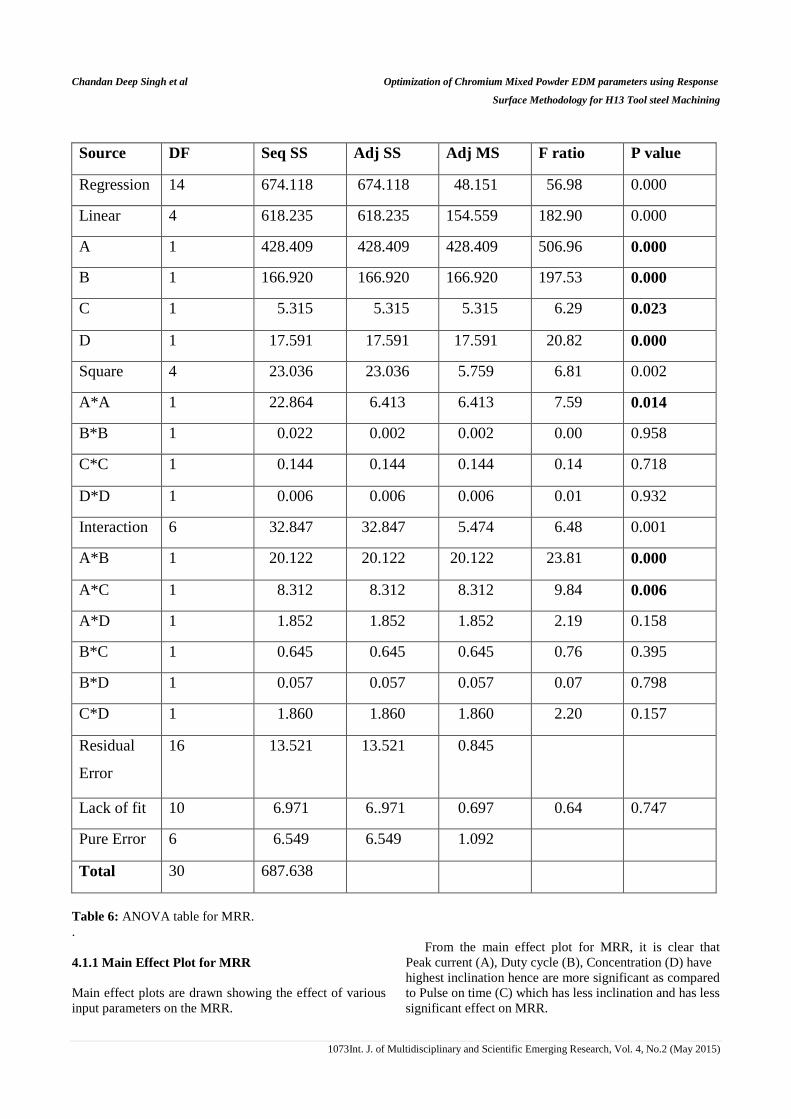
4.1 Analysis for Material Removal Rate using ANOVA:
From the above table, it was noticed that at 95% level of
confidence (p< 0.05) Peak current (A), Duty cycle (B),
Pulse on time (C) and powder concentration (D) are
significant factors and effect the MRR significantly.
Exp
No.
MRR(mm3/min) TWR(mm
3/min)
1 12.5000 1.67400
2 8.9743 0.41850
3 14.4230 0.27900
4 8.3333 0.13950
5 20.5128 1.95312
6 8.3333 0.27900
7 5.6089 0.27900
8 5.1282 0.55800
9 9.2948 0.13950
10 24.1987 0.27900
11 8.6598 0.13950
12 10.7371 0.27900
13 15.8653 0.41850
14 9.7756 0.13950
15 19.7115 1.25558
16 10.2564 0.41852
17 9.1346 0.27901
18 3.3653 0.27901
19 6.5705 0.13950
20 10.7371 1.11607
21 9.4551 0.13950
22 9.4551 0.27901
23 11.6987 0.13950
24 7.0513 0.13950
25 4.0064 0.13950
26 17.7884 0.83750
27 12.1795 0.13950
28 7.2115 0.13950
29 8.6538 0.13950
30 9.6618 0.13950
31 11.3782 0.27900
Chandan Deep Singh et al Optimization of Chromium Mixed Powder EDM parameters using Response
Surface Methodology for H13 Tool steel Machining
1073Int. J. of Multidisciplinary and Scientific Emerging Research, Vol. 4, No.2 (May 2015)
Source DF Seq SS Adj SS Adj MS F ratio P value
Regression 14 674.118 674.118 48.151 56.98 0.000
Linear 4 618.235 618.235 154.559 182.90 0.000
A 1 428.409 428.409 428.409 506.96 0.000
B 1 166.920 166.920 166.920 197.53 0.000
C 1 5.315 5.315 5.315 6.29 0.023
D 1 17.591 17.591 17.591 20.82 0.000
Square 4 23.036 23.036 5.759 6.81 0.002
A*A 1 22.864 6.413 6.413 7.59 0.014
B*B 1 0.022 0.002 0.002 0.00 0.958
C*C 1 0.144 0.144 0.144 0.14 0.718
D*D 1 0.006 0.006 0.006 0.01 0.932
Interaction 6 32.847 32.847 5.474 6.48 0.001
A*B 1 20.122 20.122 20.122 23.81 0.000
A*C 1 8.312 8.312 8.312 9.84 0.006
A*D 1 1.852 1.852 1.852 2.19 0.158
B*C 1 0.645 0.645 0.645 0.76 0.395
B*D 1 0.057 0.057 0.057 0.07 0.798
C*D 1 1.860 1.860 1.860 2.20 0.157
Residual
Error
16 13.521 13.521 0.845
Lack of fit 10 6.971 6..971 0.697 0.64 0.747
Pure Error 6 6.549 6.549 1.092
Total 30 687.638
Table 6: ANOVA table for MRR.
.
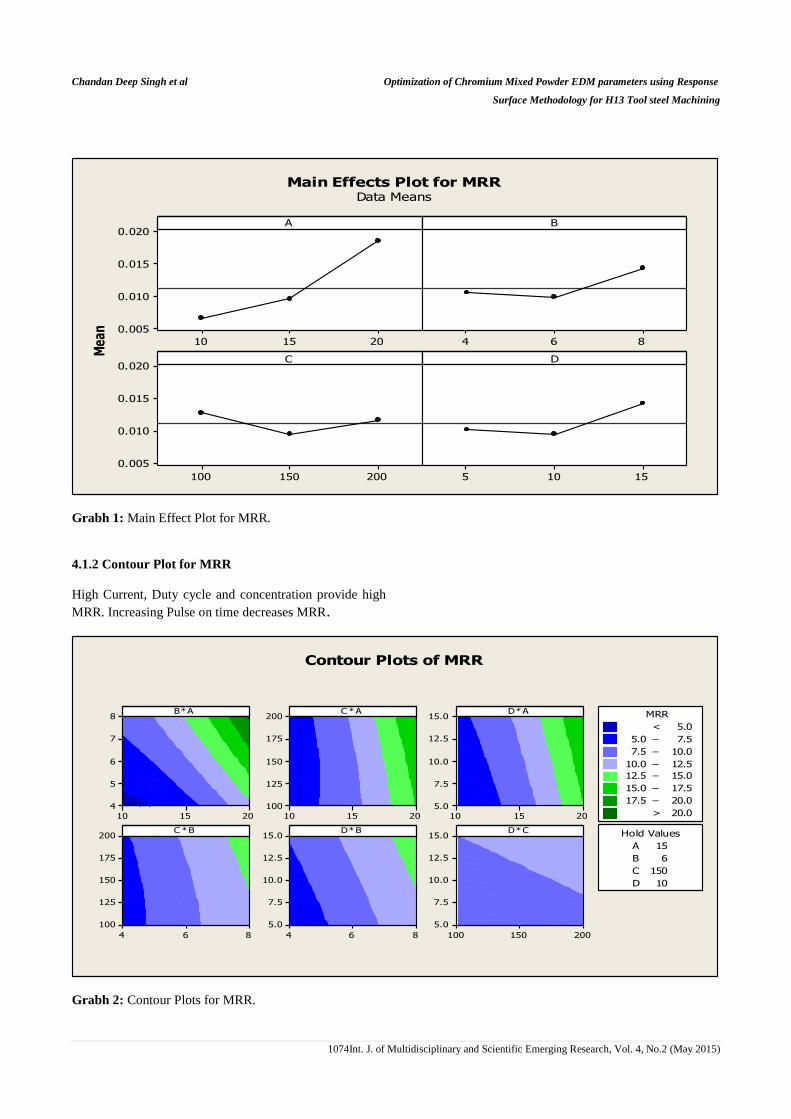
4.1.1 Main Effect Plot for MRR
Main effect plots are drawn showing the effect of various
input parameters on the MRR.
From the main effect plot for MRR, it is clear that
Peak current (A), Duty cycle (B), Concentration (D) have
highest inclination hence are more significant as compared
to Pulse on time (C) which has less inclination and has less
significant effect on MRR.
Chandan Deep Singh et al Optimization of Chromium Mixed Powder EDM parameters using Response
Surface Methodology for H13 Tool steel Machining
1074Int. J. of Multidisciplinary and Scientific Emerging Research, Vol. 4, No.2 (May 2015)
201510
0.020
0.015
0.010
0.005
864
200150100
0.020
0.015
0.010
0.005
15105
A
Mea
n
B
C D
Main Effects Plot for MRRData Means
Grabh 1: Main Effect Plot for MRR.
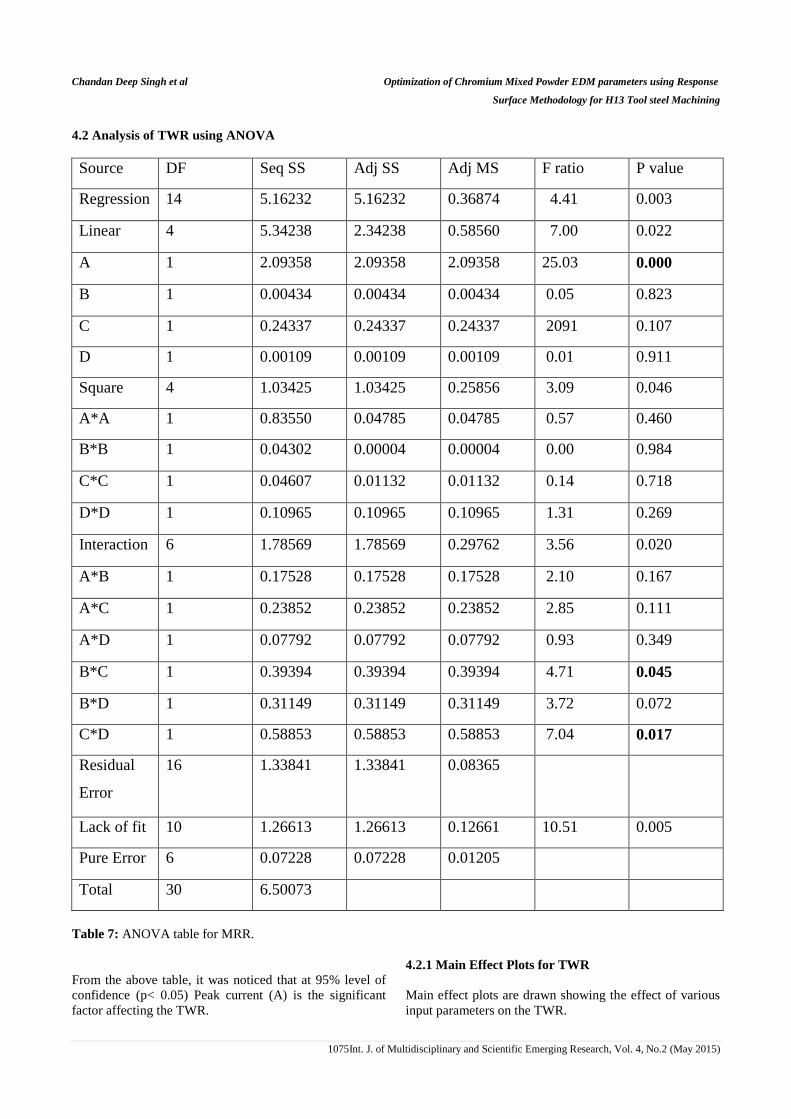
4.1.2 Contour Plot for MRR
High Current, Duty cycle and concentration provide high
MRR. Increasing Pulse on time decreases MRR.
B*A
201510
8
7
6
5
4
C *A
201510
200
175
150
125
100
D*A
201510
15.0
12.5
10.0
7.5
5.0
C *B
864
200
175
150
125
100
D*B
864
15.0
12.5
10.0
7.5
5.0
D*C
200150100
15.0
12.5
10.0
7.5
5.0
A 15
B 6
C 150
D 10
Hold Values
>
–
–
–
–
–
–
< 5.0
5.0 7.5
7.5 10.0
10.0 12.5
12.5 15.0
15.0 17.5
17.5 20.0
20.0
MRR
Contour Plots of MRR
Grabh 2: Contour Plots for MRR.
Chandan Deep Singh et al Optimization of Chromium Mixed Powder EDM parameters using Response
Surface Methodology for H13 Tool steel Machining
1075Int. J. of Multidisciplinary and Scientific Emerging Research, Vol. 4, No.2 (May 2015)
4.2 Analysis of TWR using ANOVA
Source DF Seq SS Adj SS Adj MS F ratio P value
Regression 14 5.16232 5.16232 0.36874 4.41 0.003
Linear 4 5.34238 2.34238 0.58560 7.00 0.022
A 1 2.09358 2.09358 2.09358 25.03 0.000
B 1 0.00434 0.00434 0.00434 0.05 0.823
C 1 0.24337 0.24337 0.24337 2091 0.107
D 1 0.00109 0.00109 0.00109 0.01 0.911
Square 4 1.03425 1.03425 0.25856 3.09 0.046
A*A 1 0.83550 0.04785 0.04785 0.57 0.460
B*B 1 0.04302 0.00004 0.00004 0.00 0.984
C*C 1 0.04607 0.01132 0.01132 0.14 0.718
D*D 1 0.10965 0.10965 0.10965 1.31 0.269
Interaction 6 1.78569 1.78569 0.29762 3.56 0.020
A*B 1 0.17528 0.17528 0.17528 2.10 0.167
A*C 1 0.23852 0.23852 0.23852 2.85 0.111
A*D 1 0.07792 0.07792 0.07792 0.93 0.349
B*C 1 0.39394 0.39394 0.39394 4.71 0.045
B*D 1 0.31149 0.31149 0.31149 3.72 0.072
C*D 1 0.58853 0.58853 0.58853 7.04 0.017
Residual
Error
16 1.33841 1.33841 0.08365
Lack of fit 10 1.26613 1.26613 0.12661 10.51 0.005
Pure Error 6 0.07228 0.07228 0.01205
Total 30 6.50073
Table 7: ANOVA table for MRR.
From the above table, it was noticed that at 95% level of
confidence (p< 0.05) Peak current (A) is the significant
factor affecting the TWR.
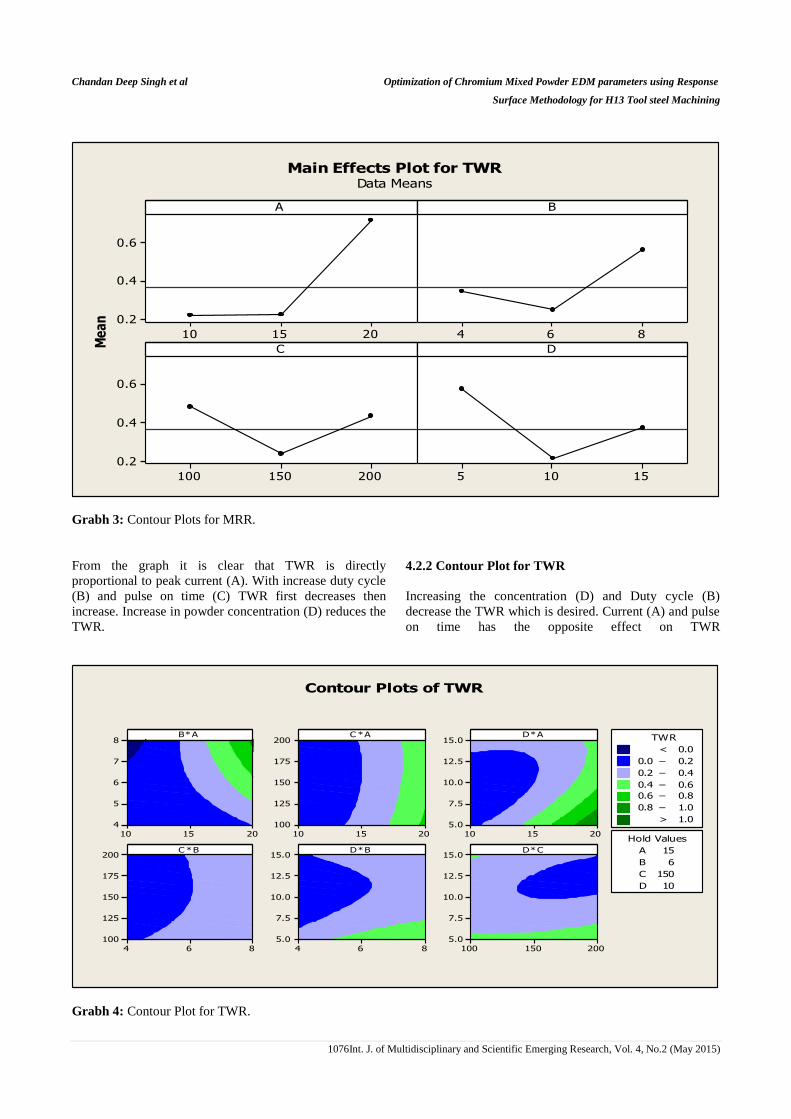
4.2.1 Main Effect Plots for TWR
Main effect plots are drawn showing the effect of various
input parameters on the TWR.
Chandan Deep Singh et al Optimization of Chromium Mixed Powder EDM parameters using Response
Surface Methodology for H13 Tool steel Machining
1076Int. J. of Multidisciplinary and Scientific Emerging Research, Vol. 4, No.2 (May 2015)
201510
0.6
0.4
0.2
864
200150100
0.6
0.4
0.2
15105
A
Me
an
B
C D
Main Effects Plot for TWRData Means
Grabh 3: Contour Plots for MRR.
From the graph it is clear that TWR is directly
proportional to peak current (A). With increase duty cycle
(B) and pulse on time (C) TWR first decreases then
increase. Increase in powder concentration (D) reduces the
TWR.
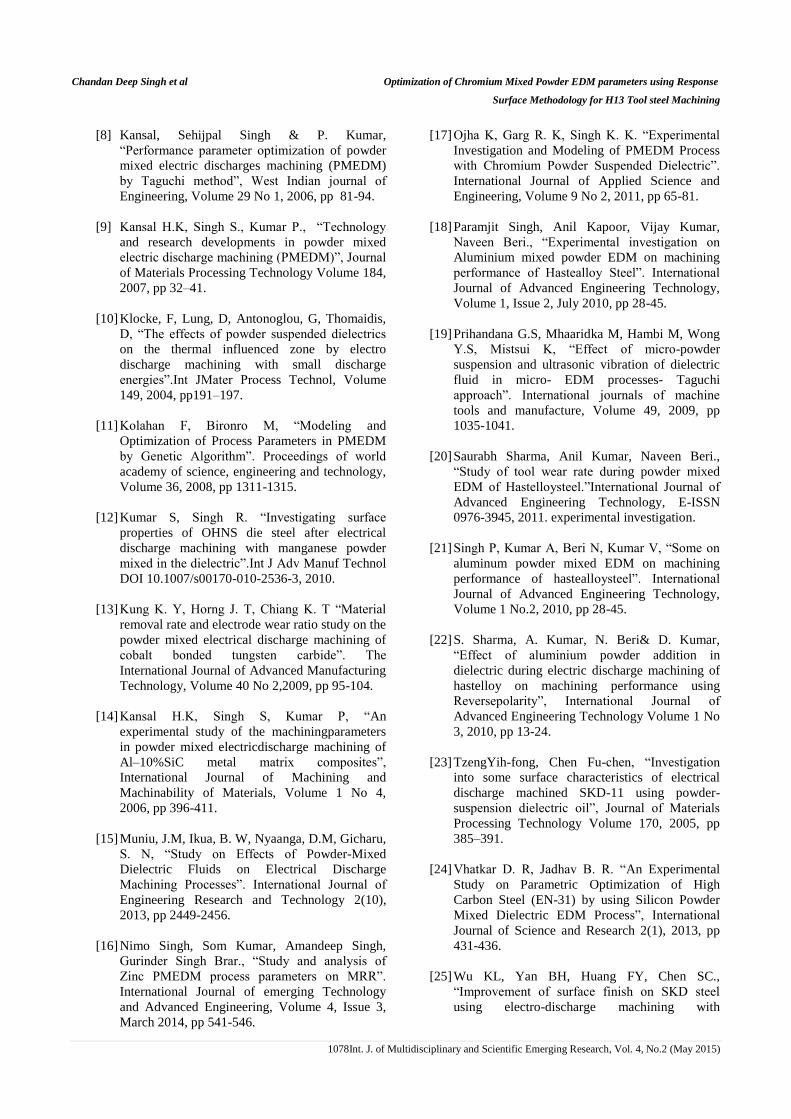
4.2.2 Contour Plot for TWR
Increasing the concentration (D) and Duty cycle (B)
decrease the TWR which is desired. Current (A) and pulse
on time has the opposite effect on TWR
B*A
201510
8
7
6
5
4
C *A
201510
200
175
150
125
100
D*A
201510
15.0
12.5
10.0
7.5
5.0
C *B
864
200
175
150
125
100
D*B
864
15.0
12.5
10.0
7.5
5.0
D*C
200150100
15.0
12.5
10.0
7.5
5.0
A 15
B 6
C 150
D 10
Hold Values
>
–
–
–
–
–
< 0.0
0.0 0.2
0.2 0.4
0.4 0.6
0.6 0.8
0.8 1.0
1.0
TWR
Contour Plots of TWR
Grabh 4: Contour Plot for TWR.

Chandan Deep Singh et al Optimization of Chromium Mixed Powder EDM parameters using Response
Surface Methodology for H13 Tool steel Machining
1077Int. J. of Multidisciplinary and Scientific Emerging Research, Vol. 4, No.2 (May 2015)
5. DESIRABILITY APPROACH FOR
OPTIMIZATION
In order to find out the optimal values of the input
variables for maximizing the MRR and minimizing the
TWR, desirability approach is used in this study.
CurHigh
Low0.92711D
Optimal
d = 1.0000
Maximum
MRR
y = 20.2224
d = 0.85952
Minimum
TWR
y = 0.3943
0.92711
Desirability
Composite
5.0
15.0
100.0
200.0
4.0
8.0
10.0
20.0B C DA
[18.2828] [8.0] [200.0] [14.9997]
Grabh 5: Optimization Plot for MRR and TWR.
From the above graph the following combinations of the
input parameters are obtained for maximizing MRR and
minimizing TWR.
MRR = 20.2224 mm3/min
TWR = 0.03943 mm3/min
Peak current (A) = 18.2888 ampere
Duty Cycle (B) = 8
Pulse on time = 200 µsec
Powder concentration (D) = 14.9997 g/l
Above results are obtained with the composite desirability
of 0.92243.
6. REGRESSION ANALYSIS
In order to establish the relationship between process
parameters and performance measures, mathematical
models are developed. Method of multiple regressions is
used to calculate the coefficient of mathematical models
MRR=20.3179-2.15212A-0.309466B-0.0834283C-
0.214804D+0.0628812A2+0.112143A*B+0.00288315A*
C (4)
TWR=0.932777-0.0563647A+0.00156912B*C-
0.191790C*D (5)
7. CONCLUSIONS
1 Peak current, duty cycle and powder
concentration are the most significant factors
affecting the MRR while pulse on time is less
significant
2 Only the peak current among the considered
parameters affect the TWR significantly.
3 Increasing current, duty cycle and powder
concentration increase the MRR while pulse on
time has less effect on MRR.
4 Higher the powder concentration in dielectric
lower will be the tool wear.
5 Increase in duty cycle and peak current causes
more TWR while pulse on time has very little
effect on TWR.
REFERENCES
[1] Agrawal, A, Dubey, A. K, Shrivastava, P.
K,“Modeling and Optimization of Tool Wear
Rate in Powder Mixed EDM of MMC”. 2nd
International Conference on Mechanical and
Robotics Engineering (ICMRE'2013) Dec. 17-18,
2013 Pattaya (Thailand).pp.1-6.
[2] Chow H.-M., Yang L.-D., Lin C.-T. & Chen Y.-
F. “The use of SiC powder in water as dielectric
for micro-slit EDM machining”, Journal of
Materials Processing Technology, Volume 195
No 3, 2008, 160-170.
[3] Furutani K, Sato H, Suzuki M., “Influence of
electrical conditions on performance of EDM
with powder suspended in working oil for
titanium carbide deposition process”.
International journal of advanced manufacturing
technology, Volume 40, Issue 11-12, February
2009, pp. 1093-1101
[4] Goyal S. & Singh R. K., “Parametric Study of
Powder Mixed EDM and Optimization of MRR
Surface Roughness”. International Journal of
Scientific Engineering and Technology, Volume
3 No 1, 2014, pp 56-62.
[5] Gurtej Singh, Paramjit Singh, Gaurav Tejpal,
Baljinder Singh., “Effect of machining
parameters on surface roughness of H13 steel in
EDM using powder mixed fluid”. International
journal of advanced engineering research and
studies, Volume 2, 2012, pp 148-150.
[6] Jeswani M.L., “Effects of addition of graphite
powder to kerosene used as the dielectric fluid
inEDM”. Wear, Volume 70, 1981, pp 133-139.
[7] Kuldeep Ojha, R.K Garg, K.K Singh, “MRR
improvement in sinking EDM”, Journal of
mineral and material characterization and
engineering, Volume 9, No 8, 2010, pp 709-739.
Chandan Deep Singh et al Optimization of Chromium Mixed Powder EDM parameters using Response
Surface Methodology for H13 Tool steel Machining
1078Int. J. of Multidisciplinary and Scientific Emerging Research, Vol. 4, No.2 (May 2015)
[8] Kansal, Sehijpal Singh & P. Kumar,
“Performance parameter optimization of powder
mixed electric discharges machining (PMEDM)
by Taguchi method”, West Indian journal of
Engineering, Volume 29 No 1, 2006, pp 81-94.
[9] Kansal H.K, Singh S., Kumar P., “Technology
and research developments in powder mixed
electric discharge machining (PMEDM)”, Journal
of Materials Processing Technology Volume 184,
2007, pp 32–41.
[10] Klocke, F, Lung, D, Antonoglou, G, Thomaidis,
D, “The effects of powder suspended dielectrics
on the thermal influenced zone by electro
discharge machining with small discharge
energies”.Int JMater Process Technol, Volume
149, 2004, pp191–197.
[11] Kolahan F, Bironro M, “Modeling and
Optimization of Process Parameters in PMEDM
by Genetic Algorithm”. Proceedings of world
academy of science, engineering and technology,
Volume 36, 2008, pp 1311-1315.
[12] Kumar S, Singh R. “Investigating surface
properties of OHNS die steel after electrical
discharge machining with manganese powder
mixed in the dielectric”.Int J Adv Manuf Technol
DOI 10.1007/s00170-010-2536-3, 2010.
[13] Kung K. Y, Horng J. T, Chiang K. T “Material
removal rate and electrode wear ratio study on the
powder mixed electrical discharge machining of
cobalt bonded tungsten carbide”. The
International Journal of Advanced Manufacturing
Technology, Volume 40 No 2,2009, pp 95-104.
[14] Kansal H.K, Singh S, Kumar P, “An
experimental study of the machiningparameters
in powder mixed electricdischarge machining of
Al–10%SiC metal matrix composites”,
International Journal of Machining and
Machinability of Materials, Volume 1 No 4,
2006, pp 396-411.
[15] Muniu, J.M, Ikua, B. W, Nyaanga, D.M, Gicharu,
S. N, “Study on Effects of Powder-Mixed
Dielectric Fluids on Electrical Discharge
Machining Processes”. International Journal of
Engineering Research and Technology 2(10),
2013, pp 2449-2456.
[16] Nimo Singh, Som Kumar, Amandeep Singh,
Gurinder Singh Brar., “Study and analysis of
Zinc PMEDM process parameters on MRR”.
International Journal of emerging Technology
and Advanced Engineering, Volume 4, Issue 3,
March 2014, pp 541-546.
[17] Ojha K, Garg R. K, Singh K. K. “Experimental
Investigation and Modeling of PMEDM Process
with Chromium Powder Suspended Dielectric”.
International Journal of Applied Science and
Engineering, Volume 9 No 2, 2011, pp 65-81.
[18] Paramjit Singh, Anil Kapoor, Vijay Kumar,
Naveen Beri., “Experimental investigation on
Aluminium mixed powder EDM on machining
performance of Hastealloy Steel”. International
Journal of Advanced Engineering Technology,
Volume 1, Issue 2, July 2010, pp 28-45.
[19] Prihandana G.S, Mhaaridka M, Hambi M, Wong
Y.S, Mistsui K, “Effect of micro-powder
suspension and ultrasonic vibration of dielectric
fluid in micro- EDM processes- Taguchi
approach”. International journals of machine
tools and manufacture, Volume 49, 2009, pp
1035-1041.
[20] Saurabh Sharma, Anil Kumar, Naveen Beri.,
“Study of tool wear rate during powder mixed
EDM of Hastelloysteel.”International Journal of
Advanced Engineering Technology, E-ISSN
0976-3945, 2011. experimental investigation.
[21] Singh P, Kumar A, Beri N, Kumar V, “Some on
aluminum powder mixed EDM on machining
performance of hastealloysteel”. International
Journal of Advanced Engineering Technology,
Volume 1 No.2, 2010, pp 28-45.
[22] S. Sharma, A. Kumar, N. Beri& D. Kumar,
“Effect of aluminium powder addition in
dielectric during electric discharge machining of
hastelloy on machining performance using
Reversepolarity”, International Journal of
Advanced Engineering Technology Volume 1 No
3, 2010, pp 13-24.
[23] TzengYih-fong, Chen Fu-chen, “Investigation
into some surface characteristics of electrical
discharge machined SKD-11 using powder-
suspension dielectric oil”, Journal of Materials
Processing Technology Volume 170, 2005, pp
385–391.
[24] Vhatkar D. R, Jadhav B. R. “An Experimental
Study on Parametric Optimization of High
Carbon Steel (EN-31) by using Silicon Powder
Mixed Dielectric EDM Process”, International
Journal of Science and Research 2(1), 2013, pp
431-436.
[25] Wu KL, Yan BH, Huang FY, Chen SC.,
“Improvement of surface finish on SKD steel
using electro-discharge machining with
Chandan Deep Singh et al Optimization of Chromium Mixed Powder EDM parameters using Response
Surface Methodology for H13 Tool steel Machining
1079Int. J. of Multidisciplinary and Scientific Emerging Research, Vol. 4, No.2 (May 2015)
aluminum and surfactant added dielectric.” Int J
Mach Tools Manuf 45, 2005, pp 1195–1201.
[26] W.S. Jhao, Q.G. Meng, Z.L. Wang, “The
application on research on powder mixed EDM in
rough machining”. Journal of material processing
Technology, Volume129, 2002, pp 30-33.
[27] Y.S Wong, L.C Lim, Iqbal Rahuman, W.M Tee,
“ Near mirror finish phenomena in EDM using
powder mixed dielectric”. Journal of material
processing technology, Volume 79, 1997, pp 30-
40.
[28] Yan BH, Lin YC, Huang FY, Wang CH,
“Surface modification of SKD 61during EDM
with metal powder in the dielectric.” Mater
Trans, Volume 42 No 12, 2001, pp 2597– 2604.