optimization of ec values of nutrient solution for tomato
TRANSCRIPT

38 ITB J. Sci Vol. 41 A. No. 1.2009.38-49
Optimization of EC Values of Nutrient Solution for Tomato Fruits Quality in Hydroponics System Using Artificial Neural Network and Genetic Algorithms
Herry Suhardiyantol, Chusnul ~ r i P & Budi I. ~etiawan'
'.Z3Department of ~gricultural Engineering. Bogor Agricultural University. Indonesia mail: hcrn;sulixdiyan~oiu.iph.ac.id
mail: chusnul ar:ir:~,ahoc>.co~n 3 Email: hudindra:$ipb.ac,id
Abstract. Total soluble solids (TSS) and fruit fresh weight are two indicatcrs to show the quality of tomato fruits. To gain high values of TSS and miit fresh \vei@C it is important to consider the concentration of nutrient solution, which is commonly represented by Electrical Conductivity (EC) value. Generally, the increasing of EC value not or~ly increases the number of TSS. but also decreases fiuit fresh weight. Therefore. it is important to optimix the EC value fbr both indicators of quality of tomato fruits. The objective of this research is to optimize the EC value of nutrient solution on each generative stage using Artiticial Neural Net\vork (ANN) and Genetic Algorithms (GA). ANN was used to identi@ the relationship between different EC value treatments with TSS value and h i t fresh wei&t. GA was applied to determine the optimal EC value in generative growth. 11-hich is divided into three stags. Results showed that the optimal EC values in the flowering stage. the fiuitin? stage and the harvesting stage wen: 1 .d mSlcm 10.2 mS/cm and 9.7 mSIcm. rcspcctively.
Keywords: arrijicial nezrral network;, generic olgoritlmi: l~vdropnics: tomato f i i t s quali~y.
*
1 Introduction
Tomato fruit quality can be determkt?d by the following parameters: soluble solid, fresh weight, fruit size, acidity, dry matter, stiffness and flavor. Soluble solids content and fiuit fiesh weight are the most important indicators for determining tomato fruits quality. Soluble solid content indicates the total solid in fresh gtomato fruit soluble in water. It is commonly represented by total soluble so& (TSS) and measured using a r e f ~ o m d e r on weight basis (% brix). Fruit fiesh weight is usually affected by its water content. The higher the weight of fiesh tomato, the higher the water content is. TSS value and h i t fresh weight are faaors related to each other. An increase value in one factor is always associated with a decrease in the other, vise-verse. Both parameters are affected by the concentration o f nutrient solution which is commonly represented by electrical conductivity (EC).
ReceivedJune 9d', 2008, Revised September 24'. 2008, Accepted for ppublication Decenlber I", 2008
Optimization of EC Values of Nutrient Solution 39
Previous studies showed that increasing the concentration of nutrient solution could improve tomato fruit quality by the increase in the number of TSS [I-41. Unfortunately, as described above, the fruit fresh weight would be decreased [S]. However, excessively his11 EC value of nutrient solution was a s d e d with poor plant growth. When it was too low, plant growth was stunted from lack of fertilizer [6]. Therefore, it is important to determine the optimum EC value in order to produce tomato fruit with high TSS value and high h i t fiesh weight. Accordingly, tomato fruit can be produced with hi& quality and economic value as desired.
This experiment was conducted with the objective to optimize the EC value in tomato crop cultivation. It was important to identify the relationships between different treatments of EC values and both TSS value as well as h i t fiesh weight. Since it was difficult to explain those relationships in mathematical models due to the complexity of the physical and physiological processes involved, another approach was used. Artificial Neural Network (ANN) program is usually suitable for use in dealing with complex systems, such as cultivation system, than that of traditional mathematical methods [7]. ANN has the capability to identify an unknown complex dynamic system [8]. The benefits of using ANN program treatments are due to first its massively parallel distributed structure, and second, its ability to learn and therefore generalize [9]. In addition to the ANN program, Genetic Algorithms (GA) as a powerful tool for use in an optimization process was also used. GA is a combinatorial optimization technique capable of dealing with a complex objective function and simulates the biological evolutionary process based on crossover and mutation in genetics [I 01. b
2 Materials and ~ e t h o d *
2.1 Experimental Set Up %'::.:
The experiment was conducted in a hydroponics system inside a greenhouse located in Agricultural and Forestry ResWch Center, University of Tsukuba. The study was focused to gain high TSS value and h i t fresh weight oftomato fruits. Therefore, the optimization process was conducted only in the gnerative growth phase.
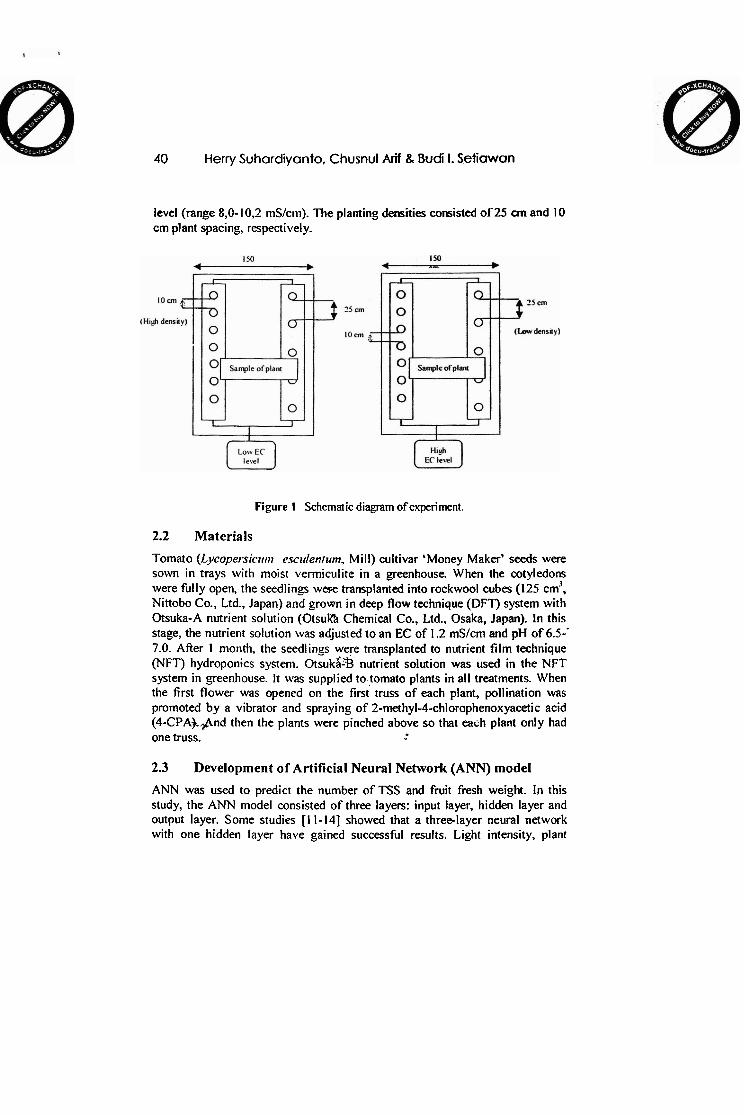
The generative growth was divided into three stages; (I) flowering, (2) fiuiting (3) harvesting. In all stages, the treatments were consisted of two different EC values and two different planting densities (Figure I). Therefore, there were four patterns of treatments in this experiment. Morimoto et al., [l I ] found that three or more data sets were necessary for identification using ANN. The EC value treatments consisted of low EC level (range 1,2-2,4 mSIcm) and high EC
40 Herry Suhardiyanto, Chusnul Arif & Bud I. Setiawan
level (range 8,O- 10,2 mS1cm). The planting densities consisted of 25 cm and 10 cm plant spacing, respective1 y.
Figure I Schematic diagram of experiment.
2.2 Materials
Tomato (Lycopersictrnt esczrlen~zon, Mill) cultivar 'Money Maker' seeds were sown in trays with moist vermiculite in a greenhouse. When the cotyledons were fully open, the seedling wex transplanted into rockwool cubes (125 cm3, Nittobo CO., Ltd., Japan) and grown in deep flow technique (DFT) system with Otsuka-A nutrient solution (Otsub Chemical Co., Ltd., Osaka, Japan). In this stage, the nutrient solution was adjusted to an Ee of 1.2 mSIcm and pH of 6.5-- 7.0. After 1 month, the seedlings were transplanted to nutrient film technique (NFT) hydroponics system. ~tsuka-I3 nutrient solution was used in the NFT system in greenhouse. It \\.as supplied to tomato plants in all treatments. When the first flower was opened on the first truss of each plant, pollination was promoted by a vibrator and spraying of 2-methyl-4-chlorophenoxyacetic acid (4-CPA).@nd then the plants were pinched above so that e a ~ h plant only had one truss.
2.3 Development of Artificial Neural Network (ANN) model
ANN was used to predict the number of TSS and fruit fresh weight. In this study, the ANN model consisted of three layers: input layer, hidden layer and output layer. Sonie studies [ I 1-14] showed that a threelayer neural network with one hidden layer have gained successful results. Light intensity, plant

Optimization of EC Values of Nutrient Solution 4 1
spacing, EC value in flowering stage (EC,), EC value in fiuiting stage (EC3 and EC value in harvesting stage (EC,) were inputted, while TSS value and h i t fresh weight were used as the value of the output layer (Figure 2).
Light inlcnsny (pmol)
Plam spac-8 lcml
EC, t mSlcm)
ECZ (mS;cm)
ECr ImSscm)
Figure 2 S t ~ u u r r of ANN model.
Back-propagation was used as the learning method, which is composed of two procedures: feed-forward and back-propagation weight trainings. A sigmoid function was selected as the activation hnction for both hidden layer and output layer. This function has a lengthy history in neural network applications [IS], which is given b y
I f (ner) =
a
I + e -Ix" " where,
I1
net = C xl rv,
xi, M:., n are the inputs, weights and number of inputs, respectively.
The dataw&imples were divided into two data sets, a training data set and a testing data set. A training data set was used for training the neural network, and a testing data set was used for evaluating the accuracy of the identified model. This type of model validation was called "cross-validation" [16]. The total a training data set was 65% of all data. The training process resulted weight values of the ANN model for the relationship between input and output parameters. All variables were normalized between 0 and 1, using fixed minimum and maximum values both in training and testing processes.

42 H e n y Suhardiyanto, Chusnul Aiif 8, Budi I. Setiawan
2.4 Development of Genetic Algorithms (GA) model
GA was used to determine the optimal EC value in flowering, fruiting and harvesting stages. The optimization process was done separately with the ANN model development. The weight values from ANN training were used as input for GA model to predict TSS and fiuit fiesh weight Also, EC values (EC,, EC?, and EC3) were used as input for GA model. The EC values were determined through searching method in GA model.
The objective hnction was given by the sum of the average value o f TSS and fruit fresh wei&t on each stage (Equation 3). The problem of this summation was the different units of TSS value and h i t fiesh weight. To avoid the problem, both parameters were normalized between 0.2 and 0.8.
Maximize ~ E C I , EC2, EC3)
where
F(ECI, EC2, EC3) : function of nutrient concentration, dimensionless. TSS : Total soluble solid (%) W : Fruit fresh weight (g) nr : number of plants n : number of treatments
In order to employ GA, individml, fitness and GA operators were defined as follows:
Definition o f the individual: .* :'
In the GA optimization, an individual represented a candidate for the optimal solution. In this problem, the optimal EC value in flowering, fiuiting and harvesting stages were determined. Therefore, the three optimal vdu-y o f nutrient concentration, ECI, EC2, EC3 represented an individual and each EC representative was coded gs six-bit binary string. As an illustration, an individual was given as follow:
Individual = ECI, EC2, EC3 = 01 1000, 101 001,001 010 (binary string) = 4.52,7.40,3.30 (decimal values)
A set of individual was called a population. They evolved toward better solution. GA worked with a population involving many individuals.

Optimization of EC Values of Nutrient Solution 43
2. Fitness function: Fitness function was an indicator to show the quality of an individual. All of individuals in population were evaluated in terms of their performances by this function. The higher fitness functions of an individual, the better the ability to survive. In this problem, i.e., maximizing problem, fitness function was given as samas objective function(Equation 3). .
3. GA operators The main operators were m o v e r and mutation. Crossover combined features h r n two individuals based on crossover rate (PC). It operated by swapping comsponding component in the binary strings representing an individual. Here, one-point crossover was used in each parameter of EC. Mutation inverted one or more bits binary string (also called gene) in each individual based on mutation rate from 0 to 1 or 1 to 0.
Figure 3 Flowchart ofoptimization process using GA.
* ~rocedure% of optimization using GA can be sgen in Figure 3 and could be hrther explained as follows:
a) An initial population consisting of ten individuals was generated at random.
b) The fitness values of all individuals were calculated using Equation 3.

44 Herry Suhardiyanto, Chusnul Arif & Budi I. S e t i a w a n
c) The performance of each individual was evaluated using the elitism strategy, i.e., 60% of all individuals with highest performance was selected and retained for next generation.
d) Crossover and mutation operations were applied to the selected individuals.
e) The new population was created. 9 Steps (b) to (d) were repeated until the required generation number
achieved. An optimal value was given as an individual with highest fitness.
3 Results and Discussion
3.1 Identification Process by using ANN
The training process was carried out using the following ANN parameters: learning rate = 0.6, momentum value = 0.6 with total iteration of 1000 and seven nodes of hidden layer. Figure 4 shows the identification results in .the response of TSS value and h i t fresh weight to the EC values, plant spacing and light intensity. The data used in the test was independent from the training data.
5 6 7 8 Measured of TSS value (X)
Figure4 Comparison between measured data and predicted data by ANN modds;A: TSS value: B: h i t fresh weight.
It can be seen in Figure 4 that the coefficients of determination (R~) values for TSS value and fruit fresh weight are 0.91 85 and 0.6366, respectively. Overall, it was found that the predicted data were closely related to measured data. This result means that a reliable computational model could be obtained for predicting TSS value and Fruit fiesh weight. \

Opfimization of EC Values of Nutrient Solution 45
3.2 Optimim tion Process by using G A
As explained in the previous section, GA was used to determine the optimal EC value in flowering (ECI), fiuiting (EC2) and harvesting (EC3) stages. GA searched the optimal EC value by interval 1.4 5 ECI 5 9.6; 2,2 5 EC2 5 10.2; 2-15 EC3 5 9.7 mS/an. GA operators (crossover and mutation rate) are important fiuor for the algorithm tb perform the optimization satisfsctorily. The crossover rate (PC) was selected to be 0.6, while mutation rate (Prn) was selected to be 0.05, respectively. By those values, expectedly, both the diversity of individuals a d a global optimum can be reached.
Figure 5 shows the evolution curves during the search for an optimal value of the timess. The fitness value increased sharply from the first to 121h generation and reached the maximum value at 22* generation. From 121b to 22"d generation, the fimess value increased gradually from 1.0563 to 1.0604. After 22* generation, the fitness value reached its constant value (1.0604).
Gene.ption number . ..
Figure 5 Evolution curves in searching for an optimal value of fitness fmction.

46 H e n y Suhardiyanto, Chusnul Arif 8, Budi 1. Seiiawan
Generation number
Figure6 Evaluation curves in searching the optimal EC values on each generative gro\rth st-.
Figure 6 shows the evolution curves during the search for the optimal EC values on each generative stage. GA optimizer recommended maintaining a markedly lower level (1.4 mSfcm) at flowering stage (EC,), and a slightly high level at both fiuiting and harvesting stag,es. The optimal EC values were 10.2 and 9.7 rnS/cm at the fruiting and harvestjng stage, respectively. in hydroponics system, it is known that the concentration of nutrient solution is one of the most important control factors for adjusting the balance between the vegetative and generative growth [17]. In the y98etative growth, as explained previously, plants focus on the development of root, stem and leaf. Therefore, maximum water uptake by root is needed. Howevei., the low EC value is essential for the plants. The flowering stage is the first stage afler vegetative stage. In this stage, the low EC value could be effective in suppressing the excessive vegetative growthqmn the other hand, the high EC value in the fruiting and harvesting stages appears to be useful in accelerating geierative growth. By this reason, however, the result ofGA optimization clearly maximized fitness.

Optimization of EC Values of Nutn'ent Solufion 47
7.0 / I
0 5 10 15 20 25 30
Generation number
Generation number
Figure 7 The estimated TSS value and fiuit fresh weight to the optimal EC value. i.,. , .. .
Figure 7 shows the estimated TSS value and fiuit fresh weight results calculated through the simulation using ANN model. The upper figure is the estimated TSS valy~oftomato fruit. The lower figure is the estimated h i t k h weight of tomato fruit. By the optimal EC value, it was estimated that the results of TSS value and h i t fresh weisht were 7.9% and 5 1.34 g, respectively. These results indicated good quality of tomato fruit suitable to be produced.

48 Herry Suhardiyanto, Chusnul Arif 8, Bud I. Setiawan
4 Conclusion
A computer program for optimization of EC values of nutrient solution on hydroponics system was developed using Artificial Neural Network (ANN) and Genetic Algorithms (GA). ANN was used to identify the relationship between differences EC value treatments with TSS value and fiuit fresh weigllt. GA was applied to determine the optimal EC value. The ANN model consisted of three layers with seven nodes of hidden layers. The results indicated that the predicted data were closely related to measured data. GA model successfidly searched the optimal EC values in flowering, fruiting and harvesting stages that were for 1.4 mSlcm, 10.2 mS/cm and 9.7 mSIcm, respective1 y.
References
Adams, P. & Ho, L.C., E ~ p c t of constant and.fluchrating salinity on yield qualip and calcitrnl statrrs of tomatoes, J. Hort. Sci., 64, pp. 725-732, 1989. Adams, P., Ef,ct of increasing the salinify ofthe nrrtrienr solzrtion with major nzitrienrs or sodizrm chloride on the yield, qualify and compmition of tomatoes gro?cln in rockwool, J. Hort. Sci ., 66, pp. 20 1 - 207, 1991. S a n c h e ~ A. RI Romero-Aranda, R., Cuartero, J., Plant water uptrrke and ivater use eJJciency of greenhouse tomato czrltivurs irrigated ~trith saline water- Agric. Water Management, 78, pp. 54-66,2005. Saito, T., Fukuda, Naoya & Nishimura, Shigeo, Efect of SaIiniV Treattlienr Dzrration and Plantir~g Density on Size and Sugar Content of Hydr.opotiical!~. Gr-cntv~ Tonlaro Fixits. Journal Japan, Soc Hort. Sci., 75 ( 9 , pp. 392-398: 2006. "
Li, Y. L., Stanghellini, C. $ Challa, H., E B c t qf electrical conductivify and rranspirarion on prodzrcrion of greenhouse lomato (Lycopersimm esculenrzrni L.), Sci. Hort, 88, pp. 1 1-29,200 1. Whipker. B. E. & Cavins, .Todd J., Electrical Condzrctivity KC): Unit and Con~zrsiorzs, NCSU Floriculture Research Report 002. http:!~w~~~v.ca.ncs~1~edi1/depts~I~ortifl01'i~~It~relFIore~~EC9~61OC0nvmio &f. December 2000. Hashimoto, Y.. Application artiificial neural nenvork and genetic iflgorithnis to agriculhrral systems, computer and Electronics in Agriculture, (1 8). pp. 7 1-72, 1997. Pur\var. S.I.N. Kar & J ha, A.N.. On-line systeni identification ofcomplex systeni zrsirig Ciiebyshev netiral networks, Applied Soft Computing, (7). pp. 364-372? 2007. Nugoho, A. Satrio, Inforntation Analysis Using Sqfi Comprring - The Applicatioris to Character Recognition, Meteorological Prediction and

Optimization of EC Values of Nutrient Solution 49
Bioinformatic Problems, PhD Dimtion, Nagoya Institute of Technology, Nagoya, Japan, pp. 12,2003.
[ I 01 Goldberg D.E., Genetic Algorithms in Seorch, Optimiiati~n, and Machine Learning, Addison-Wesley, Reading, Massachusetts, pp. 412, 1989.
[I 11 Morimoto, T., Purwanto, W., Suzuki, J. & Hashimoto, Y., Oplimization of heat trearment for f i u i ~ during srorage Itsing neural nenvork and genetic algorithms, Computers and electronics in agriculture, (1 9), pp. 87 - 101, 1997.
[ I 21 Linker, R, & Seginer, 1. & Gutrnan, P.0, Optimal C02 contml in a greenhouse modeled with neural nebvonks, Computers and electronics in agriculture, (1 9), pp. 289-3 10, 1998.
[I31 Kondo, N., Ahrnad, Usrnan, Monta, Mitsuji & Murase, Haruhiko, Machine vision based quality evaluafion of lyokan orange fruit using neural nenrrorks, Computers and electronics in agriculture, (29), 135- 147, 2000.
[I41 Qiao, J, Wang, N., Ngadi, M.O. & Kazemi, S., Predicting mechanical properlies of-fr-ied chicken nuggets using image processing and neural nenvork technique, Journal of Food Engineering (79), pp. 1065 - 1070, 2007.
[I 51 Kros, John F., Lin, Mike & L. Brown, Marvin, Effect ofneural network s- Sigtnoidfirnction on KDD in the presence of imprecise data, Computer & Operation Research, (33). 3 136-3 149,2006.
[I61 Morimoto. T. & Y. Hashimoto, A1 approaches to identification and control of rota1 plalit prodziclion systems, Control Engineering Practice, (8), 555-567.2000. "
[I 71 Ehret, D. & Ho, L.C., Effecis of osmotic potential in nutrient solution on diurnal groi1?/7 oftontato.fr7rit, Journal of Experimental Botany 37(182), pp. 1294-1 302, 1986.

Education of Agricultural Technology for Improving Food Security
of Kinship Groups in Jayawijaya Regency, Irian Jaya, Indonesia
;.fg m-f*=-Fm- Bogor Agricultural University, Indonesia
1. Introduction
In remote rural areas of Jayawijaya Regency, Irian Jaya, Indonesia, food security problems are
crucial because of died toll occurred in 1997 during prolonged dry season. Similar disaster should be
avoided eventhough the same unfortunate season occurred. Education of agricultural technology has
been performed based on local needs to improve food security of kinship groups in the regency. The
primary value of cooperation among the members in a kinship group should be a significant force in
formation of an agricultural cooperative. Empowerment efforts has been done to integrate education
of agricultural technology with the primary value. This paper describes these efforts as a model of
education of agricultural technology in early stage of development of agricultural cooperative.
2. Jayawijaya Regency
Geographically, Jayawijaya Regency is located in 3'20' to 5'12' south latitude and 137'19' to
141' east longitude. It is located in the central highlands of Irian Jaya Island. The altitude of the
regency is in the range of 1400 to 2200 m above sea level. Administratively, Jayawijaya Regency is
consisted of 28 districts, which are divided into 571 villages and 6 urban villages. Total area of the
regency is 52916 square km, with total population of 465800';t accounts for the density of 8.8 per
square km. Average annual population growth has been 3.2 %.
In the regency, peoples belong to Dhani and Lani tribes. The typical culture of them is highlanders.
They are not willing to leave the hill where they live because the bodies of their ancestors had been
buried in the hill. This causes very hard difficulty in providing health, education, or any other service
for them. Agriculture has close links to people's perceptions of society. Land is not owned
individually, nor is it always clear which group of people has a claim. Land is controlled by the
patrilineage, which grants use rights to its members. The overall right to grant the use rights rest with
the lineage chief. However, the decision to open new garden land requires deliberation of all members
of a particular kinship group who have acquired use rights through common descent or marriage
affiliation. The garden site is divided among the cultivators according to the number of wives of each

male shareholder. The borders of each plot are indicated by trees and stones. Particularly, swine
established the exchange of women between kinship groups through marriage arrangements.
The regency is affected by humid tropical climate with high temperature and high relative
humidity. The average temperature has been reported as 19.3 "C, while the maximum and minimum
figures have been reported as 25.6 and 14.5 OC, respectively. The average relative humidity has been
86 %. The average monthly precipitation has been reported as 125 to 165 mm, with the average rainy
day of 16 per month.
Sweet potato is the all-pervading crop. There are more than 60 cultivars of Ipornoea in the
regency. For baby food, sweet and soft cultivars with a colored flesh are preferred. The cultivars fed
to swine are big and fibrous. Its are for humans during food shortages only (Schneider et. al., 1993).
Other crops appear mostly in mixed cultivation with sweet potato, which is present in most fields.
Traditionally, the main source of carbohydrate for daily menu of the peoples in Jayawijaya Regency is
sweet potato. As can be seen in Table 1, about 82 % of the agricultural land in Jayawijaya Regency
are covered with sweet potatoes.
Table 1. Cultivation area, harvest area, productivity, and production of crops in Jayawijaya Regency, 1998.
Cultivation I Harvest area I Totaa!od. I I area @a) (ha)
sweet potatoes I 50 866 1 48 831 1 8.06 1 393 624.52 / Wet land paddy I 351 1 34.0 1 3.23 1 1 098.00 1 Dry land paddy I 51 1 49 1 1.60 1 78.30 1 Corn I 753 1 730 1 1.21 1 886.29 1 Cassava I 361 1 347 1 8.37 1 2 902.25 1
There are two basic types of cultivation systems can be distinguished according to their ecological
setting. The techniques that have been developed for each of them are the valley-floor cultivation and
the slope cultivation. In the Baliem Valley the drainage of the otherwise swampy or muddy soil is
highly developed. After the clearing and burning of the secondary vegetation, the soil is tilled. The
peoples raise small beds by deeply dug drains. Whole sections or compounds of 4 to 10 hectares are
drained in this way and divided by a system of main ditches. Apart from the control of water level, the
system allows to control soil moisture. This restores the soil fertility by using mud and green manure
Peanut
Soybean
Vegetables
Fruit Source : Agency of Food Crops and Horticulture, Jayawijaya Regency, 1999
5 60
535
8 081
586
538
519
7 758
637
1.08
1.04
7.09
1 1.40
587.77
542.00
54 987.79
72 60.34

from the ditches. Slope cultivation is done by planting on beds with or without tillage on medium to
very steep andlor stony soil. Drains run across contour lines. Therefore, erosion rates are high and the
fertility of the land drops very fast.
Wamena, the capital town of the regency can only be reached from Jayapura, the capital city of the
province by aircraft. Land transportation from Wamena to the neighboring districts is very limited.
Transportation from almost all the districts to Wamena is by small aircraft. Some villages in these
areas can only be reached from local airstrip by foot in three to four days (Table 2).
Table 2. Estimated time to reach typical villages from the location of airstrip in the District of Anggruk and Ninia, Jayawijaya Regency
3. Disaster in Remote Rural Highlands
In remote rural of Jayawijaya in the central highlands of Irian Jaya, food security is a severe
problem. The severe problem of food security is caused by longstanding very poor accessibility. In
these remote rural highlands, the productivity of sweet potato in slope cultivation is low. On the other
hand, the peoples have no habit to storage sweet potato. They harvest only an amount of sweet
potatoes to be consumed within a day after the harvest. They transplant almost everyday and harvest
the sweet potatoes also almost everyday. Such a traditional cultivation system of sweet potatoes is
critical when a prolonged dry season as well as a serious miming frost occurr.
In 1997, the dry season struck Kurima, Tiom, Ninia, Anggruk, Mapenduma, and Kenyam Districts
for about six months, longer than the usual three months a year in normal condition. As a result, the
sweet potato plants were exposed under prolonged water stress before finally dried. On the other hand,
the health status of the people was not good enough. Then, a died toll account for more than 100
peoples occurred. Table 3 shows the list of villages that had been exposed under the prolonged dry
season in 1997. It was very difficult to bring food for the people who live in such remote highlands.
Some emergency efforts were conducted to send fresh sweet potatoes, dried cassavas, and instant
noodles from outside of the regency even from Java Island. However, all of these products were not
suitable for them. Fresh sweet potatoes were damaged while dried cassavas and instant noodles were
not matched to their taste. In addition, fulfill them with these foods for a long period of time may
weaken their self-reliance on food.

Table 3. List of villages that had been exposed under the prolonged dry season in 1997. No
1
2
3
4 Anggruk 1.160 74 1 I
Village
Soba Seima Ibiroma Tangma Juarima Obolma Pasema Ukha Userern Tolikapura Samenage Hihundes Lokon Wanem Anjelma Paima Yogosem Sumo Amuma Memnowok Mogi
Balingga Kuyawage I Kuyawage 11 Oyi Nobo Gubo
Ninia Kompun Holuwon Yabi Kabianggama Langda Bomela Wanim Suntamon
District
Kurima
Tiom
Ninia
No
1 2 3 4 5 6 7 8 9 10 I1 12 13 14 15 16 17 18 19 20 21
Sub total 1 2 3 4 5 6
Sub total 1 2 3 4 5 6 7 8 9
Sub total
Population
3.713 2.172 1.064 3.285 1.566 3.039 3.701 1.309 1.813 7.936 3.586
728 2.964
690 1.819
700 495
1.241 3.973 2.632 2.301
50.727 3.040 2.581 1.784
846 1.355 1.013
10.619 4.237 6.693 3.134 2.650 2.662 1.225 2.553 1.380 1.526
26.060
Agric. land (ha)
237 136 68
210 100 195 237
84 116 508 230 47
190 44
116 45 32 79
254 168 160
3.256 195 165 114 54 87 65
680 27 1 42 8 20 1 170 170 78
1 44 88 98
1.648
Seriously damagad crop (ha)
59 34 17
105 25 48
213 20 29
126 206
11 47 39 58 ' 6 4
11 38 25 24
1.145 28
148 102 40 43 32
393 244 385 180 152 153 70
129 79 87
1.479

The most serious frost struck Kuyawage District in 1979 or 1982, in 1989, and in 1992. Kuyawage
is located at 2700 m above sea level where the fragile balance of crop can be readily observed. For the
period before 1979, no reliable information could be obtained. It appears that there were 3 or 4 frosts
in the last 1 5 years.
4. Food Security Improvement
To prevent the same disaster that occurred in 1997 in Jayawijaya Regency, Bogor Agricultural
University proposed to the Government of Indonesia an improvement of food security as a part of the
eovernment measure to overcome the food crisis. It was mainly consisted of the establishment of - Emergency Food Station (EFS) based on local resources (Fig. 1). In 1998, the proposal was accepted.
The EFS then was installed in Baliem Valley of Jayawijaya Regency in central highlands of Irian Jaya,
during the fiscal year of 199811999, The activities of the EFS were the improvement of cultivation
method, the improvement of post-harvest handling, the development of small-scale food industry, and
the improvement of distribution system.
kinship group of cultivation
Improvement of Fresh Roduct Hanfcsted Post-hawest
Sweet Handling -
potatoes Processed Product Sorting + • ( 'hip.~ - Dfying Mu.vh./lour . C'uttinp
Additional I materials 1-
. Packag~ng . Storage
STATION
De\,clopment Target Group : of Distribut~on Peoples m Irolated
Fig. 1. Overall view of establishment of the Emergency Food Station (EFS)
4 J
4.1.Improvement of cultivation method
Average productivity of sweet potatoes in Jayawijaya Regency was reported at 8.06 tonfha, while
the productivity in local experimental farm was reported at 14.4 tonlha. The regency can only be
reached from the capital of province by aircraft. Therefore, agricultural production should consider to
system VIllagrr
Development of Small-scale
Food Industry . Mixing h i n g Roasting PuckagIng Storage
Emagency Food
T
w Market

minimally using external inputs. The agricultural development strategy should be based on LEISA
(Low External Input Sustainable Agriculture).
Traditional cultivation method should not be changed drastically. A gradual improvement of
cultivation method may be important. It has been done to improve the fertility of soil by using
compost. The method to produce compost had been introduced. The farmers had been trained to rhake
compost from leafs, swine disposals, and limestone in the amount sufficient for their own land. It
needs a lot of compost to improve the fertility of soil. The soil is predicted to need the application rate
of 5 ton compostlha. Therefore, to improve the fertility of the soil in 90 ha cultivation area under EFS
supervision 450 ton of compost is needed. Fertilizers have not been introduced in this program,
because it may cause the local farmers to be dependent to external input. Any introduction of external
output should be carefully done because, at present, the regency can only be reached from another
towdcity by aircraft. A land transportation system to Jayapura has been initiated but it is not
functional yet. Careless intervention might bring the regency into continuous dependency.
On the other hand, there are some idle land covered with grass. An increase in power input should
be given to extend the cultivation area. In the idle land, the grass should be cut and the soil should be
tilled. Because of lack in local human work force, agricultural hand-tractors had been introduced. The
hand tractors have been used in limited level, especially to extend the cultivation area, which was
almost impossible to be achieved by only human work force in short time. In order to achieve a
proper use of hand-tractors, a training program for operators had been conducted. In addition, a
workshop for maintenance and small repair had been installed.
4.2. Improvement of post-harvest handling
The most critical chain in sweet potato production in the regency is the post-harvest handling. The
peoples harvest sweet potatoes whenever they need in the amount for that day or the following day. In
other words, they store sweet potatoes inside the soil in their land. This tend to be a dangerous
situation during a prolonged dry season. Therefore;' an improvement of post-harvest handling had
been done. It included cleaning, sorting, cutting, drying, milling-/grinding, packaging, and storage (Fig.
2). The main objective of these activities was to increase the quality of product to be stored in a
longer period of time.
In order to overcome a dangerous situation during prolonged dry season, emergency foods had
been introduced. The emergency food should meet the following characteristics: (1) acceptable to the
local peoples, (2) can be stored for a long period, (3) made from local agricultural product, (4) easy to
produce and distribute, (5) low production cost, (6) rich in nutrient content. Sweet potato chips, sweet
potato flour, and mashed sweet potato had been introduced as emergency foods. It should be cooked
before serving. For emergency situation, ready to consume food may be suitable. Therefore, sweet
potato cookies, sweet potato in jar, roasted sweet potato had been introduced. EFS had been equipped

with machineries for post-harvest handling: slicer, screw mill, mixer, molder, oven, fryer set, etc.
Greenhouse-effect solar drier had also been installed at the EFS.
Harvesting from fields
sorting
Fresh products
+ Storage of fresh
products
b
Skinned and cutting
I 4 4
Milling Grinding
.c .c Sweetpotato Sweetpotato
mash flour
v \/ I
I Packaging
I Distribution I
CONSUMER
Fig. 2. Schematic diagram of sweet potatoes handling in the EFS
4.3. Development of small-scale food industry
The EFS has been developed as a small-scale food industry. The sweet potato processing line
included mixing, roasting, frying, packaging, and storage (Fig. 2). The main objective of these
activities was to produce ready to consume foods from sweet potato. The EFS should operate during
emergency situation as well as in normal condition. Therefore, it should produce not only emergency

food, but also food for sale. In normal condition, the EFS should also be a small-scale food industry.
It is important to manage the EFS as a food industry in order to be a self-sufficient unit and to
socialize the products. In addition, efforts have been made to introduce products from the EFS to
consumers in Jayapura. An approach to strengthen pull factors has been performed to develop the
food industry.
4.4. Development of distribution system
Beside the EFS, emergency food storage had been built in remote villages to form a complete
distribution system. It is also proposed to open airstrips in some villages. In pre-emergency situation,
emergency food may be transported from the EFS and stored in the storage. In addition, an early
warning system is proposed to overcome food crisis in the regency as well as the province.
5. Education of ~gricultural Technology
5.1. Education of Agricultural Technology in EFS
A training facility had also been built in the EFS to facilitate training program for farmers from the
neighboring villages. The education of appropriate agricultural technology includes: (1) improvement
of cultivation method, (2) improvement of post-harvest handling, (3) production of emergency food.
Appropriate agricultural technology may be used to support rural development in order to achieve self-
reliance on food. The technology plays an important role in food production by improving quality and
quantity of products through increasing the intensity of cropping, minimizing the plant disease,
reducing the harvest loss, and increasing efficiency. However, implementation of agricultural
technology in Jayawijaya Regency should consider the cultural background of the people.
5.2. Technological and Cultural Perspectives
There are no limits to the number of perspectives that may exist in social intervention through
introduction of agricultural technology. However in Jayawijaya Regency, two perspectives: thc
technological and the cultural account for the major concern.
Underlying the technological perspective is the image of production. Therefore, this is conceivec
as a relatively mechanistic process. Social relationships are based on technological necessity. Thc
concern is economic and the primary value is efficiency. Underlying the cultural perspective is thc
image of community. Social relationships are traditional. Integrity of the culture is a primary valuc
(House and Mathison, 1983).
The technological perspective assumes that there is considerable consensus in both interests anc
values. It is assumed that everyone shares a common interest in advancing interventions and tha
everyone operated from a common frame of values. For the case in Jayawijaya Regency, because a
wars among tribes in the past, the cultural perspective assumes a more fragmented society, more valu

consensus within groups. Land is not owned individually, nor is it always clear which group of people
has a claim. There are many cases of protracted negotiations between the local government officers
and the lineage chief, which are clear evidence for the determining role of kinship groups in land use
and land allocation. The land for EFS is one of the example cases. The separate groups do not share a
value system or a common way of resolving conflicts. A common agreement is problematic since the
different groups may not understand each other. The only problem is to find how best to achieve a
solution that ensures welfare for the community. Education of agricultural technology should consider
local values in selecting the technological packages.
5.3. Partnership in Education of Agricultural Technology for Kinship Group
Parallel organizations play an important role to maintain the actors in agribusiness in a healthy
relationship. Therefore, margin distribution among actors should be reasonable. Parallel
organizations should not interfere these relationships, but it is important for them to develop incentive-
disincentive system to realize the healthy relationship. Local non-government organization (church
organization, social workers, etc.) should be included in the partnership. The schematic diagram of
the developed partnership is presented in Fig. 3.
I I I International I Partner Organization I Company
I of Farmers I I I
I I Parallel Institutions I Agribusiness Actors 1 Parallel Institutions
I I
Fig. 3. Schematic diagram of the developed partnership
6. Concluding Remarks
The EFS installment and initial operation were running well. However, because of the
prolonged diff~culties in government revenue, there was no budget for the EFS in the next fiscal year

(199912000). Efforts have been made by Bogor Agricultural University not only to maintain the EFS
in operation but also to prepare human resource to operate it in the future. The university is giving
scholarship to two local officials in the Agency of Food Crops and Horticulture, Jayawijaya Regency
to be the student in the university. A communication with Sustainable Agriculture Development
Project (SADP), funded by the Asian Development Bank (ADB) had been initiated. Fortunately, there
is Disaster Mitigation Component (DMC) activity as a part of the SADP designed to develop remote
rural highlands, which is inline with our initial concept. In 2000 fiscal year, the university is assigned
by the SADP to conduct baseline survey for the DMC locations. A comprehensive cooperation should
be done among institutions having similar program for the kinship group.
The education of agricultural technology has been successfully initiated the food security
improvement among kinship groups in the remote rural highlands of Jayawijaya Regency through the
installment of Emergency Food Station (EFS) based on local resources. An incentive system should
be develop for kinship groups to maintain their primary value in cooperation. Involvement of
university and local NGO to learn more detail about the local values leads to give a significant
contribution to maintain the sustainable operation of the EFS.
7. References
House, E.R. and S. Mathison. 1983. Educational Intervention in Handbook of Social Intervention ed
by E. Seidman. Sage Publ. Inc. California, USA.
Schneider, J., C.A. Widyastuti, and M. Djazuli. 1993. Sweet potato in the Baliem valley area, Irian
Jaya. International Potato Center, ESEAP-Region. Bogor, Indonesia.
Setiawan, B.I., A.M. Fauzi, H. Suhardiyanto, P. Hariyadi, T. Bantacut, and S. Budiyanto. 1999.
Development of Local Food Security in Jayawijaya, Irian Jaya. Fac. of Agric. Engineering and
Technology, Bogor Agric. Univ. Bogor, Indonesia.